
The Prediction of Intrapartum Fetal Compromise According to the Expected Fetal Weight
 ,
,  , ,
, , 
Abstract
1. Introduction
2. Materials and Methods
2.1. Rationale to Calculate the Growth Potential
2.2. Formulas to Calculate the Percentage of Expected Weight
3. Results
4. Discussion
5. Conclusions
Author Contributions
Funding
Institutional Review Board Statement
Informed Consent Statement
Data Availability Statement
Conflicts of Interest
Abbreviations
| GA | Gestational age. |
| IFC | Intrapartum fetal compromise. |
| EFW | Estimated fetal weight. |
| CPR | Cerebroplacental ratio. |
| UA | Umbilical artery. |
| MCA | Middle cerebral artery. |
| MoM | Multiples of the median. |
| FGR | Fetal growth restriction. |
| PI | Pulsatility index. |
| BDP | Biparietal diameter. |
| HC | Head circumference. |
| AC | Abdominal circumference. |
| FL | Femur length. |
| ExFW3t | Expected weight at the 3rd trimester. |
| %ExFW3t | Percentage of ExFW at the 3rd trimester. |
| AIC | Akaike information criteria. |
| DR | Detection rate. |
| FPR | False positive rate. |
| AUC | Area under the curve. |
References
- Smith-Bindman, R.; Chu, P.W.; Ecker, J.; Feldstein, V.A.; Filly, R.A.; Bacchetti, P. Adverse birth outcomes in relation to prenatal sonographic measurements of fetal size. J. Ultrasound Med. 2003, 22, 347–356; quiz 357–358. [Google Scholar]
- Morales-Roselló, J.; Cañada Martínez, A.J.; Scarinci, E.; Perales Marín, A. Comparison of Cerebroplacental Ratio, Intergrowth-21st Standards, Customized Growth, and Local Population References for the Prediction of Fetal Compromise: Which Is the Best Approach? Fetal Diagn. Ther. 2019, 46, 341–352. [Google Scholar] [PubMed]
- Gardosi, J.; Francis, A.; Turner, S.; Williams, M. Customized growth charts: Rationale, validation and clinical benefits. Am. J. Obstet. Gynecol. 2018, 218, S609–S618. [Google Scholar] [CrossRef] [PubMed]
- Morales-Roselló, J.; Martinez-Gonzalez, L.; Santonja-Lucas, J.J. Predicted and actual fetal weight throughout the last trimester. J. Ultrasound Med. 1997, 16, 711–717. [Google Scholar]
- Figueras, F.; Meler, E.; Iraola, A.; Eixarch, E.; Coll, O.; Figueras, J.; Francis, A.; Gratacos, E.; Gardosi, J. Customized birthweight standards for a Spanish population. Eur. J. Obstet. Gynecol. Reprod. Biol. 2008, 136, 20–24. [Google Scholar] [PubMed]
- Morales-Roselló, J.; Khalil, A.; Morlando, M.; Hervás-Marín, D.; Perales-Marín, A. Doppler reference values of the fetal vertebral and middle cerebral arteries, at 19-41 weeks gestation. J. Matern. Fetal Neonatal Med. 2015, 28, 338–343. [Google Scholar] [CrossRef]
- Acharya, G.; Wilsgaard, T.; Berntsen, G.K.R.; Maltau, J.M.; Kiserud, T. Reference ranges for serial measurements of umbilical artery Doppler indices in the second half of pregnancy. Am. J. Obstet. Gynecol. 2005, 192, 937–944. [Google Scholar] [CrossRef]
- Baschat, A.A.; Gembruch, U. The cerebroplacental Doppler ratio revisited. Ultrasound Obstet. Gynecol. 2003, 21, 124–127. [Google Scholar] [CrossRef]
- Deter, R.L. Individualized growth assessment: Evaluation of growth using each fetus as its own control. Semin. Perinatol. 2004, 28, 23–32. [Google Scholar]
- National Institute of Clinical Excellence. Intrapartum care: Care of Healthy Women and Their Babies During Labour; NICE Clinical Guideline No. 55; NICE: London, UK, 2007. [Google Scholar]
- Ayres-de-Campos, D.; Spong, C.Y.; Chandraharan, E.; FIGO Intrapartum Fetal Monitoring Expert Consensus Panel. FIGO consensus guidelines on intrapartum fetal monitoring: Cardiotocography. Int. J. Gynaecol. Obstet. 2015, 131, 13–24. [Google Scholar] [CrossRef]
- Bretscher, J.; Saling, E. pH values in the human fetus during labor. Am. J. Obstet. Gynecol. 1967, 97, 906–911. [Google Scholar]
- Deter RL, Lee W, Yeo L, Erez O, Ramamurthy U, Naik M, Romero RIndividualized growth assessment: Conceptual framExFWork and practical implementation for the evaluation of fetal growth and neonatal growth outcome. Am. J. Obstet. Gynecol. 2018, 218, S656–S678.
- Deter, R.L.; Rossavik, I.K.; Harrist, R.B. Development of individual growth curve standards for estimated fetal weight: I. Weight estimation procedure. J. Clin. Ultrasound. 1988, 16, 215–225. [Google Scholar]
- Santonja-Lucas, J.J.; Armero, C.; Martinez-Gonzalez, L. Long-term prediction of birth weight. J. Ultrasound Med. 1993, 12, 431–436. [Google Scholar]
- Morales-Roselló, J.; Santonja-Lucas, J.J. Long-term prediction of fetal weight; the proportional extrapolation method. Acta Obstet. Gynecol. Scand. 1997, 76, 609–610. [Google Scholar] [CrossRef] [PubMed]
- Morales-Roselló, J. Fetal growth is reduced in pace at the end of pregnancy. J. Ultrasound Med. 1998, 17, 712–716. [Google Scholar] [CrossRef] [PubMed]
- Morales-Roselló, J. Physiologic restriction versus genetic weight potential: Study in normal fetuses and in fetuses with intrauterine growth retardation. J. Ultrasound Med. 1999, 18, 343–347. [Google Scholar] [CrossRef]
- Coutinho, C.M.; Melchiorre, K.; Thilaganathan, B. Stillbirth at term: Does size really matter? Int. J. Gynaecol. Obstet. 2020, 150, 299–305. [Google Scholar] [CrossRef] [PubMed]
- Pretscher, J.; Schwenke, E.; Baier, F.; Kehl, S.; Schneider, M.; Stumpfe, F.M.; Schmid, M.; Beckmann, M.W.; Mayr, A.; Schild, R.; et al. Ultraschall Can Sonographic Fetal Biometry Predict Adverse Perinatal Outcome? Ultraschall Med. 2019, 40, 230–236. [Google Scholar] [CrossRef] [PubMed]
- Kamphof, H.D.; van Roekel, M.; Henrichs, J.; de Vreede, H.; Verhoeven, C.J.; Franx, A.; de Jonge, A.; Ganzevoort, W.; Gordijn, S.J. Predictive value of fetal growth trajectory from 20 weeks of gestation onwards for severe adverse perinatal outcome in low-risk population: Secondary analysis of IRIS study. Ultrasound Obstet. Gynecol. 2023, 62, 796–804. [Google Scholar] [CrossRef]
- Stubert, J.; Peschel, A.; Bolz, M.; Glass, Ä.; Gerber, B. Accuracy of immediate antepartum ultrasound estimated fetal weight and its impact on mode of delivery and outcome—A cohort analysis. BMC Pregnancy Childbirth 2018, 18, 118. [Google Scholar] [CrossRef] [PubMed]
- Morales-Roselló, J.; Loscalzo, G.; Jakaitė, V.; Perales Marín, A. The Diagnostic Ability of the Cerebroplacental Ratio for the Prediction of Adverse Perinatal Outcome and Intrapartum compromise within One Day of Delivery. Gynecol. Obstet. Investig. 2021, 86, 343–352. [Google Scholar] [CrossRef] [PubMed]
- Morales-Roselló, J.; Khalil, A.; Loscalzo, G.; Buongiorno, S.; Brik, M.; Mendoza, M.; Di Fabrizio, C.; Scarinci, E.; Salvi, S.; Lanzone, A.; et al. Cerebroplacental Ratio Prediction of Intrapartum Fetal Compromise according to the Interval to Delivery. Fetal Diagn. Ther. 2022, 49, 196–205. [Google Scholar] [CrossRef] [PubMed]
- Morales-Roselló, J.; Khalil, A. Prediction of intrapartum fetal compromise at the end of pregnancy; is Doppler, and not weight, that matters. Eur. J. Obstet. Gynecol. Reprod. Biol. 2024, 301, 102–104. [Google Scholar] [CrossRef]

| Parameter | All (N = 777) | No IFC (N = 725) | IFC (N = 52) | 2 vs. 3 * |
|---|---|---|---|---|
| Mean (SD); Median (IQR) | Mean (SD); Median (IQR) | Mean (SD); Median (IQR) | p-value | |
| Maternal age in years | 32.6 (5.1); 33 (29, 36) | 32.5 (5.2); 33 (29, 36) | 33.6 (4.3); 34 (31, 36) | 1.0000 |
| Maternal pre-pregnancy weight (kgs) | 62.3 (11.7); 60 (55, 67) | 62.3 (11.7); 60 (55, 67) | 63 (12.6); 60 (54.2, 69.5) | 0.7619 |
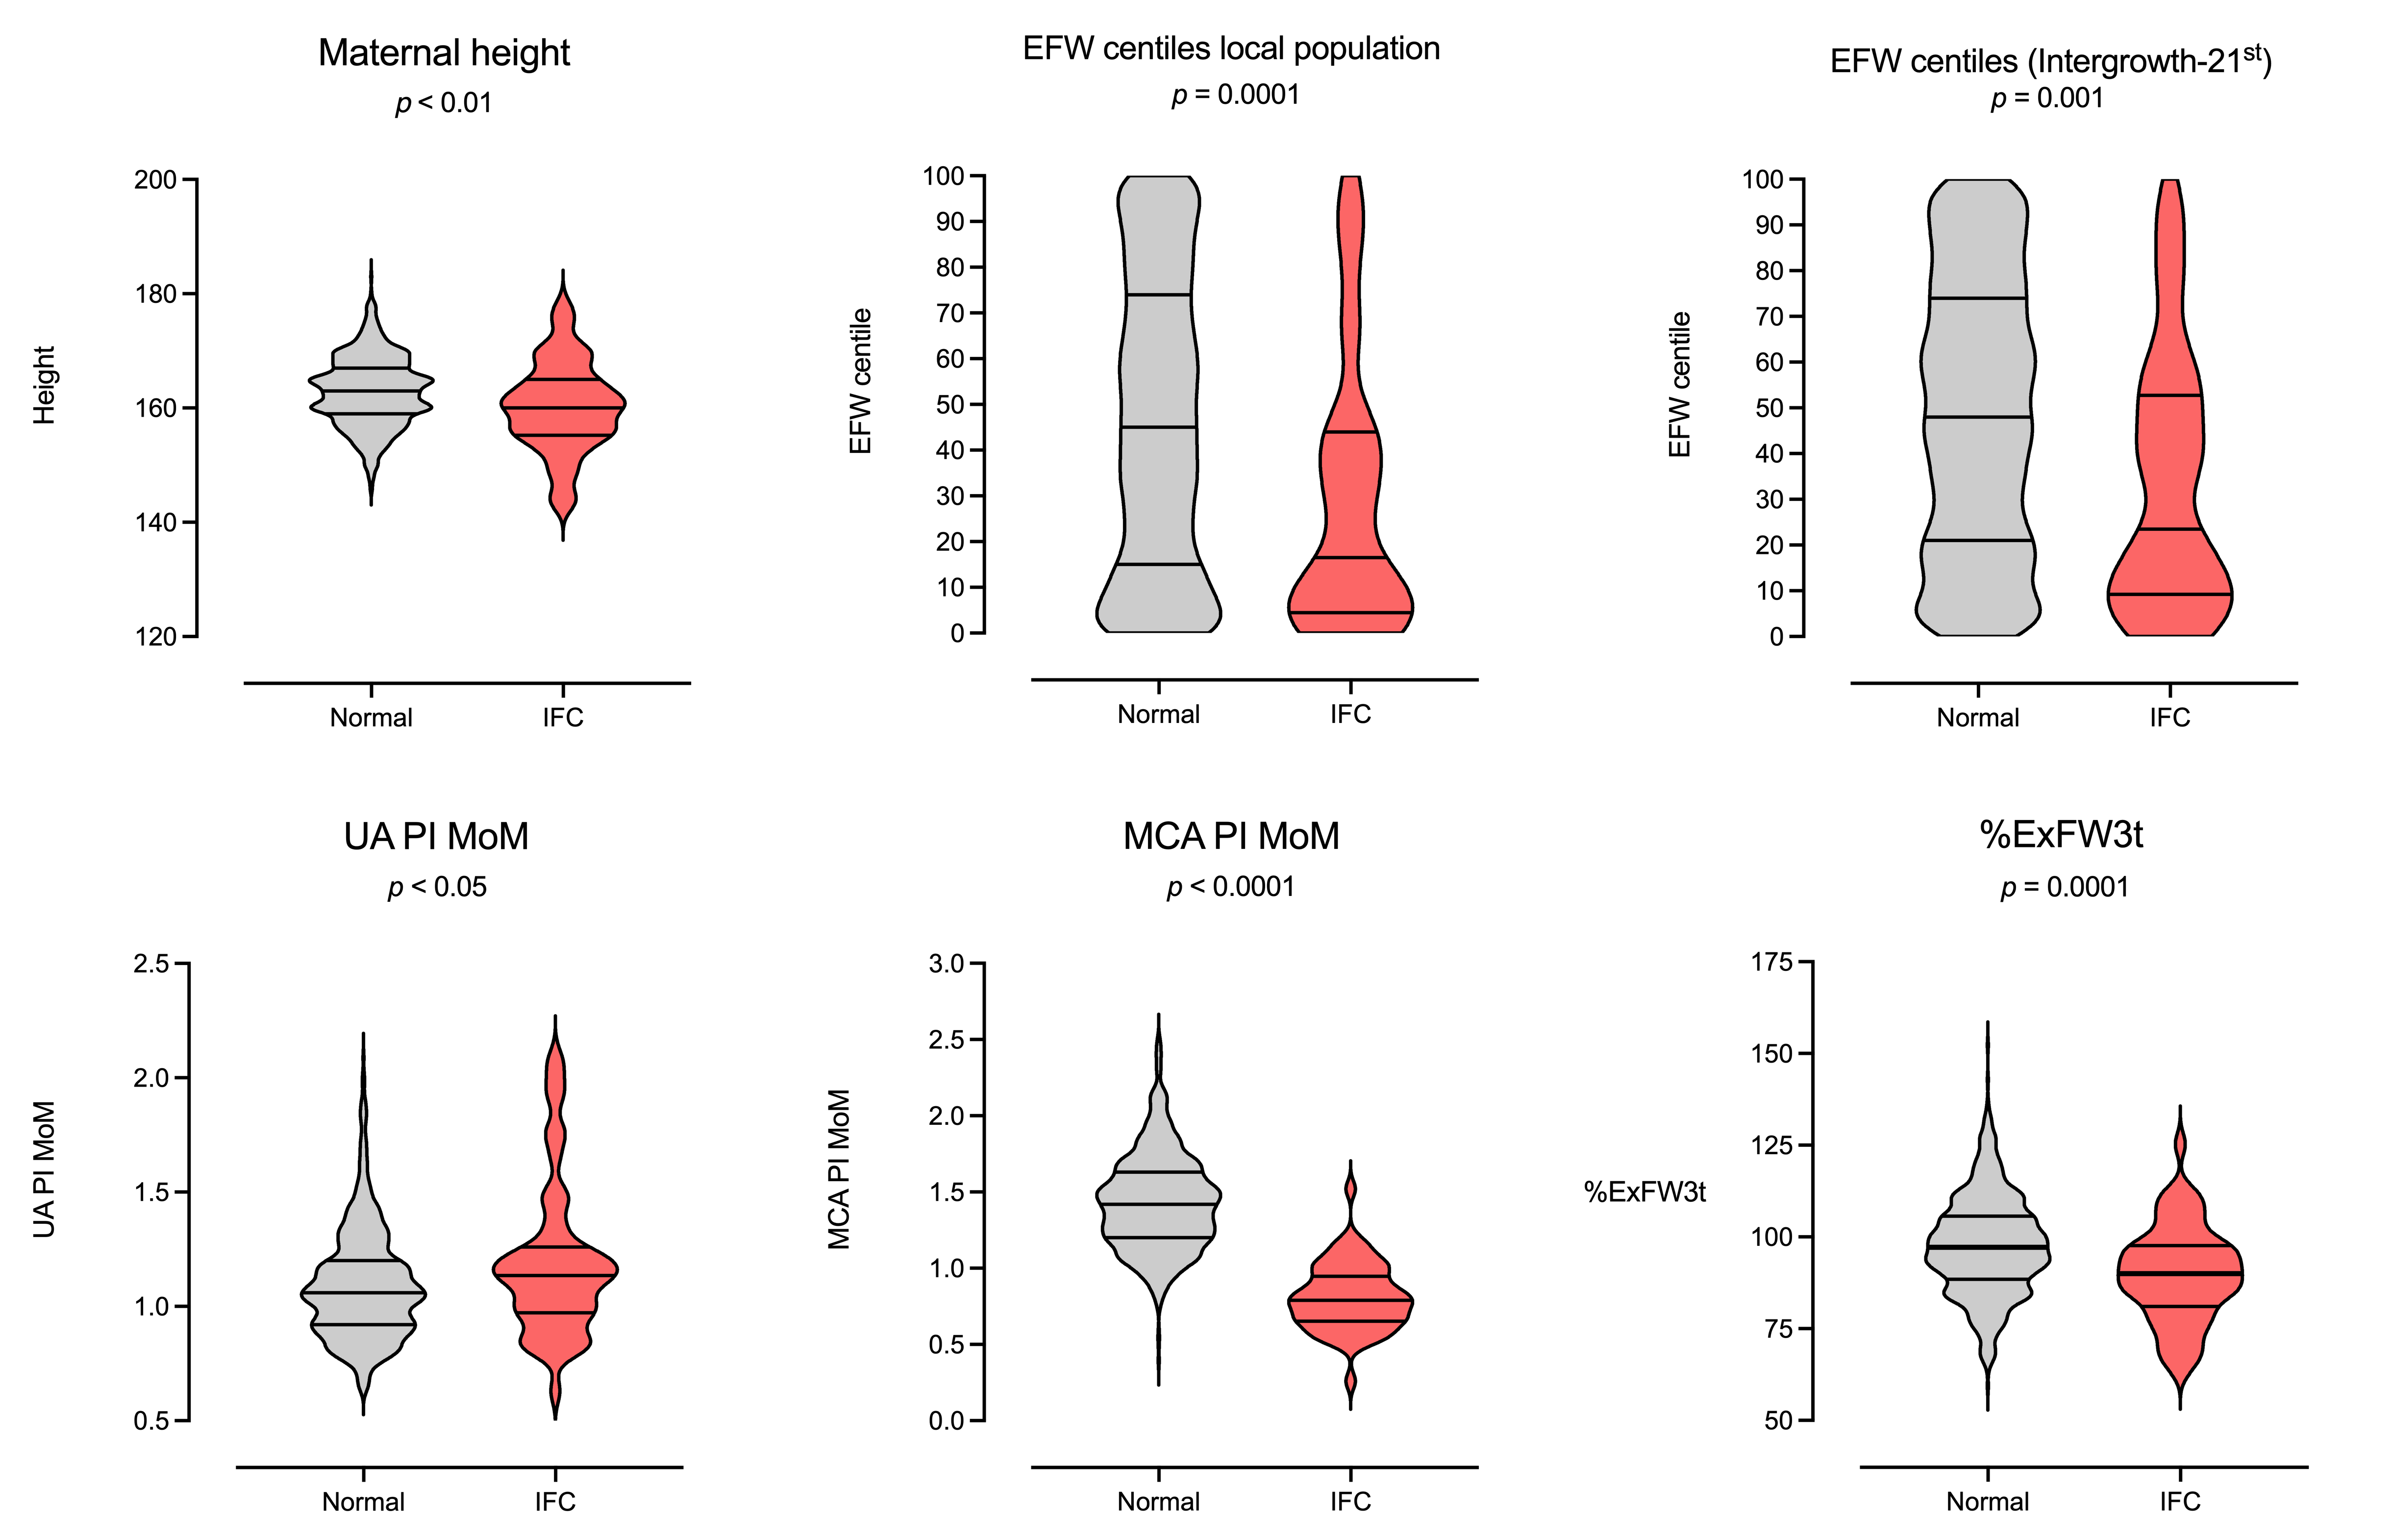
| Maternal height (cm) | 162.7 (6.2); 163 (159, 167) | 162.9 (6.0); 163 (159, 167) | 160.2 (7.8); 160 (155, 165) | 0.0083 |
| Maternal body mass index, Kg/m2 | 20.43 (0.5); 23 (21, 25) | 23.4 (4.1); 23 (21, 25) | 24.5 (5); 23 (22, 27.7) | 0.1487 |
| Gestational age at 3rd trim. scan (weeks) | 39 (1.3); 39.3 (38.1, 40) | 39 (1.2); 39.3 (38.3, 40) | 38.5 (2.1); 39.1 (37.6, 40) | 0.6245 |
| Gestational age at delivery (weeks) | 39.9 (1.28); 40.1 (39.4, 40.9) | 39.9 (1.2); 40.1 (39.4, 40.9) | 39.2 (2.2); 40.1 (38.3, 40.7) | 0.1380 |
| EFW (Hadlock), 20 weeks (grams) | 362.3 (53.2); 357 (329, 390) | 362.6 (53.84); 357 (329, 390.5) | 358.2 (43.14); 357 (335.5, 378.5) | 0.8464 |
| EFW MoM, 20 weeks | 0.97 (0.1); 0.96 (0.90, 1.03) | 0.97 (0.11); 0.96 (0.90, 1.03) | 0.96 (0.1); 0.97 (0.90, 1.03) | 0.9834 |
| UA PI MoM, 3rd trim. | 1.10 (0.25); 1.06 (0.92, 1.21) | 1.09 (0.24); 1.06 (0.92, 1.20) | 1.19 (0.33); 1.13 (0.97, 1.26) | 0.0460 |
| MCA PI MoM, 3rd trim. | 0.97 (0.22); 0.95 (0.80, 1.12) | 0.97 (0.22); 0.96 (0.82, 1.13) | 0.81 (0.21); 0.79 (0.65, 0.94) | <0.0001 |
| CPR MoM, 3rd trim. | 0.99 (0.29); 0.99 (0.78, 1.19) | 1.01 (0.29); 0.99 (0.80, 1.20) | 0.79 (0.30); 0.60 (0.75, 1.03) | <0.0001 |
| EFW (Hadlock), 3rd trim. (grams) | 3135 (532); 3166 (2847, 3498) | 3157 (518); 3182 (2874, 3512) | 2828 (624); 2908 (2420, 3346) | 1.0000 |
| EFW centile (local), 3rd trim. | 44.8 (32); 43 (14, 72.5) | 45.9 (31.9); 45 (15, 74) | 28.9 (29.2); 16.5 (4.5, 44) | <0.0001 |
| EFW centile (Intergrowth-21st), 3rd trim. | 47.4 (30); 47 (20, 73) | 48.4 (29.8); 48 (21, 74) | 33.6 (28.0); 23 (9.2, 52.7) | 0.0004 |
| ExFW3t | 3239 (418); 3233 (2992, 3498) | 3247 (411); 3235 (2999, 3503) | 3135 (497.3); 3176 (2877, 3465) | 0.1255 |
| %ExFW3t | 97 (13.6); 96.6 (87.4, 105.5) | 97.52 (13.5); 97.2 (88.4, 105.6) | 89.9 (13); 90 (81.1, 97.6) | 0.0003 |
| Interval of examination–delivery (days) | 6.4 (4); 6 (3, 9) | 6.5 (3.9); 6 (3, 9) | 5.2 (4.5); 4 (2, 8) | 0.0113 |
| Birth weight (grams) | 3213 (531); 3250 (2900, 3598) | 3239 (516); 3280 (2928, 3600) | 2852 (599); 2920 (2471, 3288) | <0.0001 |
| Birth weight centile (local) | 39.4 (31.1); 34 (10, 66) | 40.6 (31.05); 36 (11, 68) | 21.75 (26.12); 11 (3, 35.2) | <0.0001 |
| N (%) | N (%) | N (%) | ||
| Nulliparity | 411 (52.9) | 378 (52.1) | 33 (63.5) | 0.1498 |
| Smoking | 110 (14.1) | 105 (14.5) | 5 (9.6) | 0.4135 |
| Male sex | 389 (50.1) | 359 (49.5) | 30 (57.7) | 0.0066 |
| Type of labor onset | ||||
| Induction of labor | 393 (50.6) | 348 (48) | 45 (86.5) | <0.0001 |
| Spontaneous onset of labor | 384 (49.4) | 377 (52) | 7 (13.4) | <0.0001 |
| Apgar < 7 at 5 min | 4 (0.5) | 3 (0.4) | 1 (1.9) | 0.2424 |
| Arterial pH < 7.10 | 18 (2.3) | 12 (1.6) | 6 (11.5) | 0.0007 |
| Mode of birth | ||||
| Cesarean section (failure to progress) | 92 (11.8) | 92 (12.7) | 0 (0) | 0.0027 |
| Cesarean section (abnormal CTG) | 52 (6.7) | 0 (0) | 52 (100) | <0.0001 |
| Assisted vaginal delivery | 174 (22.4) | 174 (24) | 0 (0) | <0.0001 |
| Spontaneous vaginal delivery | 459 (59.1) | 459 (63.3) | 0 (0) | <0.0001 |
| Neonatal transfer | ||||
| Maternal ward | 738 (95%) | 698 (96.3) | 40 (77) | <0.0001 |
| Neonatal ward | 38 (4.9) | 27 (3.7) | 11 (23) | <0.0001 |
| Neonatal intensive care unit (NICU) | 1 (0.1) | 0 (0) | 1 (0) | 0.0669 |
| Univariable Model | Estimate | OR | 95% CI | p-Value |
|---|---|---|---|---|
| A—maternal parameters | ||||
| Maternal age | ||||
| Maternal age | 0.04212 | 1.04301 | [0.9848, 1.1047] | 0.1507 |
| Intercept | −4.02707 | |||
| DR. = 4% for a FPR of 5% and 10% for a FPR of 10%, AUC = 0.56, 95% CI [0.49, 0.63], p = 0.1566, AIC = 383.6 | ||||
| Nulliparity | ||||
| Nulliparity | 0.46650 | 1.5944 | [0.8901, 2.8561] | 0.1168 |
| Intercept | −2.90489 | |||
| DR = 0% for a FPR of 5% and 0% for a FPR of 10%, AUC = 0.56, 95% CI [0.48, 0.64], p = 0.1722, AIC = 383.2 | ||||
| Maternal height | ||||
| Maternal height | −0.07083 | 0.9316 | [0.8894, 0.9758] | 0.0027 |
| Intercept | 8.80824 | |||
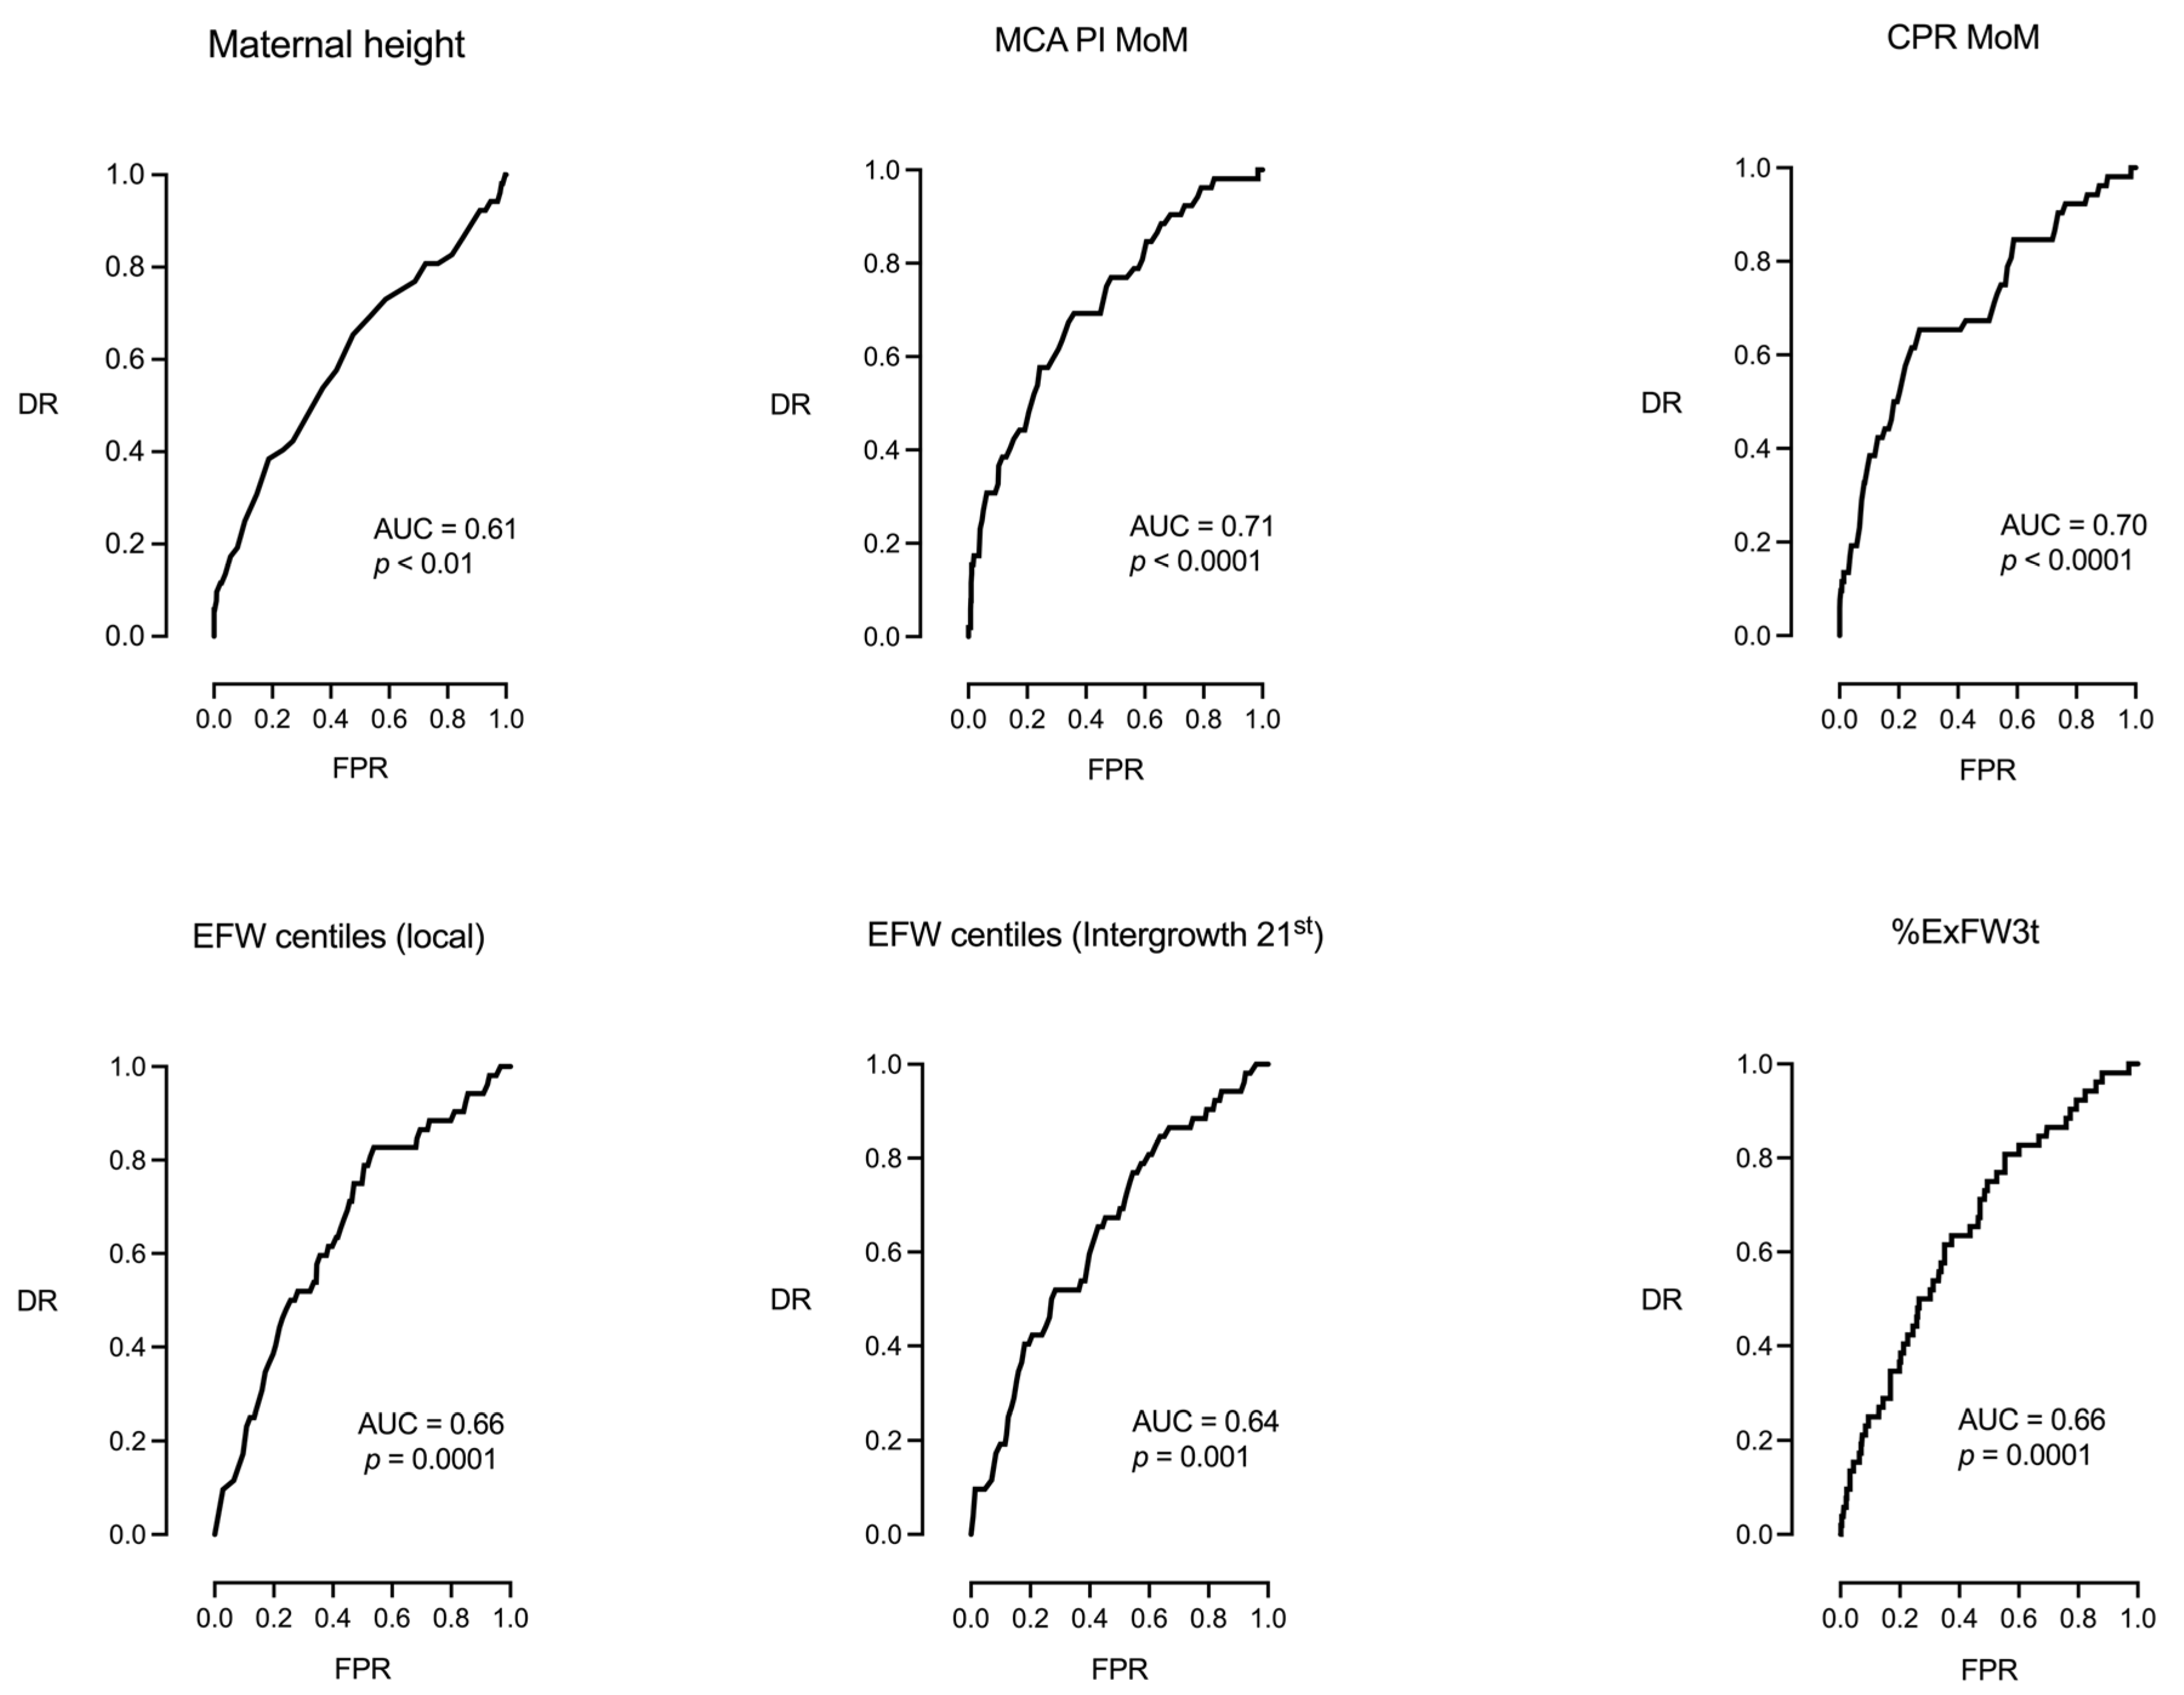
| DR = 17% for a FPR of 5% and 25% for a FPR of 10%, AUC = 0.61, 95% CI [0.52, 0.70], p = 0.0087, AIC = 376.6 | ||||
| Maternal weight | ||||
| Maternal weight | 0.0049 | 1.0049 | [0.9818, 1.0285] | 0.6818 |
| Intercept | −2.9392 | |||
| DR = 0% for a FPR of 5% and 0% for a FPR of 10%, AUC = 0.51, 95% CI [0.42, 0.60], p = 0.7613, AIC = 385.5 | ||||
| Smoking | ||||
| Smoking | −0.4649 | 0.62817 | [0.2442, 1.6160] | 0.3348 |
| Intercept | −2.5796 | |||
| DR = 0% for a FPR of 5% and 0% for a FPR of 10%, AUC = 0.52, 95% CI [0.44, 0.60], p = 0.5573, AIC = 384.7 | ||||
| B—fetal parameters | ||||
| B1—fetal sex | ||||
| Fetal sex | ||||
| Fetal sex | 0.3295 | 1.390 | [0.7869, 2.4561] | 0.2565 |
| Intercept | −2.812 | |||
| DR = 0% for a FPR of 5% and 0% for a FPR of 10%, AUC = 0.54, 95% CI [0.46, 0.62], p = NS, AIC = 384.4 | ||||
| B2—fetal hemodynamics (fetal Doppler) | ||||
| MCA PI MoM | ||||
| MCA PI MoM | −3.9666 | 0.0189 | [0.0041, 0.0863] | <0.0001 |
| Intercept | 0.8939 | |||
| DR = 27% for a FPR of 5% and 33% for a FPR of 10%, AUC = 0.71, 95% CI [0.63, 0.79], p < 0.0001, AIC = 355.3 | ||||
| UA PI MoM | ||||
| UA PI MoM | 1.40944 | 4.09368 | 1.51728, 11.0449 | 0.0054 |
| Intercept | −4.24007 | |||
| DR = 13.5% for a FPR of 5% and 19.2% for a FPR of 10%, AUC = 0.58, 95% CI [0.50, 0.67], p = 0.046, AIC = 378.5 | ||||
| CPR MoM | ||||
| CPR MoM | −2.874 | 0.0563 | [0.0181, 0.1756] | <0.0001 |
| Intercept | 0.0514 | |||
| DR = 19% for a FPR of 5% and 38% for a FPR of 10%, AUC = 0.70, 95% CI [0.62, 0.78], p < 0.0001, AIC = 357.4 | ||||
| B3—fetal weight centiles | ||||
| EFW centiles (local population) | ||||
| EFW centiles (local population) | −0.01851 | 0.9817 | [0.9717, 0.9916] | 0.0003 |
| Intercept | −1.950 | |||
| DR = 11% for a FPR of 5% and 23% for a FPR of 10%, AUC = 0.66, 95% CI [0.58, 0.73], p = 0.0001, AIC = 371.1 | ||||
| EFW centiles (Intergrowth 21st) | ||||
| EFW centiles (Intergrowth 21st) | −0.0178 | 0.9824 | [0.9722, 0.9926] | 0.0007 |
| Intercept | −1.9094 | |||
| DR = 10% for a FPR of 5% and 19% for a FPR of 10%, AUC = 0.64, 95% CI [0.57, 0.72], p = 0.0004, AIC = 373.3 | ||||
| B4—Percentage of expected weight achieved at the third trimester scan | ||||
| Percentage of expected weight achieved at third trimester | ||||
| %ExFW3t | −0.04431 | 0.9567 | [0.9353, 0.9784] | 0.0001 |
| Intercept | 1.515 | |||
| DR = 15% for a FPR of 5% and 25% for a FPR of 10%, AUC = 0.66, 95% CI [0.58, 0.73], p = 0.0001, AIC = 369.8 | ||||
| Multivariable Model | Estimate | OR | 95% CI | p-Value |
|---|---|---|---|---|
| Model 1: MCA PI MoM + EFW centile (local) | ||||
| MCA PI MoM | −3.555 | 0.0286 | [0.0058, 0.1271] | <0.0001 |
| EFW centile (local) | −0.01402 | 0.9861 | [0.9755, 0.9960] | <0.0077 |
| Intercept | 1.054 | |||
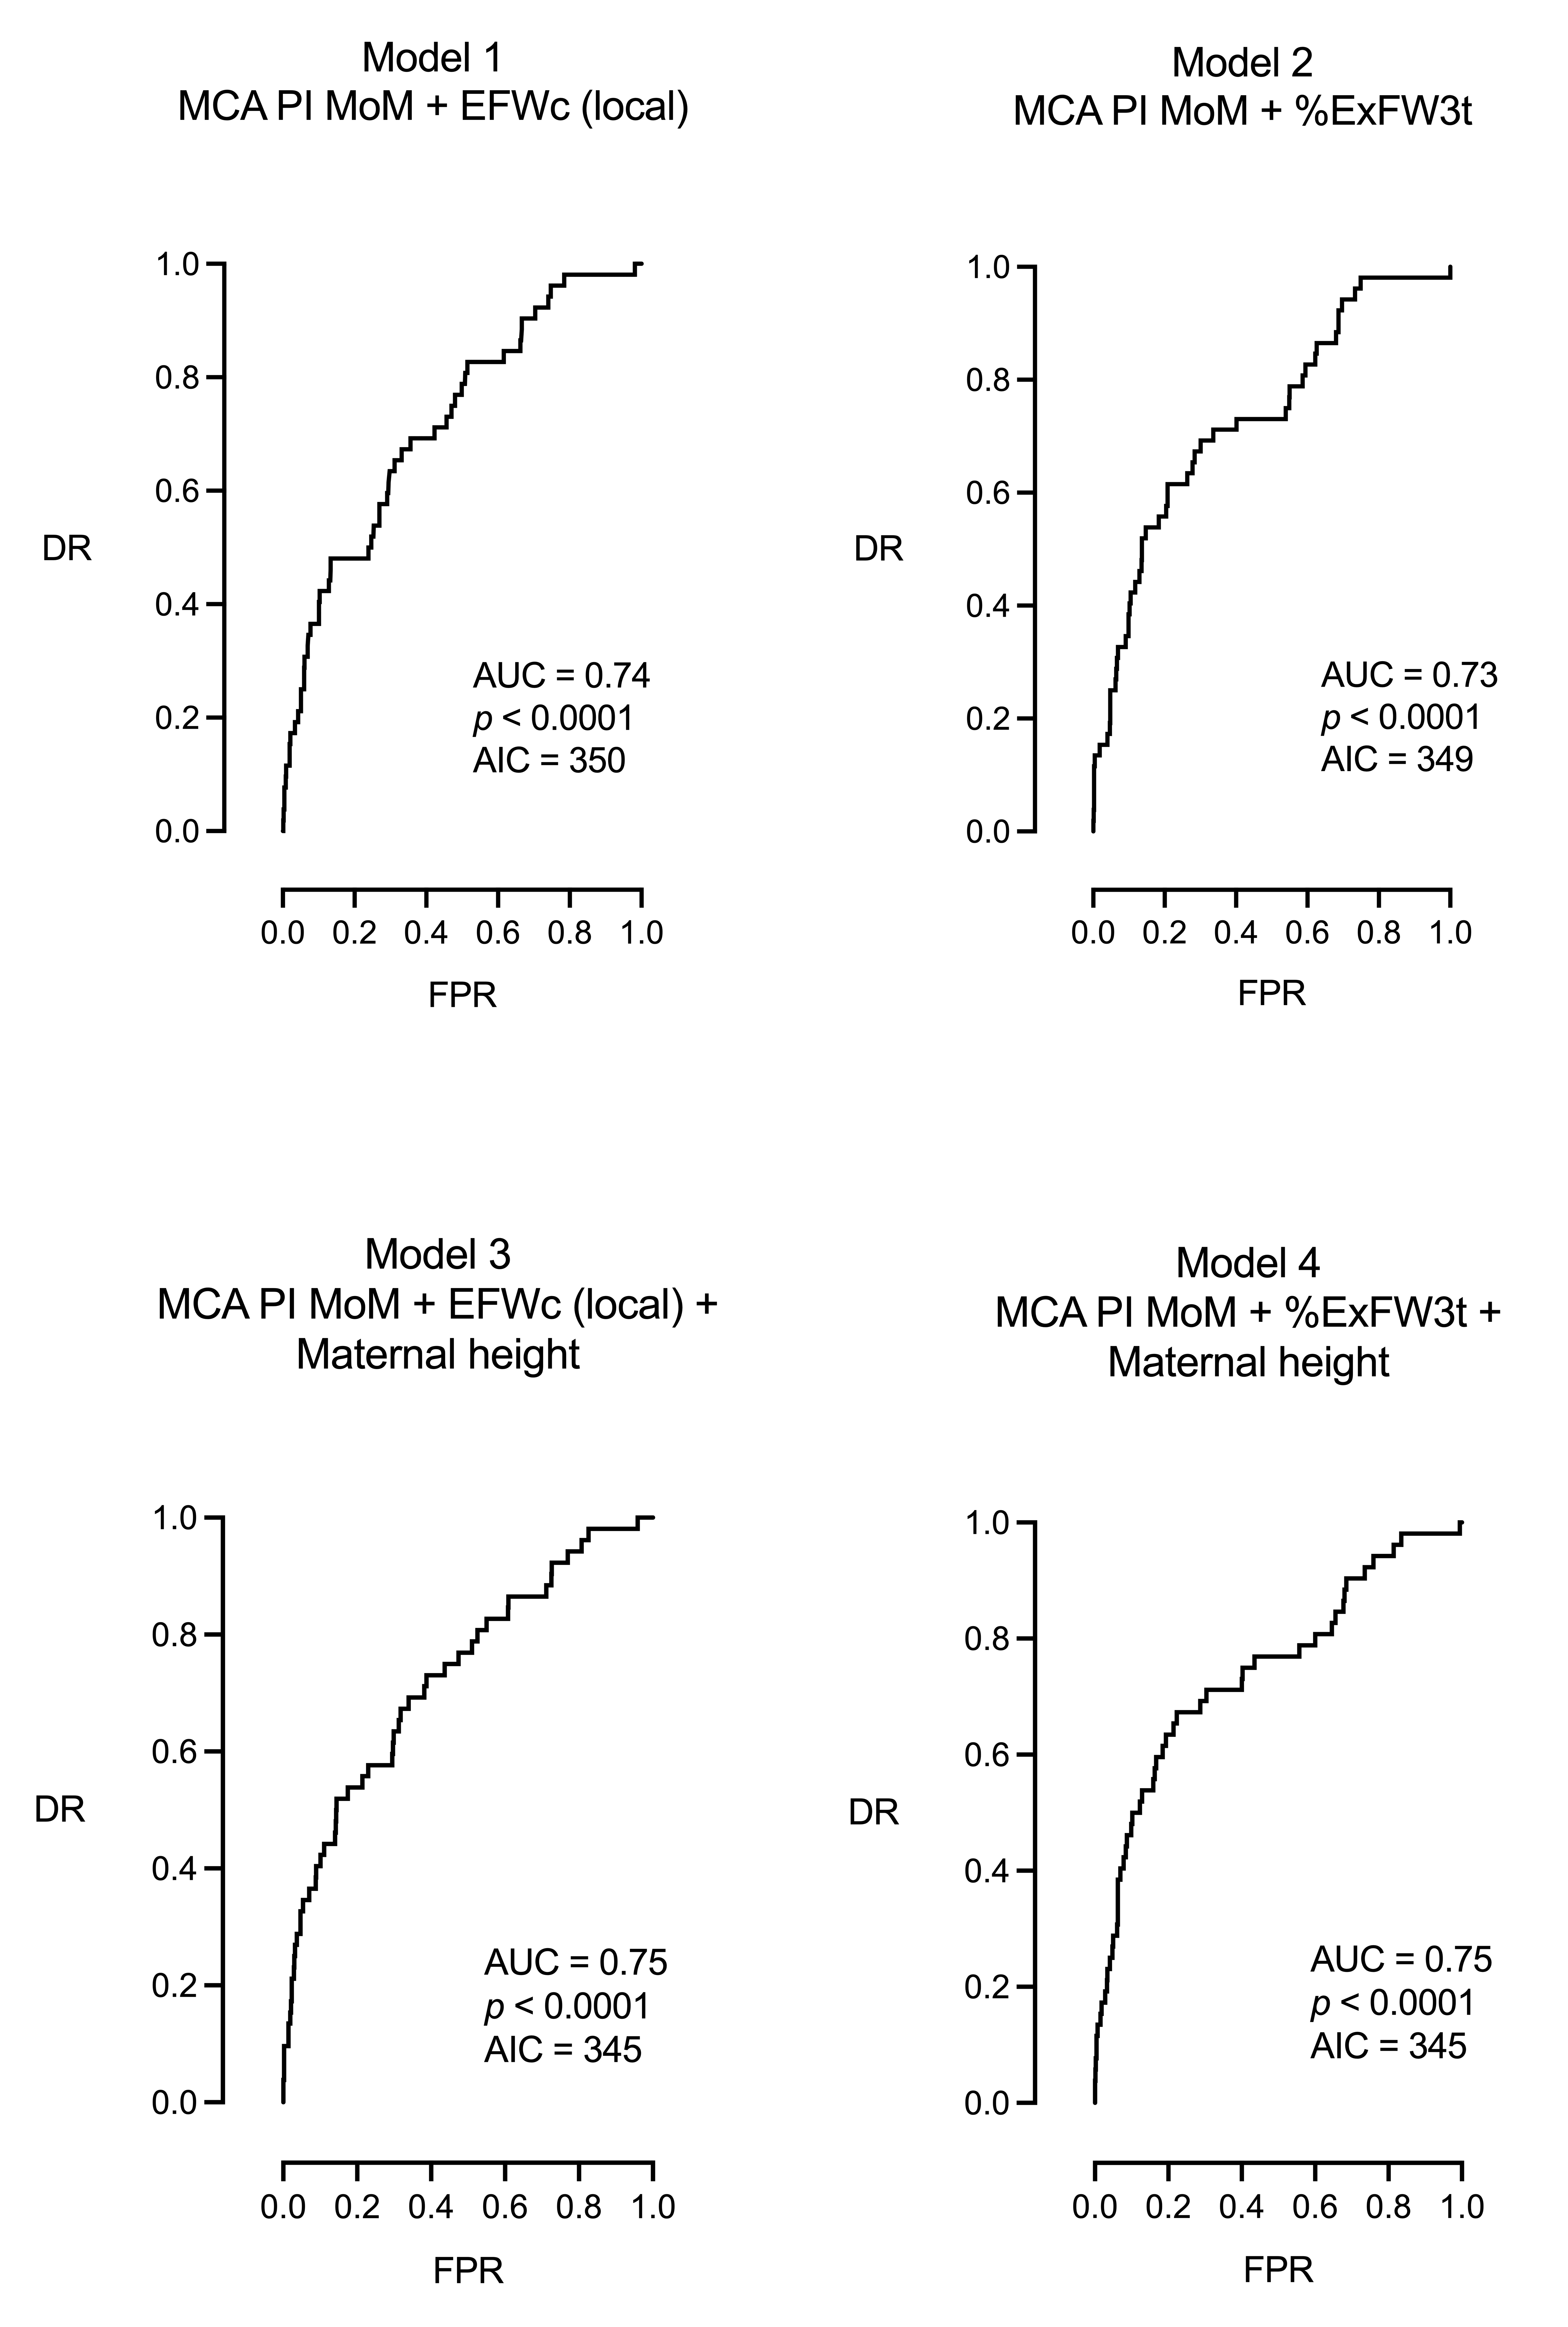
| DR = 23% for a FPR of 5% and 29% for a FPR of 10%, AUC = 0.74, 95% CI [0.67, 0.81], p < 0.0001, AIC = 350 | ||||
| Model 2: MCA PI MoM + %ExFW3t | ||||
| MCA PI MoM | −3.491 | 0.0305 | [0.0062, 0.1300] | <0.0001 |
| % EW3t | −0.0331 | 0.9675 | [0.9447, 0.9899] | 0.0008 |
| Intercept | 3.578 | |||
| DR = 25% for a FPR of 5% and 38% for a FPR of 10%, AUC = 0.73, 95% CI [0.66, 0.81], p < 0.0001, AIC = 349 | ||||
| Model 3: MCA PI MoM + EFW centile (local) + maternal height | ||||
| MCA PI MoM | −3.556 | 0.0285 | [0.0058, 0.1259] | <0.0001 |
| EFW centile (local) | −0.0128 | 0.9872 | [0.9766, 0.9972] | 0.0152 |
| Maternal height | −0.0587 | 0.9430 | [0.8993, 0.9878] | 0.0139 |
| Intercept | 10.5 | |||
| DR = 30% for a FPR of 5% and 40% for a FPR of 10%, AUC = 0.75, 95% CI [0.68, 0.82], p < 0.0001, AIC = 345 | ||||
| Model 4: MCA PI MoM + %ExFW3t + maternal height | ||||
| MCA PI MoM | −3.533 | 0.02921 | [0.0060, 0.1271] | <0.0001 |
| %ExFW3t | −0.02645 | 0.9739 | [0.9536, 0.9938] | 0.0011 |
| Maternal height | −0.06240 | 0.9395 | [0.8959, 0.9843] | 0.0086 |
| Intercept | 13.32 | |||
| DR = 27% for a FPR of 5% and 48% for a FPR of 10%, AUC = 0.75, 95% CI [0.67, 0.82], p < 0.0001, AIC = 345 | ||||
| Multivariable Model | Estimate | OR | 95% CI | p-Value |
|---|---|---|---|---|
| Model 5: CPR MoM + EFW centile (local) | ||||
| CPR MoM | −2.4357 | 0.0875 | [0.0266, 0.2873] | <0.0001 |
| EFW centile (local) | −0.0113 | 0.9888 | [0.9783, 0.9994] | <0.0382 |
| Intercept | −0.0287 | |||
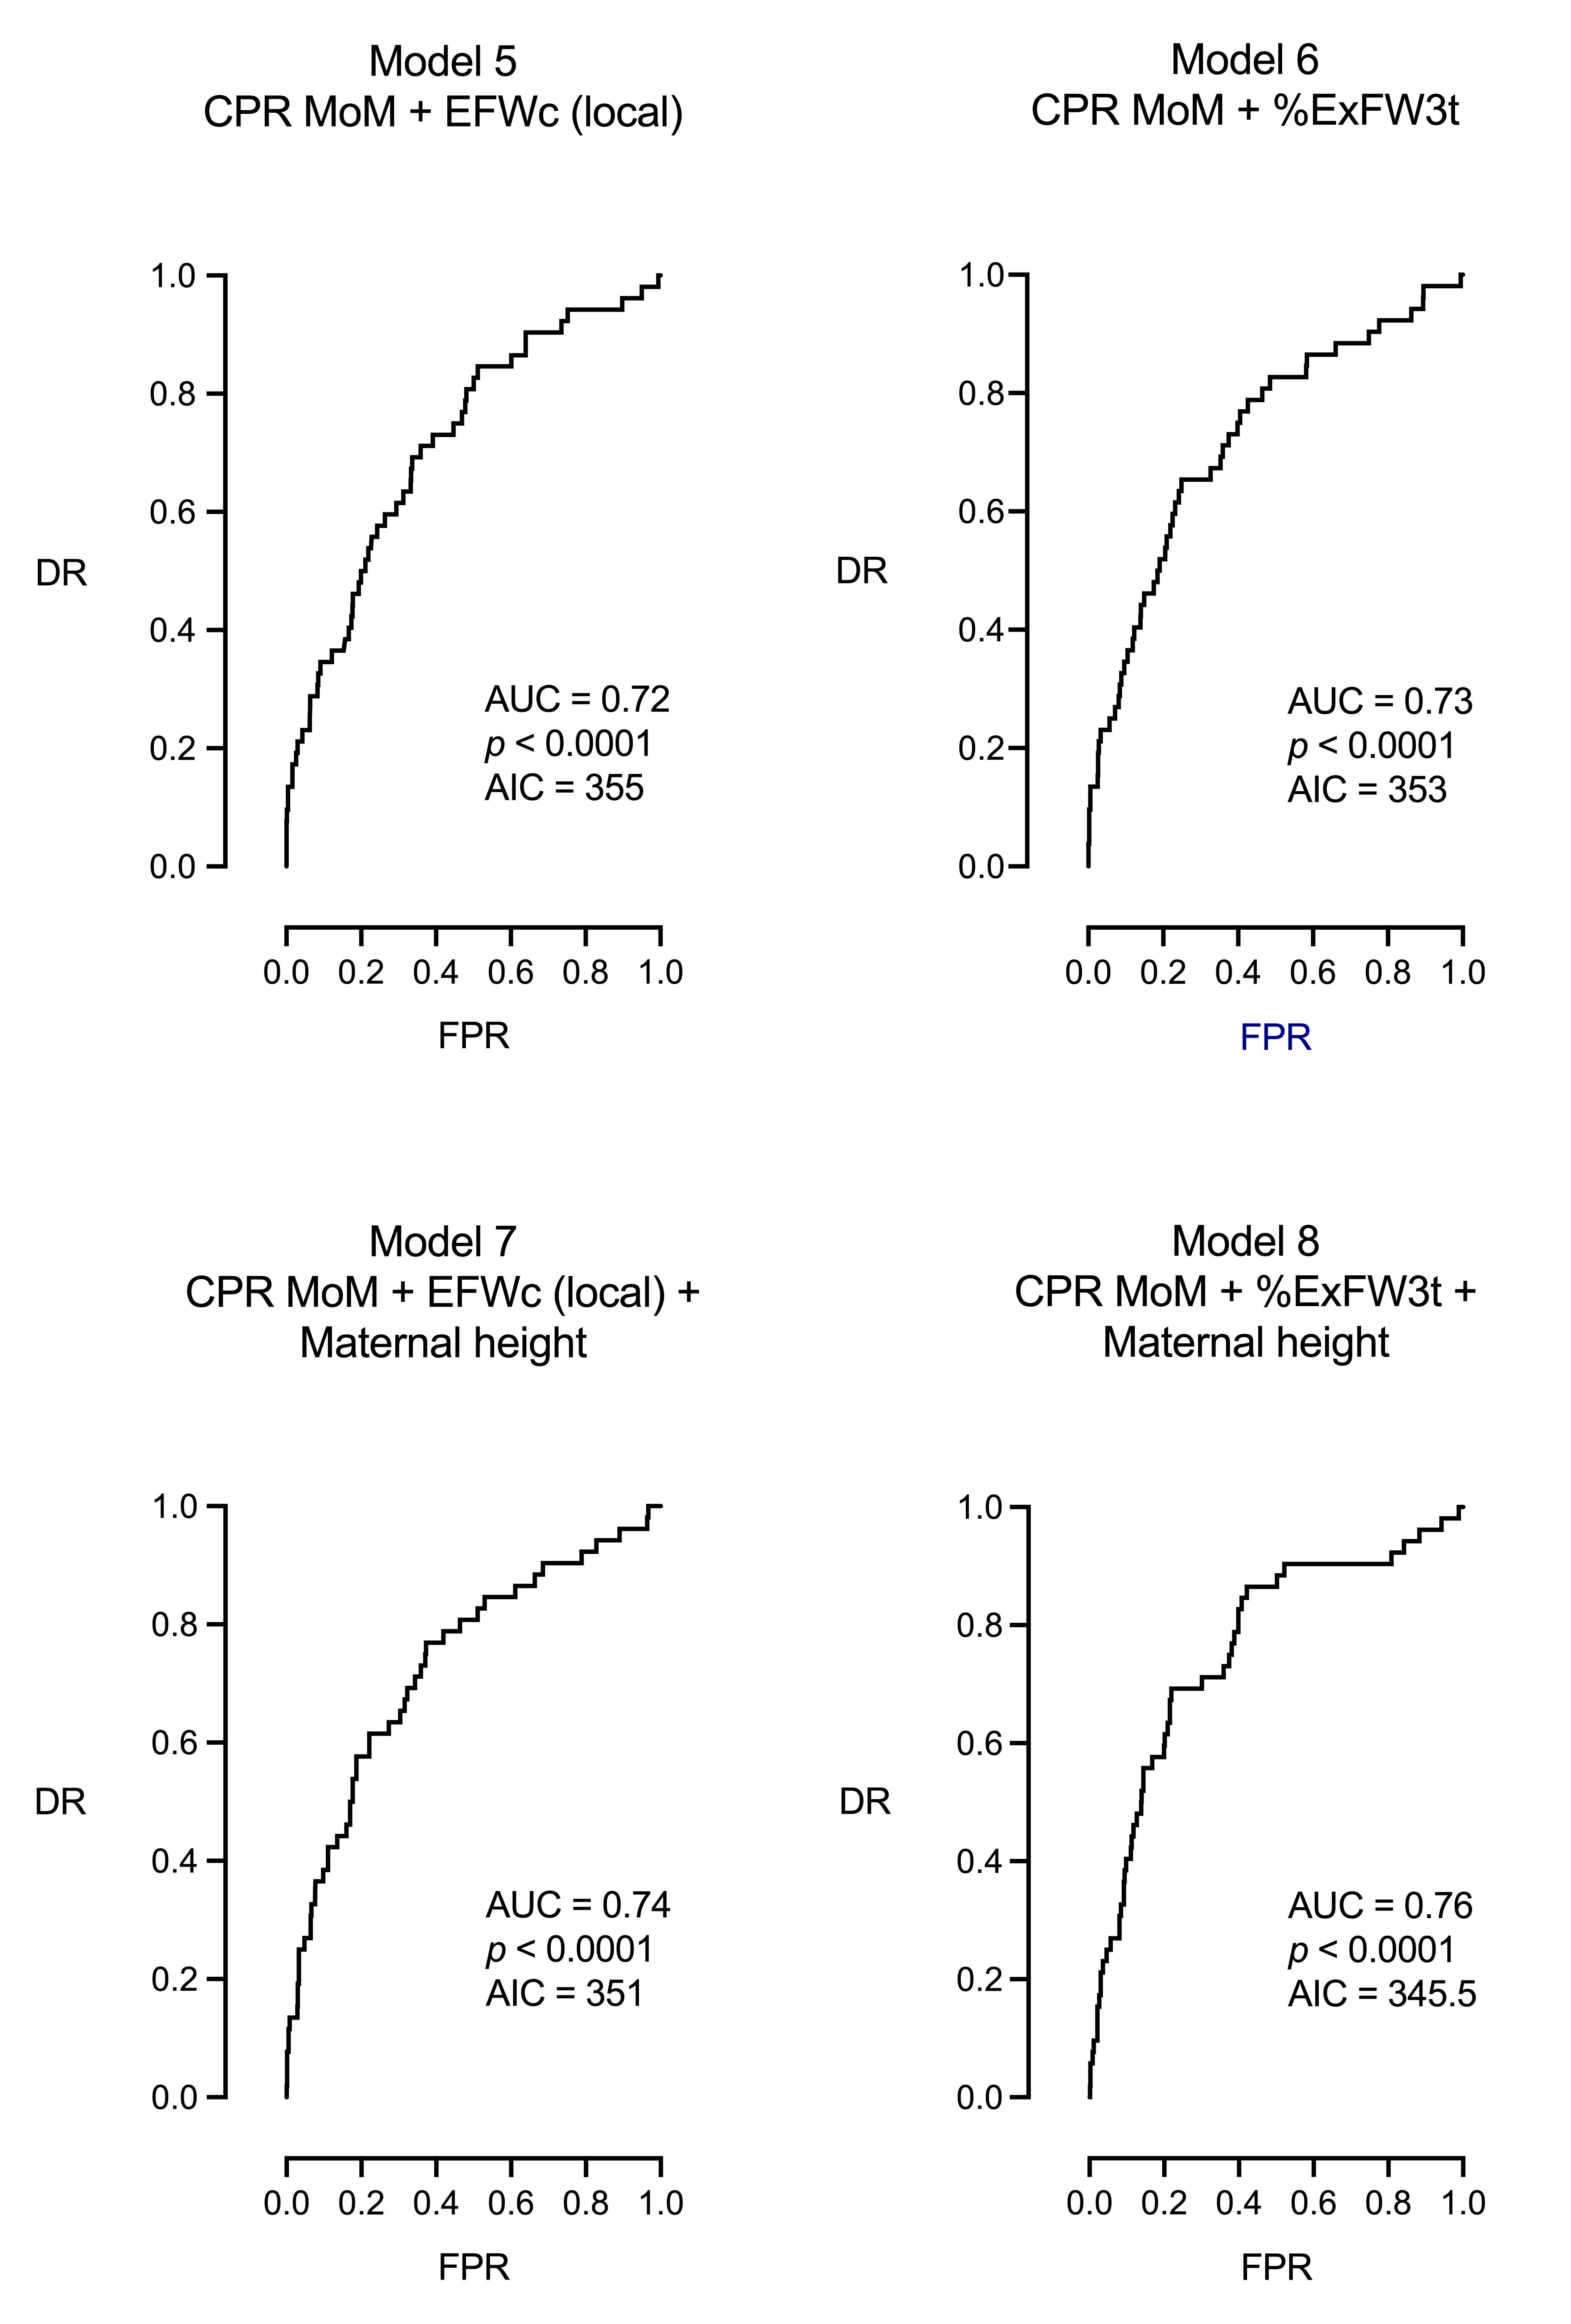
| DR = 23% for a FPR of 5% and 35% for a FPR of 10%, AUC = 0.72, 95% CI [0.64, 0.79], p < 0.0001, AIC = 355 | ||||
| Model 6: CPR MoM + %ExFW3t | ||||
| CPR MoM | −2.3532 | 0.0950 | [0.0295, 0.3064] | <0.0001 |
| % EW3t | −0.0369 | 0.9637 | [0.9409, 0.9871] | 0.0025 |
| Intercept | 2.8684 | |||
| DR = 23% for a FPR of 5% and 35% for a FPR of 10%, AUC = 0.73, 95% CI [0.65, 0.80], p < 0.0001, AIC = 353 | ||||
| Model 7: CPR MoM + EFW centile (local) + maternal height | ||||
| CPR MoM | −2.4285 | 0.0882 | [0.0270, 0.2882] | <0.0001 |
| EFW centile (local) | −0.0098 | 0.9902 | [0.0054, 0.0725] | 0.0725 |
| Maternal height | −0.0564 | 0.9452 | [0.0238, 0.0177] | 0.0177 |
| Intercept | 9.0201 | |||
| DR = 27% for a FPR of 5% and 38% for a FPR of 10%, AUC = 0.74, 95% CI [0.66, 0.81], p < 0.0001, AIC = 351 | ||||
| Model 8: CPR MoM + %ExFW3t + Maternal height | ||||
| CPR MoM | −2.3992 | 0.0908 | [0.0283, 0.2914] | <0.0001 |
| %ExFW3t | −0.0275 | 0.9728 | [0.9504, 0.9957] | 0.0204 |
| Maternal height | −0.0574 | 0.9442 | [0.9014, 0.9891] | 0.0154 |
| Intercept | 11.3775 | |||
| DR = 25% for a FPR of 5% and 40% for a FPR of 10%, AUC = 0.76, 95% CI [0.69, 0.83], p < 0.0001, AIC = 345.5 | ||||
| Models | AUC | AIC | DR for a FPR of 5% | DR for a FPR of 10% | p-Value |
|---|---|---|---|---|---|
| Univariable models | |||||
| Maternal weight | 0.51 | 385.5 | 0 | 0 | 0.7613 |
| Smoking | 0.52 | 384.7 | 0 | 0 | 0.5573 |
| Fetal sex | 0.54 | 384.4 | 0 | 0 | 0.3243 |
| Maternal age | 0.56 | 383.6 | 4 | 10 | 0.1566 |
| Nulliparity | 0.56 | 383.2 | 0 | 0 | 0.1722 |
| UA PI MoM | 0.58 | 378.5 | 13.5 | 19.2 | 0.0460 |
| Maternal height | 0.61 | 376.6 | 17 | 25 | 0.0087 |
| EFW centiles (EFWc), 21st intergrowth | 0.64 | 373.3 | 10 | 19 | 0.0007 |
| EFW centiles (EFWc), local population | 0.66 | 371.1 | 11 | 23 | 0.0003 |
| Percentage of expected weight achieved at third trimester (%ExFW3t) | 0.66 | 369.8 | 15 | 25 | 0.0001 |
| CPR MoM | 0.70 | 357.4 | 19 | 38 | <0.0001 |
| MCA PI MoM | 0.71 | 355.3 | 27 | 33 | <0.0001 |
| Multivariable models | |||||
| Model 5: CPR MoM + EFWc, local population | 0.72 | 355 | 23 | 35 | < 0.0001 |
| Model 6: CPR MoM + %ExFW3t | 0.73 | 353 | 23 | 35 | < 0.0001 |
| Model 7: CPR MoM + EFWc, local population + maternal height | 0.74 | 351 | 27 | 38 | < 0.0001 |
| Model 1: MCA PI MoM + EFWc, local population | 0.74 | 350 | 23 | 29 | <0.0001 |
| Model 2: MCA PI MoM + %ExFW3t | 0.73 | 349 | 25 | 38 | <0.0001 |
| Model 8: CPR MoM + %ExFW3t + maternal height | 0.76 | 345.5 | 25 | 40 | < 0.0001 |
| Model 3: MCA PI MoM + EFWc, local population + maternal height | 0.75 | 345 | 30 | 40 | <0.0001 |
| Model 4: MCA PI MoM + %ExFW3t + maternal height | 0.75 | 345 | 27 | 48 | <0.0001 |
Disclaimer/Publisher’s Note: The statements, opinions and data contained in all publications are solely those of the individual author(s) and contributor(s) and not of MDPI and/or the editor(s). MDPI and/or the editor(s) disclaim responsibility for any injury to people or property resulting from any ideas, methods, instructions or products referred to in the content. |
© 2025 by the authors. Licensee MDPI, Basel, Switzerland. This article is an open access article distributed under the terms and conditions of the Creative Commons Attribution (CC BY) license (https://creativecommons.org/licenses/by/4.0/).
Share and Cite
Morales-Roselló, J.; Martínez-Varea, A.; Novillo-Del Álamo, B.; Sánchez-Arco, C.; Khalil, A. The Prediction of Intrapartum Fetal Compromise According to the Expected Fetal Weight. J. Pers. Med. 2025, 15, 140. https://doi.org/10.3390/jpm15040140
Morales-Roselló J, Martínez-Varea A, Novillo-Del Álamo B, Sánchez-Arco C, Khalil A. The Prediction of Intrapartum Fetal Compromise According to the Expected Fetal Weight. Journal of Personalized Medicine. 2025; 15(4):140. https://doi.org/10.3390/jpm15040140
Chicago/Turabian StyleMorales-Roselló, José, Alicia Martínez-Varea, Blanca Novillo-Del Álamo, Carmen Sánchez-Arco, and Asma Khalil. 2025. "The Prediction of Intrapartum Fetal Compromise According to the Expected Fetal Weight" Journal of Personalized Medicine 15, no. 4: 140. https://doi.org/10.3390/jpm15040140
APA StyleMorales-Roselló, J., Martínez-Varea, A., Novillo-Del Álamo, B., Sánchez-Arco, C., & Khalil, A. (2025). The Prediction of Intrapartum Fetal Compromise According to the Expected Fetal Weight. Journal of Personalized Medicine, 15(4), 140. https://doi.org/10.3390/jpm15040140