
Reference Values for the German Version of the Quality of Life after Brain Injury in Children and Adolescents (QOLIBRI-KID/ADO) from a General Population Sample
 , , ,
, , , 
Abstract
1. Introduction
2. Materials and Methods
2.1. Study Design
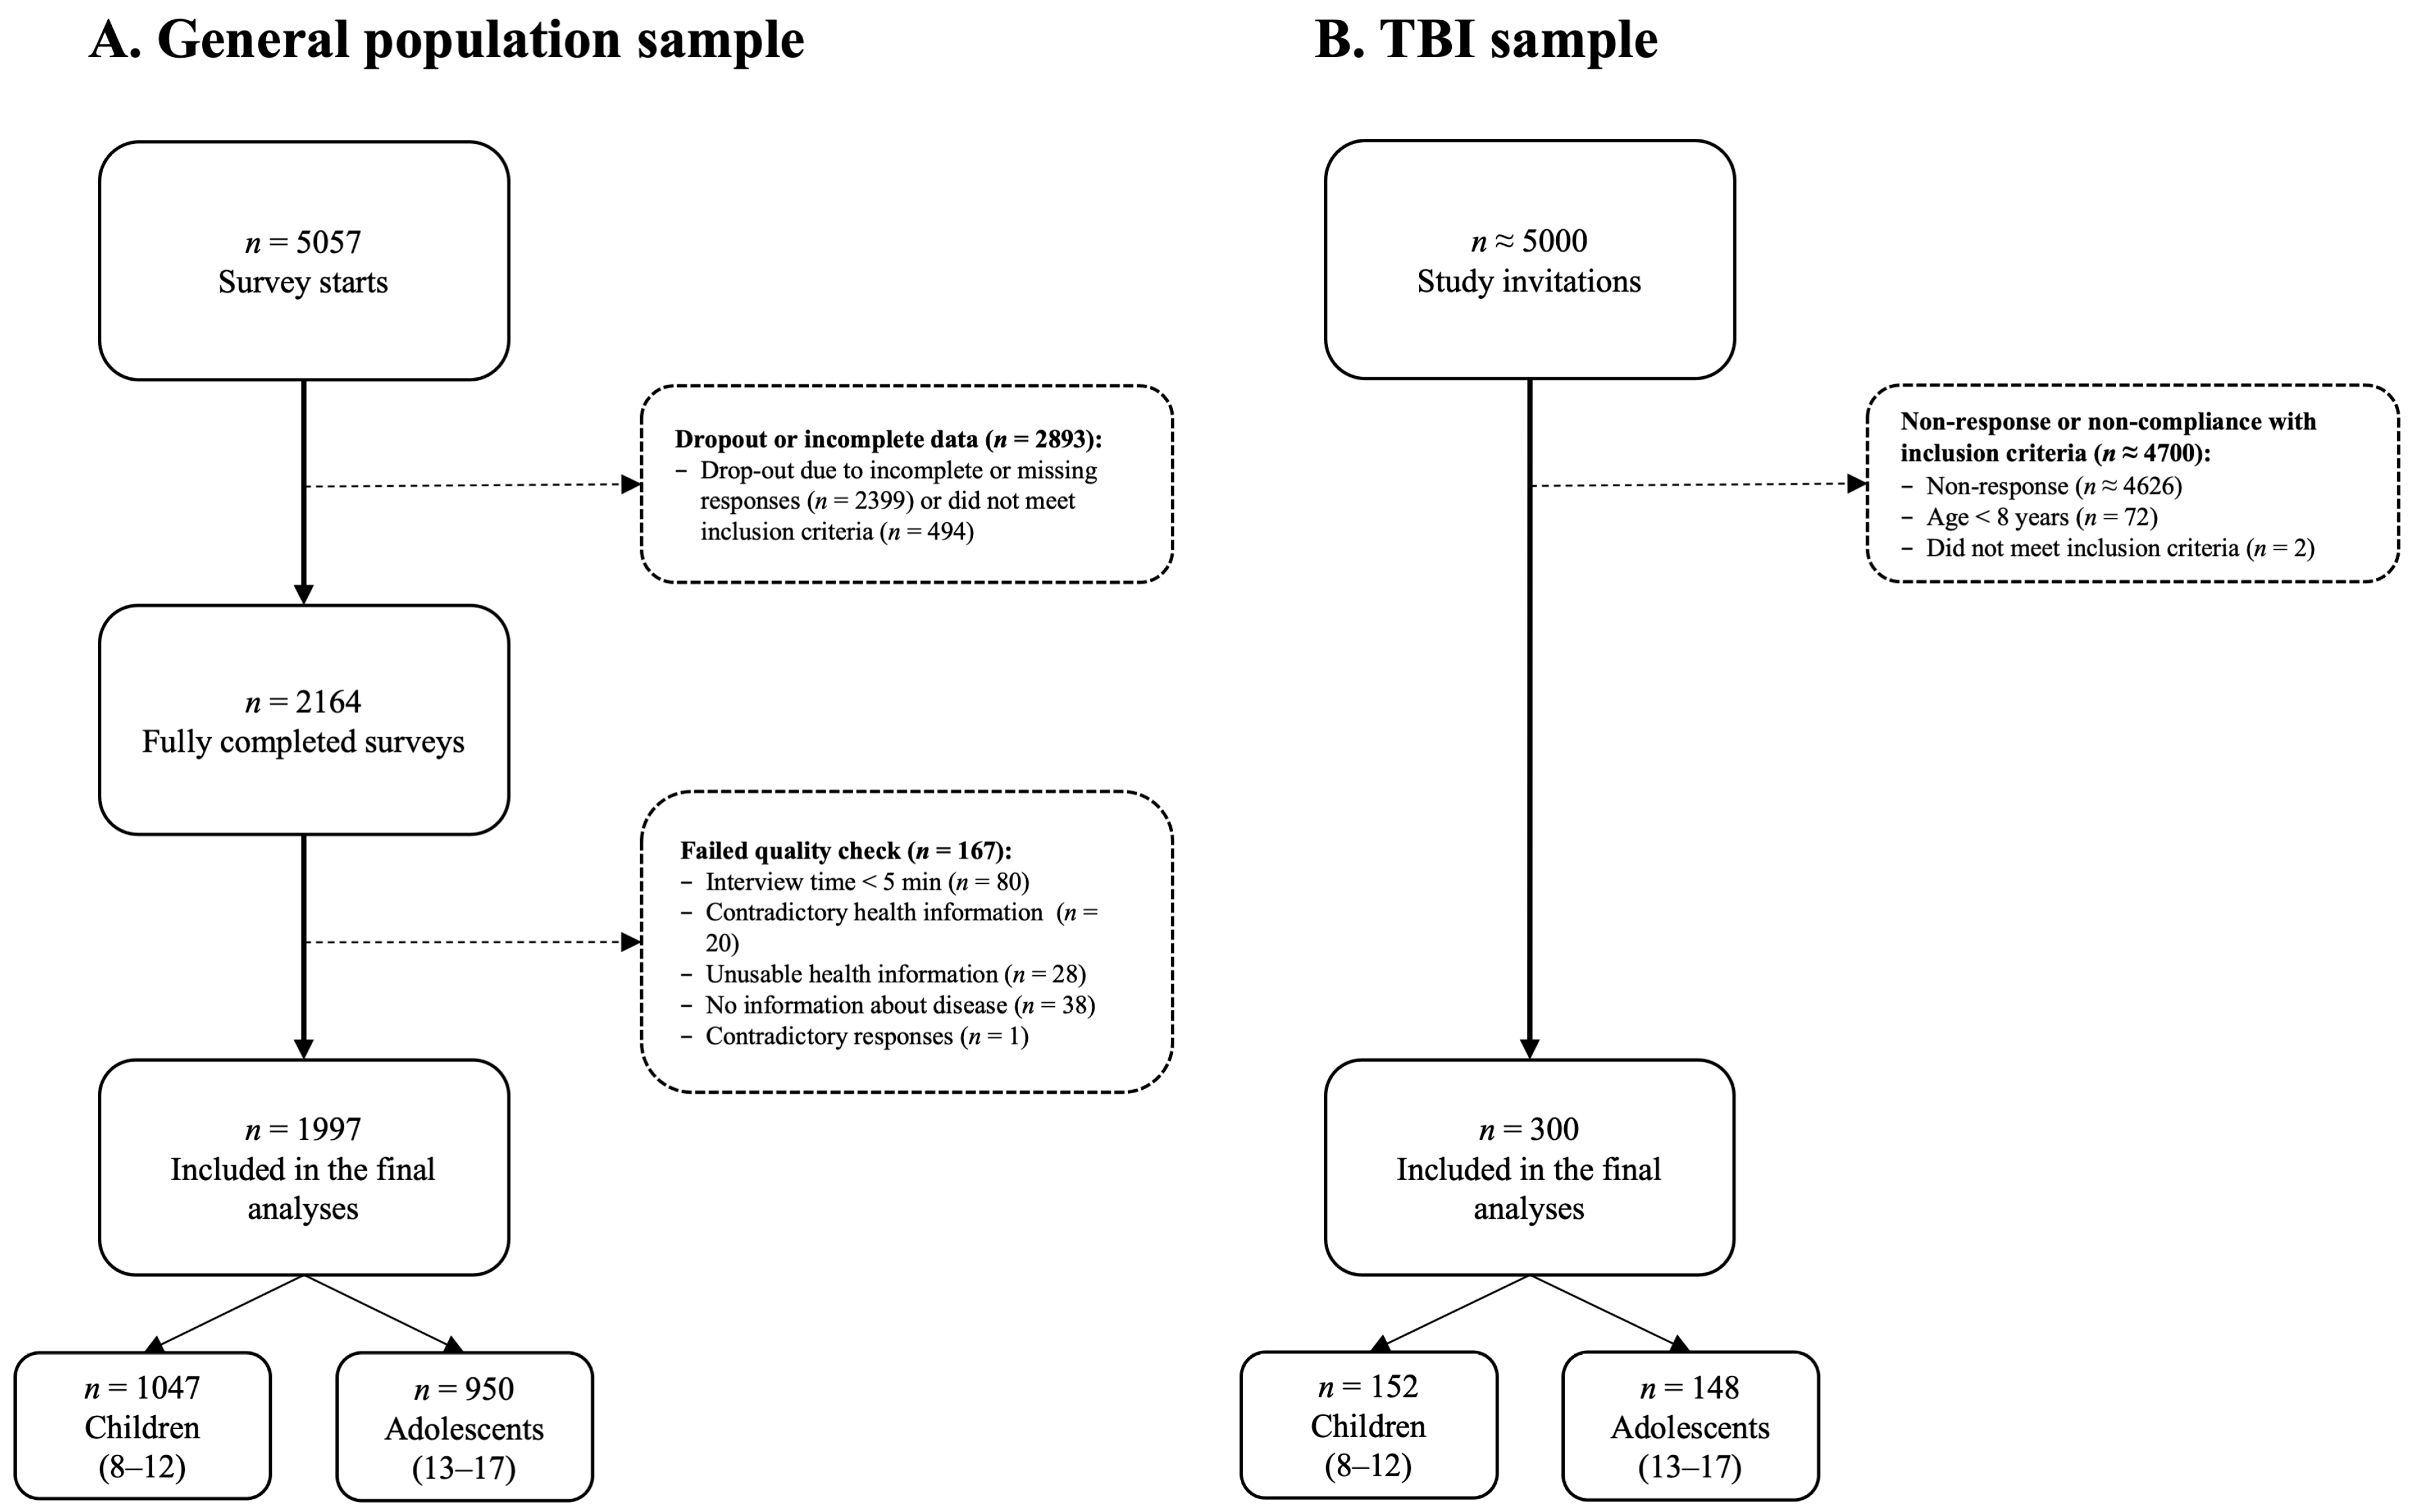
2.2. Participants
2.2.1. General Population Sample
2.2.2. TBI Sample
2.3. Ethical Approval
2.4. Materials
2.4.1. Sociodemographic and Health-Related Data
2.4.2. Quality of Life after Brain Injury in Children and Adolescents (QOLIBRI-KID/ADO)
2.5. Statistical Analyses
2.5.1. Descriptive Statistics, Reliability, and Differential Item Functioning Analyses
2.5.2. Construct Validity of QOLIBRI-KID/ADO in the General Population Sample
2.5.3. Measurement Invariance across Samples
2.5.4. Reference Values from the General Population Sample
2.5.5. Software
3. Results
3.1. Sociodemographic and Health-Related Data
3.1.1. General Population Sample
3.1.2. TBI Sample
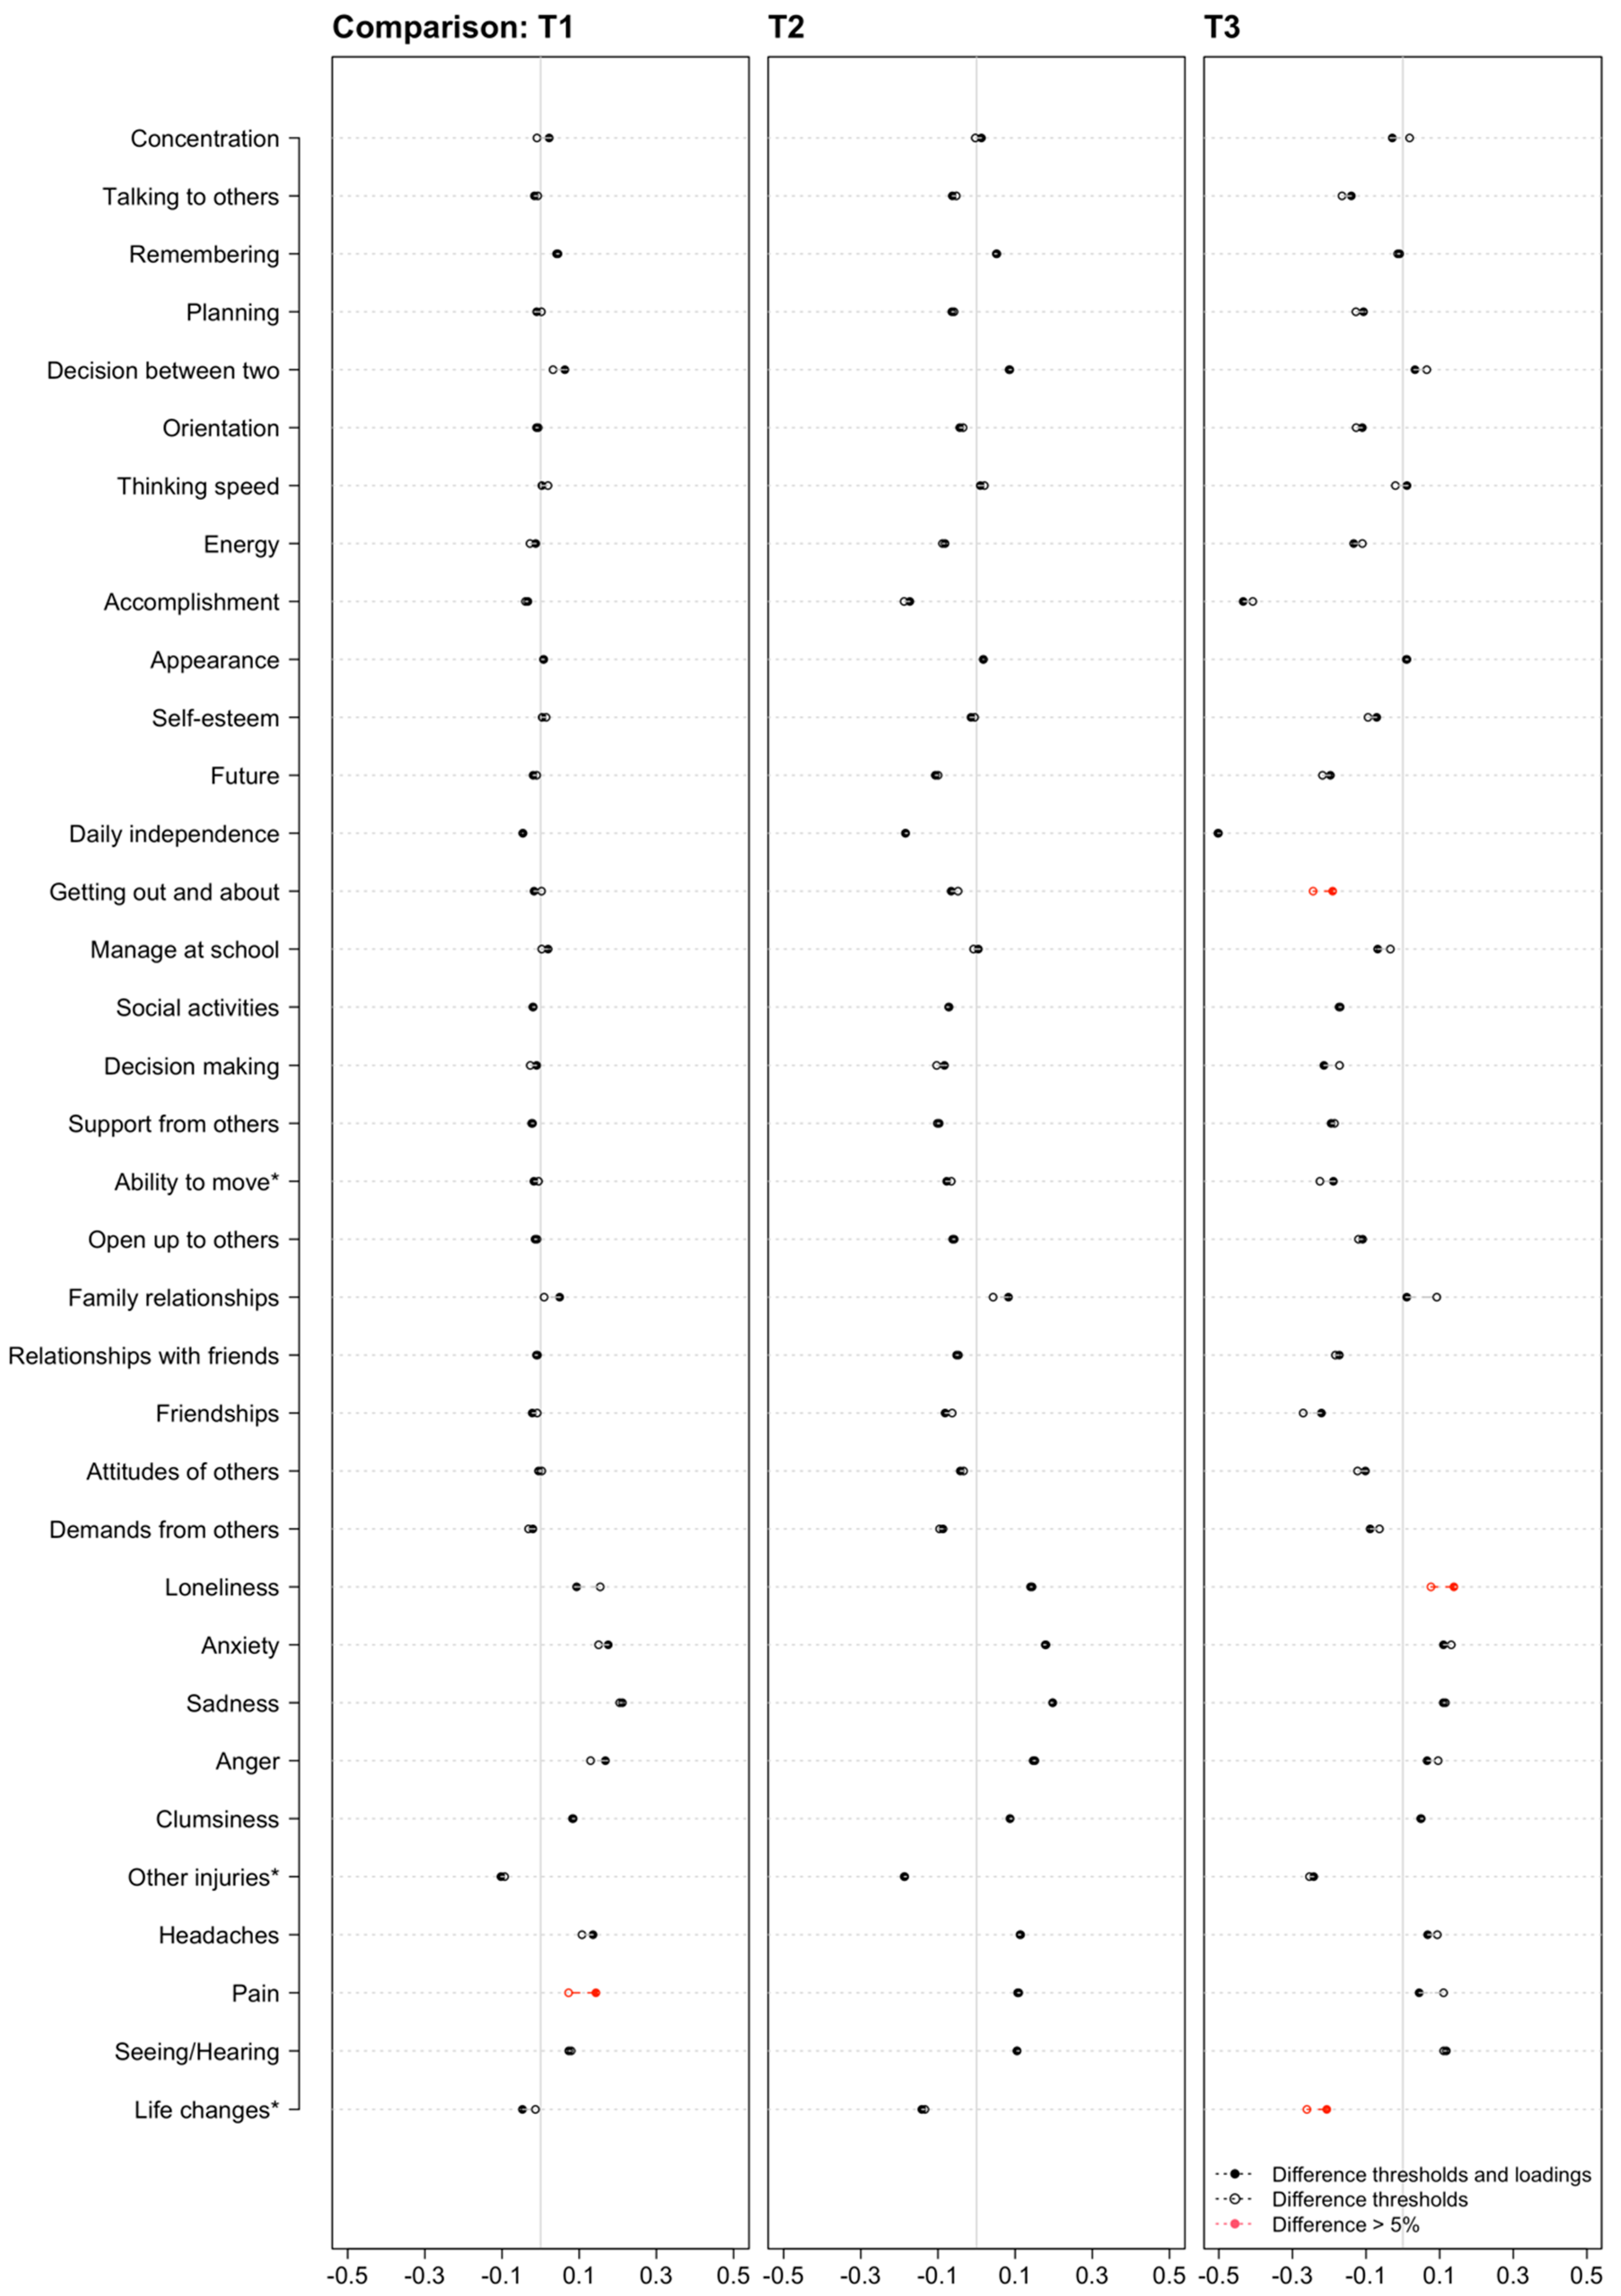
3.2. Descriptive Statistics, Reliability, and Differential Item Functioning Analyses
3.3. Construct Validity of QOLIBRI-KID/ADO in the General Population Sample
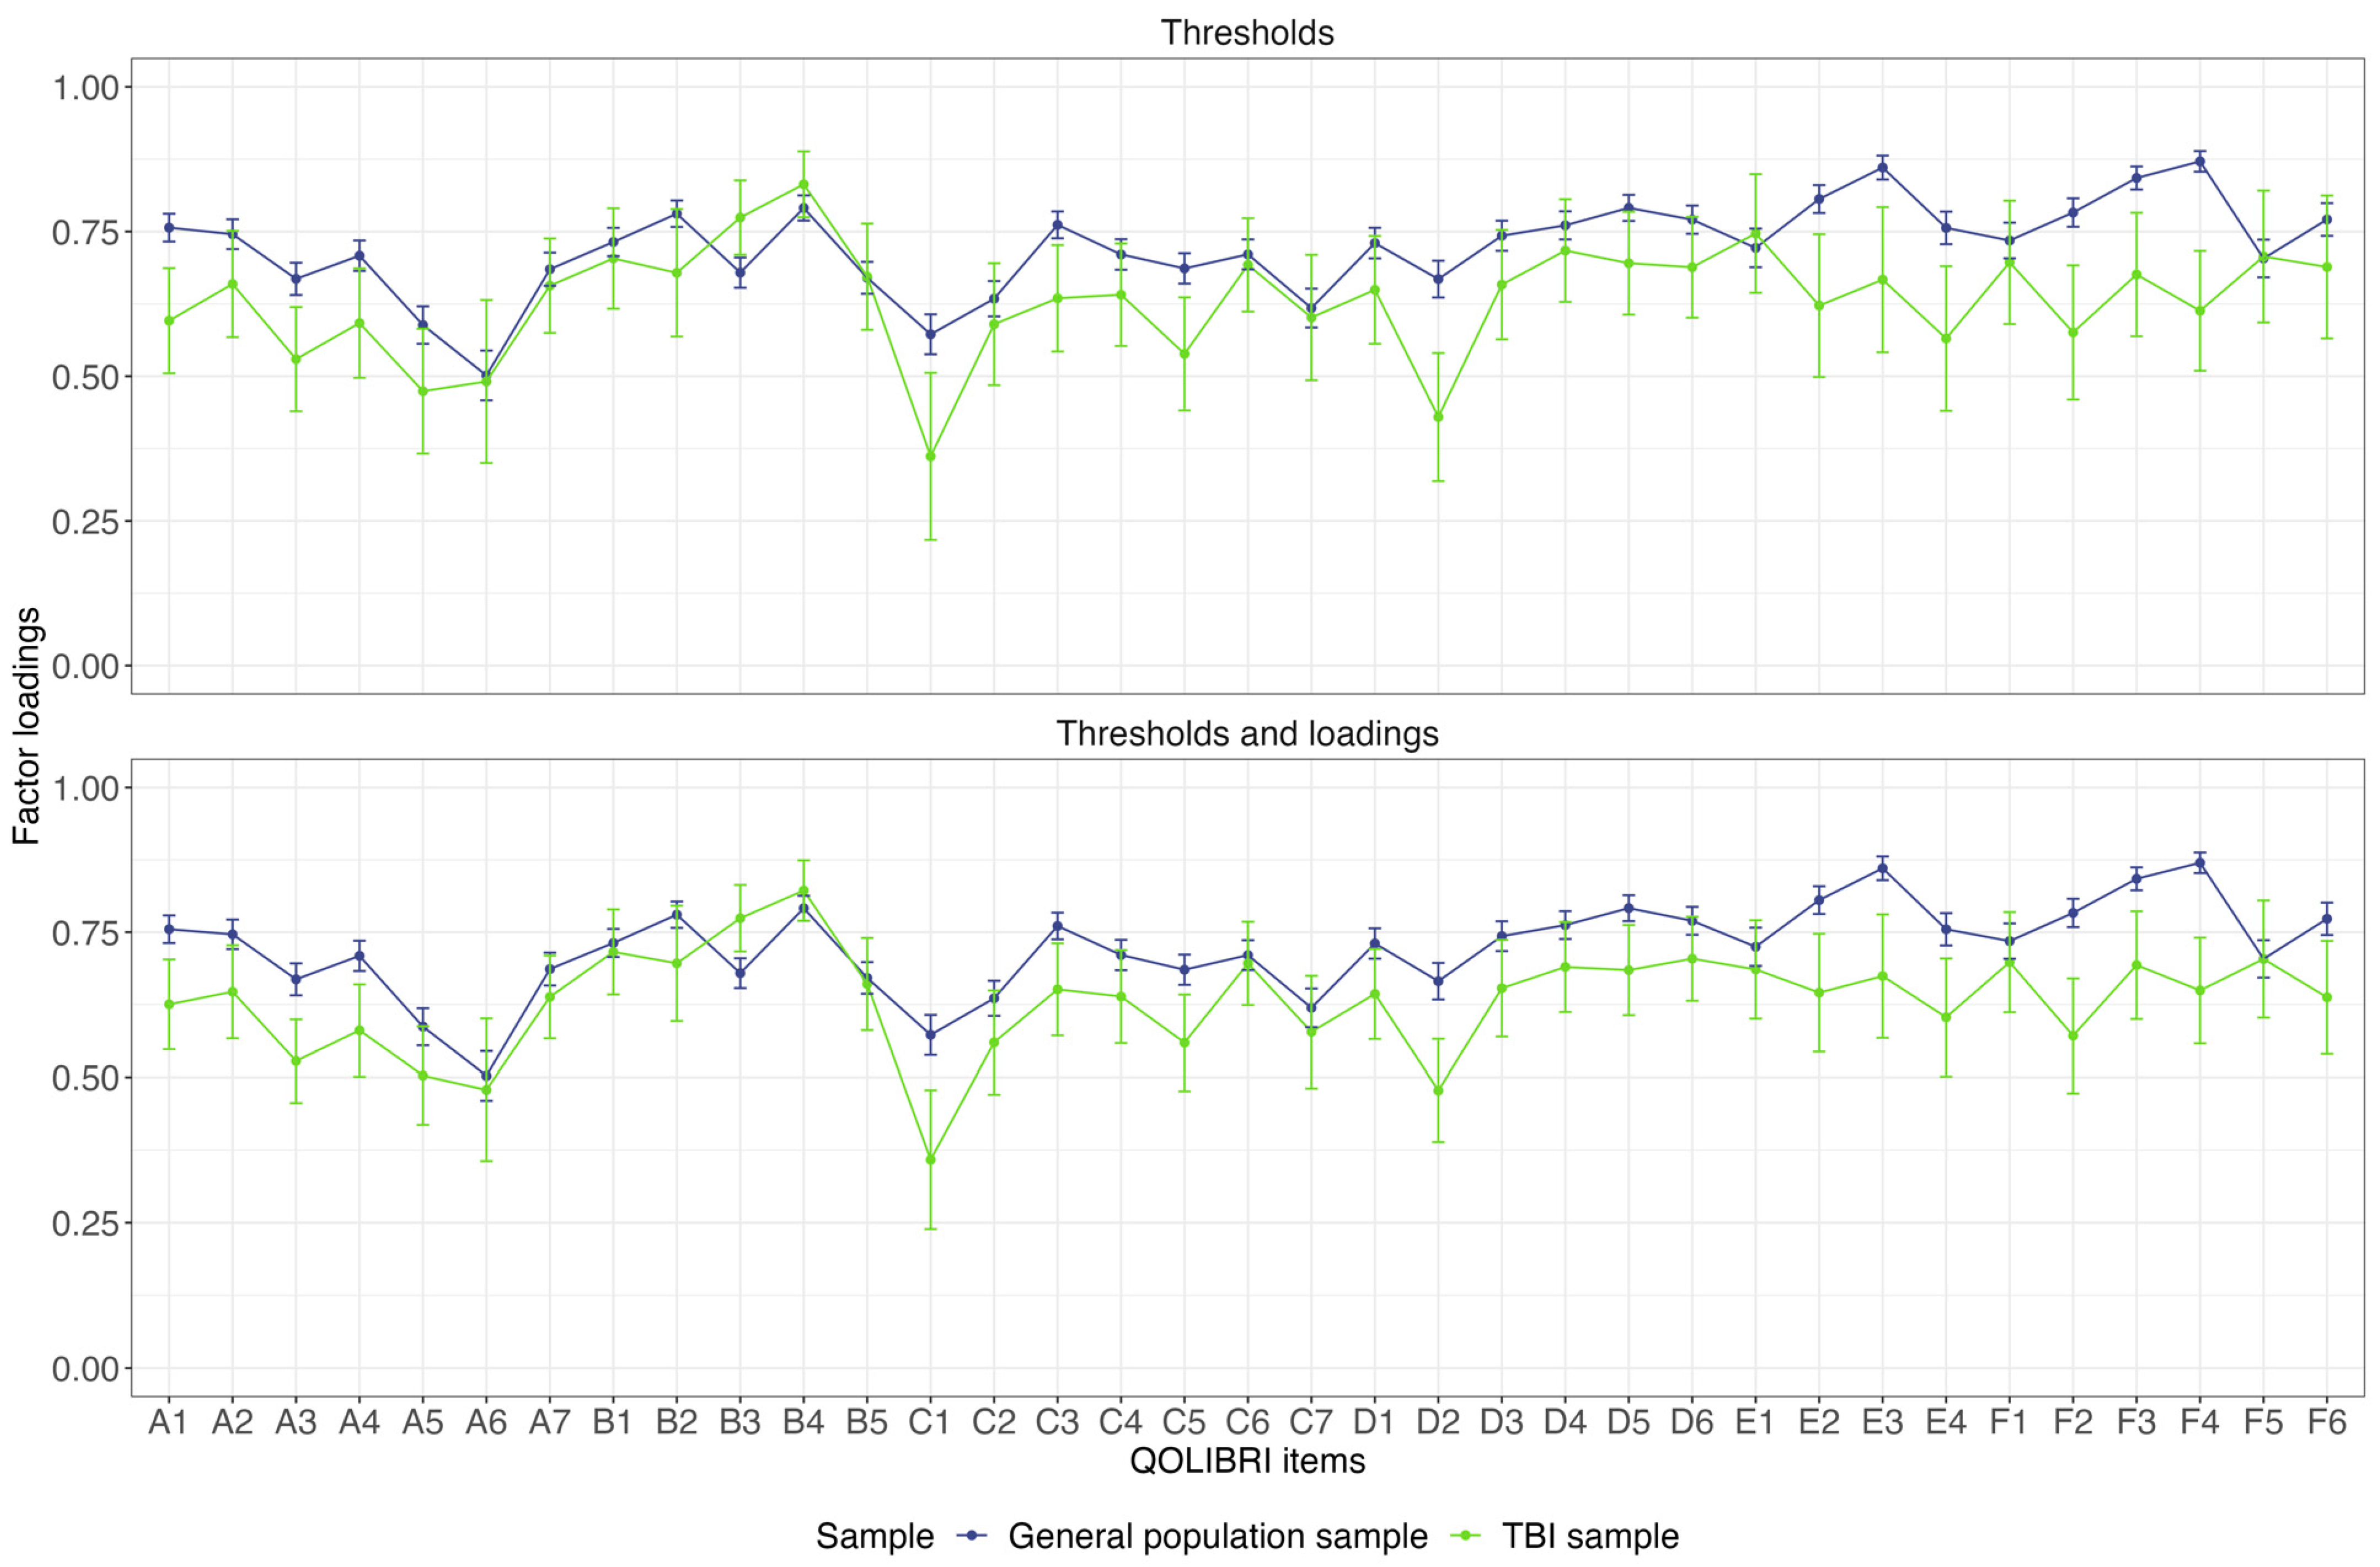
3.4. Measurement Invariance across Samples
3.5. Reference Values from the General Population Sample
4. Discussion
4.1. Strengths and Limitations
4.2. Clinical Implications
5. Conclusions
Author Contributions
Funding
Institutional Review Board Statement
Informed Consent Statement
Data Availability Statement
Acknowledgments
Conflicts of Interest
Appendix A

| Description | Original Wording (TBI Version) | Adapted Wording (General Population Version) |
|---|---|---|
| Instruction | The questionnaire is designed for adolescents following an accident/brain injury. | The questionnaire is designed for children and adolescents. |
| Item C7 | How satisfied are you with how you can move (for example, walking, running, using a wheelchair)? | How satisfied are you with how you can move (for example, walking, running)? |
| Item F2 | How much do other injuries that you got at the same time as your accident/brain injury bother you? | How much do injuries bother you? |
| Item F6 | How much do changes in your life after your accident/brain injury bother you? | How much do changes in your life bother you? |
| Variable | Children | Adolescent | Total | |
|---|---|---|---|---|
| (n = 152) | (n = 148) | (n = 300) | ||
| Gender | Female | 59 (38.8%) | 62 (41.9%) | 121 (40.3%) |
| Male | 93 (61.2%) | 85 (57.4%) | 178 (59.3%) | |
| Diverse | 0 (0%) | 1 (0.7%) | 1 (0.3%) | |
| Time since injury (years/days) | Mean (SD) | 4.15 (2.57) | 4.88 (2.96) | 4.51 (2.78) |
| Median [min, max] | 4.00 [0, 9.00] | 5.00 [0, 10.0] | 4.00 [0, 10.0] | |
| Missing | 0 (0%) | 1 (0.7%) | 1 (0.3%) | |
| Severity | Mild | 106 (69.7%) | 109 (73.6%) | 215 (71.7%) |
| Moderate | 16 (10.5%) | 9 (6.1%) | 25 (8.3%) | |
| Severe | 30 (19.7%) | 30 (20.3%) | 60 (20.0%) | |
| Recovery (KOSCHI) | 5b | 129 (84.9%) | 100 (67.6%) | 229 (76.3%) |
| 5a | 15 (9.9%) | 25 (16.9%) | 40 (13.3%) | |
| 4b | 4 (2.6%) | 18 (12.2%) | 22 (7.3%) | |
| 4a | 3 (2.0%) | 5 (3.4%) | 8 (2.7%) | |
| 3b | 1 (0.7%) | 0 (0%) | 1 (0.3%) | |
| 3a | 0 (0%) | 0 (0%) | 0 (0%) | |
| Scale | Item | p | McFadden’s R² |
|---|---|---|---|
| Cognition | Concentration | 0.237 | 0.001 |
| Talking to others | 0.073 | 0.001 | |
| Remembering | 0.499 | <0.001 | |
| Planning | 0.891 | <0.001 | |
| Decision between two | 0.001 | 0.003 | |
| Orientation | 0.797 | <0.001 | |
| Thinking speed | 0.126 | 0.001 | |
| Self | Energy | 0.29 | 0.001 |
| Accomplishment | <0.001 | 0.006 | |
| Appearance | 0.066 | 0.001 | |
| Self-esteem | 0.735 | <0.001 | |
| Future | 0.101 | 0.001 | |
| Daily Life and Autonomy | Daily independence | <0.001 | 0.016 |
| Getting out and about | <0.001 | 0.004 | |
| Manage at school | <0.001 | 0.006 | |
| Social activities | 0.827 | <0.001 | |
| Decision making | <0.001 | 0.004 | |
| Support from others | <0.001 | 0.005 | |
| Ability to move * | <0.001 | 0.005 | |
| Social Relationships | Open up to others | 0.004 | 0.002 |
| Family relationship | 0.031 | 0.002 | |
| Relationship with friends | 0.004 | 0.003 | |
| Friendships | 0.512 | <0.001 | |
| Attitudes of others | 0.001 | 0.003 | |
| Demands from others | 0.093 | 0.001 | |
| Emotions | Loneliness | 0.013 | 0.002 |
| Anxiety | 0.042 | 0.001 | |
| Sadness | 0.476 | <0.001 | |
| Anger | 0.093 | 0.001 | |
| Physical Problems | Clumsiness | 0.001 | 0.002 |
| Other injuries * | 0.297 | <0.001 | |
| Headaches | 0.328 | <0.001 | |
| Pain | 0.296 | <0.001 | |
| Seeing/Hearing | 0.371 | <0.001 | |
| Life changes * | 0.365 | <0.001 |
| Scale | Item | p | McFadden’s R² |
|---|---|---|---|
| Cognition | Concentration | 0.450 | <0.001 |
| Talking to others | <0.001 | 0.005 | |
| Remembering | 0.002 | 0.002 | |
| Planning | 0.019 | 0.001 | |
| Decision between two | <0.001 | 0.004 | |
| Orientation | <0.001 | 0.006 | |
| Thinking speed | 0.081 | 0.001 | |
| Self | Energy | 0.414 | <0.001 |
| Accomplishment | <0.001 | 0.033 | |
| Appearance | <0.001 | 0.011 | |
| Self-esteem | <0.001 | 0.005 | |
| Future | 0.003 | 0.002 | |
| Autonomy | Daily independence | <0.001 | 0.033 |
| Getting out and about | 0.009 | 0.002 | |
| Manage at school | <0.001 | 0.009 | |
| Social activities | 0.002 | 0.002 | |
| Decision making | 0.307 | <0.001 | |
| Support from others | 0.534 | <0.001 | |
| Ability to move * | 0.005 | 0.002 | |
| Social | Open up to others | 0.232 | 0.001 |
| Family relationship | <0.001 | 0.014 | |
| Relationship with friends | 0.014 | 0.002 | |
| Friendships | <0.001 | 0.009 | |
| Attitudes of others | 0.022 | 0.001 | |
| Demands from others | 0.278 | 0.001 | |
| Emotion | Loneliness | <0.001 | 0.002 |
| Anxiety | 0.081 | 0.001 | |
| Sadness | 0.149 | 0.001 | |
| Anger | 0.366 | <0.001 | |
| Physical | Clumsiness | <0.001 | 0.002 |
| Other injuries * | <0.001 | 0.021 | |
| Headaches | <0.001 | 0.007 | |
| Pain | <0.001 | 0.006 | |
| Seeing/Hearing | <0.001 | 0.005 | |
| Life changes * | <0.001 | 0.015 |
| Scale | Variable | Reference Category | b | S.E. | t | p |
|---|---|---|---|---|---|---|
| Cognition | Intercept | - | 64.62 | 1.01 | 64.08 | <0.001 |
| Age group | Children (8–12 years) | 0.16 | 0.63 | 0.25 | 0.800 | |
| Gender | Female | 0.23 | 0.63 | 0.36 | 0.720 | |
| Health status | At least one chronic health complaint | 10.95 | 0.96 | 11.40 | <0.001 | |
| Self | Intercept | - | 65.55 | 1.13 | 58.20 | <0.001 |
| Age group | Children (8–12 years) | −3.66 | 0.71 | −5.17 | <0.001 | |
| Gender | Female | 1.24 | 0.71 | 1.75 | 0.080 | |
| Health status | At least one chronic health complaint | 10.51 | 1.07 | 9.80 | <0.001 | |
| Daily Life And Autonomy | Intercept | - | 71.79 | 1.02 | 70.18 | <0.001 |
| Age group | Children (8–12 years) | 0.11 | 0.64 | 0.17 | 0.863 | |
| Gender | Female | −0.05 | 0.64 | −0.09 | 0.932 | |
| Health status | At least one chronic health complaint | 7.86 | 0.97 | 8.07 | <0.001 | |
| Social Relationships | Intercept | - | 70.55 | 1.07 | 66.17 | <0.001 |
| Age group | Children (8–12 years) | −1.22 | 0.67 | −1.82 | 0.070 | |
| Gender | Female | 1.02 | 0.67 | 1.53 | 0.127 | |
| Health status | At least one chronic health complaint | 7.68 | 1.02 | 7.57 | <0.001 | |
| Emotions | Intercept | - | 54.65 | 1.70 | 32.13 | <0.001 |
| Age group | Children (8–12 years) | 2.16 | 1.07 | 2.02 | 0.044 | |
| Gender | Female | 4.22 | 1.07 | 3.95 | <0.001 | |
| Health status | At least one chronic health complaint | 9.11 | 1.62 | 5.63 | <0.001 | |
| Physical Problems | Intercept | - | 55.60 | 1.74 | 31.91 | <0.001 |
| Age group | Children (8–12 years) | 1.65 | 1.10 | 1.50 | 0.133 | |
| Gender | Female | 1.76 | 1.09 | 1.61 | 0.109 | |
| Health status | At least one chronic health complaint | 8.59 | 1.66 | 5.18 | <0.001 |
| Scale | Variable | Reference Category | b | S.E. | t | p |
|---|---|---|---|---|---|---|
| Cognition | Intercept | - | 64.33 | 1.61 | 40.05 | <0.001 |
| Age group | Children (8–12 years) | −0.67 | 1.91 | −0.35 | 0.726 | |
| Gender | Female | 0.31 | 1.91 | 0.16 | 0.871 | |
| Health status | At least one chronic health complaint | 11.98 | 1.67 | 7.15 | <0.001 | |
| Age group * Gender | Children * Female | 2.59 | 1.27 | 2.04 | 0.041 | |
| Age group * Health status | Children * At least one chronic health complaint | −0.52 | 1.92 | −0.27 | 0.788 | |
| Gender * Health status | Female * At least one chronic health complaint | −1.50 | 1.92 | −0.78 | 0.435 | |
| Self | Intercept | - | 65.42 | 1.79 | 36.54 | <0.001 |
| Age group | Children (8–12 years) | −8.08 | 2.13 | −3.80 | <0.001 | |
| Gender | Female | 4.34 | 2.13 | 2.04 | 0.041 | |
| Health status | At least one chronic health complaint | 11.50 | 1.87 | 6.16 | <0.001 | |
| Age group * Gender | Children * Female | 3.09 | 1.41 | 2.19 | 0.029 | |
| Age group * Health status | Children * At least one chronic health complaint | 3.29 | 2.14 | 1.54 | 0.124 | |
| Gender * Health status | Female * At least one chronic health complaint | −5.21 | 2.14 | −2.44 | 0.015 | |
| Daily Life and Autonomy | Intercept | - | 71.98 | 1.63 | 44.24 | <0.001 |
| Age group | Children (8–12 years) | −3.50 | 1.93 | −1.81 | 0.070 | |
| Gender | Female | 1.68 | 1.93 | 0.87 | 0.384 | |
| Health status | At least one chronic health complaint | 8.45 | 1.70 | 4.98 | <0.001 | |
| Age group * Gender | Children * Female | 2.96 | 1.29 | 2.30 | 0.022 | |
| Age group * Health status | Children * At least one chronic health complaint | 2.45 | 1.95 | 1.26 | 0.208 | |
| Gender * Health status | Female * At least one chronic health complaint | −3.59 | 1.95 | −1.84 | 0.065 | |
| Social Relationships | Intercept | - | 70.10 | 1.70 | 41.28 | <0.001 |
| Age group | Children (8–12 years) | −3.61 | 2.02 | −1.79 | 0.074 | |
| Gender | Female | 3.72 | 2.02 | 1.84 | 0.065 | |
| Health status | At least one chronic health complaint | 8.49 | 1.77 | 4.80 | <0.001 | |
| Age group * Gender | Children * Female | 1.10 | 1.34 | 0.82 | 0.410 | |
| Age group * Health status | Children * At least one chronic health complaint | 2.10 | 2.03 | 1.03 | 0.301 | |
| Gender * Health status | Female * At least one chronic health complaint | −3.68 | 2.03 | −1.81 | 0.070 | |
| Emotions | Intercept | - | 56.52 | 2.70 | 20.92 | <0.001 |
| Age group | Children (8–12 years) | −4.97 | 3.21 | −1.55 | 0.121 | |
| Gender | Female | 3.80 | 3.21 | 1.18 | 0.237 | |
| Health status | At least one chronic health complaint | 9.05 | 2.82 | 3.21 | 0.001 | |
| Age group * Gender | Children * Female | 7.61 | 2.13 | 3.57 | <0.001 | |
| Age group * Health status | Children * At least one chronic health complaint | 3.84 | 3.23 | 1.19 | 0.235 | |
| Gender * Health status | Female * At least one chronic health complaint | −3.64 | 3.23 | −1.13 | 0.260 | |
| Physical Problems | Intercept | - | 59.71 | 2.77 | 21.55 | <0.001 |
| Age group | Children (8–12 years) | −5.94 | 3.29 | −1.81 | 0.071 | |
| Gender | Female | −2.18 | 3.29 | −0.66 | 0.508 | |
| Health status | At least one chronic health complaint | 5.74 | 2.89 | 1.99 | 0.047 | |
| Age group * Gender | Children * Female | 6.73 | 2.19 | 3.08 | 0.002 | |
| Age group * Health status | Children * At least one chronic health complaint | 4.86 | 3.31 | 1.47 | 0.142 | |
| Gender * Health status | Female * At least one chronic health complaint | 0.85 | 3.31 | 0.26 | 0.798 |

References
- Araki, T.; Yokota, H.; Morita, A. Pediatric Traumatic Brain Injury: Characteristic Features, Diagnosis, and Management. Neurol. Med. Chir. 2017, 57, 82–93. [Google Scholar] [CrossRef]
- Gardner, M.T.; O’Meara, A.M.I.; Miller Ferguson, N. Pediatric Traumatic Brain Injury: An Update on Management. Curr. Pediatr. Rep. 2017, 5, 213–219. [Google Scholar] [CrossRef]
- Aitken, M.E.; McCarthy, M.L.; Slomine, B.S.; Ding, R.; Durbin, D.R.; Jaffe, K.M.; Paidas, C.N.; Dorsch, A.M.; Christensen, J.R.; Mackenzie, E.J.; et al. Family Burden after Traumatic Brain Injury in Children. Pediatrics 2009, 123, 199–206. [Google Scholar] [CrossRef]
- Maas, A.I.R.; Menon, D.K.; Adelson, P.D.; Andelic, N.; Bell, M.J.; Belli, A.; Bragge, P.; Brazinova, A.; Büki, A.; Chesnut, R.M.; et al. Traumatic Brain Injury: Integrated Approaches to Improve Prevention, Clinical Care, and Research. Lancet Neurol. 2017, 16, 987–1048. [Google Scholar] [CrossRef]
- Ramos-Usuga, D.; Benito-Sánchez, I.; Pérez-Delgadillo, P.; Valdivia-Tangarife, R.; Villaseñor-Cabrera, T.; Olabarrieta-Landa, L.; Arango-Lasprilla, J.C. Trajectories of Neuropsychological Functioning in Mexican Children with Traumatic Brain Injury over the First Year after Injury. NeuroRehabilitation 2019, 45, 295–309. [Google Scholar] [CrossRef]
- Babikian, T.; Asarnow, R. Neurocognitive Outcomes and Recovery after Pediatric TBI: Meta-Analytic Review of the Literature. Neuropsychology 2009, 23, 283–296. [Google Scholar] [CrossRef]
- Lendt, M.; Müller, K. Langfristige psychosoziale Entwicklung nach schwerem Schädel-Hirn-Trauma im Kindesalter. Monatsschrift Kinderheilkd. 2014, 162, 420–427. [Google Scholar] [CrossRef]
- Scott, C.; McKinlay, A.; McLellan, T.; Britt, E.; Grace, R.; MacFarlane, M. A Comparison of Adult Outcomes for Males Compared to Females Following Pediatric Traumatic Brain Injury. Neuropsychology 2015, 29, 501–508. [Google Scholar] [CrossRef] [PubMed]
- Burd, R.S.; Jensen, A.R.; VanBuren, J.M.; Alvey, J.S.; Richards, R.; Holubkov, R.; Pollack, M.M. Long-Term Outcomes after Pediatric Injury: Results of the Assessment of Functional Outcomes and Health-Related Quality of Life after Pediatric Trauma Study. J. Am. Coll. Surg. 2021, 233, 666–675e2. [Google Scholar] [CrossRef] [PubMed]
- Kissane, A.L.; Eldridge, B.J.; Kelly, S.; Vidmar, S.; Galea, M.P.; Williams, G.P. High-Level Mobility Skills in Children and Adolescents with Traumatic Brain Injury. Brain Inj. 2015, 29, 1711–1716. [Google Scholar] [CrossRef] [PubMed]
- Ryan, N.P.; Noone, K.; Godfrey, C.; Botchway, E.N.; Catroppa, C.; Anderson, V. Young Adults’ Perspectives on Health-Related Quality of Life after Paediatric Traumatic Brain Injury: A Prospective Cohort Study. Ann. Phys. Rehabil. Med. 2019, 62, 342–350. [Google Scholar] [CrossRef]
- Rauen, K.; Reichelt, L.; Probst, P.; Schäpers, B.; Müller, F.; Jahn, K.; Plesnila, N. Quality of Life up to 10 Years after Traumatic Brain Injury: A Cross-Sectional Analysis. Health Qual Life Outcomes 2020, 18, 166. [Google Scholar] [CrossRef]
- LeBlond, E.; Smith-Paine, J.; Narad, M.; Wade, S.L.; Gardis, M.; Naresh, M.; Makoroff, K.; Rhine, T. Understanding the Relationship between Family Functioning and Health-Related Quality of Life in Very Young Children with Moderate-to-Severe TBI. Clin. Neuropsychol. 2021, 35, 868–884. [Google Scholar] [CrossRef] [PubMed]
- Fayed, N.; De Camargo, O.K.; Kerr, E.; Rosenbaum, P.; Dubey, A.; Bostan, C.; Faulhaber, M.; Raina, P.; Cieza, A. Generic Patient-Reported Outcomes in Child Health Research: A Review of Conceptual Content Using World Health Organization Definitions. Dev. Med. Child Neurol. 2012, 54, 1085–1095. [Google Scholar] [CrossRef] [PubMed]
- Matza, L.S.; Swensen, A.R.; Flood, E.M.; Secnik, K.; Leidy, N.K. Assessment of Health-Related Quality of Life in Children: A Review of Conceptual, Methodological, and Regulatory Issues. Value Health 2004, 7, 79–92. [Google Scholar] [CrossRef] [PubMed]
- U.S. Department of Health and Human Services FDA Center for Drug Evaluation and Research; U.S. Department of Health and Human Services FDA Center for Biologics Evaluation and Research; U.S. Department of Health and Human Services FDA Center for Devices and Radiological Health. Guidance for Industry: Patient-Reported Outcome Measures: Use in Medical Product Development to Support Labeling Claims: Draft Guidance. Health Qual Life Outcomes 2006, 4, 79. [Google Scholar] [CrossRef] [PubMed]
- Coghill, D.; Danckaerts, M.; Sonuga-Barke, E.; Sergeant, J. Practitioner Review: Quality of Life in Child Mental Health—Conceptual Challenges and Practical Choices. J. Child Psychol. Psychiatry 2009, 50, 544–561. [Google Scholar] [CrossRef] [PubMed]
- Wiebe, S.; Guyatt, G.; Weaver, B.; Matijevic, S.; Sidwell, C. Comparative Responsiveness of Generic and Specific Quality-of-Life Instruments. J. Clin. Epidemiol. 2003, 56, 52–60. [Google Scholar] [CrossRef]
- von Steinbüchel, N.; Covic, A.; Polinder, S.; Kohlmann, T.; Cepulyte, U.; Poinstingl, H.; Backhaus, J.; Bakx, W.; Bullinger, M.; Christensen, A.-L.; et al. Assessment of Health-Related Quality of Life after TBI: Comparison of a Disease-Specific (QOLIBRI) with a Generic (SF-36) Instrument. Behav. Neurol. 2016, 2016, 7928014. [Google Scholar] [CrossRef]
- Varni, J.W.; Seid, M.; Rode, C.A. The PedsQL™: Measurement Model for the Pediatric Quality of Life Inventory. Med. Care 1999, 37, 126–139. [Google Scholar] [CrossRef]
- Landgraf, J.M.; Abetz, L.; Ware, J.E. The CHQ User’s Manual; The Health Institute, New England Medical Center: Boston, MA, USA, 1996. [Google Scholar]
- Ravens-Sieberer, U.; Bullinger, M. Assessing Health-Related Quality of Life in Chronically Ill Children with the German KINDL: First Psychometric and Content Analytical Results. Qual. Life Res. 1998, 7, 399–407. [Google Scholar] [CrossRef]
- Ware, J.E.; Snow, K.K.; Kosinski, M.; Gandek, B. SF-36 Health Survey Manual and Interpretation Guide; The Health Institute, New Endland Medical Center: Boston, MA, USA, 1993. [Google Scholar]
- Krenz, U.; Timmermann, D.; Gorbunova, A.; Lendt, M.; Schmidt, S.; von Steinbüchel, N. Health-Related Quality of Life after Pediatric Traumatic Brain Injury: A Qualitative Comparison between Children’s and Parents’ Perspectives. PLoS ONE 2021, 16, e0246514. [Google Scholar] [CrossRef] [PubMed]
- Souza, L.M.d.N.; Braga, L.W.; Filho, G.N.; Dellatolas, G. Quality-of-Life: Child and Parent Perspectives Following Severe Traumatic Brain Injury. Dev. Neurorehabilit. 2007, 10, 35–47. [Google Scholar] [CrossRef] [PubMed]
- Erickson, S.J.; Montague, E.Q.; Gerstle, M.A. Health-Related Quality of Life in Children with Moderate-to-Severe Traumatic Brain Injury. Dev. Neurorehabilit. 2010, 13, 175–181. [Google Scholar] [CrossRef] [PubMed]
- Von Steinbuechel, N.; Zeldovich, M.; Greving, S.; Olabarrieta-Landa, L.; Krenz, U.; Timmermann, D.; Koerte, I.K.; Bonfert, M.V.; Berweck, S.; Kieslich, M.; et al. Quality of Life after Brain Injury in Children and Adolescents (QOLIBRI-KID/ADO)—The First Disease-Specific Self-Report Questionnaire after Traumatic Brain Injury. J. Clin. Med. 2023, 12, 4898. [Google Scholar] [CrossRef] [PubMed]
- Hsu, C.-C.; Sandford, B.A. The Delphi Technique: Making Sense of Consensus. Pract. Assess. Res. Eval. 2007, 12, 10. [Google Scholar] [CrossRef]
- von Steinbüchel, N.; Wilson, L.; Gibbons, H.; Hawthorne, G.; Höfer, S.; Schmidt, S.; Bullinger, M.; Maas, A.; Neugebauer, E.; Powell, J.; et al. Quality of Life after Brain Injury (QOLIBRI): Scale Development and Metric Properties. J. Neurotrauma 2010, 27, 1167–1185. [Google Scholar] [CrossRef] [PubMed]
- von Steinbüchel, N.; Wilson, L.; Gibbons, H.; Hawthorne, G.; Höfer, S.; Schmidt, S.; Bullinger, M.; Maas, A.; Neugebauer, E.; Powell, J.; et al. Quality of Life after Brain Injury (QOLIBRI): Scale Validity and Correlates of Quality of Life. J. Neurotrauma 2010, 27, 1157–1165. [Google Scholar] [CrossRef]
- Cappelleri, J.C.; Bushmakin, A.G. Interpretation of Patient-Reported Outcomes. Stat. Methods Med. Res. 2014, 23, 460–483. [Google Scholar] [CrossRef]
- Marquis, P.; Chassany, O.; Abetz, L. A Comprehensive Strategy for the Interpretation of Quality-of-Life Data Based on Existing Methods. Value Health 2004, 7, 93–104. [Google Scholar] [CrossRef]
- Teasdale, G.; Jennett, B. Assessment of Coma and Impaired Consciousness. A Practical Scale. Lancet 1974, 2, 81–84. [Google Scholar] [CrossRef] [PubMed]
- Crouchman, M.; Rossiter, L.; Colaco, T.; Forsyth, R. A Practical Outcome Scale for Paediatric Head Injury. Arch. Dis. Child. 2001, 84, 120–124. [Google Scholar] [CrossRef] [PubMed]
- Bulmer, M.G. Principles of Statistics; Dover Publications: New York, NY, USA, 1979; ISBN 978-0-486-63760-0. [Google Scholar]
- Terwee, C.B.; Bot, S.D.M.; de Boer, M.R.; van der Windt, D.A.W.M.; Knol, D.L.; Dekker, J.; Bouter, L.M.; de Vet, H.C.W. Quality Criteria Were Proposed for Measurement Properties of Health Status Questionnaires. J. Clin. Epidemiol. 2007, 60, 34–42. [Google Scholar] [CrossRef]
- Feißt, M.; Hennigs, A.; Heil, J.; Moosbrugger, H.; Kelava, A.; Stolpner, I.; Kieser, M.; Rauch, G. Refining Scores Based on Patient Reported Outcomes—Statistical and Medical Perspectives. BMC Med. Res. Methodol. 2019, 19, 167. [Google Scholar] [CrossRef] [PubMed]
- The Whoqol Group. The World Health Organization Quality of Life Assessment (WHOQOL): Development and General Psychometric Properties. Soc. Sci. Med. 1998, 46, 1569–1585. [Google Scholar] [CrossRef] [PubMed]
- Choi, S.; Gibbons, L.; Crane, P. Lordif: An R Package for Detecting Differential Item Functioning Using Iterative Hybrid Ordinal Logistic Regression/Item Response Theory and Monte Carlo Simulations. J. Stat. Softw. 2011, 39, 1–30. [Google Scholar] [CrossRef] [PubMed]
- Cole, D.A. Utility of Confirmatory Factor Analysis in Test Validation Research. J. Consult. Clin. Psychol. 1987, 55, 584–594. [Google Scholar] [CrossRef] [PubMed]
- Hu, L.; Bentler, P.M. Cutoff Criteria for Fit Indexes in Covariance Structure Analysis: Conventional Criteria versus New Alternatives. Struct. Equ. Model. A Multidiscip. J. 1999, 6, 1–55. [Google Scholar] [CrossRef]
- Finch, W.H.; French, B.F. A Simulation Investigation of the Performance of Invariance Assessment Using Equivalence Testing Procedures. Struct. Equ. Model. A Multidiscip. J. 2018, 25, 673–686. [Google Scholar] [CrossRef]
- Steiger, J.H.; Lind, J.C. Statistically Based Tests for the Number of Common Factors. In Proceedings of the Psychometric Society Annual Meeting, Iowa City, IA, USA, 30 May 1980. [Google Scholar]
- Xia, Y.; Yang, Y. RMSEA, CFI, and TLI in Structural Equation Modeling with Ordered Categorical Data: The Story They Tell Depends on the Estimation Methods. Behav. Res. Methods 2019, 51, 409–428. [Google Scholar] [CrossRef]
- Wu, H.; Estabrook, R. Identification of Confirmatory Factor Analysis Models of Different Levels of Invariance for Ordered Categorical Outcomes. Psychometrika 2016, 81, 1014–1045. [Google Scholar] [CrossRef] [PubMed]
- Svetina, D.; Rutkowski, L.; Rutkowski, D. Multiple-Group Invariance with Categorical Outcomes Using Updated Guidelines: An Illustration Using Mplus and the Lavaan/Semtools Packages. Struct. Equ. Model. A Multidiscip. J. 2020, 27, 111–130. [Google Scholar] [CrossRef]
- Hirschfeld, G.; von Brachel, R. Improving Multiple-Group Confirmatory Factor Analysis in R—A Tutorial in Measurement Invariance with Continuous and Ordinal Indicators. Pract. Assess. Res. Eval. 2014, 19, 7. [Google Scholar] [CrossRef]
- Cheung, G.W.; Rensvold, R.B. Evaluating Goodness-of-Fit Indexes for Testing Measurement Invariance. Struct. Equ. Model. A Multidiscip. J. 2002, 9, 233–255. [Google Scholar] [CrossRef]
- Guilfoyle, M.R.; Seeley, H.M.; Corteen, E.; Harkin, C.; Richards, H.; Menon, D.K.; Hutchinson, P.J. Assessing Quality of Life after Traumatic Brain Injury: Examination of the Short Form 36 Health Survey. J. Neurotrauma 2010, 27, 2173–2181. [Google Scholar] [CrossRef] [PubMed]
- McCauley, S.R.; Wilde, E.A.; Anderson, V.A.; Bedell, G.; Beers, S.R.; Campbell, T.F.; Chapman, S.B.; Ewing-Cobbs, L.; Gerring, J.P.; Gioia, G.A.; et al. Recommendations for the Use of Common Outcome Measures in Pediatric Traumatic Brain Injury Research. J. Neurotrauma 2012, 29, 678–705. [Google Scholar] [CrossRef] [PubMed]
- R Core Team. R: A Language and Environment for Statistical Computing; R Core Team: Vienna, Austria, 2021. [Google Scholar]
- Rich, B. Table1: Tables of Descriptive Statistics in HTML 2021. R Package Version 1.4.3. Available online: https://CRAN.R-project.org/package=table1 (accessed on 4 December 2023).
- Revelle, W. Psych: Procedures for Personality and Psychological Research; R Package Version 2.3.3, Psych; Northwestern University: Evanston, IL, USA, 2023; Available online: https://CRAN.R-project.org/package=psych (accessed on 4 December 2023).
- Rosseel, Y. Lavaan: An R Package for Structural Equation Modeling. J. Stat. Softw. 2012, 48, 1–36. [Google Scholar] [CrossRef]
- Putnick, D.L.; Bornstein, M.H. Measurement Invariance Conventions and Reporting: The State of the Art and Future Directions for Psychological Research. Dev. Rev. 2016, 41, 71–90. [Google Scholar] [CrossRef]
- Pinquart, M. Body Image of Children and Adolescents with Chronic Illness: A Meta-Analytic Comparison with Healthy Peers. Body Image 2013, 10, 141–148. [Google Scholar] [CrossRef]
- Babikian, T.; Merkley, T.; Savage, R.C.; Giza, C.C.; Levin, H. Chronic Aspects of Pediatric Traumatic Brain Injury: Review of the Literature. J. Neurotrauma 2015, 32, 1849–1860. [Google Scholar] [CrossRef]
- Michel, G.; The KIDSCREEN Group; Bisegger, C.; Fuhr, D.C.; Abel, T. Age and Gender Differences in Health-Related Quality of Life of Children and Adolescents in Europe: A Multilevel Analysis. Qual. Life Res. 2009, 18, 1147–1157. [Google Scholar] [CrossRef]
- Silva, N.; Pereira, M.; Otto, C.; Ravens-Sieberer, U.; Canavarro, M.C.; Bullinger, M. Do 8- to 18-Year-Old Children/Adolescents with Chronic Physical Health Conditions Have Worse Health-Related Quality of Life than Their Healthy Peers? A Meta-Analysis of Studies Using the KIDSCREEN Questionnaires. Qual. Life Res. 2019, 28, 1725–1750. [Google Scholar] [CrossRef]
- Baumgarten, F.; Cohrdes, C.; Schienkiewitz, A.; Thamm, R.; Meyrose, A.-K.; Ravens-Sieberer, U. Gesundheitsbezogene Lebensqualität und Zusammenhänge mit chronischen Erkrankungen und psychischen Auffälligkeiten bei Kindern und Jugendlichen: Ergebnisse aus KiGGS Welle 2. Bundesgesundheitsblatt Gesundheitsforschung Gesundheitsschutz 2019, 62, 1205–1214. [Google Scholar] [CrossRef]
- Ravens-Sieberer, U.; Gosch, A.; Rajmil, L.; Erhart, M.; Bruil, J.; Power, M.; Duer, W.; Auquier, P.; Cloetta, B.; Czemy, L.; et al. The KIDSCREEN-27 Quality of Life Measure for Children and Adolescents: Psychometric Results from a Cross-Cultural Survey in 13 European Countries. Value Health 2008, 11, 645–658. [Google Scholar] [CrossRef]
- Bisegger, C.; Cloetta, B.; von Bisegger, U.; Abel, T.; Ravens-Sieberer, U.; The European Kidscreen Group. Health-Related Quality of Life: Gender Differences in Childhood and Adolescence. Soz. Und Präventivmedizin SPM 2005, 50, 281–291. [Google Scholar] [CrossRef] [PubMed]
- Van Cleave, J.; Gortmaker, S.L.; Perrin, J.M. Dynamics of Obesity and Chronic Health Conditions Among Children and Youth. JAMA 2010, 303, 623. [Google Scholar] [CrossRef] [PubMed]
- Perrin, J.M.; Anderson, L.E.; Van Cleave, J. The Rise In Chronic Conditions Among Infants, Children, And Youth Can Be Met With Continued Health System Innovations. Health Aff. 2014, 33, 2099–2105. [Google Scholar] [CrossRef] [PubMed]
- Davidov, E.; Meuleman, B.; Cieciuch, J.; Schmidt, P.; Billiet, J. Measurement Equivalence in Cross-National Research. Annu. Rev. Sociol. 2014, 40, 55–75. [Google Scholar] [CrossRef]
- Gorbunova, A.; Zeldovich, M.; Voormolen, D.; Krenz, U.; Polinder, S.; Haagsma, J.; Hagmayer, Y.; Covic, A.; Real, R.; Asendorf, T.; et al. Reference Values of the QOLIBRI from General Population Samples in the United Kingdom and The Netherlands. J. Clin. Med. 2020, 9, 2100. [Google Scholar] [CrossRef] [PubMed]
- Krenz, U.; Greving, S.; Zeldovich, M.; Haagsma, J.; Polinder, S.; von Steinbüchel, N.; on behalf of the CENTER-TBI Participants and Investigators. Reference Values of the Quality of Life after Brain Injury (QOLIBRI) from a General Population Sample in Italy. J. Clin. Med. 2023, 12, 491. [Google Scholar] [CrossRef]
- Howe, E.I.; Zeldovich, M.; Andelic, N.; Von Steinbuechel, N.; Fure, S.C.R.; Borgen, I.M.H.; Forslund, M.V.; Hellstrøm, T.; Søberg, H.L.; Sveen, U.; et al. Rehabilitation and Outcomes after Complicated vs Uncomplicated Mild TBI: Results from the CENTER-TBI Study. BMC Health Serv. Res. 2022, 22, 1536. [Google Scholar] [CrossRef] [PubMed]
- Di Battista, A.; Soo, C.; Catroppa, C.; Anderson, V. Quality of Life in Children and Adolescents Post-TBI: A Systematic Review and Meta-Analysis. J. Neurotrauma 2012, 29, 1717–1727. [Google Scholar] [CrossRef] [PubMed]
- Heiervang, E.; Goodman, R. Advantages and Limitations of Web-Based Surveys: Evidence from a Child Mental Health Survey. Soc. Psychiatry Psychiatr. Epidemiol. 2011, 46, 69–76. [Google Scholar] [CrossRef] [PubMed]
- Wright, K.B. Researching Internet-Based Populations: Advantages and Disadvantages of Online Survey Research, Online Questionnaire Authoring Software Packages, and Web Survey Services. J. Comput. Mediat. Commun. 2006, 10, JCMC1034. [Google Scholar] [CrossRef]
- Evans, J.R.; Mathur, A. The Value of Online Surveys: A Look Back and a Look Ahead. Internet Res. 2018, 28, 854–887. [Google Scholar] [CrossRef]
- Rutkowski, L.; Svetina, D.; Liaw, Y.-L. Collapsing Categorical Variables and Measurement Invariance. Struct. Equ. Model. A Multidiscip. J. 2019, 26, 790–802. [Google Scholar] [CrossRef]


| Children (n = 1047) | Adolescents (n = 950) | Total (n = 1997) | ||
|---|---|---|---|---|
| Age (years) | Mean (SD) | 10.0 (1.42) | 15.0 (1.39) | 12.4 (2.85) |
| Median [min, max] | 10.0 [8.00, 12.0] | 15.0 [13.0, 17.0] | 12.0 [8.00, 17.0] | |
| Gender | Female | 523 (50.0%) | 484 (50.9%) | 1007 (50.4%) |
| Male | 524 (50.0%) | 465 (48.9%) | 989 (49.5%) | |
| Diverse | 0 (0%) | 1 (0.1%) | 1 (0.1%) | |
| Education | None | 0 (0%) | 6 (0.6%) | 6 (0.3%) |
| Not identified * | 15 (1.4%) | 15 (1.6%) | 30 (1.5%) | |
| Primary school | 556 (53.1%) | 0 (0%) | 556 (27.8%) | |
| Special school | 47 (4.5%) | 36 (3.8%) | 83 (4.2%) | |
| Secondary school | 46 (4.4%) | 73 (7.7%) | 119 (6.0%) | |
| Secondary school/middle school | 190 (18.1%) | 343 (36.1%) | 533 (26.7%) | |
| Vocational school | 0 (0%) | 78 (8.2%) | 78 (3.9%) | |
| Preparatory high school | 193 (18.4%) | 399 (42.0%) | 592 (29.6%) | |
| Integration assistance at school | Yes | 145 (13.8%) | 125 (13.2%) | 270 (13.5%) |
| No | 902 (86.2%) | 819 (86.2%) | 1721 (86.2%) | |
| Missing | 0 (0%) | 6 (0.6%) | 6 (0.3%) | |
| Number of chronic health conditions | One and more | 122 (11.7%) | 127 (13.4%) | 249 (12.5%) |
| None | 925 (88.3%) | 823 (86.6%) | 1748 (87.5%) |
| Scale | Item | Cronbach’s α a | McDonald’s ω | Alpha if Item Omitted a | Item–Total Correlations a | CITC |
|---|---|---|---|---|---|---|
| Cognition | 0.80 | 0.84 | ||||
| Concentration | 0.76 | 0.75 | 0.63 | |||
| Talking to others | 0.77 | 0.69 | 0.55 | |||
| Remembering | 0.76 | 0.71 | 0.58 | |||
| Planning | 0.77 | 0.7 | 0.57 | |||
| Decision between two | 0.79 | 0.62 | 0.46 | |||
| Orientation | 0.80 | 0.54 | 0.36 | |||
| Thinking speed | 0.76 | 0.71 | 0.58 | |||
| Self | 0.80 | 0.83 | ||||
| Energy | 0.77 | 0.73 | 0.55 | |||
| Accomplishment | 0.76 | 0.75 | 0.59 | |||
| Appearance | 0.77 | 0.74 | 0.57 | |||
| Self-esteem | 0.74 | 0.79 | 0.65 | |||
| Future | 0.77 | 0.72 | 0.55 | |||
| Daily Life and Autonomy | 0.80 | 0.83 | ||||
| Daily independence | 0.79 | 0.63 | 0.47 | |||
| Getting out and about | 0.77 | 0.72 | 0.59 | |||
| Manage at school | 0.78 | 0.67 | 0.53 | |||
| Social activities | 0.77 | 0.72 | 0.60 | |||
| Decision making | 0.77 | 0.71 | 0.57 | |||
| Support from others | 0.78 | 0.66 | 0.51 | |||
| Ability to move * | 0.79 | 0.63 | 0.47 | |||
| Social Relationships | 0.84 | 0.86 | ||||
| Open up to others | 0.81 | 0.73 | 0.59 | |||
| Family relationship | 0.82 | 0.69 | 0.54 | |||
| Relationship with friends | 0.81 | 0.76 | 0.63 | |||
| Friendships | 0.80 | 0.77 | 0.64 | |||
| Attitudes of others | 0.80 | 0.79 | 0.68 | |||
| Demands from others | 0.82 | 0.72 | 0.58 | |||
| Emotions | 0.82 | 0.84 | ||||
| Loneliness | 0.81 | 0.76 | 0.57 | |||
| Anxiety | 0.76 | 0.84 | 0.69 | |||
| Sadness | 0.73 | 0.87 | 0.75 | |||
| Anger | 0.81 | 0.77 | 0.59 | |||
| Physical Problems | 0.86 | 0.90 | ||||
| Clumsiness | 0.86 | 0.68 | 0.54 | |||
| Other injuries * | 0.83 | 0.81 | 0.71 | |||
| Headaches | 0.82 | 0.83 | 0.74 | |||
| Pain | 0.82 | 0.86 | 0.78 | |||
| Seeing/Hearing | 0.85 | 0.73 | 0.60 | |||
| Life changes * | 0.85 | 0.71 | 0.58 | |||
| Total score | 0.94 | 0.95 |
| Model | Variable | Reference Category | b | S.E. | t | p |
|---|---|---|---|---|---|---|
| Model without interactions | Intercept | - | 64.52 | 0.94 | 68.68 | <0.001 |
| Age group | Children (8–12 years) | −0.15 | 0.59 | −0.25 | 0.801 | |
| Gender | Female | 1.17 | 0.59 | 1.98 | 0.047 | |
| Health status | At least one chronic health condition | 9.10 | 0.89 | 10.17 | <0.001 | |
| Model with interactions | Intercept | - | 65.32 | 1.49 | 43.76 | <0.001 |
| Age group | Children (8–12 years) | −4.19 | 1.77 | −2.37 | 0.018 | |
| Gender | Female | 1.72 | 1.77 | 0.97 | 0.333 | |
| Health status | At least one chronic health condition | 9.20 | 1.56 | 5.91 | <0.001 | |
| Age group * Gender | Children * Female | 3.76 | 1.18 | 3.19 | 0.001 | |
| Age group * Health status | Children * At least one chronic health condition | 2.49 | 1.78 | 1.40 | 0.163 | |
| Gender * Health status | Female * At least one chronic health condition | −2.66 | 1.78 | −1.49 | 0.136 |
| Samples | Constraints | χ2 (df) | p | χ2/df | CFI | TLI | RMSEA [90% CI] | SRMR | χ2 (df) | Δ χ2 | Δ df | p |
|---|---|---|---|---|---|---|---|---|---|---|---|---|
| General population sample vs. TBI sample | baseline | 4006.65 (1090) | <0.001 | 3.77 | 0.96 | 0.95 | 0.049 [0.047, 0.050] | 0.054 | 4476.6 (1090) | - | - | - |
| thresholds | 4042.66 (1125) | <0.001 | 3.59 | 0.96 | 0.95 | 0.048 [0.046, 0.049] | 0.054 | 4498.7 (1125) | 48.522 | 35 | 0.064 | |
| thresholds and loadings | 3973.81 (1154) | <0.001 | 3.44 | 0.96 | 0.96 | 0.046 [0.045, 0.048] | 0.054 | 4620.0 (1154) | 75.773 | 29 | <0.001 |
| Low Quality of Life | −1 SD | Md | +1 SD | High Quality of Life | ||||||||||
|---|---|---|---|---|---|---|---|---|---|---|---|---|---|---|
| Gender | Age | Scale | n | 2.50% | 5% | 16% | 30% | 40% | 50% | 60% | 70% | 85% | 95% | 97.50% |
| Male | 8–12 | Total Score | 462 | 50 | 55 | 62 | 68 | 71 | 73 | 76 | 80 | 86 | 95 | 100 |
| Cognition | 46 | 50 | 64 | 68 | 71 | 75 | 79 | 82 | 89 | 100 | 100 | |||
| Self | 45 | 50 | 60 | 70 | 70 | 75 | 80 | 85 | 95 | 100 | 100 | |||
| Daily Life and Autonomy | 50 | 57 | 68 | 71 | 75 | 79 | 82 | 86 | 93 | 100 | 100 | |||
| Social Relationships | 50 | 54 | 67 | 71 | 75 | 79 | 83 | 88 | 96 | 100 | 100 | |||
| Emotions | 12 | 25 | 44 | 52 | 62 | 69 | 75 | 81 | 94 | 100 | 100 | |||
| Physical Problems | 12 | 17 | 38 | 50 | 58 | 67 | 75 | 79 | 92 | 100 | 100 | |||
| 13–17 | Total Score | 401 | 46 | 52 | 64 | 70 | 74 | 76 | 79 | 81 | 89 | 97 | 100 | |
| Cognition | 43 | 50 | 61 | 71 | 75 | 79 | 82 | 86 | 93 | 100 | 100 | |||
| Self | 40 | 50 | 60 | 70 | 70 | 75 | 75 | 80 | 90 | 100 | 100 | |||
| Daily Life and Autonomy | 46 | 50 | 68 | 75 | 79 | 82 | 86 | 89 | 96 | 100 | 100 | |||
| Social Relationships | 50 | 50 | 62 | 71 | 75 | 79 | 83 | 88 | 96 | 100 | 100 | |||
| Emotions | 25 | 31 | 50 | 62 | 69 | 75 | 81 | 88 | 94 | 100 | 100 | |||
| Physical Problems | 17 | 25 | 46 | 58 | 67 | 75 | 79 | 88 | 96 | 100 | 100 | |||
| Female | 8–12 | Total Score | 463 | 48 | 54 | 62 | 68 | 71 | 75 | 78 | 82 | 87 | 96 | 100 |
| Cognition | 48 | 54 | 64 | 70 | 75 | 75 | 82 | 82 | 89 | 100 | 100 | |||
| Self | 40 | 50 | 65 | 70 | 75 | 75 | 80 | 85 | 95 | 100 | 100 | |||
| Daily Life and Autonomy | 50 | 54 | 68 | 75 | 79 | 82 | 86 | 89 | 93 | 100 | 100 | |||
| Social Relationships | 46 | 50 | 67 | 71 | 75 | 79 | 83 | 88 | 92 | 100 | 100 | |||
| Emotions | 12 | 19 | 38 | 56 | 62 | 69 | 75 | 81 | 94 | 100 | 100 | |||
| Physical Problems | 12 | 21 | 37 | 54 | 62 | 71 | 75 | 83 | 92 | 100 | 100 | |||
| 13–17 | Total Score | 422 | 47 | 49 | 61 | 66 | 69 | 73 | 76 | 81 | 88 | 95 | 97 | |
| Cognition | 46 | 50 | 61 | 68 | 71 | 75 | 79 | 82 | 89 | 96 | 100 | |||
| Self | 40 | 45 | 55 | 65 | 70 | 75 | 78 | 85 | 90 | 95 | 100 | |||
| Daily Life and Autonomy | 46 | 50 | 68 | 72 | 75 | 82 | 86 | 89 | 96 | 100 | 100 | |||
| Social Relationships | 42 | 50 | 67 | 71 | 75 | 79 | 82 | 88 | 92 | 100 | 100 | |||
| Emotions | 12 | 19 | 38 | 50 | 62 | 69 | 75 | 81 | 94 | 100 | 100 | |||
| Physical Problems | 17 | 21 | 38 | 50 | 58 | 67 | 75 | 83 | 92 | 100 | 100 | |||
| Total Score | 1748 | 47 | 53 | 62 | 68 | 71 | 74 | 77 | 81 | 88 | 96 | 100 | ||
Disclaimer/Publisher’s Note: The statements, opinions and data contained in all publications are solely those of the individual author(s) and contributor(s) and not of MDPI and/or the editor(s). MDPI and/or the editor(s) disclaim responsibility for any injury to people or property resulting from any ideas, methods, instructions or products referred to in the content. |
© 2024 by the authors. Licensee MDPI, Basel, Switzerland. This article is an open access article distributed under the terms and conditions of the Creative Commons Attribution (CC BY) license (https://creativecommons.org/licenses/by/4.0/).
Share and Cite
Krol, L.; Hagmayer, Y.; Steinbuechel, N.v.; Cunitz, K.; Buchheim, A.; Koerte, I.K.; Zeldovich, M. Reference Values for the German Version of the Quality of Life after Brain Injury in Children and Adolescents (QOLIBRI-KID/ADO) from a General Population Sample. J. Pers. Med. 2024, 14, 336. https://doi.org/10.3390/jpm14040336
Krol L, Hagmayer Y, Steinbuechel Nv, Cunitz K, Buchheim A, Koerte IK, Zeldovich M. Reference Values for the German Version of the Quality of Life after Brain Injury in Children and Adolescents (QOLIBRI-KID/ADO) from a General Population Sample. Journal of Personalized Medicine. 2024; 14(4):336. https://doi.org/10.3390/jpm14040336
Chicago/Turabian StyleKrol, Leonie, York Hagmayer, Nicole von Steinbuechel, Katrin Cunitz, Anna Buchheim, Inga K. Koerte, and Marina Zeldovich. 2024. "Reference Values for the German Version of the Quality of Life after Brain Injury in Children and Adolescents (QOLIBRI-KID/ADO) from a General Population Sample" Journal of Personalized Medicine 14, no. 4: 336. https://doi.org/10.3390/jpm14040336
APA StyleKrol, L., Hagmayer, Y., Steinbuechel, N. v., Cunitz, K., Buchheim, A., Koerte, I. K., & Zeldovich, M. (2024). Reference Values for the German Version of the Quality of Life after Brain Injury in Children and Adolescents (QOLIBRI-KID/ADO) from a General Population Sample. Journal of Personalized Medicine, 14(4), 336. https://doi.org/10.3390/jpm14040336