
Statistical Analysis of nnU-Net Models for Lung Nodule Segmentation


Abstract

1. Introduction
2. Materials and Methods
2.1. Architectures and Related Works
2.2. Data Resource
2.3. Models and Preprocessing
2.4. Statistical Analysis
- 1.
- Parameter and Level Definitions: The first step involved selecting the parameters of the deep learning model to be analyzed and defining different levels for them. We selected the following ones:
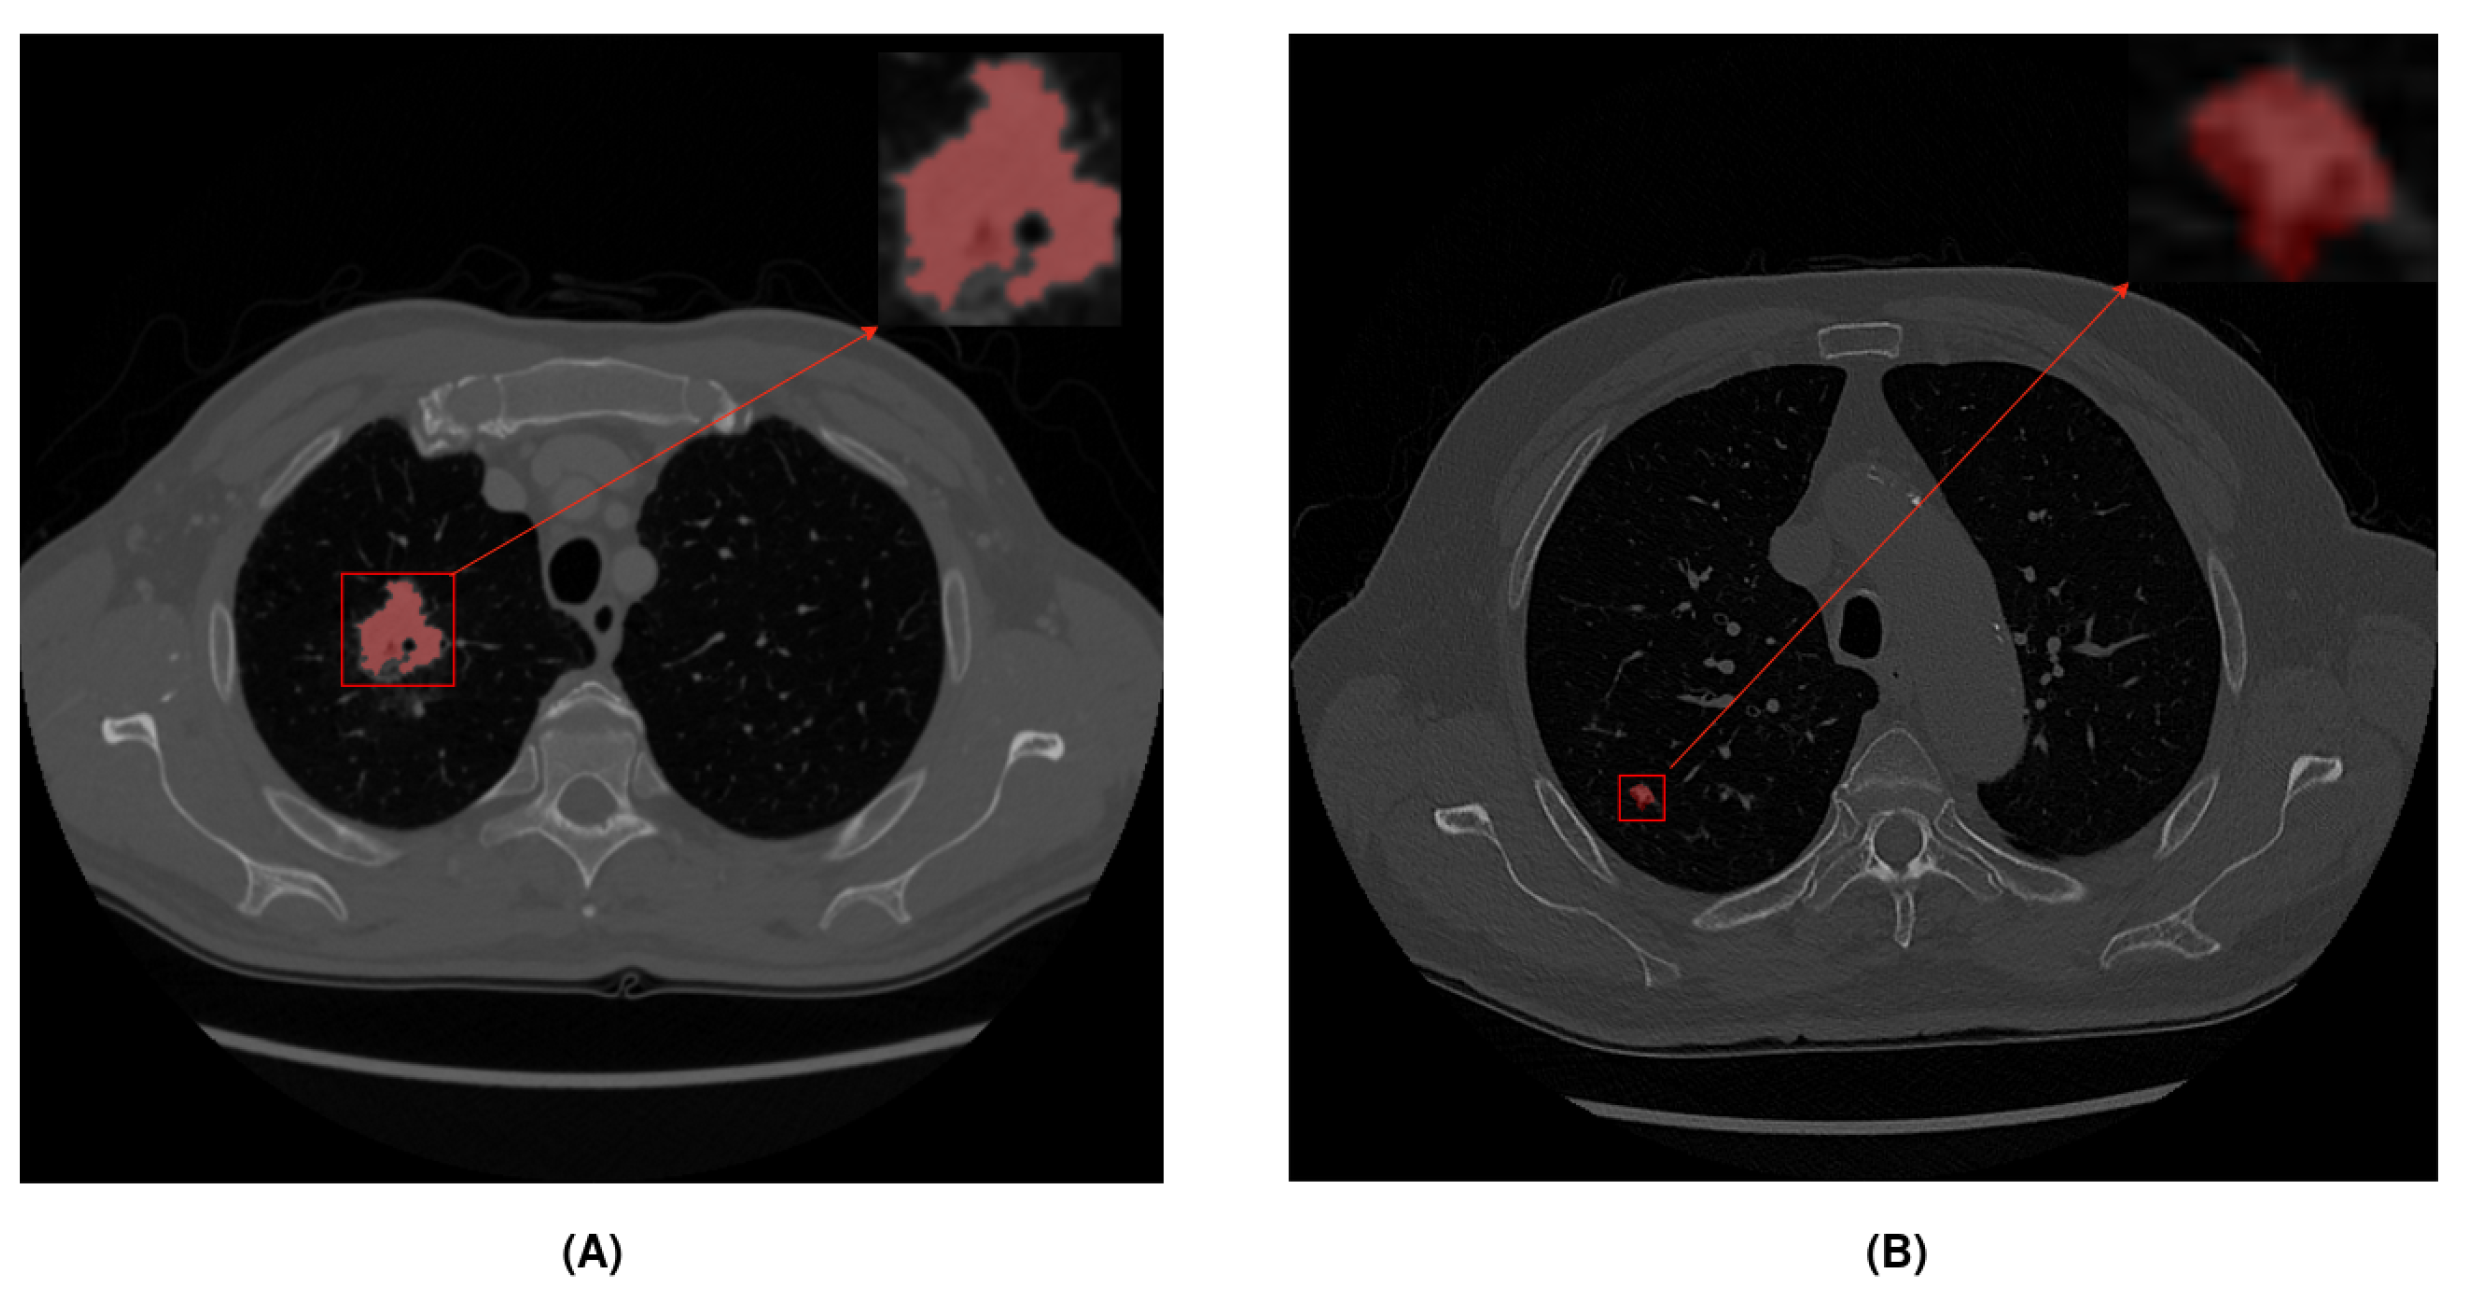
- Dataset: We used two different datasets with large and small nodules to study the impact of nodule diameter size in the model (see Table 3).
- Model: We used two different models provided by nnU-Net to study the impact of using residual connections in the encoder of U-Net (see Table 4). The first model was a classic U-Net implementation, and the second was a modified encoder using residual connections like ResNet architecture, in addition to the skip connections of U-Net.
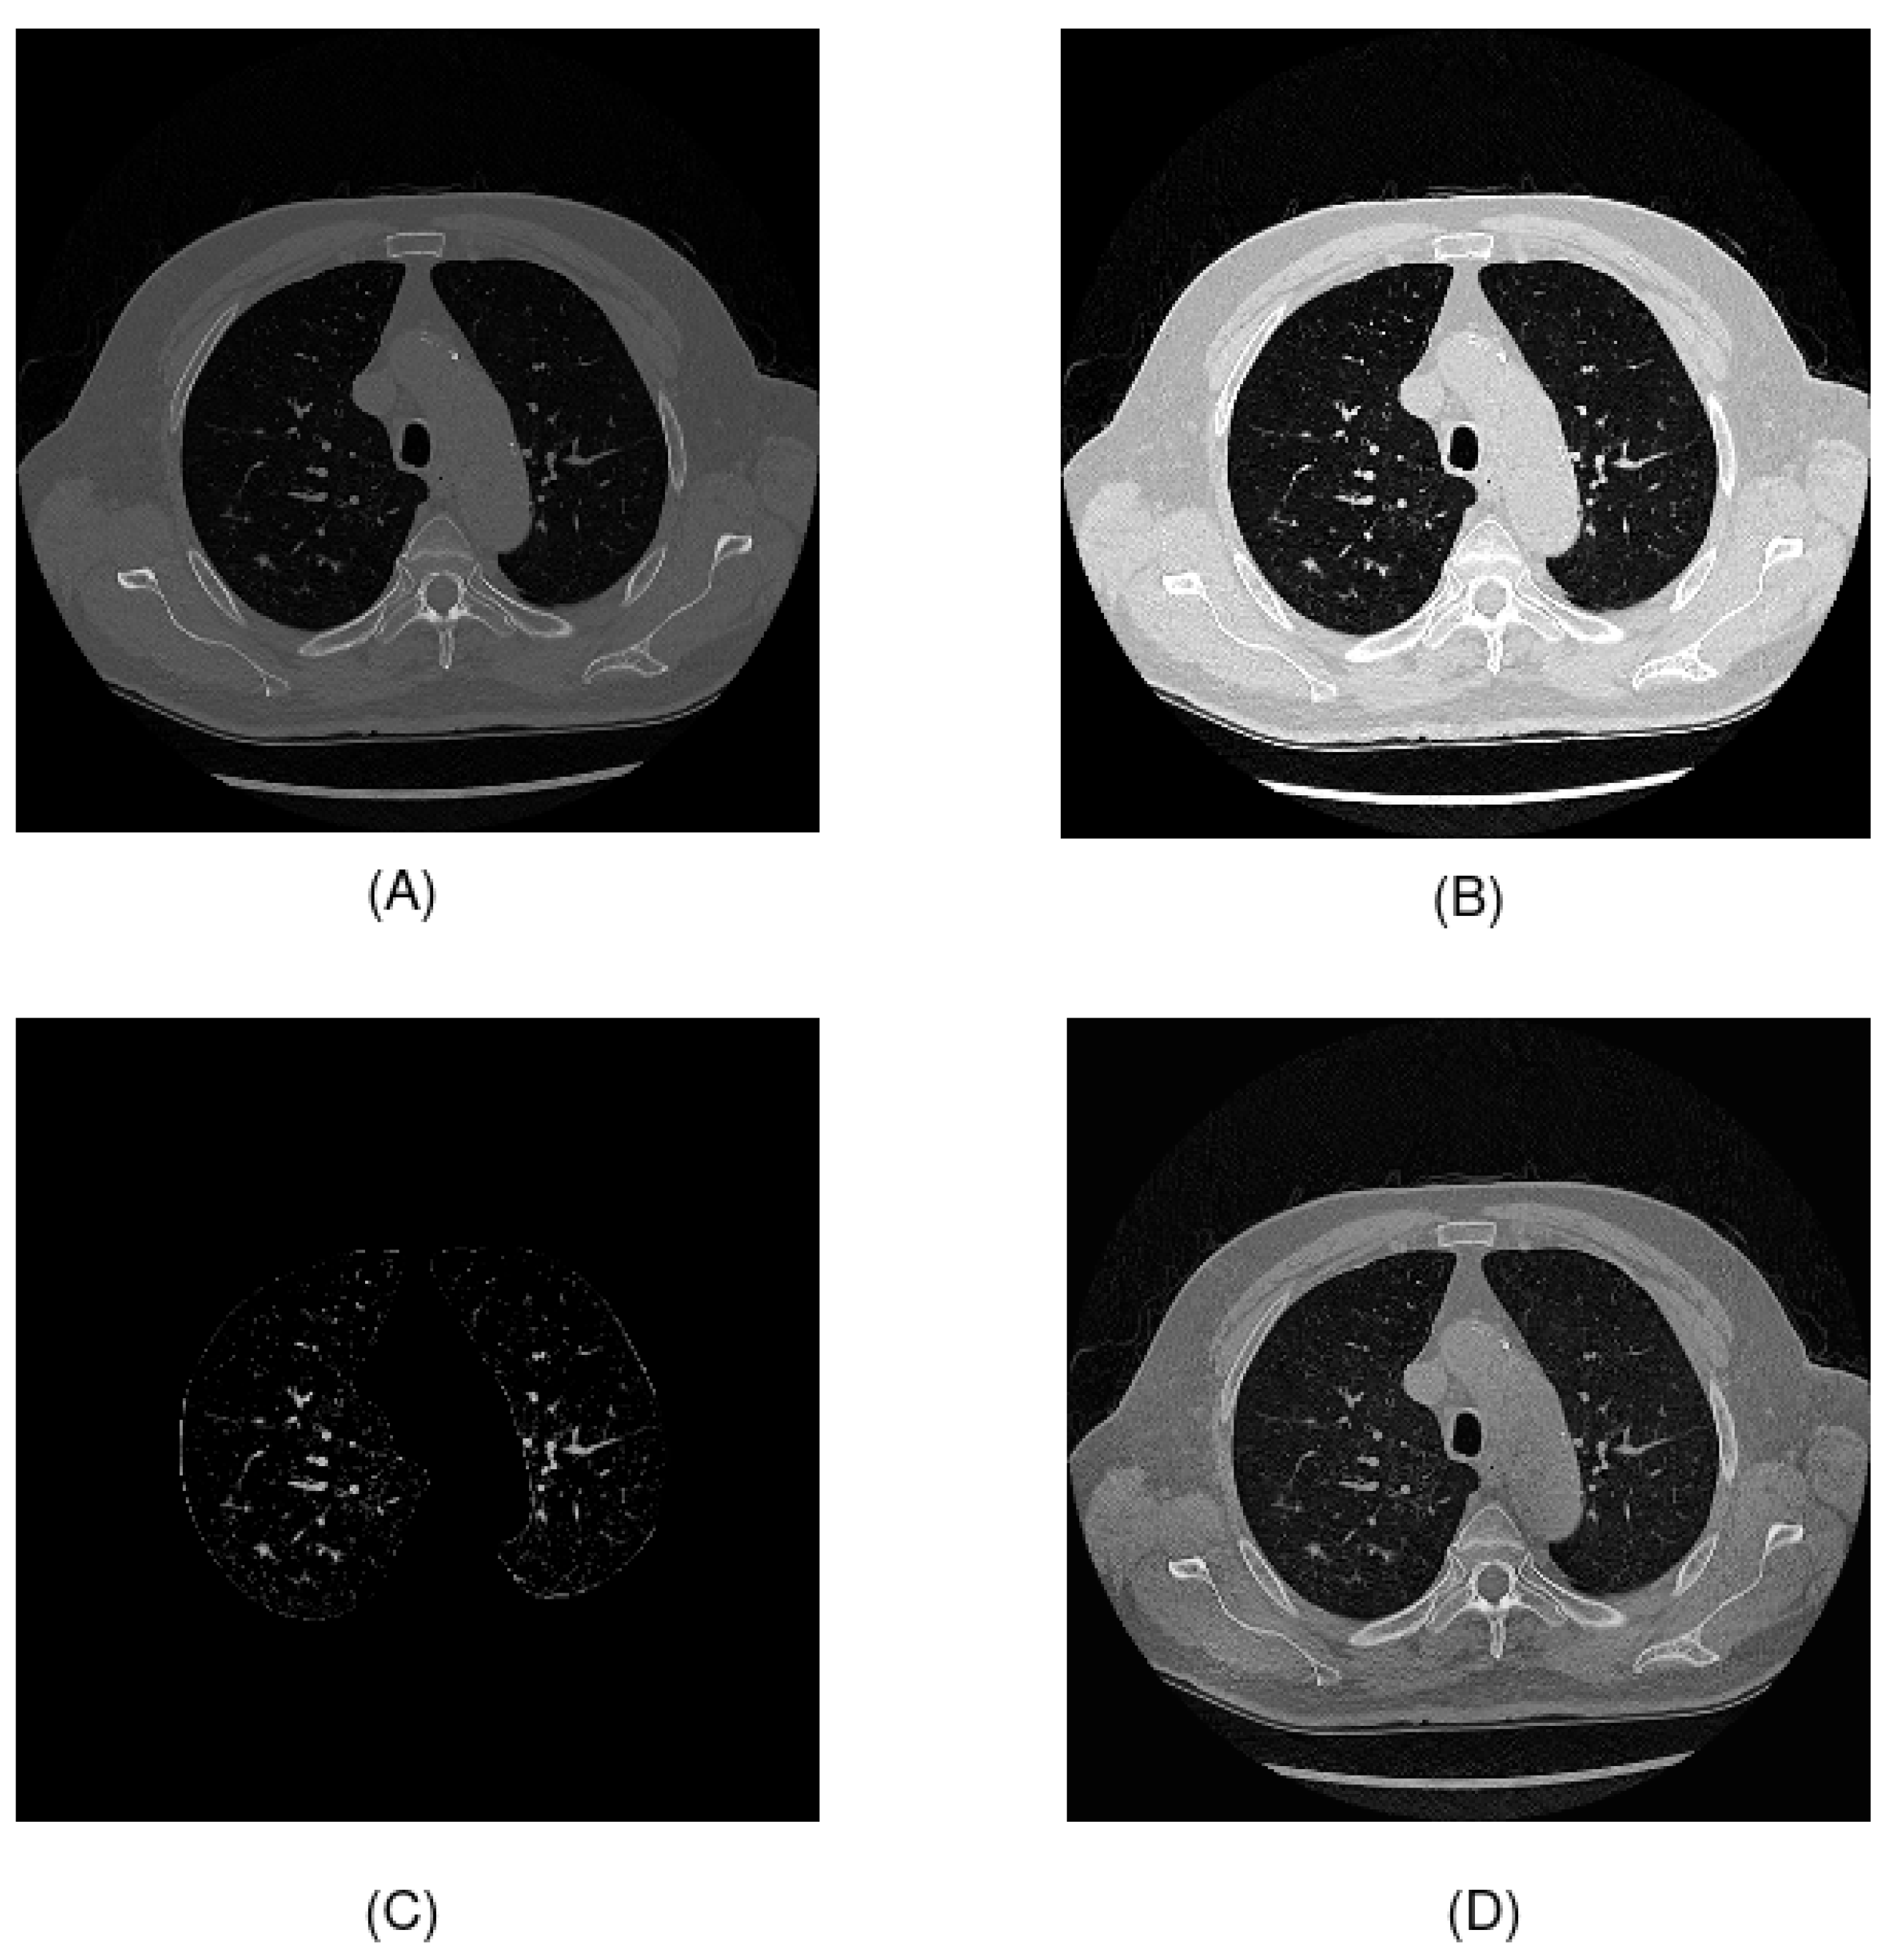
- Preprocessing: In the literature, many preprocessing techniques have been applied to CT scans. In this study, we used windowing, which is one of the most common techniques to enhance contrast (see Table 5). We preprocessed Hounsfield unit values by removing noise elements, following the original preprocessing of the UniToChest paper, and we evaluated two proposed preprocessing techniques, which consisted of segmenting the lung area, using the U-Net R231 model and thresholding to highlight nodules, and using CLAHE for contrast enhancement.
- Polynomial learning rate scheduler: This is a technique to reduce the learning rate gradually. The scheduler depends on three factors: initial learning rate, number of epochs, and power. The polynomial learning rate scheduler follows the following equation:where is the learning rate at epoch t, is the initial learning rate, T is the total number of epochs, and p is the power of the polynomial.A smaller exponent causes the learning rate to decay more slowly at the beginning of training and decay more rapidly at the end. However, a larger exponent will cause the learning rate to decay faster at the beginning and slowly at the end. During this analysis, we focused on the exponent rather than the initial learning rate, which was fixed at 0.01. We evaluated different exponent values, as shown in Table 6, including the recommended value provided by nnU-Net (0.90).
- Epochs: Number of epochs during training. We evaluated different numbers of epochs to study the impact on model performance and training time, as illustrated in Table 7.
- Model Training and Data Collection: We trained a model for each combination of parameters. For each run, we stored the results of the segmentation metrics that evaluated the performance of the model and the time to obtain it. This generated a tabular dataset, where each column represented the results of a specific parameter value and each row corresponded to an experiment. A total of 144 experiments were performed, using all possible combinations. For this analysis, we used the mean dice score coefficient (DSC) of the images in the test subset. DSC is one of the most common metrics used in lung nodule segmentation, and it measures the similarity between two masks.
- ANOVA Analysis: ANOVA consists of comparing between-group and within-group variability.
- -
- Null hypothesis (): The means of the segmentation metrics for different parameter values are equal.
- -
- Alternative hypothesis (): At least a mean of the segmentation metric is different.
We calculated the F statistic to compare between-group and within-group variability. If the F value was significantly large then the null hypothesis was rejected.If the null hypothesis was rejected, it could be concluded that the variation in the parameter significantly affected the accuracy of the model. Otherwise, we could not conclude that parameter had a significant impact.In this paper, we performed two-way ANOVA, a statistical method used to examine the influence of two independent categorical variables on one continuous dependent variable. This helped us to understand not only the individual effects of each factor but also how they worked together, providing a comprehensive view of the influences on the dice score metric and training time.
3. Results and Discussion
3.1. Two-Way Analysis of Variance for Dice Score
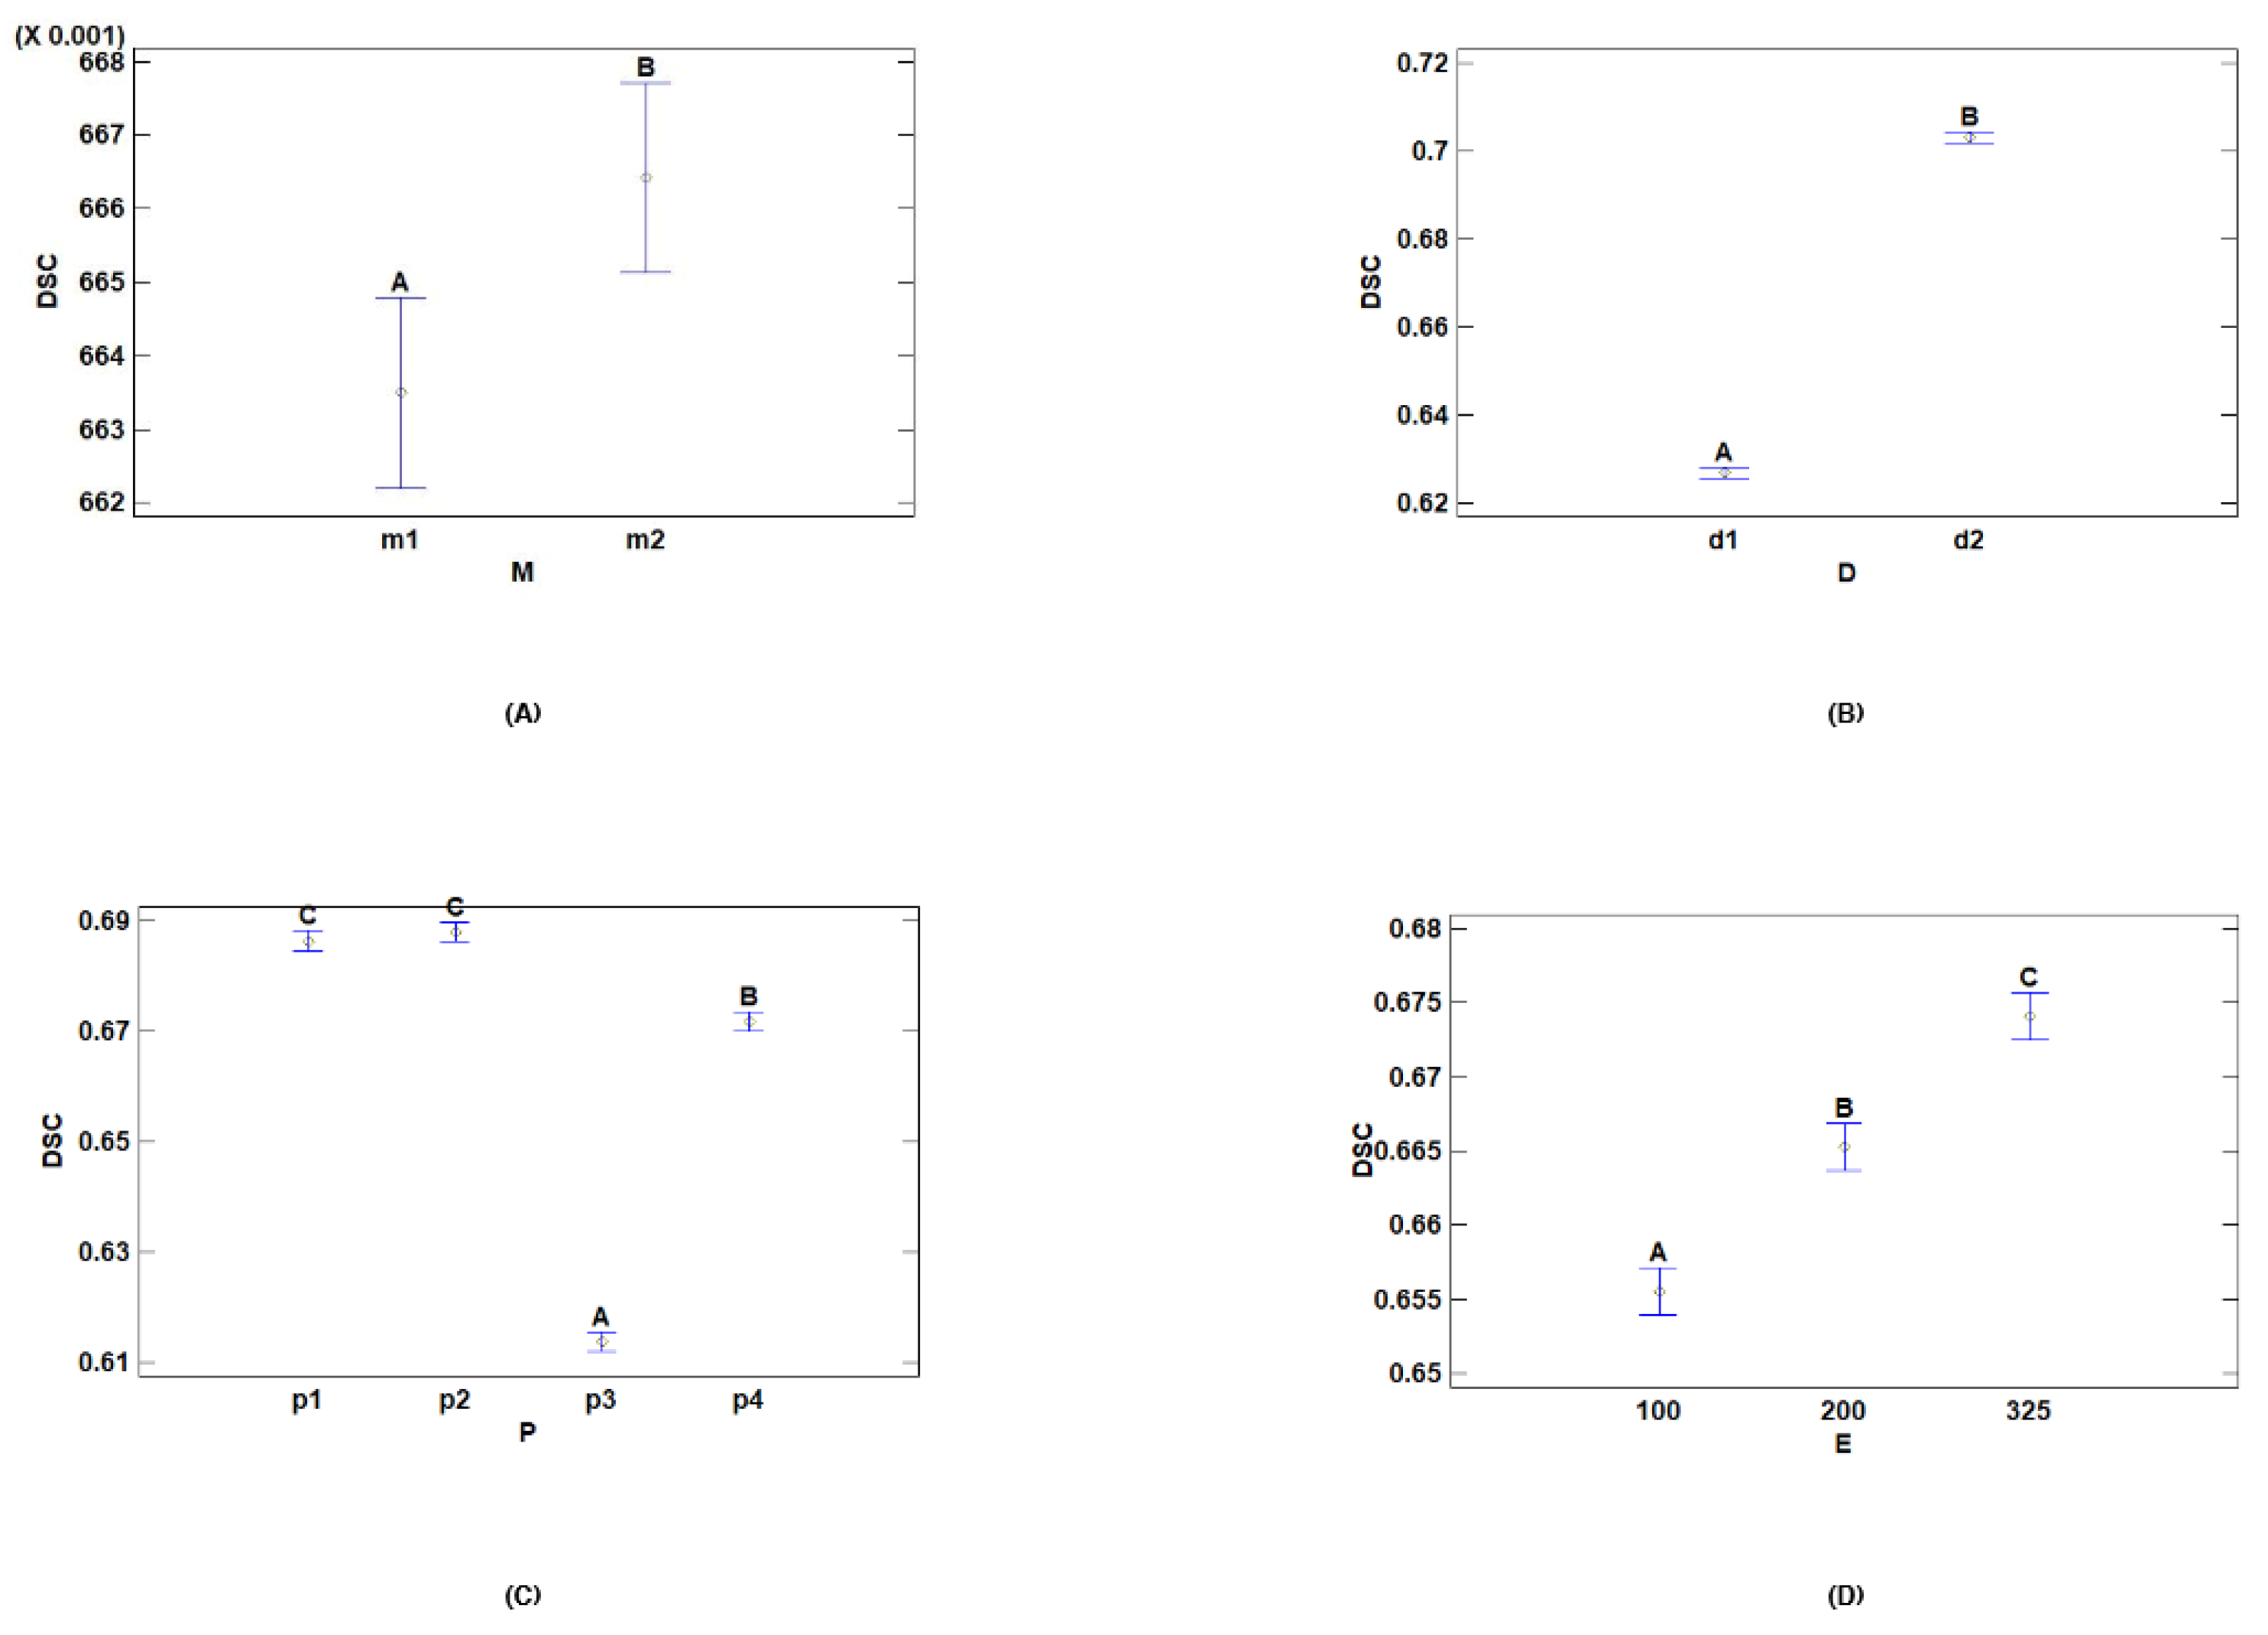
- Multiple Range Tests for DSC by Dataset
- Multiple Range Tests for DSC by Model
- Multiple Range Tests for DSC by Preprocessing
- Multiple Range Tests for DSC by Epochs
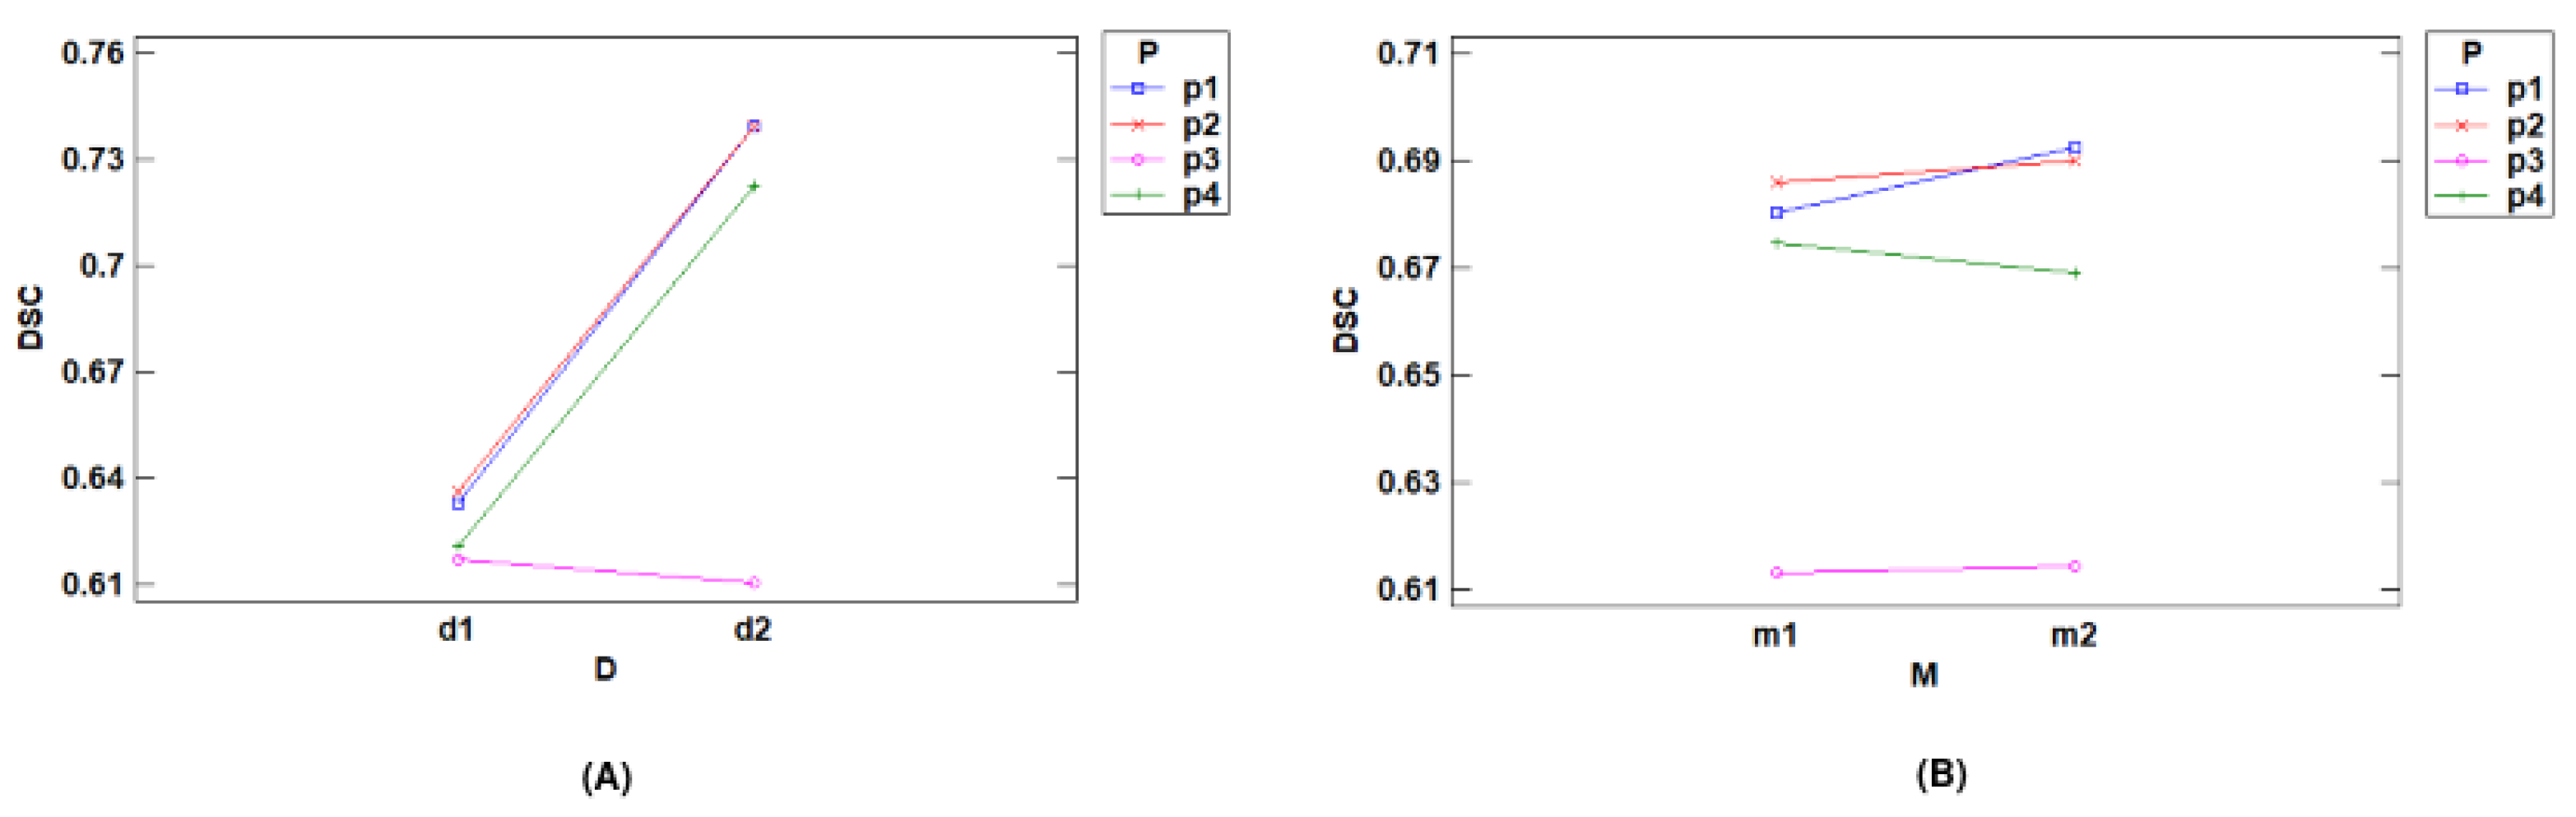
- Interactions with DSC
3.2. Two-Way Analysis of Variance over Time
- Multiple Range Tests for Time (s) by Model
- Multiple Range Tests for Time (s) by Preprocessing
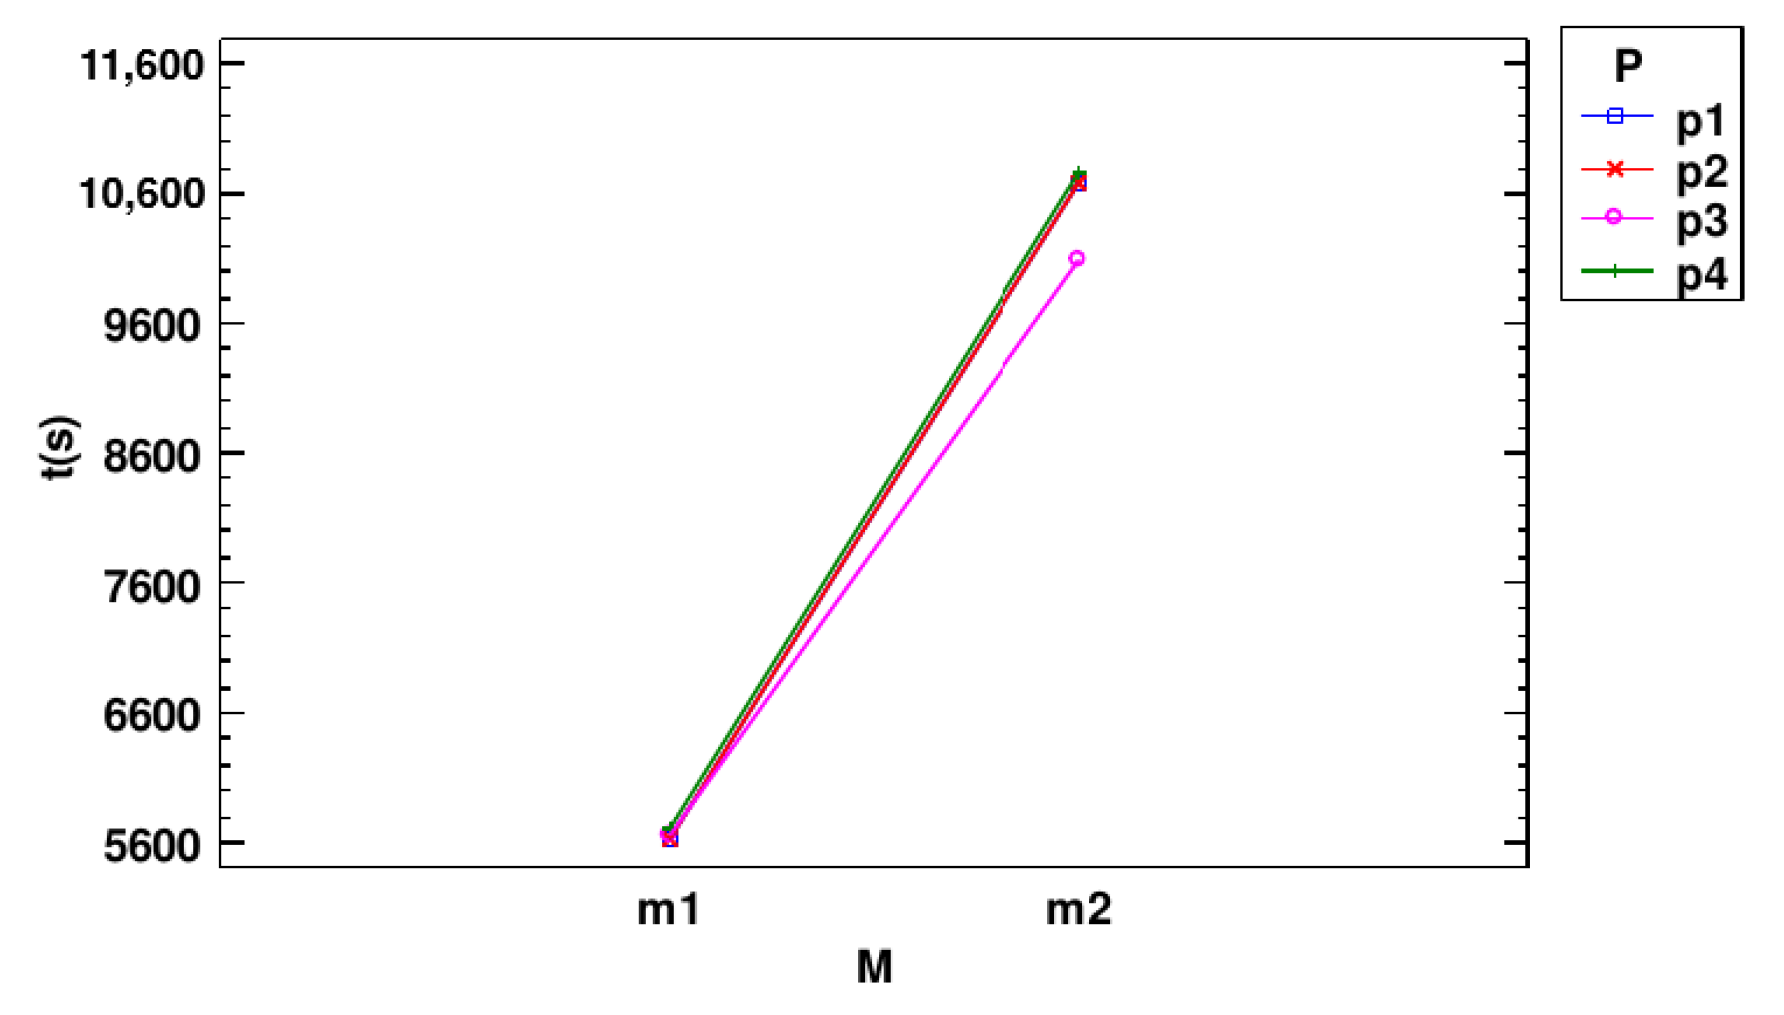
- Interactions with Time (s)
4. Conclusions
Author Contributions
Funding
Data Availability Statement
Acknowledgments
Conflicts of Interest
References
- Bray, F.; Laversanne, M.; Sung, H.; Ferlay, J.; Siegel, R.L.; Soerjomataram, I.; Jemal, A. Global cancer statistics 2022: GLOBOCAN estimates of incidence and mortality worldwide for 36 cancers in 185 countries. CA Cancer J. Clin. 2024, 74, 229–263. [Google Scholar] [CrossRef] [PubMed]
- Siegel, R.L.; Giaquinto, A.N.; Jemal, A. Cancer statistics, 2024. CA Cancer J. Clin. 2024, 74, 12–49. [Google Scholar] [CrossRef]
- Santucci, C.; Mignozzi, S.; Malvezzi, M.; Boffetta, P.; Collatuzzo, G.; Levi, F.; La Vecchia, C.; Negri, E. European cancer mortality predictions for the year 2024 with focus on colorectal cancer. Ann. Oncol. 2024, 35, 308–316. [Google Scholar] [CrossRef] [PubMed]
- Loverdos, K.; Fotiadis, A.; Kontogianni, C.; Iliopoulou, M.; Gaga, M. Lung nodules: A comprehensive review on current approach and management. Ann. Thorac. Med. 2019, 14, 226. [Google Scholar] [CrossRef]
- Mazzone, P.J.; Lam, L. Evaluating the Patient with a Pulmonary Nodule: A Review. JAMA 2022, 327, 264–273. [Google Scholar] [CrossRef] [PubMed]
- Wahidi, M.M.; Govert, J.A.; Goudar, R.K.; Gould, M.K.; McCrory, D.C. Evidence for the Treatment of Patients with Pulmonary Nodules: When Is It Lung Cancer?: ACCP Evidence-Based Clinical Practice Guidelines (2nd Edition). CHEST 2007, 132, 94S–107S. [Google Scholar] [CrossRef]
- Sánchez, M.; Benegas, M.; Vollmer, I. Management of incidental lung nodules <8 mm in diameter. J. Thorac. Dis. 2018, 10, S2611–S2627. [Google Scholar] [CrossRef]
- Cruickshank, A.; Stieler, G.; Ameer, F. Evaluation of the solitary pulmonary nodule. Intern. Med. J. 2019, 49, 306–315. [Google Scholar] [CrossRef]
- Shi, C.Z.; Zhao, Q.; Luo, L.P.; He, J.X. Size of solitary pulmonary nodule was the risk factor of malignancy. J. Thorac. Dis. 2014, 6, 668. [Google Scholar] [CrossRef]
- Kostis, W.J.; Reeves, A.P.; Yankelevitz, D.F.; Henschke, C.I. Three-dimensional segmentation and growth-rate estimation of small pulmonary nodules in helical CT images. IEEE Trans. Med. Imaging 2003, 22, 1259–1274. [Google Scholar] [CrossRef]
- Kubota, T.; Jerebko, A.K.; Dewan, M.; Salganicoff, M.; Krishnan, A. Segmentation of pulmonary nodules of various densities with morphological approaches and convexity models. Med. Image Anal. 2011, 15, 133–154. [Google Scholar] [CrossRef] [PubMed]
- Nithila, E.E.; Kumar, S.S. Segmentation of lung nodule in CT data using active contour model and Fuzzy C-mean clustering. Alex. Eng. J. 2016, 55, 2583–2588. [Google Scholar] [CrossRef]
- Allioui, H.; Mohammed, M.A.; Benameur, N.; Al-Khateeb, B.; Abdulkareem, K.H.; Garcia-Zapirain, B.; Damaševičius, R.; Maskeliūnas, R. A Multi-Agent Deep Reinforcement Learning Approach for Enhancement of COVID-19 CT Image Segmentation. J. Pers. Med. 2022, 12, 309. [Google Scholar] [CrossRef] [PubMed]
- Mahmood, T.; Owais, M.; Noh, K.J.; Yoon, H.S.; Koo, J.H.; Haider, A.; Sultan, H.; Park, K.R. Accurate Segmentation of Nuclear Regions with Multi-Organ Histopathology Images Using Artificial Intelligence for Cancer Diagnosis in Personalized Medicine. J. Pers. Med. 2021, 11, 515. [Google Scholar] [CrossRef]
- Armato, S.G.; McLennan, G.; Bidaut, L.; McNitt-Gray, M.F.; Meyer, C.R.; Reeves, A.P.; Zhao, B.; Aberle, D.R.; Henschke, C.I.; Hoffman, E.A.; et al. The Lung Image Database Consortium (LIDC) and Image Database Resource Initiative (IDRI): A Completed Reference Database of Lung Nodules on CT Scans. Med. Phys. 2011, 38, 915–931. [Google Scholar] [CrossRef]
- Setio, A.A.A.; Traverso, A.; de Bel, T.; Berens, M.S.N.; Bogaard, C.v.d.; Cerello, P.; Chen, H.; Dou, Q.; Fantacci, M.E.; Geurts, B.; et al. Validation, comparison, and combination of algorithms for automatic detection of pulmonary nodules in computed tomography images: The LUNA16 challenge. Med. Image Anal. 2017, 42, 1–13. [Google Scholar] [CrossRef]
- Sweetline, B.C.; Vijayakumaran, C.; Samydurai, A. Overcoming the Challenge of Accurate Segmentation of Lung Nodules: A Multi-crop CNN Approach. J. Imaging Inform. Med. 2024, 37, 988–1007. [Google Scholar] [CrossRef]
- Jiang, W.; Zhi, L.; Zhang, S.; Zhou, T. A Dual-Branch Framework with Prior Knowledge for Precise Segmentation of Lung Nodules in Challenging CT Scans. IEEE J. Biomed. Health Inform. 2024, 28, 1540–1551. [Google Scholar] [CrossRef] [PubMed]
- Cao, H.; Liu, H.; Song, E.; Hung, C.C.; Ma, G.; Xu, X.; Jin, R.; Lu, J. Dual-branch residual network for lung nodule segmentation. Appl. Soft Comput. 2020, 86, 105934. [Google Scholar] [CrossRef]
- Savic, M.; Ma, Y.; Ramponi, G.; Du, W.; Peng, Y. Lung Nodule Segmentation with a Region-Based Fast Marching Method. Sensors 2021, 21, 1908. [Google Scholar] [CrossRef]
- Zhang, G.; Jiang, S.; Yang, Z.; Gong, L.; Ma, X.; Zhou, Z.; Bao, C.; Liu, Q. Automatic nodule detection for lung cancer in CT images: A review. Comput. Biol. Med. 2018, 103, 287–300. [Google Scholar] [CrossRef] [PubMed]
- Isensee, F.; Jaeger, P.F.; Kohl, S.A.A.; Petersen, J.; Maier-Hein, K.H. nnU-Net: A self-configuring method for deep learning-based biomedical image segmentation. Nat. Methods 2021, 18, 203–211. [Google Scholar] [CrossRef] [PubMed]
- Ronneberger, O.; Fischer, P.; Brox, T. U-Net: Convolutional Networks for Biomedical Image Segmentation. arXiv 2015, arXiv:1505.04597. [Google Scholar] [CrossRef]
- Chaudhry, H.A.H.; Renzulli, R.; Perlo, D.; Santinelli, F.; Tibaldi, S.; Cristiano, C.; Grosso, M.; Limerutti, G.; Fiandrotti, A.; Grangetto, M.; et al. UniToChest: A Lung Image Dataset for Segmentation of Cancerous Nodules on CT Scans. In Proceedings of the Image Analysis and Processing—ICIAP 2022; Sclaroff, S., Distante, C., Leo, M., Farinella, G.M., Tombari, F., Eds.; Springer: Cham, Switzerland, 2022; pp. 185–196. [Google Scholar] [CrossRef]
- Yu, F.; Koltun, V. Multi-Scale Context Aggregation by Dilated Convolutions. arXiv 2016, arXiv:1511.07122. [Google Scholar]
- Selvadass, S.; Bruntha, P.M.; Sagayam, K.M.; Günerhan, H. SAtUNet: Series atrous convolution enhanced U-Net for lung nodule segmentation. Int. J. Imaging Syst. Technol. 2024, 34, e22964. [Google Scholar] [CrossRef]
- Halder, A.; Dey, D. Atrous convolution aided integrated framework for lung nodule segmentation and classification. Biomed. Signal Process. Control 2023, 82, 104527. [Google Scholar] [CrossRef]
- Maqsood, M.; Yasmin, S.; Mehmood, I.; Bukhari, M.; Kim, M. An Efficient DA-Net Architecture for Lung Nodule Segmentation. Mathematics 2021, 9, 1457. [Google Scholar] [CrossRef]
- Zhou, Z.; Siddiquee, M.M.R.; Tajbakhsh, N.; Liang, J. UNet++: Redesigning Skip Connections to Exploit Multiscale Features in Image Segmentation. IEEE Trans. Med. Imaging 2020, 39, 1856–1867. [Google Scholar] [CrossRef]
- Forte, G.C.; Altmayer, S.; Silva, R.F.; Stefani, M.T.; Libermann, L.L.; Cavion, C.C.; Youssef, A.; Forghani, R.; King, J.; Mohamed, T.L.; et al. Deep Learning Algorithms for Diagnosis of Lung Cancer: A Systematic Review and Meta-Analysis. Cancers 2022, 14, 3856. [Google Scholar] [CrossRef]
- Thanoon, M.A.; Zulkifley, M.A.; Mohd Zainuri, M.A.A.; Abdani, S.R. A Review of Deep Learning Techniques for Lung Cancer Screening and Diagnosis Based on CT Images. Diagnostics 2023, 13, 2617. [Google Scholar] [CrossRef]
- Fusco, R.; Grassi, R.; Granata, V.; Setola, S.V.; Grassi, F.; Cozzi, D.; Pecori, B.; Izzo, F.; Petrillo, A. Artificial Intelligence and COVID-19 Using Chest CT Scan and Chest X-ray Images: Machine Learning and Deep Learning Approaches for Diagnosis and Treatment. J. Pers. Med. 2021, 11, 993. [Google Scholar] [CrossRef] [PubMed]
- Chen, W.; Wang, Y.; Tian, D.; Yao, Y. CT Lung Nodule Segmentation: A Comparative Study of Data Preprocessing and Deep Learning Models. IEEE Access 2023, 11, 34925–34931. [Google Scholar] [CrossRef]
- Isensee, F.; Wald, T.; Ulrich, C.; Baumgartner, M.; Roy, S.; Maier-Hein, K.; Jaeger, P.F. nnU-Net Revisited: A Call for Rigorous Validation in 3D Medical Image Segmentation. arXiv 2024, arXiv:2404.09556. [Google Scholar]
- Hofmanninger, J.; Prayer, F.; Pan, J.; Röhrich, S.; Prosch, H.; Langs, G. Automatic lung segmentation in routine imaging is primarily a data diversity problem, not a methodology problem. Eur. Radiol. Exp. 2020, 4, 50. [Google Scholar] [CrossRef]


| Original Splits | Big Nodules (>10 mm) | Small Nodules (<10 mm) | |
|---|---|---|---|
| Train | 18,534 | 11,445 | 7089 |
| Validation | 1712 | 1132 | 580 |
| Test | 2467 | 1514 | 953 |
| Total | 22,713 | 14,091 | 8622 |
| nnU-Net Configuration | |
|---|---|
| Loss function | Dice and cross-entropy |
| Optimizer | SGD with Nesterov momentum ( = 0.99) |
| Initial learning rate | 0.01 |
| Data augmentation | Rotations, scaling, Gaussian noise, Gaussian blur, brightness, contrast, simulation of low resolution, gamma correction and mirroring |
| Dataset (D) | |
|---|---|
| Level | Description |
| d1 | Small nodules subset |
| d2 | Big nodules subset |
| Model (M) | |
|---|---|
| Level | Description |
| m1 | Basic U-Net |
| m2 | ResEncUNetM |
| Preprocessing (P) | |
|---|---|
| Level | Description |
| p1 | Hounsfield units preprocessing |
| p2 | Windowing preprocessing |
| p3 | U-Net R231 lung segmentation + thresholding |
| p4 | Contrast enhancement using CLAHE |
| Polynomial Learning Rate Scheduler (Pl) | |
|---|---|
| Level | Description |
| pl1 | 0.50 |
| pl2 | 0.75 |
| pl3 | 0.90 |
| Epochs (E) | |
|---|---|
| Level | Description |
| e1 | 100 |
| e2 | 200 |
| e3 | 325 |
| Source | Sum of Squares | Df | Mean Square | F-Ratio | p-Value |
|---|---|---|---|---|---|
| Main Effects | |||||
| A: Dataset | 0.4175 | 1 | 0.4175 | 3356.80 | 0.0000 |
| B: Model | 0.000614836 | 1 | 0.000614836 | 4.94 | 0.0271 |
| C: Preprocessing | 0.263374 | 3 | 0.0877914 | 705.86 | 0.0000 |
| D: Polynomial Scheduler | 0.000128853 | 2 | 0.0000644265 | 0.52 | 0.5964 |
| E: Epochs | 0.0165057 | 2 | 0.00825287 | 66.36 | 0.0000 |
| Interactions | |||||
| AB | 0.000404227 | 1 | 0.000404227 | 3.25 | 0.0726 |
| AC | 0.165121 | 3 | 0.0550402 | 442.54 | 0.0000 |
| AD | 0.0000382051 | 2 | 0.0000191025 | 0.15 | 0.8577 |
| AE | 0.00219469 | 2 | 0.00109734 | 8.82 | 0.0002 |
| BC | 0.00300852 | 3 | 0.00100284 | 8.06 | 0.0000 |
| BD | 0.000734474 | 2 | 0.000367237 | 2.95 | 0.0540 |
| BE | 0.00094172 | 2 | 0.00047086 | 3.79 | 0.0240 |
| CD | 0.000573798 | 6 | 0.000095633 | 0.77 | 0.5950 |
| CE | 0.00108091 | 6 | 0.000180152 | 1.45 | 0.1967 |
| DE | 0.000321692 | 4 | 0.000080423 | 0.65 | 0.6298 |
| Residual | 0.0307205 | 247 | 0.000124374 | ||
| Total (Corrected) | 0.903263 | 287 | |||
| D | Cases | Mean LS | Sigma LS | Homogeneous Groups |
|---|---|---|---|---|
| d1 | 144 | 0.626883 | 0.00092936 | A |
| d2 | 144 | 0.703032 | 0.00092936 | B |
| Contrast | Significant | Difference | +/− Limits |
|---|---|---|---|
| d1–d2 | * | −0.0761486 | 0.0025887 |
| M | Cases | Mean LS | Sigma LS | Homogeneous Groups |
|---|---|---|---|---|
| m1 | 144 | 0.663497 | 0.00092936 | A |
| m2 | 144 | 0.666419 | 0.00092936 | B |
| Contrast | Significant | Difference | +/− Limits |
|---|---|---|---|
| m1–m2 | * | −0.00292222 | 0.0025887 |
| P | Cases | LS Mean | LS Sigma | Homogeneous Groups |
|---|---|---|---|---|
| p3 | 72 | 0.613729 | 0.00131431 | A |
| p4 | 72 | 0.671787 | 0.00131431 | B |
| p1 | 72 | 0.686335 | 0.00131431 | C |
| p2 | 72 | 0.687979 | 0.00131431 | C |
| Contrast | Significant | Difference | +/− Limits |
|---|---|---|---|
| p1–p2 | −0.00164444 | 0.00366097 | |
| p1–p3 | * | 0.0726056 | 0.00366097 |
| p1–p4 | * | 0.0145472 | 0.00366097 |
| p2–p3 | * | 0.07425 | 0.00366097 |
| p2–p4 | * | 0.0161917 | 0.00366097 |
| p3–p4 | * | −0.0580583 | 0.00366097 |
| E | Cases | LS Mean | LS Sigma | Homogeneous Groups |
|---|---|---|---|---|
| 100 | 96 | 0.65554 | 0.00113823 | A |
| 200 | 96 | 0.665257 | 0.00113823 | B |
| 325 | 96 | 0.674076 | 0.00113823 | C |
| Contrast | Significant | Difference | +/− Limits |
|---|---|---|---|
| 100–200 | * | −0.00971771 | 0.00317049 |
| 100–325 | * | −0.0185365 | 0.00317049 |
| 200–325 | * | −0.00881875 | 0.00317049 |
| Source | Sum of Squares | Df | Mean Square | F-Ratio | p-Value |
|---|---|---|---|---|---|
| Main Effects | |||||
| A: Dataset | 3173.39 | 1 | 3173.39 | 0.14 | 0.7045 |
| B: Model | 1 | 78,601.33 | 0.0000 | ||
| C: Preprocessing | 3 | 84.24 | 0.0000 | ||
| D: Polynomial Scheduler | 14,121.0 | 2 | 7060.52 | 0.32 | 0.7259 |
| E: Epochs | 2 | 80,426.45 | 0.0000 | ||
| Interactions | |||||
| AB | 53,901.4 | 1 | 53,901.4 | 2.45 | 0.1189 |
| AC | 11,441.6 | 3 | 3813.86 | 0.17 | 0.9144 |
| AD | 99,782.6 | 2 | 49,891.3 | 2.27 | 0.1058 |
| AE | 27,159.5 | 2 | 13,579.7 | 0.62 | 0.5405 |
| BC | 3 | 77.48 | 0.0000 | ||
| BD | 105,749.0 | 2 | 52,874.3 | 2.40 | 0.0927 |
| BE | 2 | 7381.28 | 0.0000 | ||
| CD | 24,929.3 | 6 | 4154.89 | 0.19 | 0.9798 |
| CE | 834,961.0 | 6 | 139,160.2 | 6.32 | 0.0000 |
| DE | 21,317.5 | 4 | 5329.38 | 0.24 | 0.9143 |
| Residual | 247 | 22,014.6 | |||
| Total (Corrected) | 287 |
| M | Count | LS Mean | LS Sigma | Homogeneous Group |
|---|---|---|---|---|
| m1 | 144 | 5655.74 | 12.3644 | A |
| m2 | 144 | 10,558.1 | 12.3644 | B |
| Contrast | Significant | Difference | +/− Limits |
|---|---|---|---|
| m1–m2 | * | −4902.35 | 34.4406 |
| P | Count | LS Mean | LS Sigma | Homogeneous Groups |
|---|---|---|---|---|
| p3 | 72 | 7875.42 | 17.4859 | A |
| p1 | 72 | 8150.99 | 17.4859 | B |
| p2 | 72 | 8154.9 | 17.4859 | B |
| p4 | 72 | 8246.33 | 17.4859 | C |
| Contrast | Significant | Difference | +/− Limits |
|---|---|---|---|
| p1–p2 | −3.91667 | 48.7064 | |
| p1–p3 | * | 275.569 | 48.7064 |
| p1–p4 | * | −95.3472 | 48.7064 |
| p2–p3 | * | 279.486 | 48.7064 |
| p2–p4 | * | −91.4306 | 48.7064 |
| p3–p4 | * | −370.917 | 48.7064 |
Disclaimer/Publisher’s Note: The statements, opinions and data contained in all publications are solely those of the individual author(s) and contributor(s) and not of MDPI and/or the editor(s). MDPI and/or the editor(s) disclaim responsibility for any injury to people or property resulting from any ideas, methods, instructions or products referred to in the content. |
© 2024 by the authors. Licensee MDPI, Basel, Switzerland. This article is an open access article distributed under the terms and conditions of the Creative Commons Attribution (CC BY) license (https://creativecommons.org/licenses/by/4.0/).
Share and Cite
Jerónimo, A.; Valenzuela, O.; Rojas, I. Statistical Analysis of nnU-Net Models for Lung Nodule Segmentation. J. Pers. Med. 2024, 14, 1016. https://doi.org/10.3390/jpm14101016
Jerónimo A, Valenzuela O, Rojas I. Statistical Analysis of nnU-Net Models for Lung Nodule Segmentation. Journal of Personalized Medicine. 2024; 14(10):1016. https://doi.org/10.3390/jpm14101016
Chicago/Turabian StyleJerónimo, Alejandro, Olga Valenzuela, and Ignacio Rojas. 2024. "Statistical Analysis of nnU-Net Models for Lung Nodule Segmentation" Journal of Personalized Medicine 14, no. 10: 1016. https://doi.org/10.3390/jpm14101016
APA StyleJerónimo, A., Valenzuela, O., & Rojas, I. (2024). Statistical Analysis of nnU-Net Models for Lung Nodule Segmentation. Journal of Personalized Medicine, 14(10), 1016. https://doi.org/10.3390/jpm14101016