
Associations between the Levels of Estradiol-, Progesterone-, and Testosterone-Sensitive MiRNAs and Main Clinicopathologic Features of Breast Cancer

 ,
, 
Abstract
1. Introduction
2. Materials and Methods
2.1. Cell Culture
2.2. Tissue Samples
2.3. MicroRNA Isolation
2.4. MiRNA Reverse Transcription and Real-Time PCR (RT-PCR)
2.5. Bioinformatics Analysis
2.6. Statistical Analysis
3. Results
3.1. Selection of Estradiol-, Progesterone-, Testosterone-Sensitive miRNAs
3.2. Analysis of the Hormone-Sensitive MiRNAs Expression in Breast Cancer
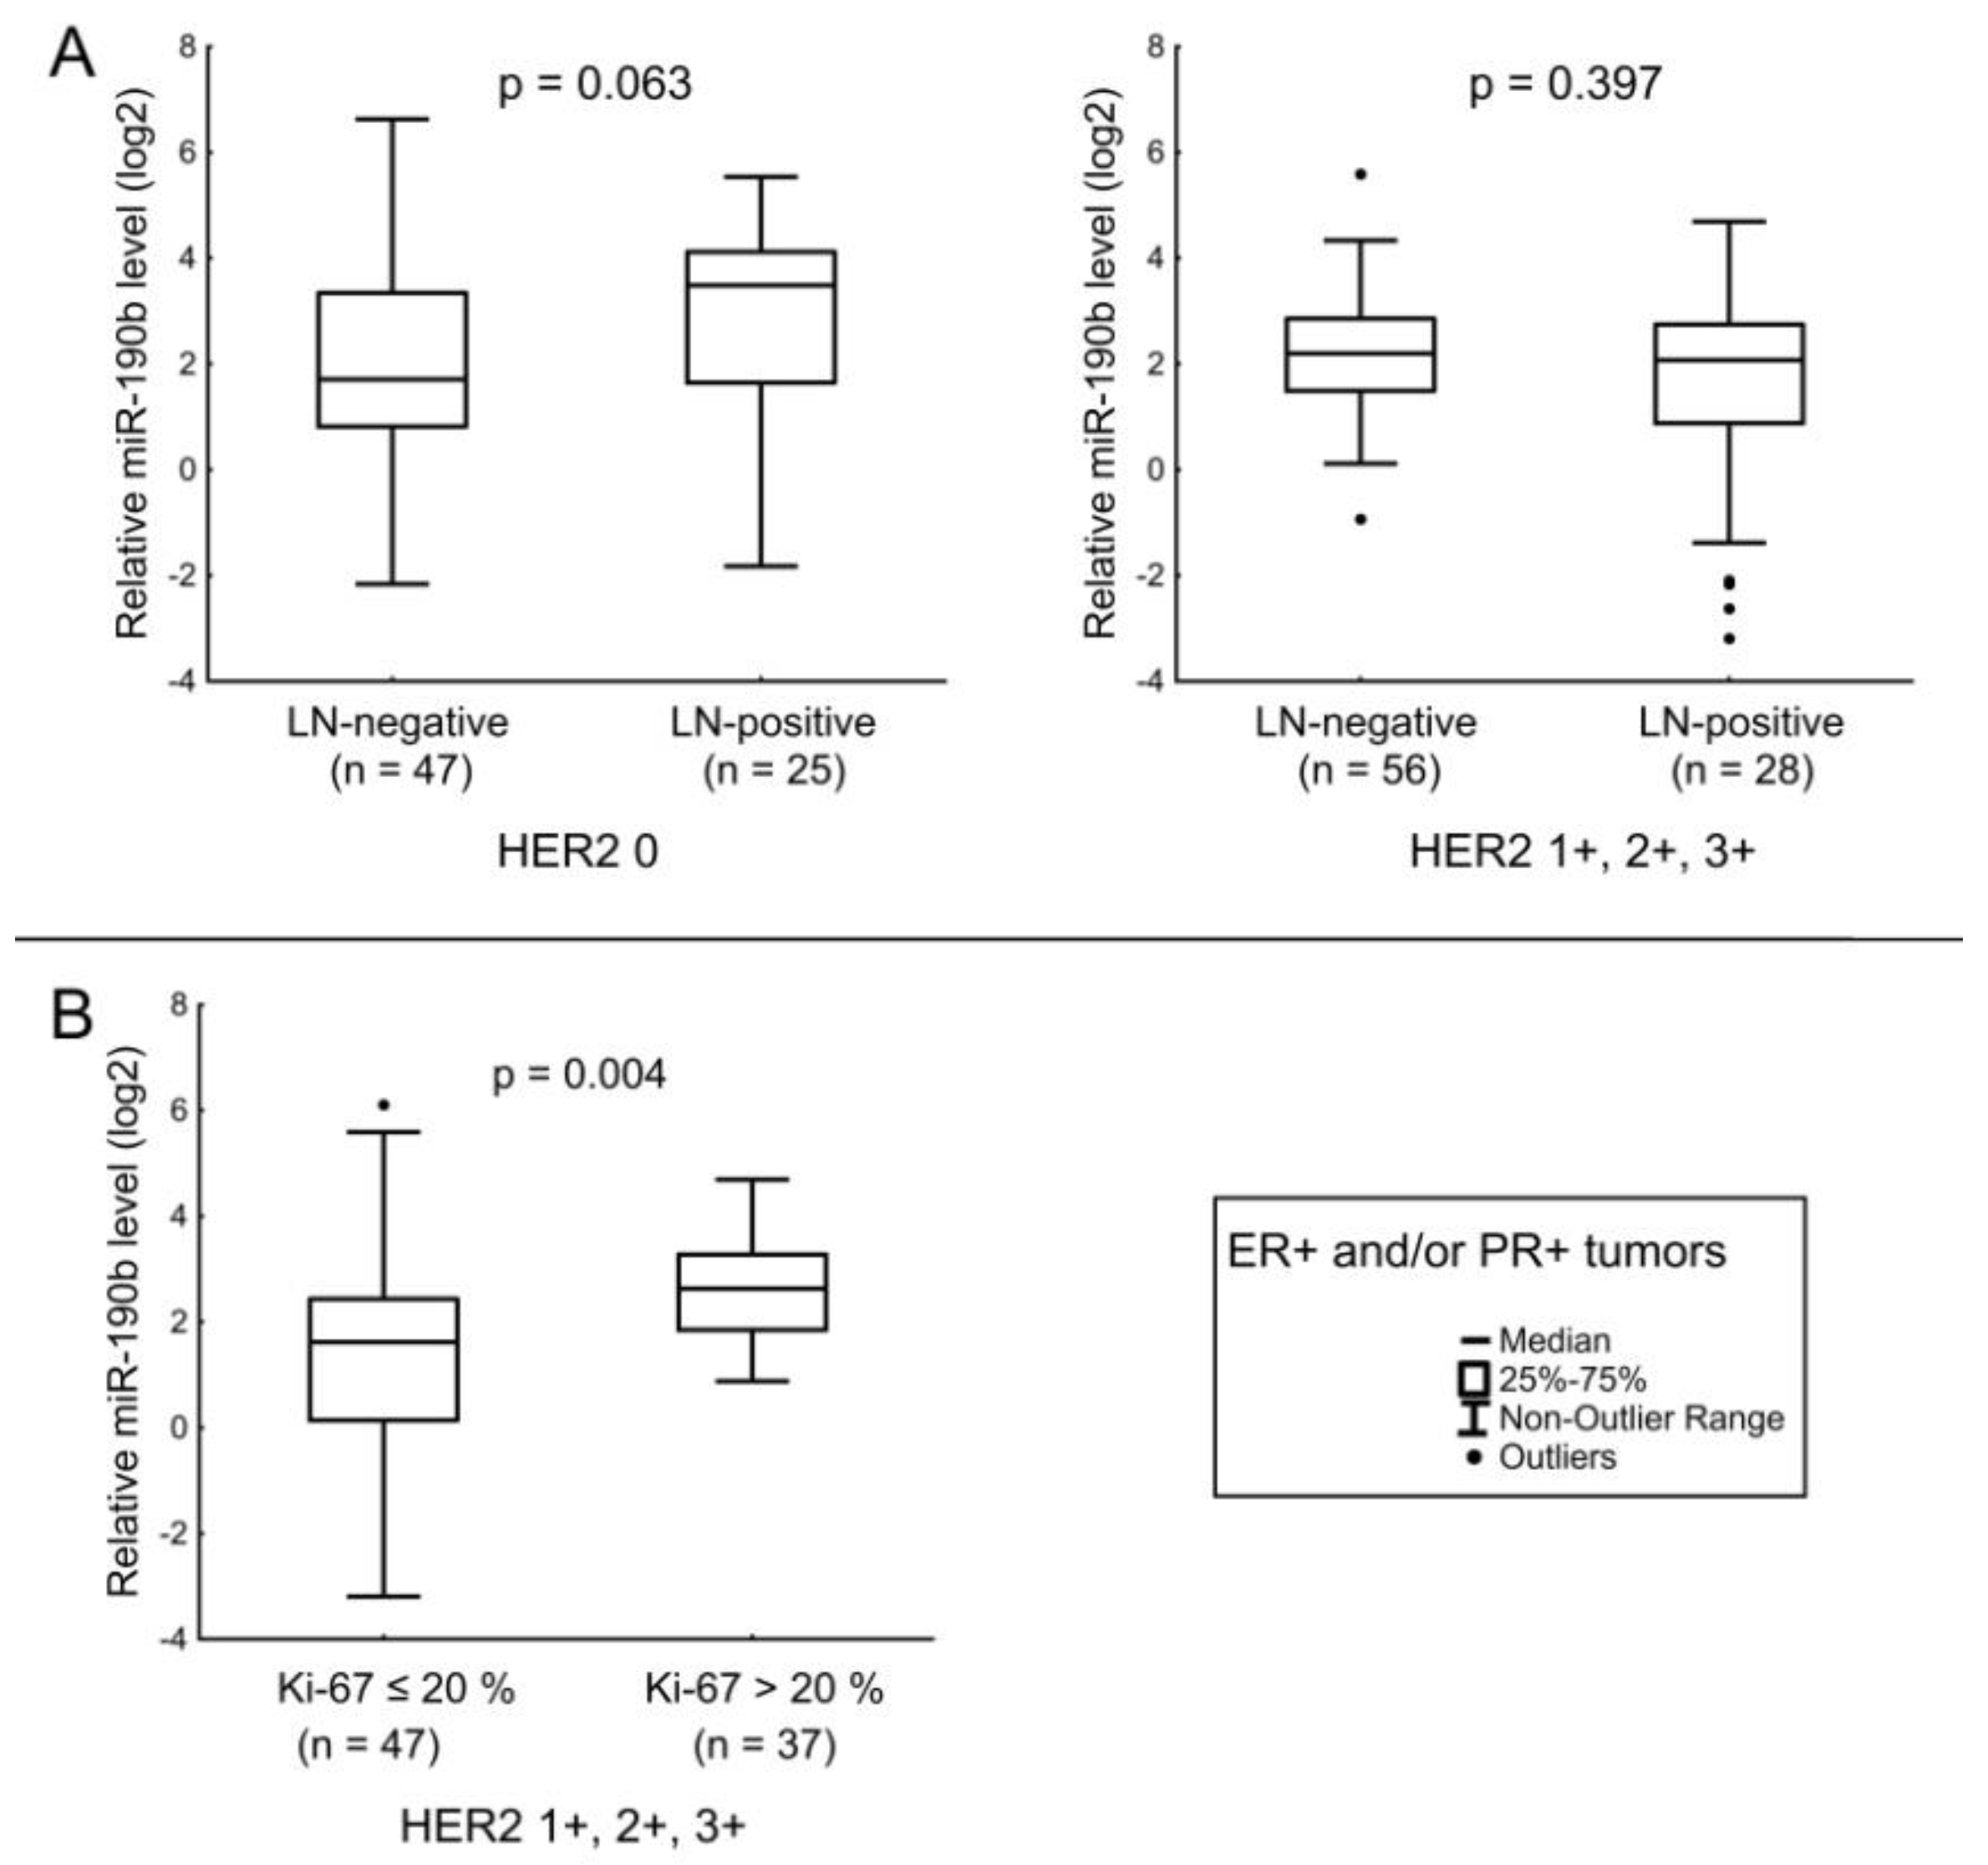
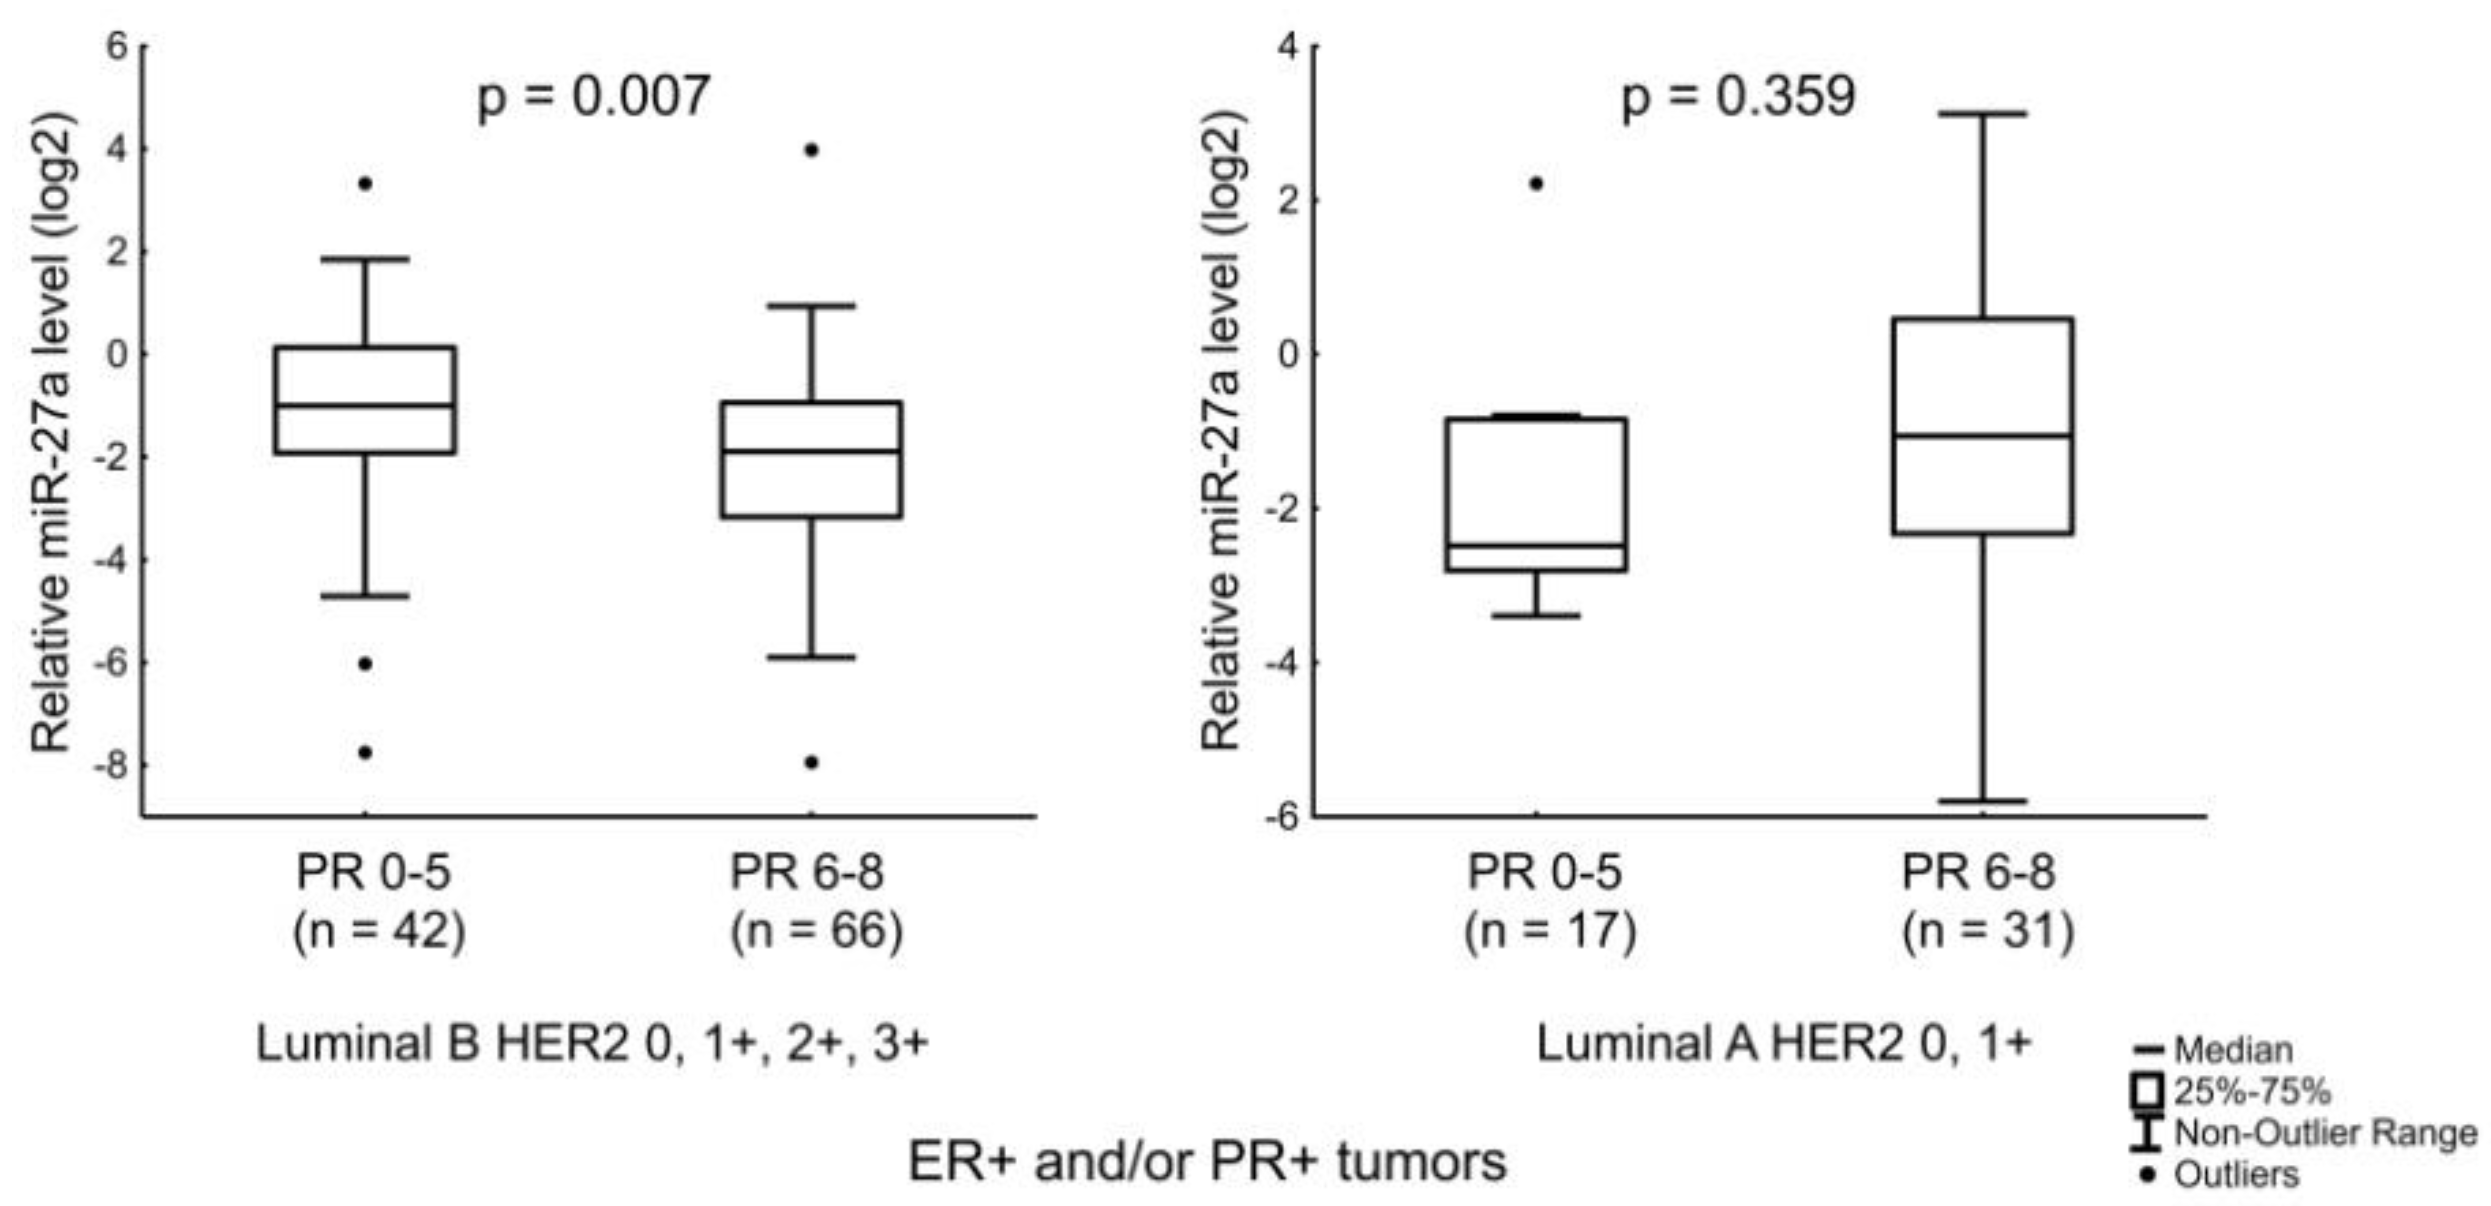
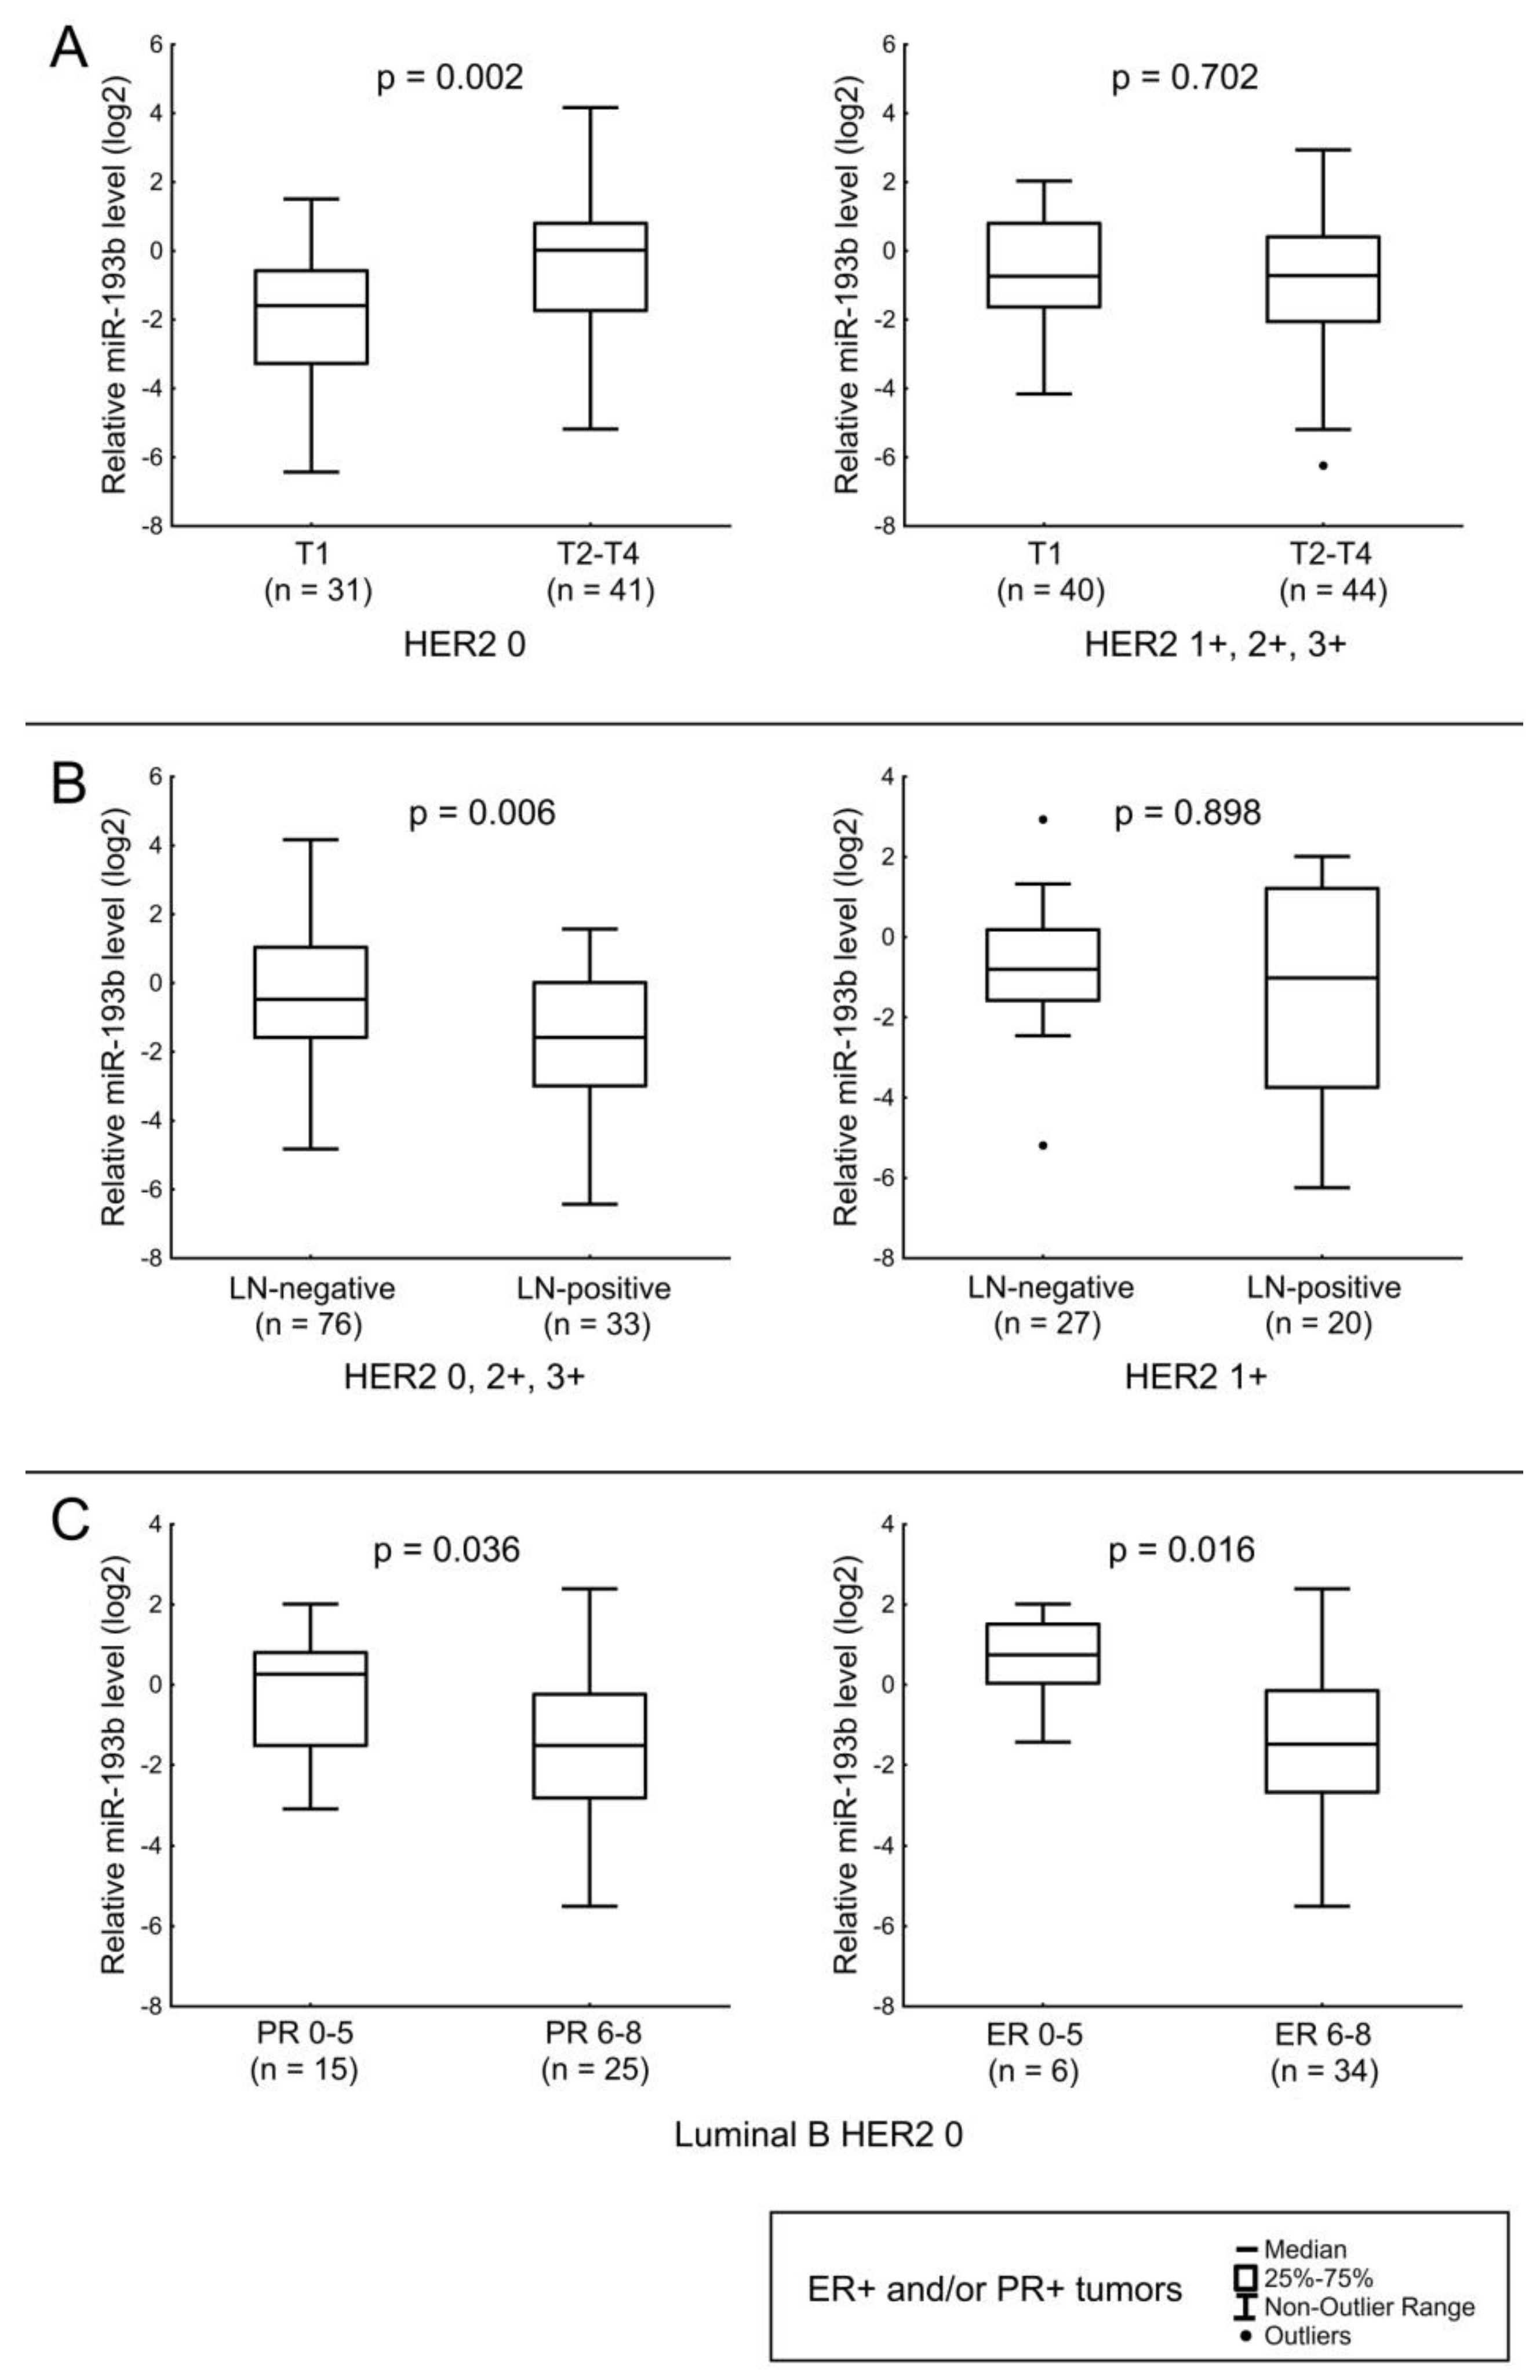
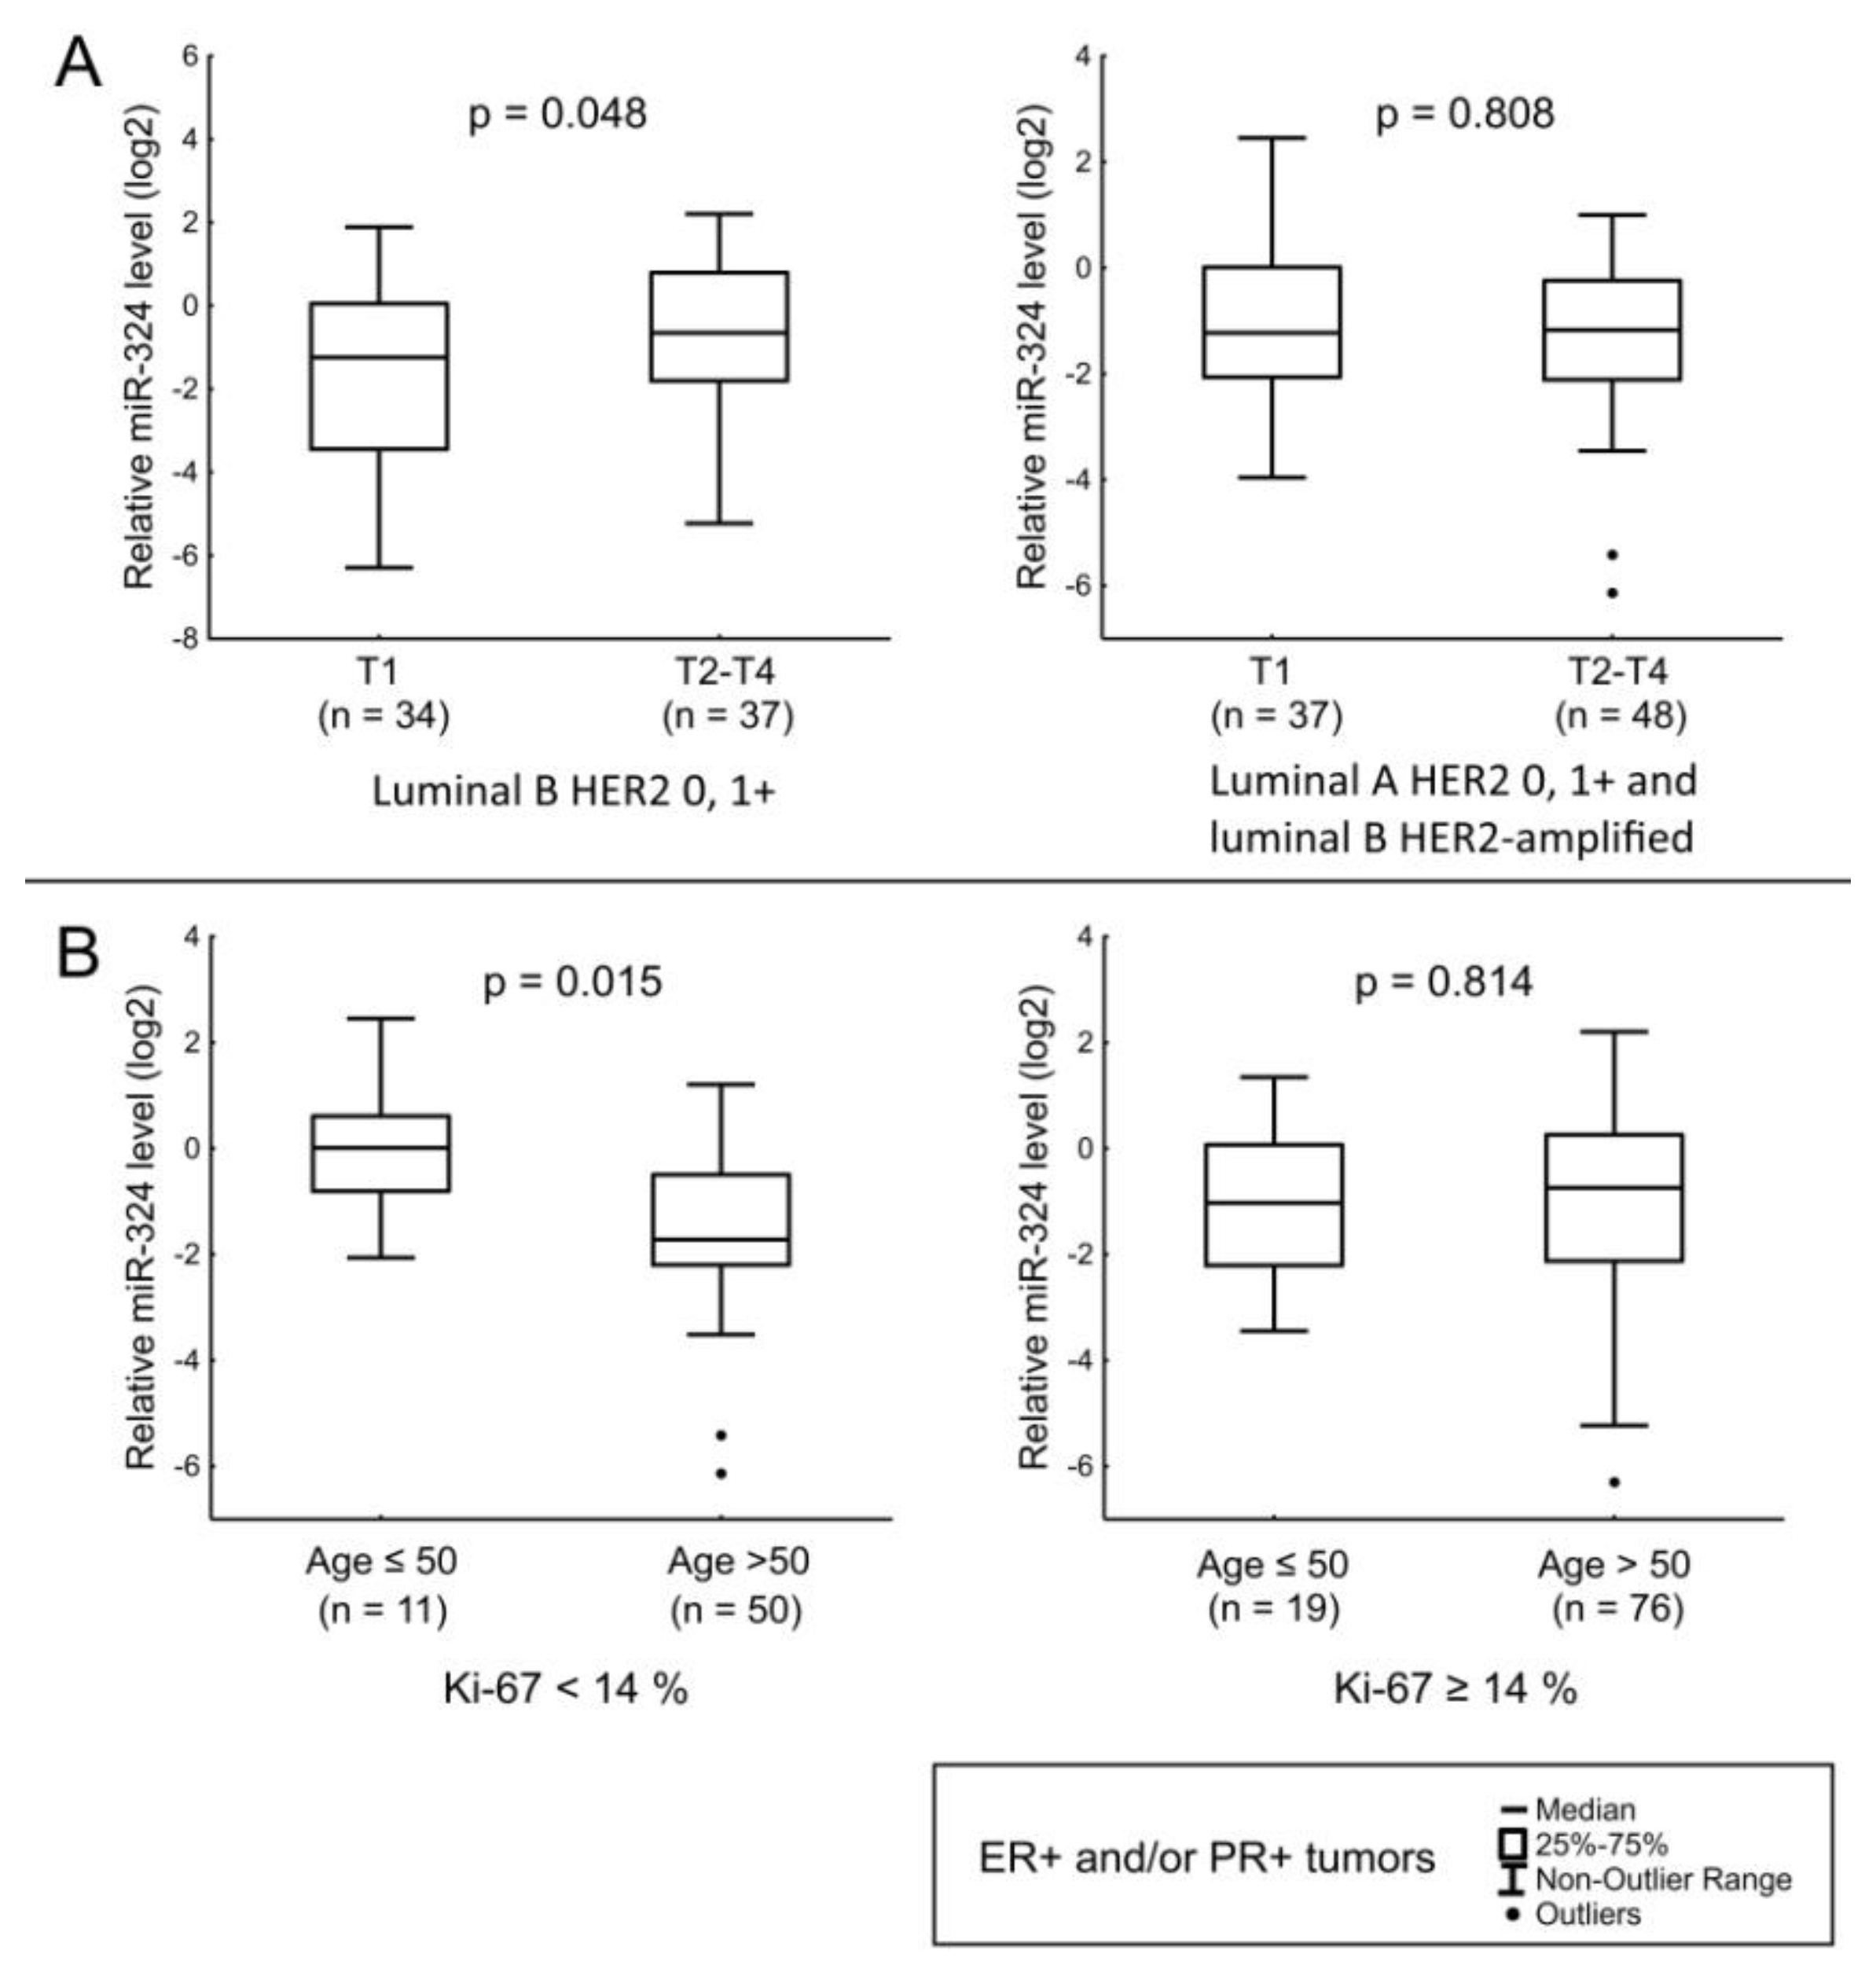
3.3. Expression of MiR-190a, MiR-190b, MiR-27a, MiR-193b, MiR-324, MiR-423, MiR-200b, and MiR-21 in Relation to Clinicopathologic Features of ER- and/or PR-Positive BC
3.4. Expression of MiR-190a, MiR-190b, MiR-27a, MiR-193b, MiR-324, MiR-423, MiR-200b, and MiR-21 in Relation to Clinicopathologic Features of ER- and PR-Negative BC
4. Discussion
Author Contributions
Funding
Institutional Review Board Statement
Informed Consent Statement
Data Availability Statement
Acknowledgments
Conflicts of Interest
References
- Gown, A.M. Current issues in ER and HER2 testing by IHC in breast cancer. Mod. Pathol. 2008, 21, S8–S15. [Google Scholar] [CrossRef] [PubMed]
- Li, J.; Downs, B.M.; Cope, L.M.; Fackler, M.J.; Zhang, X.; Song, C.G.; VandenBussche, C.; Zhang, K.; Han, Y.; Liu, Y.; et al. Automated and rapid detection of cancer in suspicious axillary lymph nodes in patients with breast cancer. NPJ Breast Cancer 2021, 7, 89. [Google Scholar] [CrossRef]
- Li, H.; Jun, Z.; Zhi-Cheng, G.; Xiang, Q. Factors that affect the false negative rate of sentinel lymph node mapping with methylene blue dye alone in breast cancer. J. Int. Med. Res. 2019, 47, 4841–4853. [Google Scholar] [CrossRef]
- Shah, R.; Rosso, K.; Nathanson, S.D. Pathogenesis, prevention, diagnosis and treatment of breast cancer. World J. Clin. Oncol. 2014, 5, 283–298. [Google Scholar] [CrossRef] [PubMed]
- Saha, S.; Dey, S.; Nath, S. Steroid hormone receptors: Links with cell cycle machinery and breast cancer progression. Front. Oncol. 2021, 11, 620214. [Google Scholar] [CrossRef]
- Amaral, J.D.; Solá, S.; Steer, C.J.; Rodrigues, C.M. Role of nuclear steroid receptors in apoptosis. Curr. Med. Chem. 2009, 16, 3886–3902. [Google Scholar] [CrossRef] [PubMed]
- Jansen, J.; Greither, T.; Behre, H.M. Androgen-regulated microRNAs (AndroMiRs) as novel players in adipogenesis. Int. J. Mol. Sci. 2019, 20, 5767. [Google Scholar] [CrossRef] [PubMed]
- Klinge, C.M. Estrogen Regulation of MicroRNA Expression. Curr Genomics. 2009, 10, 169–183. [Google Scholar] [CrossRef]
- Goldhirsch, A.; Wood, W.C.; Coates, A.S.; Gelber, R.D.; Thürlimann, B.; Senn, H.J.; Panel members. Strategies for subtypes--dealing with the diversity of breast cancer: Highlights of the St. Gallen International Expert Consensus on the Primary Therapy of Early Breast Cancer 2011. Ann. Oncol. 2011, 22, 1736–1747. [Google Scholar] [CrossRef] [PubMed]
- Harvey, J.M.; Clark, G.M.; Osborne, C.K.; Allred, D.C. Estrogen receptor status by immunohistochemistry is superior to the ligand-binding assay for predicting response to adjuvant endocrine therapy in breast cancer. J. Clin. Oncol. 1999, 17, 1474–1481. [Google Scholar] [CrossRef]
- Kalinina, T.S.; Kononchuk, V.V.; Yakovleva, A.K.; Alekseenok, E.Y.; Sidorov, S.V.; Gulyaeva, L.F. Association between lymph node status and expression levels of androgen receptor, miR-185, miR-205, and miR-21 in breast cancer subtypes. Int. J. Breast Cancer 2020, 2020, 3259393. [Google Scholar] [CrossRef]
- Chen, C.; Ridzon, D.A.; Broomer, A.J.; Zhou, Z.; Lee, D.H.; Nguyen, J.T.; Barbisin, M.; Xu, N.L.; Mahuvakar, V.R.; Andersen, M.R.; et al. Real-time quantification of microRNAs by stem-loop RT-PCR. Nucleic Acids Res. 2005, 33, e179. [Google Scholar] [CrossRef]
- Ovchinnikov, V.Y.; Antonets, D.V.; Gulyaeva, L.F. The search of CAR, AhR, ESRs binding sites in promoters of intronic and intergenic microRNAs. J. Bioinform. Comput. Biol. 2018, 16, 1750029. [Google Scholar] [CrossRef] [PubMed]
- Fromm, B.; Billipp, T.; Peck, L.E.; Johansen, M.; Tarver, J.E.; King, B.L.; Newcomb, J.M.; Sempere, L.F.; Flatmark, K.; Hovig, E.; et al. A uniform system for the annotation of vertebrate microRNA genes and the evolution of the human microRNAome. Annu. Rev. Genet. 2015, 49, 213–242. [Google Scholar] [CrossRef]
- Mathelier, A.; Fornes, O.; Arenillas, D.J.; Chen, C.Y.; Denay, G.; Lee, J.; Shi, W.; Shyr, C.; Tan, G.; Worsley-Hunt, R.; et al. JASPAR 2016: A major expansion and update of the open-access database of transcription factor binding profiles. Nucleic Acids Res. 2016, 44, D110–D115. [Google Scholar] [CrossRef] [PubMed]
- Pagès, H.; Aboyoun, P.; Gentleman, R.; DebRoy, S. Biostrings: String Objects Representing Biological Sequences, and Matching Algorithms. R Package Version 2.44.2. 2017. Available online: https://bioconductor.org/packages/release/bioc/html/Biostrings.html (accessed on 25 October 2021).
- Kozomara, A.; Griffiths-Jones, S. miRBase: Integrating microRNA annotation and deep-sequencing data. Nucleic Acids Res. 2011, 39, D152–D157. [Google Scholar] [CrossRef] [PubMed]
- Ludwig, N.; Leidinger, P.; Becker, K.; Backes, C.; Fehlmann, T.; Pallasch, C.; Rheinheimer, S.; Meder, B.; Stähler, C.; Meese, E.; et al. Distribution of miRNA expression across human tissues. Nucleic Acids Res. 2016, 44, 3865–3877. [Google Scholar] [CrossRef]
- Ribas, J.; Ni, X.; Haffner, M.; Wentzel, E.A.; Salmasi, A.H.; Chowdhury, W.H.; Kudrolli, T.A.; Yegnasubramanian, S.; Luo, J.; Rodriguez, R.; et al. miR-21: An androgen receptor-regulated microRNA that promotes hormone-dependent and hormone-independent prostate cancer growth. Cancer Res. 2009, 69, 7165–7169. [Google Scholar] [CrossRef]
- Casaburi, I.; Cesario, M.G.; Donà, A.; Rizza, P.; Aquila, S.; Avena, P.; Lanzino, M.; Pellegrino, M.; Vivacqua, A.; Tucci, P.; et al. Androgens downregulate miR-21 expression in breast cancer cells underlining the protective role of androgen receptor. Oncotarget 2016, 7, 12651–12661. [Google Scholar] [CrossRef]
- Wickramasinghe, N.S.; Manavalan, T.T.; Dougherty, S.M.; Riggs, K.A.; Li, Y.; Klinge, C.M. Estradiol downregulates miR-21 expression and increases miR-21 target gene expression in MCF-7 breast cancer cells. Nucleic Acids Res. 2009, 37, 2584–2595. [Google Scholar] [CrossRef]
- Cizeron-Clairac, G.; Lallemand, F.; Vacher, S.; Lidereau, R.; Bieche, I.; Callens, C. MiR-190b, the highest up-regulated miRNA in ERα-positive compared to ERα-negative breast tumors, a new biomarker in breast cancers? BMC Cancer 2015, 15, 499. [Google Scholar] [CrossRef] [PubMed]
- Williams, L.V.; Veliceasa, D.; Vinokour, E.; Volpert, O.V. miR-200b inhibits prostate cancer EMT, growth and metastasis. PLoS ONE 2013, 8, e83991. [Google Scholar] [CrossRef]
- Manavalan, T.T.; Teng, Y.; Litchfield, L.M.; Muluhngwi, P.; Al-Rayyan, N.; Klinge, C.M. Reduced expression of miR-200 family members contributes to antiestrogen resistance in LY2 human breast cancer cells. PLoS ONE 2013, 8, e62334. [Google Scholar]
- Fletcher, C.E.; Dart, D.A.; Sita-Lumsden, A.; Cheng, H.; Rennie, P.S.; Bevan, C.L. Androgen-regulated processing of the oncomir miR-27a, which targets Prohibitin in prostate cancer. Hum. Mol. Genet. 2012, 21, 3112–3127. [Google Scholar] [CrossRef] [PubMed]
- Huang, F.Y.; Wong, D.K.; Seto, W.K.; Lai, C.L.; Yuen, M.F. Estradiol induces apoptosis via activation of miRNA-23a and p53: Implication for gender difference in liver cancer development. Oncotarget 2015, 6, 34941–34952. [Google Scholar] [CrossRef]
- He, Y.J.; Wu, J.Z.; Ji, M.H.; Ma, T.; Qiao, E.Q.; Ma, R.; Tang, J.H. miR-342 is associated with estrogen receptor-α expression and response to tamoxifen in breast cancer. Exp. Ther. Med. 2013, 5, 813–818. [Google Scholar] [CrossRef] [PubMed]
- Chu, H.W.; Cheng, C.W.; Chou, W.C.; Hu, L.Y.; Wang, H.W.; Hsiung, C.N.; Hsu, H.M.; Wu, P.E.; Hou, M.F.; Shen, C.Y.; et al. A novel estrogen receptor-microRNA 190a-PAR-1-pathway regulates breast cancer progression, a finding initially suggested by genome-wide analysis of loci associated with lymph-node metastasis. Hum. Mol. Genet. 2014, 23, 355–367. [Google Scholar] [CrossRef] [PubMed][Green Version]
- Xu, S.; Wang, T.; Song, W.; Jiang, T.; Zhang, F.; Yin, Y.; Jiang, S.W.; Wu, K.; Yu, Z.; Wang, C.; et al. The inhibitory effects of AR/miR-190a/YB-1 negative feedback loop on prostate cancer and underlying mechanism. Sci. Rep. 2015, 5, 13528. [Google Scholar] [CrossRef]
- Lyu, S.; Liu, H.; Liu, X.; Liu, S.; Wang, Y.; Yu, Q.; Niu, Y. Interrelation of androgen receptor and miR-30a and miR-30a function in ER-, PR-, AR+ MDA-MB-453 breast cancer cells. Oncol. Lett. 2017, 14, 4930–4936. [Google Scholar] [CrossRef]
- Milevskiy, M.J.G.; Gujral, U.; Del Lama Marques, C.; Stone, A.; Northwood, K.; Burke, L.J.; Gee, J.M.W.; Nephew, K.; Clark, S.; Brown, M.A. MicroRNA-196a is regulated by ER and is a prognostic biomarker in ER+ breast cancer. Br. J. Cancer 2019, 120, 621–632. [Google Scholar] [CrossRef] [PubMed]
- Leivonen, S.K.; Mäkelä, R.; Ostling, P.; Kohonen, P.; Haapa-Paananen, S.; Kleivi, K.; Enerly, E.; Aakula, A.; Hellström, K.; Sahlberg, N.; et al. Protein lysate microarray analysis to identify microRNAs regulating estrogen receptor signaling in breast cancer cell lines. Oncogene 2009, 28, 3926–3936. [Google Scholar] [CrossRef]
- Cui, W.; Li, Q.; Feng, L.; Ding, W. MiR-126-3p regulates progesterone receptors and involves development and lactation of mouse mammary gland. Mol. Cell. Biochem. 2011, 355, 17–25. [Google Scholar] [CrossRef]
- Lambein, K.; Van Bockstal, M.; Vandemaele, L.; Geenen, S.; Rottiers, I.; Nuyts, A.; Matthys, B.; Praet, M.; Denys, H.; Libbrecht, L. Distinguishing score 0 from score 1+ in HER2 immunohistochemistry-negative breast cancer: Clinical and pathobiological relevance. Am. J. Clin. Pathol. 2013, 140, 561–566. [Google Scholar] [CrossRef] [PubMed]
- Schettini, F.; Chic, N.; Brasó-Maristany, F.; Paré, L.; Pascual, T.; Conte, B.; Martínez-Sáez, O.; Adamo, B.; Vidal, M.; Barnadas, E.; et al. Clinical, pathological, and PAM50 gene expression features of HER2-low breast cancer. NPJ Breast Cancer 2021, 7, 1. [Google Scholar] [CrossRef] [PubMed]
- Kalinina, T.; Kononchuk, V.; Alekseenok, E.; Obukhova, D.; Sidorov, S.; Strunkin, D.; Gulyaeva, L. Expression of estrogen receptor- and progesterone receptor-regulating microRNAs in breast cancer. Genes (Basel) 2021, 12, 582. [Google Scholar] [CrossRef]
- You, K.; Park, S.; Ryu, J.M.; Kim, I.; Lee, S.K.; Yu, J.; Kim, S.W.; Nam, S.J.; Lee, J.E. Comparison of core needle biopsy and surgical specimens in determining intrinsic biological subtypes of breast cancer with immunohistochemistry. J. Breast Cancer 2017, 20, 297–303. [Google Scholar] [CrossRef] [PubMed]
- Mattie, M.D.; Benz, C.C.; Bowers, J.; Sensinger, K.; Wong, L.; Scott, G.K.; Fedele, V.; Ginzinger, D.; Getts, R.; Haqq, C. Optimized high-throughput microRNA expression profiling provides novel biomarker assessment of clinical prostate and breast cancer biopsies. Mol. Cancer 2006, 5, 24. [Google Scholar] [CrossRef] [PubMed]
- Petrović, N.; Mandušić, V.; Dimitrijević, B.; Roganović, J.; Lukić, S.; Todorović, L.; Stanojević, B. Higher miR-21 expression in invasive breast carcinomas is associated with positive estrogen and progesterone receptor status in patients from Serbia. Med. Oncol. 2014, 31, 977. [Google Scholar] [CrossRef]
- Yu, Q.; Niu, Y.; Liu, N.; Zhang, J.Z.; Liu, T.J.; Zhang, R.J.; Wang, S.L.; Ding, X.M.; Xiao, X.Q. Expression of androgen receptor in breast cancer and its significance as a prognostic factor. Ann. Oncol. 2011, 22, 1288–1294. [Google Scholar] [CrossRef] [PubMed]
- Li, X.F.; Yan, P.J.; Shao, Z.M. Downregulation of miR-193b contributes to enhance urokinase-type plasminogen activator (uPA) expression and tumor progression and invasion in human breast cancer. Oncogene 2009, 28, 3937–3948. [Google Scholar] [CrossRef]
- Yu, Y.; Luo, W.; Yang, Z.J.; Chi, J.R.; Li, Y.R.; Ding, Y.; Ge, J.; Wang, X.; Cao, X.C. miR-190 suppresses breast cancer metastasis by regulation of TGF-β-induced epithelial-mesenchymal transition. Mol. Cancer 2018, 17, 70. [Google Scholar] [CrossRef] [PubMed]
- Zhu, D.; Chung, H.F.; Dobson, A.J.; Pandeya, N.; Giles, G.G.; Bruinsma, F.; Brunner, E.J.; Kuh, D.; Hardy, R.; Avis, N.E.; et al. Age at natural menopause and risk of incident cardiovascular disease: A pooled analysis of individual patient data. Lancet Public Health 2019, 4, e553–e564. [Google Scholar] [CrossRef]


| Characteristics | ER- and/or PR-Positive (n = 156) | ER- and PR-Negative (n = 40) | |
|---|---|---|---|
| Age (mean and range, year) | 61 (27–90) | 55 (38–76) | |
| T stage | T1 | 71 | 18 |
| T2 | 81 | 20 | |
| T3 | 2 | 1 | |
| T4 | 2 | 1 | |
| N stage | N0 | 103 | 27 |
| N1 | 37 | 7 | |
| N2 | 11 | 6 | |
| N3 | 5 | - | |
| ER score | 0–2 | 3 | 40 |
| 3–5 | 7 | - | |
| 6–8 | 146 | - | |
| PR score | 0–2 | 25 | 40 |
| 3–5 | 34 | - | |
| 6–8 | 97 | - | |
| HER2 score | 0 | 72 | 18 |
| 1 | 47 | 5 | |
| 2–3 | 37 | 17 | |
| miRNA | ESR1 and ESR2 Binding Sites in Promoter According to ChipSeq Data (Homo Sapiens) [13] | ESR1 and ESR2 Binding Sites in Promoter According to Position Weight Matrix (Homo Sapiens) [13] | ESR1 and ESR2 Binding Sites in Promoter According to Position Weight Matrix (Mus Musculus and Rattus Norvegicus) [13] | AR/PR Binding Sites in Promoter According to Position Weight Matrix (Homo Sapiens) | AR/PR Binding Sites in Promoter According to Position Weight Matrix (Rattus Norvegicus) | Comments |
|---|---|---|---|---|---|---|
| hsa-mir-21 | + | + | only mouse | + | + | It was demonstrated that androgen induced AR binding to the miR-21 promoter; MiR-21 expression was induced by R1881 in LNCaP and LAPC-4 cells [19]. Mibolerone inhibited basal expression of miR-21 in MCF-7 breast cancer cells [20]. Estradiol inhibited miR-21 expression in MCF-7 cells [21]. |
| hsa-mir-190b | + | + | + | + | - | MiR-190b is the highest up-regulated miRNA in ER+ breast cancers compared to ER− tumors. Did not observe an increase of miR-190b expression levels in MCF-7 or in T-47D treated by estradiol (1 nM for MCF-7 and 10 nM for T-47D, 6 h, 18 h, and 4 days) [22]. |
| hsa-mir-200a/ hsa-mir-200b/ hsa-mir-429 | + | + | + | - | - | MiR-200b showed the highest fold change under the influence of R1881 among androgen-sensitive miRNAs (PC3-AR cells) [23]. MiR-200b expression in MCF-7 cells decreased after 6 h of incubation with 10 nM estradiol [24]. |
| hsa-mir-23a/ hsa-mir-24-2/ hsa-mir-27a | + | - | + | - | - | AR is able to associate transiently with the miR-23a/27a/24-2 promoter in response to androgen to initiate cluster transcription. The highest-fold change was observed for miR-27a and miR-23a (LNCaP cells treated with mibolerone) [25]. Estrogen induced miR-23a expression in SNU-387 cells [26]. |
| hsa-mir-342 | + | - | + | + | - | MiR-342 expression is positively correlated with ERα mRNA expression in human BC [27]. |
| hsa-mir-190a | - | - | - | + | + | The promoter region of miR-190a contains half of an estrogen response element. ERα binds directly to this promoter [28]. Androgen inhibits miR-190a expression through direct binding to the half-site of ARE in miR-190a promoter (LNCaP cells) [29]. |
| hsa-mir-378a | - | + | + | + | + | |
| hsa-mir-324 | - | + | + | + | + | |
| hsa-mir-423 | - | + | only rat | + | + | |
| hsa-mir-149 | - | + | only rat | + | + | |
| hsa-mir-365b | + | + | only rat | + | - | |
| hsa-mir-574 | + | - | only mouse | + | - | |
| hsa-mir-30a | + | - | only mouse | + | - | AR does not target the miR-30a promoter; AR activating signal may indirectly downregulate miR-30a (MDA-MB-453 cells) [30]. |
| hsa-mir-10a | + | + | + | - | - | |
| hsa-mir-483 | + | + | + | - | - | |
| hsa-let-7a-3/ hsa-let-7b | + | - | + | - | - | |
| hsa-mir-196a-2 | + | + | - | - | - | MiR-196a expression is regulated by the estrogen receptor [31]. |
| hsa-mir-33b | + | - | - | - | - | |
| hsa-miR-193b | - | + | + | + | - | Targets ER [32]. |
| hsa-miR-126 | - | + | + | + | - | Targets PR (regulation confirmed using mouse mammary epithelial cells) [33]. |
| miRNA | Time, h | Relative Level of miRNA | |||||
|---|---|---|---|---|---|---|---|
| Estradiol | Testosterone | Progesterone | |||||
| 10 nM | 100 nM | 10 nM | 100 nM | 10 nM | 100 nM | ||
| miR-23a | 6 | 1.12 | 1.08 | 0.96 | 0.86 | 0.84 | 0.84 |
| 24 | 0.89 | 0.95 | 0.88 | 1.00 | 0.92 | 0.88 | |
| 48 | 0.89 | 0.85 | 1.02 | 0.94 | 1.11 | 0.92 | |
| miR-27a | 6 | 1.12 | 0.88 | 0.92 | 0.76 * | 0.89 | 0.93 |
| 24 | 1.07 | 1.10 | 1.09 | 1.08 | 0.93 | 0.92 | |
| 48 | 0.92 | 0.95 | 1.13 | 1.09 | 1.01 | 1.16 | |
| miR-190b | 6 | 0.97 | 0.75 ** | 0.96 | 0.92 | 0.93 | 1.10 |
| 24 | 1.35 * | 1.37 ** | 1.13 | 1.09 | 1.02 | 1.03 | |
| 48 | 1.12 | 1.09 | 1.05 | 1.15 | 1.14 | 1.29 * | |
| miR-190a | 6 | 1.05 | 1.01 | 0.91 | 0.88 | 1.01 | 0.90 |
| 24 | 1.09 | 1.02 | 0.90 | 0.99 | 0.79 | 0.75 * | |
| 48 | 1.08 | 1.17 | 1.24 * | 1.38 * | 0.90 | 0.96 | |
| miR-200b | 6 | 1.01 | 0.79 ** | 1.00 | 0.88 | 1.02 | 0.98 |
| 24 | 0.98 | 1.01 | 1.10 | 0.99 | 0.91 | 0.96 | |
| 48 | 1.01 | 1.11 | 1.24 * | 1.32 ** | 0.95 | 1.07 | |
| miR-21 | 6 | 1.03 | 0.98 | 0.92 | 0.62 ** | 1.17 | 1.36 * |
| 24 | 0.97 | 0.98 | 0.89 | 0.91 | 0.92 | 0.90 | |
| 48 | 1.07 | 1.08 | 1.36 ** | 1.40 ** | 1.11 | 1.08 | |
| miR-126 | 6 | 1.01 | 1.03 | 0.90 | 1.05 | 0.87 | 0.95 |
| 24 | 0.94 | 0.88 | 1.06 | 0.94 | 1.01 | 1.12 | |
| 48 | 1.13 | 1.11 | 1.18 | 0.99 | 0.93 | 1.07 | |
| miR-378 | 6 | 1.09 | 1.00 | 0.88 | 0.94 | 0.90 | 1.08 |
| 24 | 1.05 | 1.05 | 1.11 | 0.97 | 0.95 | 1.04 | |
| 48 | 1.00 | 1.17 | 1.15 | 1.19 | 0.94 | 1.12 | |
| miR-423 | 6 | 0.98 | 0.90 | 0.89 | 0.93 | 0.91 | 1.09 |
| 24 | 1.04 | 1.06 | 0.99 | 0.87 | 0.96 | 0.99 | |
| 48 | 0.97 | 0.99 | 1.50 ** | 1.42 ** | 0.90 | 0.97 | |
| miR-149 | 6 | 1.25 | 1.01 | 0.95 | 0.91 | 0.96 | 1.06 |
| 24 | 0.98 | 0.94 | 0.99 | 0.95 | 0.90 | 0.94 | |
| 48 | 0.89 | 1.05 | 1.05 | 0.89 | 1.02 | 1.18 | |
| miR-193b | 6 | 1.07 | 1.00 | 0.93 | 0.95 | 0.92 | 1.07 |
| 24 | 1.02 | 1.10 | 1.05 | 1.08 | 1.00 | 0.89 | |
| 48 | 1.24 | 1.30 ** | 1.30 ** | 1.40 ** | 1.07 | 1.08 | |
| miR-324 | 6 | 1.35 * | 1.21 | 0.91 | 0.95 | 1.61 ** | 2.20 ** |
| 24 | 0.99 | 1.06 | 1.06 | 1.05 | 1.05 | 1.04 | |
| 48 | 1.08 | 1.07 | 1.15 | 1.33 ** | 0.94 | 1.09 | |
| miR-342 | 6 | 0.83 | 0.96 | 0.89 | 1.10 | 0.92 | 1.12 |
| 24 | 0.96 | 1.02 | 1.15 | 1.10 | 0.89 | 0.94 | |
| 48 | 1.07 | 1.08 | 1.17 | 1.19 | 0.90 | 1.18 | |
| Characteristics | n | Relative Level * of miRNA and p-Value | ||||||||
|---|---|---|---|---|---|---|---|---|---|---|
| miR-190a | p-Value | miR-190b | p-Value | miR-27a | p-Value | miR-193b | p-Value | |||
| ER and PR status | ER+ and/or PR+ | 156 | 0.10 | 0.165 | 4.84 | <0.001 | 0.33 | 0.443 | 0.58 | 0.168 |
| ER− and PR− | 40 | 0.33 | 1.13 | 0.44 | 0.36 | |||||
| HER2 status | HER2+ | 52 | 0.10 | 0.728 | 3.86 | 0.985 | 0.34 | 0.388 | 0.72 | 0.193 |
| HER2− | 144 | 0.12 | 3.76 | 0.39 | 0.47 | |||||
| Ki-67 index (%) | <14 | 65 | 0.11 | 0.753 | 3.89 | 0.941 | 0.49 | 0.394 | 0.49 | 0.567 |
| ≥14 | 131 | 0.11 | 3.64 | 0.35 | 0.53 | |||||
| Age | ≤50 | 48 | 0.21 | 0.107 | 2.79 | 0.119 | 0.48 | 0.045 | 0.56 | 0.861 |
| >50 | 148 | 0.11 | 4.26 | 0.33 | 0.52 | |||||
| N stage | N0 | 130 | 0.17 | 0.103 | 3.47 | 0.592 | 0.37 | 0.834 | 0.65 | 0.022 |
| N1-N3 | 66 | 0.09 | 4.21 | 0.42 | 0.37 | |||||
| miR-324 | p-Value | miR-423 | p-Value | miR-200b | p-Value | miR-21 | p-Value | |||
| ER and PR status | ER+ and/or PR+ | 156 | 0.48 | 0.129 | 0.65 | 0.800 | 1.77 | 0.676 | 1.78 | 0.004 |
| ER− and PR− | 40 | 0.68 | 0.74 | 1.53 | 3.48 | |||||
| HER2 status | HER2+ | 52 | 0.60 | 0.180 | 0.80 | 0.004 | 2.99 | 0.024 | 1.62 | 0.342 |
| HER2− | 144 | 0.47 | 0.55 | 1.46 | 1.95 | |||||
| Ki-67 index (%) | <14 | 65 | 0.39 | 0.257 | 0.56 | 0.038 | 1.26 | 0.030 | 2.02 | 0.947 |
| ≥14 | 131 | 0.60 | 0.71 | 2.04 | 1.88 | |||||
| Age | ≤50 | 48 | 0.60 | 0.103 | 0.69 | 0.958 | 1.68 | 0.598 | 3.52 | 0.003 |
| >50 | 148 | 0.48 | 0.65 | 1.50 | 1.68 | |||||
| N stage | N0 | 130 | 0.55 | 0.210 | 0.68 | 0.068 | 1.51 | 0.491 | 1.84 | 0.445 |
| N1-N3 | 66 | 0.48 | 0.52 | 1.78 | 2.13 | |||||
| Characteristics | n | Relative Level * of miRNA and p-Value | ||||||||
|---|---|---|---|---|---|---|---|---|---|---|
| miR-190a | p-Value | miR-190b | p-Value | miR-27a | p-Value | miR-193b | p-Value | |||
| ER+ and/or PR+ | ||||||||||
| T stage | T1 | 71 | 0.11 | 0.783 | 4.80 | 0.995 | 0.30 | 0.248 | 0.43 | 0.070 |
| T2–T4 | 85 | 0.09 | 4.93 | 0.46 | 0.74 | |||||
| N stage | N0 | 103 | 0.13 | 0.058 | 4.57 | 0.477 | 0.37 | 0.391 | 0.69 | 0.013 |
| N1–N3 | 53 | 0.08 | 5.41 | 0.52 | 0.38 | |||||
| Ki-67 index (%) | <M ** | 81 | 0.17 | 0.071 | 4.59 | 0.231 | 0.47 | 0.261 | 0.56 | 0.316 |
| ≥M ** | 75 | 0.09 | 5.42 | 0.32 | 0.66 | |||||
| ER score | 6–8 | 146 | 0.09 | 0.475 | 5.04 | 0.078 | 0.32 | 0.113 | 0.54 | 0.013 |
| 0–5 | 10 | 0.19 | 2.12 | 0.52 | 1.74 | |||||
| PR score | 6–8 | 97 | 0.09 | 0.004 | 4.71 | 0.840 | 0.29 | 0.048 | 0.49 | 0.258 |
| 0–5 | 59 | 0.21 | 6.41 | 0.49 | 0.81 | |||||
| Age | ≤50 | 30 | 0.12 | 0.226 | 5.41 | 0.893 | 0.48 | 0.227 | 0.90 | 0.360 |
| >50 | 126 | 0.10 | 4.80 | 0.31 | 0.55 | |||||
| miR-324 | p-Value | miR-423 | p-Value | miR-200b | p-Value | miR-21 | p-Value | |||
| ER+ and/or PR+ | ||||||||||
| T stage | T1 | 71 | 0.43 | 0.216 | 0.59 | 0.290 | 2.09 | 0.109 | 1.68 | 0.247 |
| T2–T4 | 85 | 0.50 | 0.67 | 1.36 | 1.81 | |||||
| N stage | N0 | 103 | 0.53 | 0.313 | 0.68 | 0.039 | 1.64 | 0.832 | 1.74 | 0.802 |
| N1–N3 | 53 | 0.46 | 0.49 | 1.77 | 1.95 | |||||
| Ki-67 index (%) | <M ** | 81 | 0.44 | 0.694 | 0.57 | 0.055 | 1.53 | 0.253 | 1.84 | 0.494 |
| ≥M ** | 75 | 0.49 | 0.68 | 2.04 | 1.69 | |||||
| ER score | 6–8 | 146 | 0.48 | 0.467 | 0.62 | 0.756 | 1.88 | 0.006 | 1.69 | 0.106 |
| 0–5 | 10 | 0.89 | 0.88 | 0.28 | 2.09 | |||||
| PR score | 6–8 | 97 | 0.45 | 0.211 | 0.63 | 0.600 | 1.85 | 0.858 | 1.76 | 0.336 |
| 0–5 | 59 | 0.61 | 0.65 | 1.50 | 1.83 | |||||
| Age | ≤50 | 30 | 0.57 | 0.232 | 0.71 | 0.741 | 1.72 | 0.729 | 2.28 | 0.085 |
| >50 | 126 | 0.46 | 0.62 | 1.73 | 1.65 | |||||
| Characteristics | n | Relative Level * of miRNA and p-Value | ||||||||
|---|---|---|---|---|---|---|---|---|---|---|
| miR-190a | p-Value | miR-190b | p-Value | miR-27a | p-Value | miR-193b | p-Value | |||
| T stage | T1 | 18 | 0.33 | 0.372 | 0.90 | 0.629 | 0.40 | 0.240 | 0.57 | 0.176 |
| T2–T4 | 22 | 0.37 | 1.26 | 0.57 | 0.35 | |||||
| N stage | N0 | 27 | 0.37 | 0.824 | 1.07 | 0.835 | 0.39 | 0.183 | 0.44 | 0.725 |
| N1–N3 | 13 | 0.24 | 1.14 | 0.52 | 0.35 | |||||
| Ki-67 index (%) | ≤M ** | 19 | 0.39 | 0.162 | 1.45 | 0.191 | 0.45 | 0.779 | 0.47 | 0.272 |
| >M ** | 21 | 0.08 | 1.02 | 0.44 | 0.35 | |||||
| Age | ≤50 | 18 | 0.34 | 0.228 | 0.64 | 0.275 | 0.55 | 0.091 | 0.37 | 0.617 |
| >50 | 22 | 0.26 | 1.24 | 0.39 | 0.43 | |||||
| miR-324 | p-Value | miR-423 | p-Value | miR-200b | p-Value | miR-21 | p-Value | |||
| T stage | T1 | 18 | 0.65 | 0.987 | 0.80 | 0.729 | 1.11 | 0.036 | 3.87 | 0.703 |
| T2–T4 | 26 | 0.75 | 0.51 | 2.04 | 3.47 | |||||
| N stage | N0 | 27 | 0.69 | 0.391 | 0.70 | 0.969 | 1.33 | 0.349 | 3.33 | 0.101 |
| N1–N3 | 13 | 0.62 | 0.80 | 2.04 | 6.68 | |||||
| Ki-67 index (%) | ≤M ** | 19 | 0.89 | 0.101 | 0.79 | 0.546 | 1.34 | 0.706 | 3.48 | 0.582 |
| >M ** | 21 | 0.56 | 0.49 | 2.07 | 3.47 | |||||
| Age | ≤50 | 18 | 0.65 | 0.565 | 0.55 | 0.617 | 1.78 | 0.266 | 6.15 | 0.019 |
| >50 | 22 | 0.68 | 0.80 | 1.32 | 1.95 | |||||
| miRNA | Regulation of miRNA Expression According to Bioinformatic Analysis | Observed Changes | ||
|---|---|---|---|---|
| MCF-7 | ||||
| Estradiol | Testosterone | Progesterone | ||
| miR-27a | ER *, AR * | - | down (6 h) | - |
| miR-190b | ER *, AR, PR | down (6 h) up (24 h) | - | up (48 h) |
| miR-190a | ER *, AR, PR | - | up (48 h) | down (24 h) |
| miR-200b | ER *, AR ** | down (6 h) | up (48 h) | - |
| miR-21 | ER *, AR *, PR | - | down (6 h) up (48 h) | up (6 h) |
| miR-423 | ER, AR, PR | - | up (48 h) | - |
| miR-193b | ER, PR, AR | up (48 h) | up (48 h) | - |
| miR-324 | ER, PR, AR | up (6 h) | up (48 h) | up (6 h) |
| miRNA | Associated Tumor Characteristics |
|---|---|
| miR-27a | Age of the patients and the level of PR expression. |
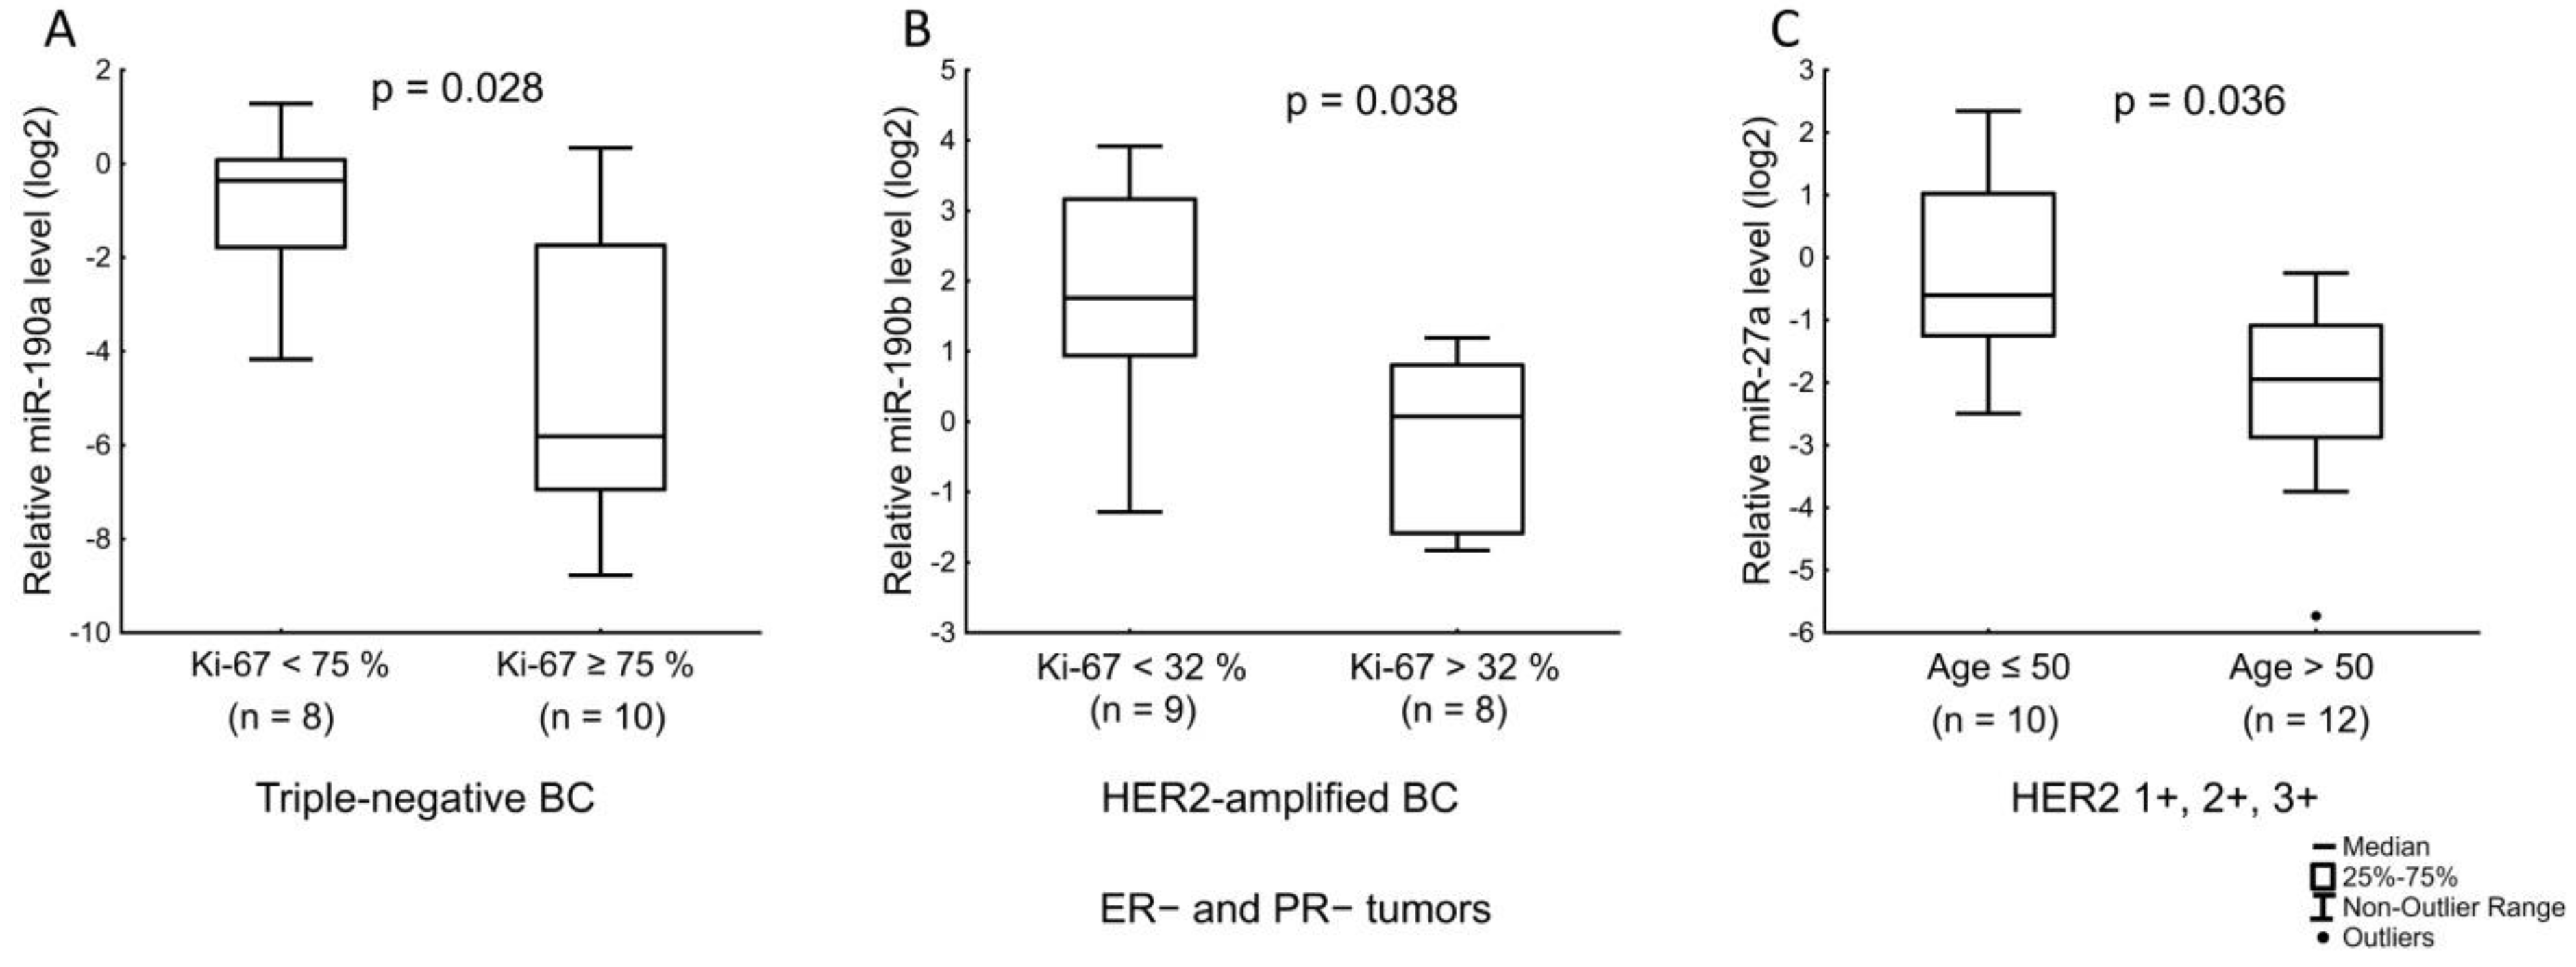
| miR-190b | ER receptor status. Ki-67 index in ER+ and/or PR+ HER2-expressing, and Ki-67 index in ER− and PR− HER2-amplified tumors. |
| miR-190a | Expression level of PR. LN status in ER+ and/or PR+ tumors with low Ki-67. Ki-67 index in triple-negative tumors. |
| miR-200b | HER2 status and Ki-67 index. Tumor size in ER+ and/or PR+ tumors with low Ki-67. Level of ER expression in Luminal B tumors not expressing HER2. |
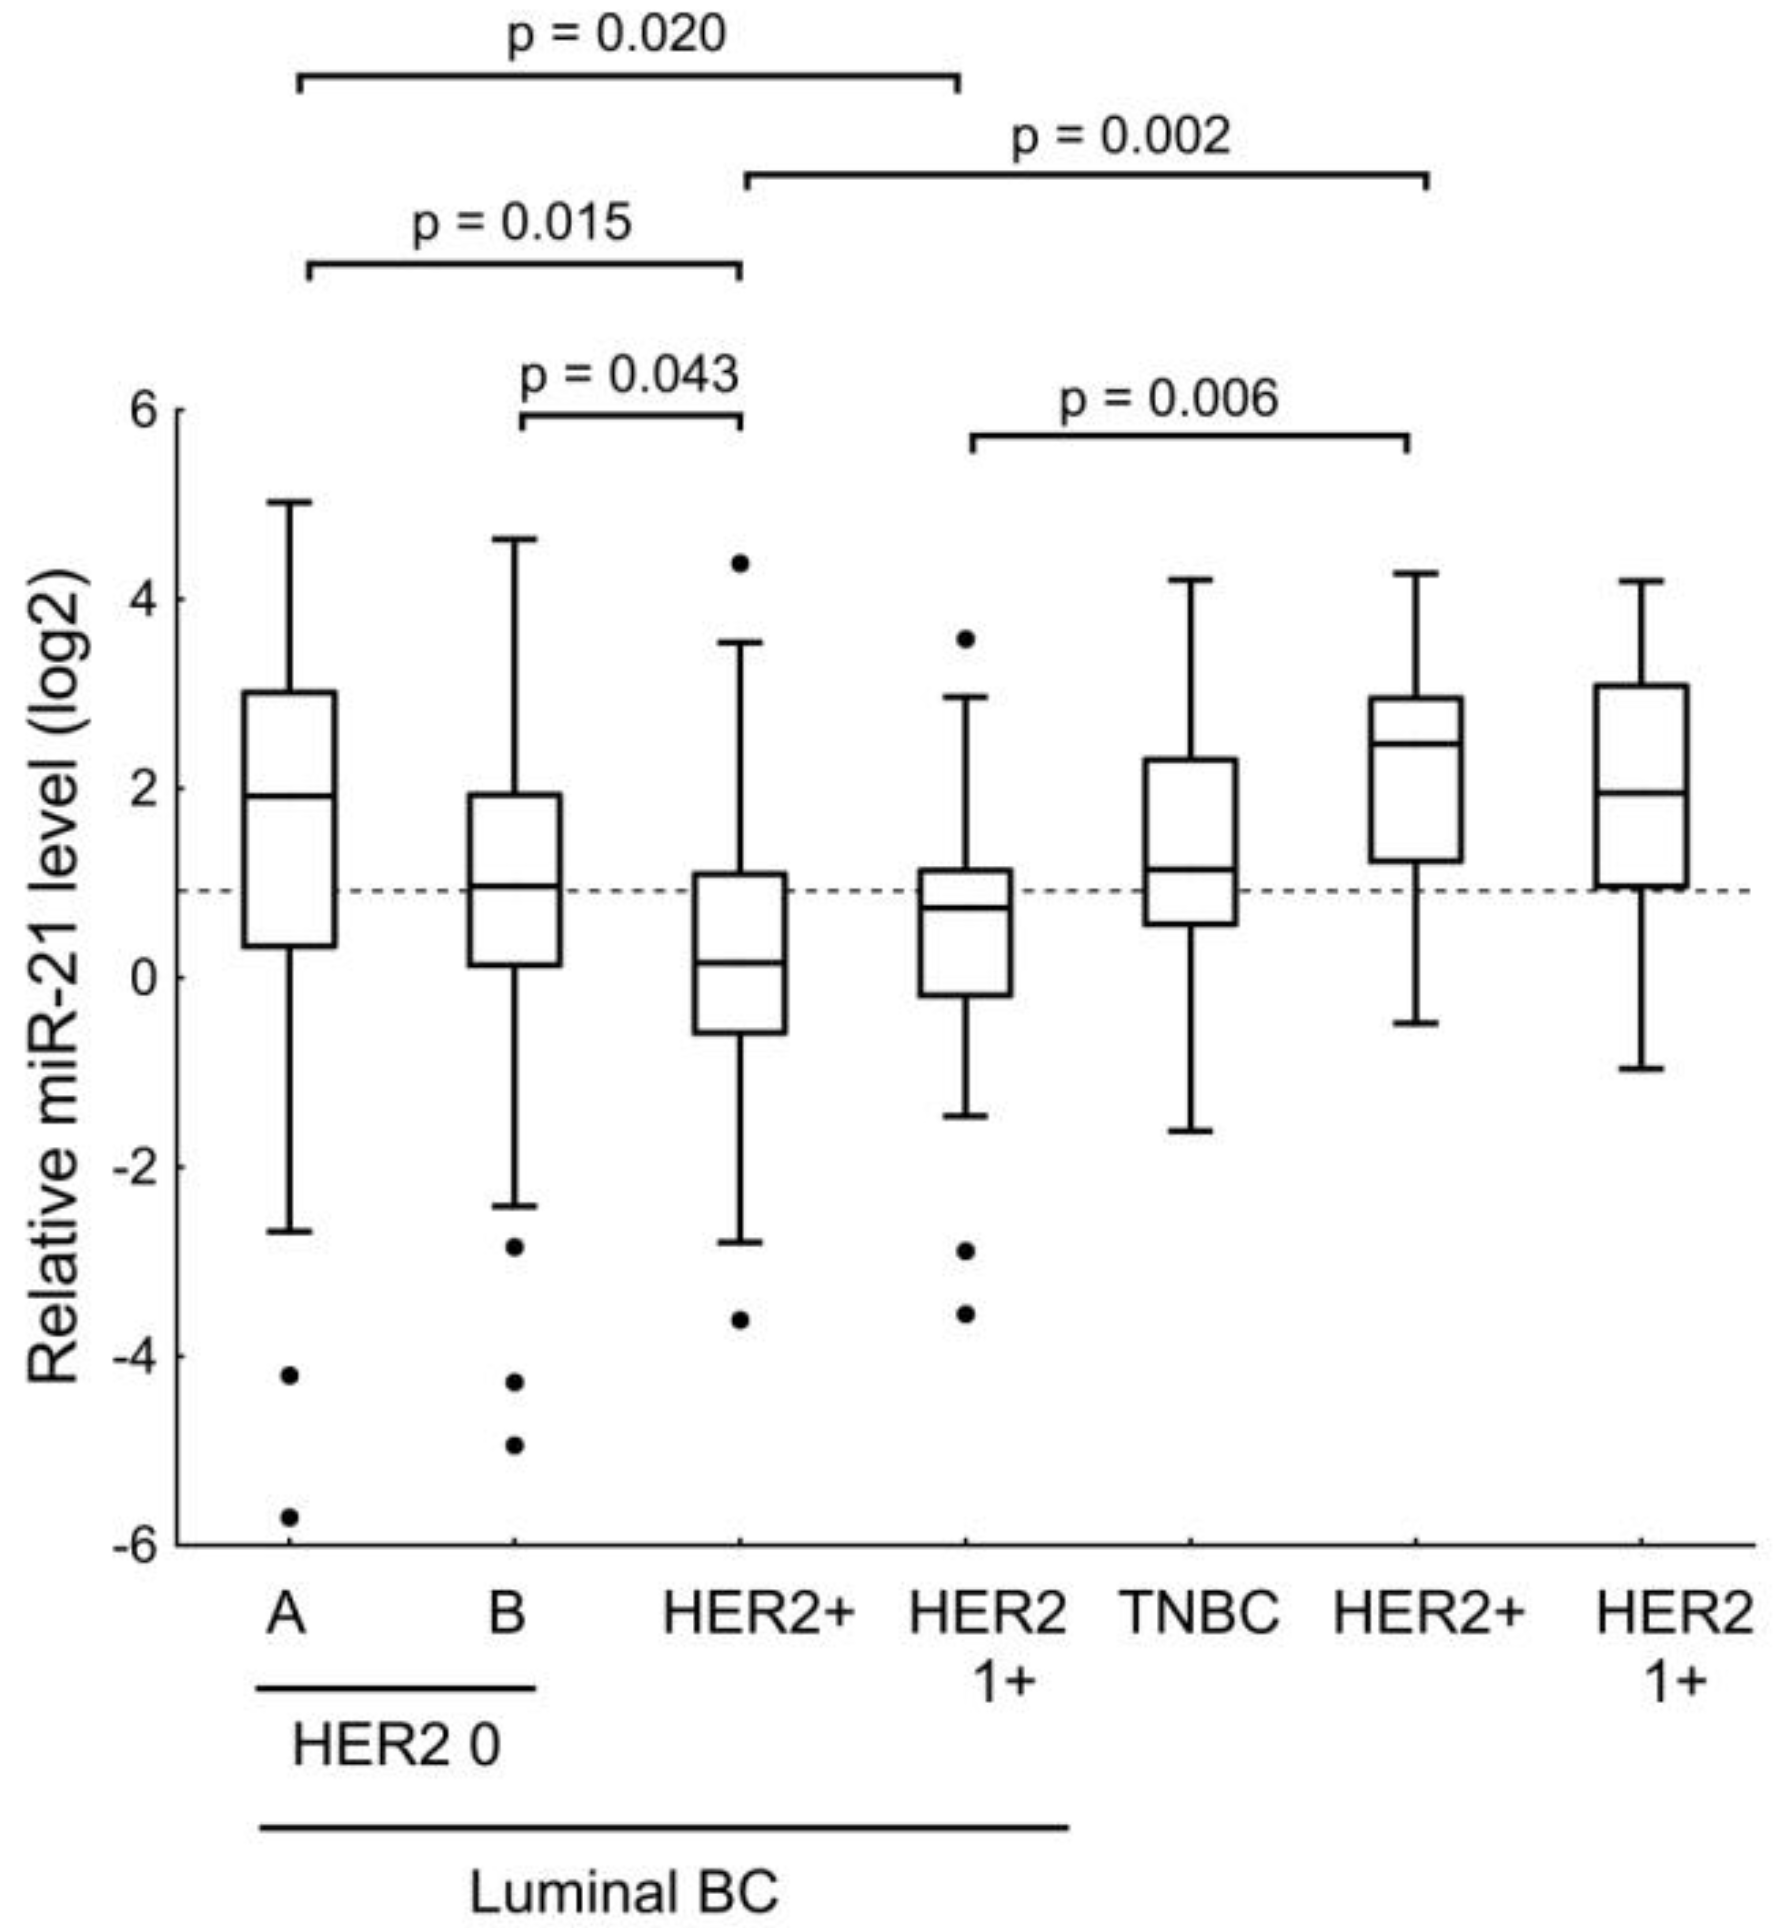
| miR-21 | ER receptor status and age of the patients. Expression level of HER2. |
| miR-423 | HER2 status and Ki-67 index. LN status in luminal A, luminal B HER2-amplified, and luminal B HER2 1+ tumors. |
| miR-193b | LN status in ER+ and/or PR+ tumors (except HER2 1+ cases). Tumor size in ER+ and/or PR+ HER2-non-expressing tumors. Expression level of ER in Luminal B HER2 0 tumors. |
| miR-324 | Tumor size in Luminal B HER2-non-amplified tumors. Age of the patients and HER2 status in ER+ and/or PR+ tumors with low Ki-67. |
Publisher’s Note: MDPI stays neutral with regard to jurisdictional claims in published maps and institutional affiliations. |
© 2021 by the authors. Licensee MDPI, Basel, Switzerland. This article is an open access article distributed under the terms and conditions of the Creative Commons Attribution (CC BY) license (https://creativecommons.org/licenses/by/4.0/).
Share and Cite
Kalinina, T.; Kononchuk, V.; Alekseenok, E.; Abdullin, G.; Sidorov, S.; Ovchinnikov, V.; Gulyaeva, L. Associations between the Levels of Estradiol-, Progesterone-, and Testosterone-Sensitive MiRNAs and Main Clinicopathologic Features of Breast Cancer. J. Pers. Med. 2022, 12, 4. https://doi.org/10.3390/jpm12010004
Kalinina T, Kononchuk V, Alekseenok E, Abdullin G, Sidorov S, Ovchinnikov V, Gulyaeva L. Associations between the Levels of Estradiol-, Progesterone-, and Testosterone-Sensitive MiRNAs and Main Clinicopathologic Features of Breast Cancer. Journal of Personalized Medicine. 2022; 12(1):4. https://doi.org/10.3390/jpm12010004
Chicago/Turabian StyleKalinina, Tatiana, Vladislav Kononchuk, Efim Alekseenok, Grigory Abdullin, Sergey Sidorov, Vladimir Ovchinnikov, and Lyudmila Gulyaeva. 2022. "Associations between the Levels of Estradiol-, Progesterone-, and Testosterone-Sensitive MiRNAs and Main Clinicopathologic Features of Breast Cancer" Journal of Personalized Medicine 12, no. 1: 4. https://doi.org/10.3390/jpm12010004
APA StyleKalinina, T., Kononchuk, V., Alekseenok, E., Abdullin, G., Sidorov, S., Ovchinnikov, V., & Gulyaeva, L. (2022). Associations between the Levels of Estradiol-, Progesterone-, and Testosterone-Sensitive MiRNAs and Main Clinicopathologic Features of Breast Cancer. Journal of Personalized Medicine, 12(1), 4. https://doi.org/10.3390/jpm12010004