
Another Look at Obesity Paradox in Acute Ischemic Stroke: Association Rule Mining

 , , , , , , , , ,
Abstract
:
1. Introduction
2. Materials and Methods
2.1. Participants
2.1.1. Measurement of Body Mass Index
2.1.2. Covariates
- Hypertension was defined as blood pressure ≥140/90 mmHg in more than two consecutive readings or taking antihypertensive agents;
- Diabetes was defined as fasting blood glucose ≥126 mg/dL, random blood glucose readings ≥200 mg/dL with relevant diabetic symptoms or glycated hemoglobin ≥6.5% [27];
- Hyperlipidemia was defined as total cholesterol ≥240 mg/dL or taking lipid-lowering agents [27];
- Current smoking was defined as smoking within 6 months prior to the study;
- Stroke subtypes were defined as cardioembolism and non-cardioembolism;
- Stroke severity was categorized as a score of the National Institute of Health Stroke Scale score (mild: 0–5, moderate: 6–14, and severe: >14) [28];
- Thrombolysis was defined as patients receiving intravenous or intra-arterial thrombolytic agents, or mechanical thrombectomy;
- Patient’s Age (years) was categorized as years < 54, 55 ≤ years, < 65, and years ≥ 65 [28].
2.1.3. Study Outcomes
2.2. Statistical Analyses
2.3. Association Rule Mining
3. Results
4. Discussion
5. Conclusions
Supplementary Materials
Author Contributions
Funding
Institutional Review Board Statement
Informed Consent Statement
Data Availability Statement
Conflicts of Interest
References
- GBD 2016 Lifetime Risk of Stroke Collaborators. Global, regional, and country-specific lifetime risks of stroke, 1990 and 2016. N. Engl. J. Med. 2018, 379, 2429–2437. [Google Scholar] [CrossRef]
- Hubert, H.B.; Feinleib, M.; McNamara, P.M.; Castelli, W.P. Obesity as an independent risk factor for cardiovascular disease: A 26-year follow-up of participants in the Framingham Heart Study. Circulation 1983, 67, 968–977. [Google Scholar] [CrossRef] [Green Version]
- Lavie, C.J.; Milani, R.V.; Ventura, H.O. Obesity and cardiovascular disease: Risk factor, paradox, and impact of weight loss. J. Am. Coll. Cardiol. 2009, 53, 1925–1932. [Google Scholar] [CrossRef] [Green Version]
- Pagidipati, N.J.; Zheng, Y.; Green, J.B.; McGuire, D.K.; Mentz, R.J.; Shah, S.; Aschner, P.; Delibasi, T.; Rodbard, H.W.; Westerhout, C.M. Association of obesity with cardiovascular outcomes in patients with type 2 diabetes and cardiovascular disease: Insights from TECOS. Am. Heart J. 2020, 219, 47–57. [Google Scholar] [CrossRef]
- Clark, A.L.; Fonarow, G.C.; Horwich, T.B. Obesity and the obesity paradox in heart failure. Prog. Cardiovasc. Dis. 2014, 56, 409–414. [Google Scholar] [CrossRef] [PubMed]
- Kurth, T.; Gaziano, J.M.; Berger, K.; Kase, C.S.; Rexrode, K.M.; Cook, N.R.; Buring, J.E.; Manson, J.E. Body mass index and the risk of stroke in men. Arch. Int. Med. 2002, 162, 2557–2562. [Google Scholar] [CrossRef]
- Suk, S.-H.; Sacco, R.L.; Boden-Albala, B.; Cheun, J.F.; Pittman, J.G.; Elkind, M.S.; Paik, M.C. Abdominal obesity and risk of ischemic stroke: The Northern Manhattan Stroke Study. Stroke 2003, 34, 1586–1592. [Google Scholar] [CrossRef] [Green Version]
- Chen, H.-J.; Bai, C.-H.; Yeh, W.-T.; Chiu, H.-C.; Pan, W.-H. Influence of metabolic syndrome and general obesity on the risk of ischemic stroke. Stroke 2006, 37, 1060–1064. [Google Scholar] [CrossRef] [Green Version]
- Shakiba, M.; Mansournia, M.A.; Kaufman, J.S. Estimating Effect of Obesity on Stroke Using G-Estimation: The ARIC study. Obesity 2019, 27, 304–308. [Google Scholar] [CrossRef] [Green Version]
- Vemmos, K.; Ntaios, G.; Spengos, K.; Savvari, P.; Vemmou, A.; Pappa, T.; Manios, E.; Georgiopoulos, G.; Alevizaki, M. Association between obesity and mortality after acute first-ever stroke: The obesity–stroke paradox. Stroke 2011, 42, 30–36. [Google Scholar] [CrossRef] [Green Version]
- Kim, B.J.; Lee, S.-H.; Jung, K.-H.; Yu, K.-H.; Lee, B.-C.; Roh, J.-K. Dynamics of obesity paradox after stroke, related to time from onset, age, and causes of death. Neurology 2012, 79, 856–863. [Google Scholar] [CrossRef]
- Kim, C.K.; Ryu, W.-S.; Kim, B.J.; Lee, S.-H. Paradoxical effect of obesity on hemorrhagic transformation after acute ischemic stroke. BMC Neurol. 2013, 13, 1–6. [Google Scholar] [CrossRef] [PubMed] [Green Version]
- Doehner, W.; Schenkel, J.; Anker, S.D.; Springer, J.; Audebert, H.J. Overweight and obesity are associated with improved survival, functional outcome, and stroke recurrence after acute stroke or transient ischaemic attack: Observations from the TEMPiS trial. Eur. Heart J. 2013, 34, 268–277. [Google Scholar] [CrossRef] [PubMed] [Green Version]
- Andersen, K.K.; Olsen, T.S. The obesity paradox in stroke: Lower mortality and lower risk of readmission for recurrent stroke in obese stroke patients. Int. J. Stroke 2015, 10, 99–104. [Google Scholar] [CrossRef]
- Park, H.; Lee, H.W.; Yoo, J.; Lee, H.S.; Nam, H.S.; Kim, Y.D.; Heo, J.H. Body mass index and prognosis in ischemic stroke patients with type 2 diabetes mellitus. Front. Neurol. 2019, 10, 563. [Google Scholar] [CrossRef] [PubMed]
- Tang, H.; Mo, J.; Chen, Z.; Xu, J.; Wang, A.; Dai, L.; Cheng, A.; Wang, Y. Uric acid contributes to obesity-paradox of the outcome of ischemic stroke. Front. Neurol. 2019, 10, 1279. [Google Scholar] [CrossRef] [Green Version]
- Khan, S.S.; Ning, H.; Wilkins, J.T.; Allen, N.; Carnethon, M.; Berry, J.D.; Sweis, R.N.; Lloyd-Jones, D.M. Association of body mass index with lifetime risk of cardiovascular disease and compression of morbidity. JAMA Cardiol. 2018, 3, 280–287. [Google Scholar] [CrossRef] [PubMed]
- Agrawal, R.; Imieliński, T.; Swami, A. Mining association rules between sets of items in large databases. In Proceedings of the 1993 ACM SIGMOD International Conference on Management of Data, Washington, DC, USA, 25–28 May 1993; pp. 207–216. [Google Scholar]
- Altaf, W.; Shahbaz, M.; Guergachi, A. Applications of association rule mining in health informatics: A survey. Artif. Intell. Rev. 2017, 47, 313–340. [Google Scholar] [CrossRef]
- Park, S.H.; Jang, S.Y.; Kim, H.; Lee, S.W. An association rule mining-based framework for understanding lifestyle risk behaviors. PLoS ONE 2014, 9, e88859. [Google Scholar] [CrossRef]
- Burton, S.H.; Morris, R.G.; Giraud-Carrier, C.G.; West, J.H.; Thackeray, R. Mining useful association rules from questionnaire data. Intell. Data Anal. 2014, 18, 479–494. [Google Scholar] [CrossRef]
- Creighton, C.; Hanash, S. Mining gene expression databases for association rules. Bioinformatics 2003, 19, 79–86. [Google Scholar] [CrossRef]
- Nahar, J.; Tickle, K.S.; Ali, A.S.; Chen, Y.-P.P. Significant cancer prevention factor extraction: An association rule discovery approach. J. Med. Syst. 2011, 35, 353–367. [Google Scholar] [CrossRef]
- Peng, S.; Shen, F.; Wen, A.; Wang, L.; Fan, Y.; Liu, X.; Liu, H. Detecting Lifestyle Risk Factors for Chronic Kidney Disease with Comorbidities: Association Rule Mining Analysis of Web-Based Survey Data. J. Med. Internet Res. 2019, 21, e14204. [Google Scholar] [CrossRef]
- Kim, C.; Jang, M.U.; Oh, M.S.; Park, J.-H.; Jung, S.; Lee, J.-H.; Yu, K.-H.; Han, M.-K.; Kim, B.J.; Park, T.H. Off-hour effect on 3-month functional outcome after acute ischemic stroke: A prospective multicenter registry. PLoS ONE 2014, 9, e105799. [Google Scholar] [CrossRef] [Green Version]
- Collaboration, A.P.C.S. The burden of overweight and obesity in the Asia–Pacific region. Obes. Rev. 2007, 8, 191–196. [Google Scholar]
- Kim, J.Y.; Kang, K.; Kang, J.; Koo, J.; Kim, D.-H.; Kim, B.J.; Kim, W.J.; Kim, E.-G.; Kim, J.K. Executive Summary of Stroke Statistics in Korea 2018: A Report from the Epidemiology Research Council of the Korean Stroke Society. J. Stroke 2019, 21, 42–59. [Google Scholar] [CrossRef]
- Lindley, R.I.; Wardlaw, J.M.; Whiteley, W.N.; Cohen, G.; Blackwell, L.; Murray, G.D.; Sandercock, P.A.; Committee, T.S.; Baigent, C.; Chadwick, D. Alteplase for acute ischemic stroke: Outcomes by clinically important subgroups in the Third International Stroke Trial. Stroke 2015, 46, 746–756. [Google Scholar] [CrossRef] [Green Version]
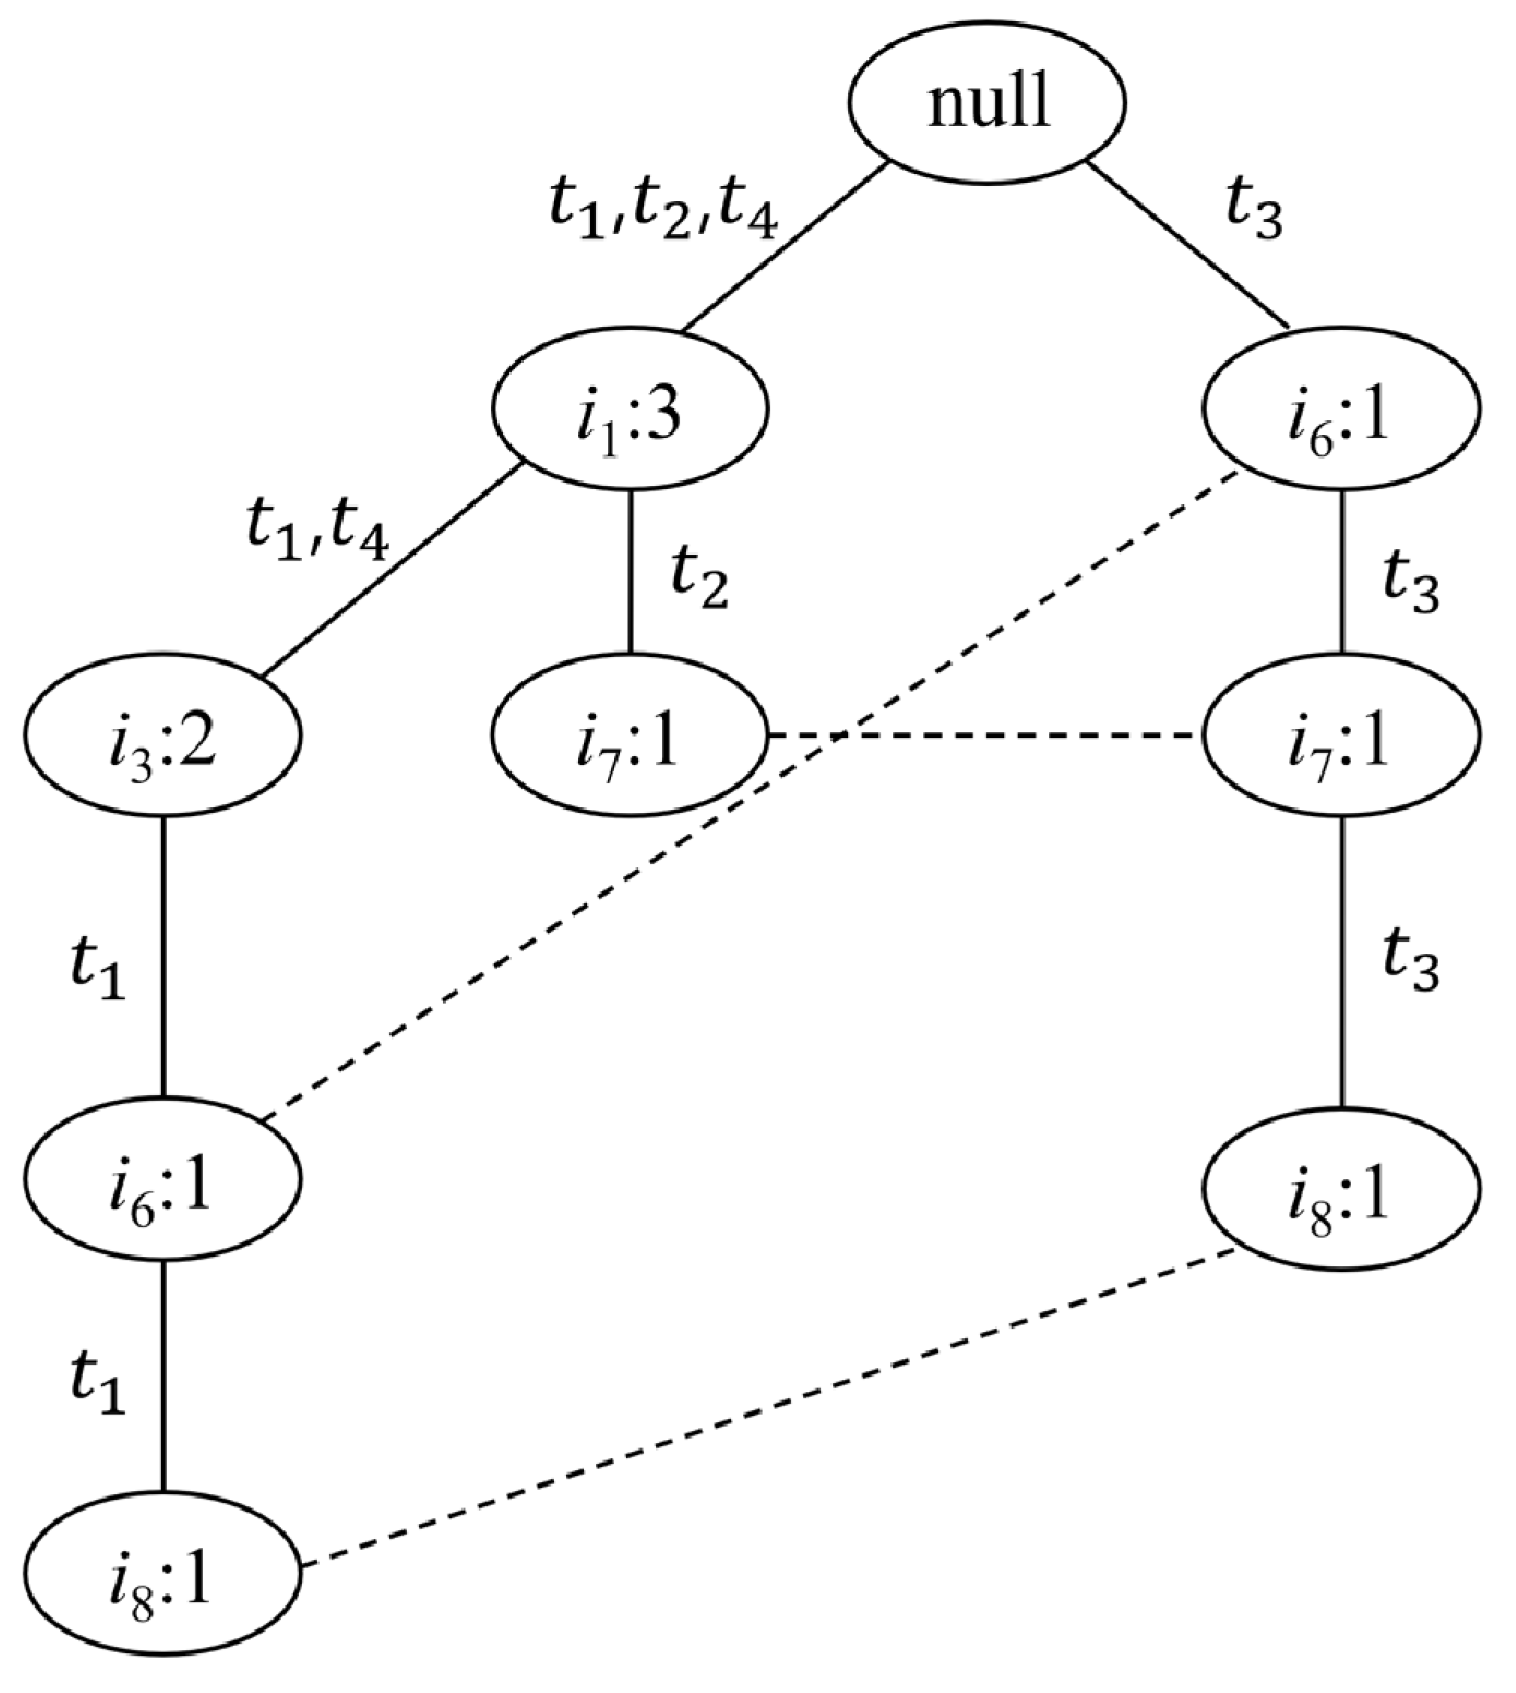
- Han, J.; Pei, J.; Yin, Y.; Mao, R. Mining frequent patterns without candidate generation: A frequent-pattern tree approach. Data Min. Knowl. Discov. 2004, 8, 53–87. [Google Scholar] [CrossRef]
- Bayardo, R.J.; Agrawal, R.; Gunopulos, D. Constraint-based rule mining in large, dense databases. Data Min. Knowl. Discov. 2000, 4, 217–240. [Google Scholar] [CrossRef]
- Whelton, S.P.; McAuley, P.A.; Dardari, Z.; Orimoloye, O.A.; Brawner, C.A.; Ehrman, J.K.; Keteyian, S.J.; Al-Mallah, M.; Blaha, M.J. Association of BMI, fitness, and mortality in patients with diabetes: Evaluating the obesity paradox in the Henry Ford exercise testing project (fit project) cohort. Diab. Care 2020, 43, 677–682. [Google Scholar] [CrossRef]
- Bhaskaran, K.; dos-Santos-Silva, I.; Leon, D.A.; Douglas, I.J.; Smeeth, L. Association of BMI with overall and cause-specific mortality: A population-based cohort study of 3·6 million adults in the UK. Lancet Diabetes Endocrinol. 2018, 6, 944–953. [Google Scholar] [CrossRef] [Green Version]
- Kim, Y.; Kim, C.K.; Jung, S.; Yoon, B.-W.; Lee, S.-H. Obesity-stroke paradox and initial neurological severity. J. Neurol. Neurosurg. Psychiatry 2015, 86, 743–747. [Google Scholar] [CrossRef]
- Winter, Y.; Rohrmann, S.; Linseisen, J.; Lanczik, O.; Ringleb, P.A.; Hebebrand, J.; Back, T. Contribution of obesity and abdominal fat mass to risk of stroke and transient ischemic attacks. Stroke 2008, 39, 3145–3151. [Google Scholar] [CrossRef] [Green Version]
- Ryu, W.-S.; Lee, S.-H.; Kim, C.K.; Kim, B.J.; Yoon, B.-W. Body mass index, initial neurological severity and long-term mortality in ischemic stroke. Cerebrovasc. Dis. 2011, 32, 170–176. [Google Scholar] [CrossRef]
- Mitchell, A.B.; Cole, J.W.; McArdle, P.F.; Cheng, Y.-C.; Ryan, K.A.; Sparks, M.J.; Mitchell, B.D.; Kittner, S.J. Obesity increases risk of ischemic stroke in young adults. Stroke 2015, 46, 1690–1692. [Google Scholar] [CrossRef] [Green Version]
- Sun, W.; Huang, Y.; Xian, Y.; Zhu, S.; Jia, Z.; Liu, R.; Li, F.; Wei, J.W.; Wang, J.-G.; Liu, M. Association of body mass index with mortality and functional outcome after acute ischemic stroke. Sci. Rep. 2017, 7, 1–8. [Google Scholar] [CrossRef] [Green Version]
- Dehlendorff, C.; Andersen, K.K.; Olsen, T.S. Body mass index and death by stroke: No obesity paradox. JAMA Neurol. 2014, 71, 978–984. [Google Scholar] [CrossRef] [Green Version]
- Szalkai, B.; Grolmusz, V.K.; Grolmusz, V.I.; Diseases, C.A.M. Identifying combinatorial biomarkers by association rule mining in the CAMD Alzheimer’s database. Arch. Gerontol. Geriatr. 2017, 73, 300–307. [Google Scholar] [CrossRef] [Green Version]
- Schäfer, I.; Kaduszkiewicz, H.; Wagner, H.-O.; Schön, G.; Scherer, M.; van den Bussche, H. Reducing complexity: A visualisation of multimorbidity by combining disease clusters and triads. BMC Public Health 2014, 14, 1–14. [Google Scholar] [CrossRef] [Green Version]
- Li, Q.; Zhang, Y.; Kang, H.; Xin, Y.; Shi, C. Mining association rules between stroke risk factors based on the Apriori algorithm. Technol. Health Care 2017, 25, 197–205. [Google Scholar] [CrossRef] [Green Version]
- Lee, S.J.; Cartmell, K.B. An Association Rule Mining Analysis of Lifestyle Behavioral Risk Factors in Cancer Survivors with High Cardiovascular Disease Risk. J. Pers. Med. 2021, 11, 366. [Google Scholar] [CrossRef] [PubMed]
- Lee, J. An insight on the use of multiple logistic regression analysis to estimate association between risk factor and disease occurrence. Int. J. Epidemiol. 1986, 15, 22–29. [Google Scholar] [CrossRef] [PubMed]
- Antonie, M.-L.; Zaïane, O.R. Mining positive and negative association rules: An approach for confined rules. In Proceedings of the European Conference on Principles of Data Mining and Knowledge Discovery, Pisa, Italy, 20–24 September 2004; pp. 27–38. [Google Scholar]
- Huang, Y.; Britton, J.; Hubbard, R.; Lewis, S. Who receives prescriptions for smoking cessation medications? An association rule mining analysis using a large primary care database. Tob. Control 2013, 22, 274–279. [Google Scholar] [CrossRef] [PubMed]

| Formula | Definition & Meaning | |
|---|---|---|
| Support | The value of support means how frequent this rule is appearing in the data. | |
| Confidence | The confidence indicates how much the rule is accurate. | |
| Lift | The lift measures the dependency between the predictor and the response. The value of lift close to zero indicates independence. |
| Original Items | Reordered Frequent Items |
|---|---|
| } | : 2} |
| } | : 2} |
| } | : 2} |
| } | : 2} |
| Good Outcome (N = 1671) | Poor Outcome (N = 909) | p | |
|---|---|---|---|
| Age, years | <0.001 | ||
| 18–54 | 441 (24.6%) | 120 (13.2%) | |
| 55–64 | 401 (24.0%) | 70 (7.8%) | |
| ≥65 | 859 (51.4%) | 719 (79.1%) | |
| BMI, kg/m2 | <0.001 | ||
| Underweight (<18.5) | 47 (2.8%) | 71 (7.8%) | |
| Normal weight (18.5–22.9) | 540 (32.3%) | 359 (39.5%) | |
| Overweight (23.0–24.9) | 463 (27.7%) | 220 (24.2%) | |
| Obese (≥25) | 621 (37.2%) | 259 (28.5%) | |
| Stroke Severity, NIHSS | <0.001 | ||
| Mild (0–5) | 1534 (91.8%) | 479 (52.7%) | |
| Moderate (6–14) | 100 (6.0%) | 226 (24.9%) | |
| Severe (>14) | 37 (2.2%) | 204 (22.4%) | |
| Men | 1068 (63.9%) | 457 (50.3%) | <0.001 |
| Hypertension | 947 (56.7%) | 624 (68.6%) | <0.001 |
| Diabetes | 446 (26.7%) | 319 (35.1%) | <0.001 |
| Current Smoking | 578 (34.6%) | 184 (20.2%) | <0.001 |
| Cardioembolism | 292 (17.5%) | 245 (27.0%) | <0.001 |
| Thrombolysis | 138 (8.3%) | 135 (14.9%) | <0.001 |
| Hyperlipidemia | 293 (17.5%) | 156 (17.2%) | 0.854 |
| Underweight (N = 118) | Normal Weight (N = 899) | Overweight (N = 683) | Obese (N = 880) | p | |
|---|---|---|---|---|---|
| Age, years | <0.001 † | ||||
| 18–54 years | 13 (11.0%) | 142 (15.8%) | 110 (16.1%) | 206 (23.4%) | |
| 55–64 years | 12 (10.2%) | 162 (18.0%) | 169 (24.7%) | 188 (21.4%) | |
| ≥65 years | 93 (78.8%) | 595 (66.2%) | 404 (59.2%) | 486 (55.2%) | |
| Stroke Severity, NIHSS | <0.001 | ||||
| Mild (0–5) | 70 (59.3%) | 658 (73.2%) | 550 (80.5%) | 735 (83.5%) | |
| Moderate (6–14) | 25 (21.2%) | 131 (14.6%) | 76 (11.1%) | 94 (10.7%) | |
| Severe (>14) | 23 (19.5%) | 110 (12.2%) | 57 (8.3%) | 51 (5.8%) | |
| Stroke Mechanism | <0.001 | ||||
| CE | 39 (33.1%) | 220 (24.5%) | 130 (19.0%) | 148 (16.8%) | |
| Non-CE | 79 (66.9%) | 679 (75.5%) | 553 (81.0%) | 732 (83.2%) | |
| Outcome at 3 months | <0.001 | ||||
| Good (mRS score 0–2) | 47 (39.8%) | 540 (60.1%) | 463 (67.8%) | 621 (70.6%) | |
| Poor (mRS score 3–6) | 71 (60.2%) | 359 (39.9%) | 220 (32.2%) | 259 (29.4%) | |
| Men | 49 (41.5%) | 495 (55.1%) | 432 (63.3%) | 549 (62.4%) | <0.001 |
| Hypertension | 67 (56.8%) | 492 (54.7%) | 200 (29.3%) | 281 (31.9%) | <0.001 |
| Hyperlipidemia | 9 (7.6%) | 146 (16.2%) | 113 (16.5%) | 181 (20.6%) | 0.002 |
| Current Smoking | 19 (16.1%) | 268 (29.8%) | 201 (29.4%) | 274 (31.1%) | 0.010 |
| Diabetes | 37 (31.4%) | 247 (27.5%) | 200 (29.3%) | 281 (31.9%) | 0.217 |
| Thrombolysis | 12 (10.2%) | 101 (11.2%) | 70 (10.2%) | 90 (10.2%) | 0.891 |
| Univariate OR (95% CI) | p | Multivariate OR (95% CI) | p | |
|---|---|---|---|---|
| Age, years | ||||
| 18–54 | 0.29 (0.24–0.36) | 0.001 | 0.63 (0.44–0.91) | 0.013 |
| 55–64 | 1.00 (reference) | - | 1.00 (reference) | - |
| ≥65 | 2.87 (2.29–3.59) | <0.001 | 2.26 (1.74–2.93) | <0.001 |
| BMI, kg/m2 | ||||
| Underweight (<18.5) | 2.27 (1.54–3.36) | <0.001 | 1.69 (1.07–2.66) | 0.024 |
| Normal weight (18.5–22.9) | 1.00 (reference) | - | 1.00 (reference) | - |
| Overweight (23.0–24.9) | 0.71 (0.58–0.88) | 0.001 | 0.82 (0.64–1.05) | 0.119 |
| Obese (≥25) | 0.63 (0.52–0.76) | <0.001 | 0.78 (0.62–0.99) | 0.041 |
| Stroke Severity, NIHSS | ||||
| Mild (0–5) | 0.14 (0.11–0.18) | <0.001 | 0.11 (0.08–0.15) | <0.001 |
| Moderate (6–14) | 1.00 (reference) | - | 1.00 (reference) | - |
| Severe (>14) | 2.44 (1.60–3.72) | <0.001 | 2.37 (1.51–3.70) | <0.001 |
| Diabetes | 1.49 (1.25–1.77) | <0.001 | 1.61 (1.30–1.99) | <0.001 |
| Current Smoking | 0.48 (0.40–0.58) | <0.001 | 0.67 (0.52–0.86) | 0.001 |
| Thrombolysis | 1.94 (1.51–2.49) | <0.001 | 0.64 (0.45–0.91) | 0.012 |
| Cardioembolism | 1.74 (1.44–2.11) | <0.001 | 0.75 (0.58–0.96) | 0.024 |
| Hypertension | 1.67 (1.41–1.98) | <0.001 | 1.14 (0.92–1.41) | 0.228 |
| Hyperlipidemia | 0.97 (0.79–1.21) | 0.811 | 0.90 (0.70–1.17) | 0.444 |
| Men | 0.57 (0.48–0.67) | <0.001 | 0.92 (0.75–1.14) | 0.854 |
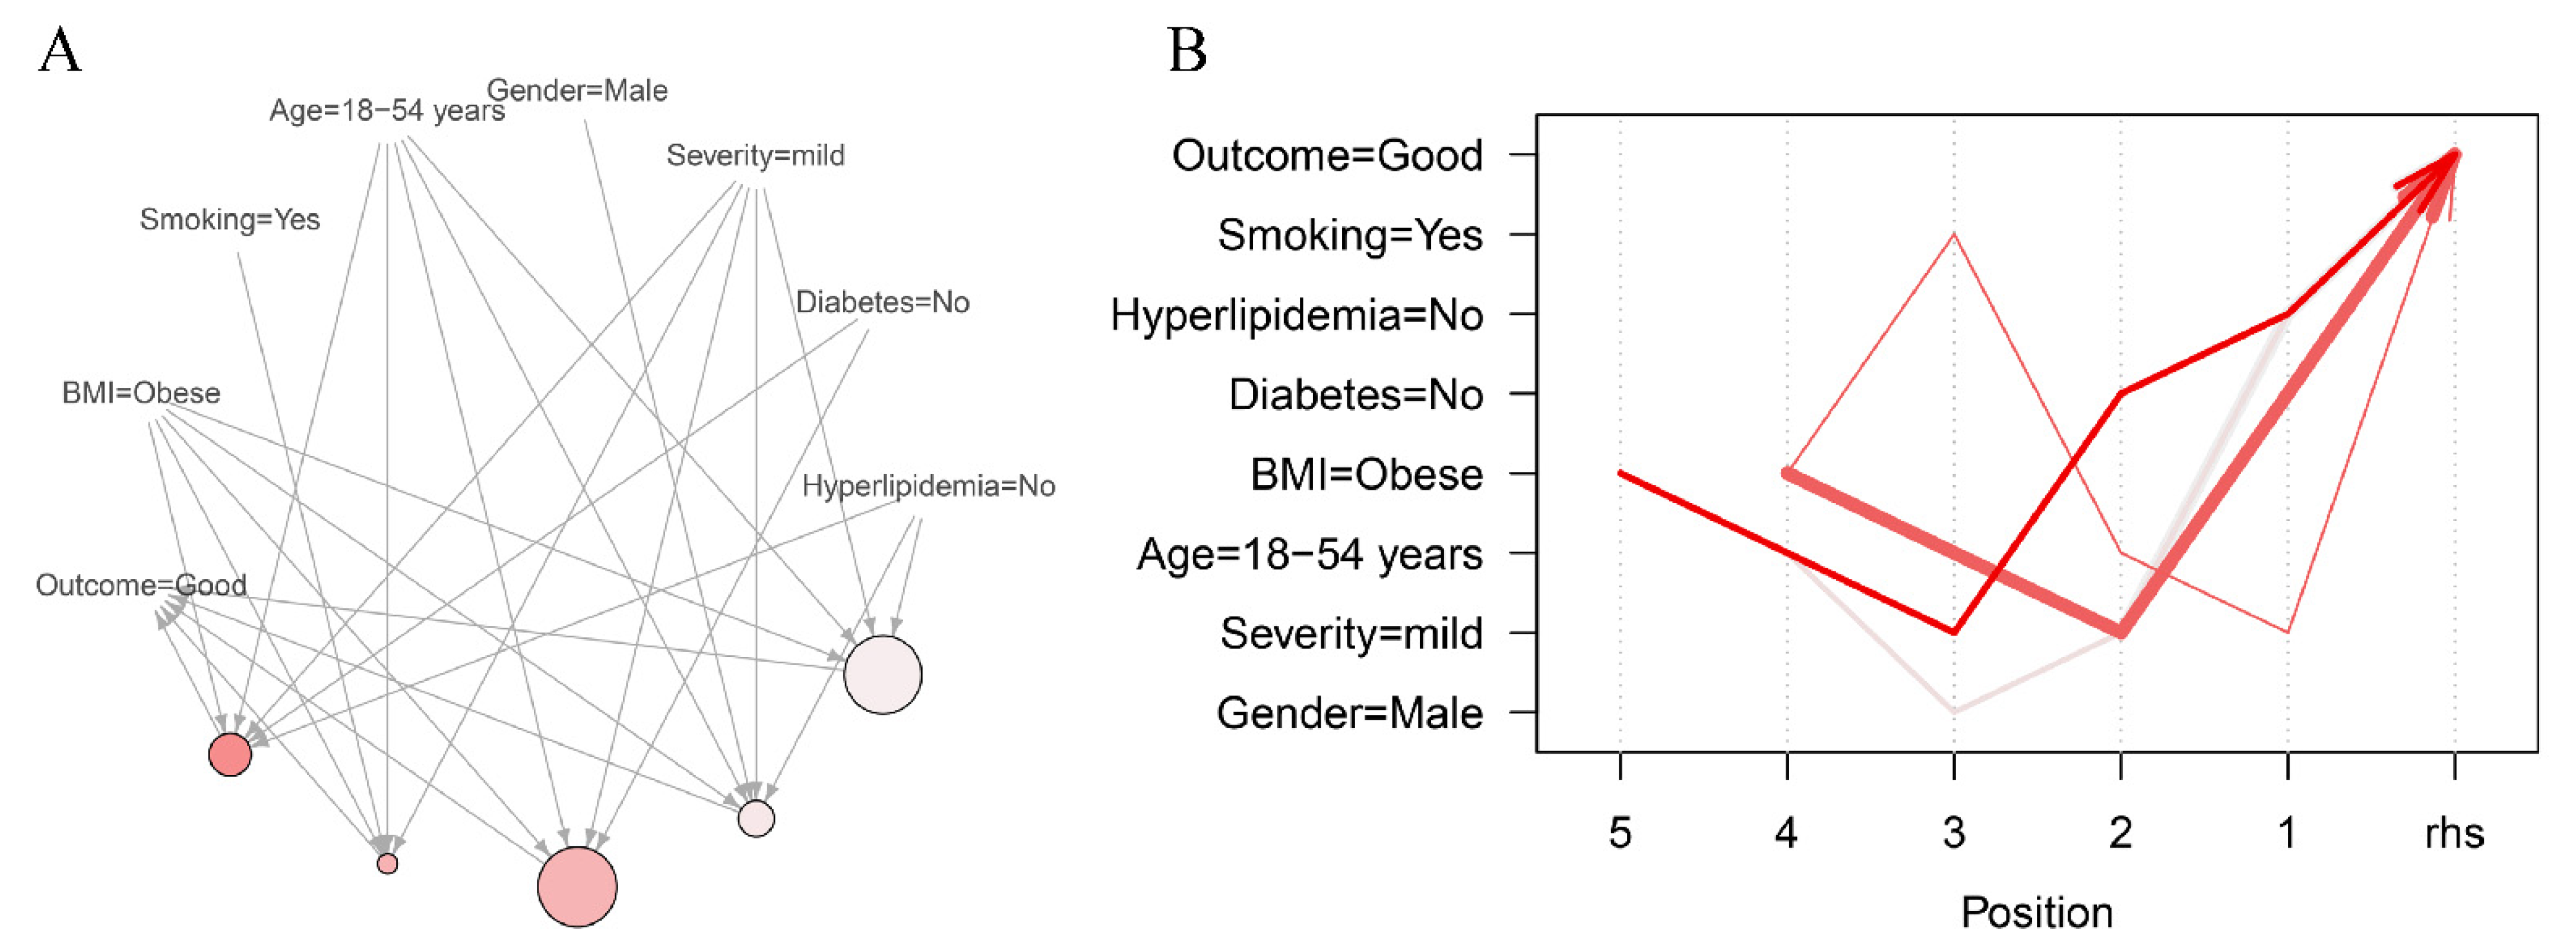
| LHS | RHS | Support | Confidence | Lift | Count | |
|---|---|---|---|---|---|---|
| 1 | {Hyperlipidemia = No, Diabetes = No, Severity = mild, Age = 18–54 years, BMI = Obese} | Good | 0.0488 | 0.9767 | 1.5080 | 126 |
| 2 | {Severity = mild, Age = 18–54 years, Smoking = Yes, BMI = Obese} | Good | 0.0434 | 0.9739 | 1.5037 | 112 |
| 3 | {Diabetes = No, Severity = mild, Age = 18–54 years, BMI = Obese} | Good | 0.0577 | 0.9738 | 1.5036 | 149 |
| 4 | {Hyperlipidemia = No, Severity = mild, Gender = Male, Age = 18–54 years, BMI = Obese} | Good | 0.0472 | 0.9682 | 1.4949 | 122 |
| 5 | {Hyperlipidemia = No, Severity = mild, Age = 18–54 years, BMI = Obese} | Good | 0.0573 | 0.9673 | 1.4935 | 148 |
Publisher’s Note: MDPI stays neutral with regard to jurisdictional claims in published maps and institutional affiliations. |
© 2021 by the authors. Licensee MDPI, Basel, Switzerland. This article is an open access article distributed under the terms and conditions of the Creative Commons Attribution (CC BY) license (https://creativecommons.org/licenses/by/4.0/).
Share and Cite
Kim, P.-J.; Kim, C.; Lee, S.-H.; Shon, J.-H.; Kwon, Y.; Kim, J.-H.; Kim, D.-K.; Yu, H.; Ahn, H.-J.; Jeon, J.-P.; et al. Another Look at Obesity Paradox in Acute Ischemic Stroke: Association Rule Mining. J. Pers. Med. 2022, 12, 16. https://doi.org/10.3390/jpm12010016
Kim P-J, Kim C, Lee S-H, Shon J-H, Kwon Y, Kim J-H, Kim D-K, Yu H, Ahn H-J, Jeon J-P, et al. Another Look at Obesity Paradox in Acute Ischemic Stroke: Association Rule Mining. Journal of Personalized Medicine. 2022; 12(1):16. https://doi.org/10.3390/jpm12010016
Chicago/Turabian StyleKim, Pum-Jun, Chulho Kim, Sang-Hwa Lee, Jong-Hee Shon, Youngsuk Kwon, Jong-Ho Kim, Dong-Kyu Kim, Hyunjae Yu, Hyo-Jeong Ahn, Jin-Pyeong Jeon, and et al. 2022. "Another Look at Obesity Paradox in Acute Ischemic Stroke: Association Rule Mining" Journal of Personalized Medicine 12, no. 1: 16. https://doi.org/10.3390/jpm12010016
APA StyleKim, P.-J., Kim, C., Lee, S.-H., Shon, J.-H., Kwon, Y., Kim, J.-H., Kim, D.-K., Yu, H., Ahn, H.-J., Jeon, J.-P., Kim, Y., & Lee, J.-J. (2022). Another Look at Obesity Paradox in Acute Ischemic Stroke: Association Rule Mining. Journal of Personalized Medicine, 12(1), 16. https://doi.org/10.3390/jpm12010016