
Plasma Extracellular Vesicle Characteristics Correlate with Tumor Differentiation and Predict Overall Survival in Patients with Pancreatic Ductal Adenocarcinoma Undergoing Surgery with Curative Intent

 , , , , , and
Abstract

1. Introduction
2. Materials and Methods
2.1. Study Design and Data Collection
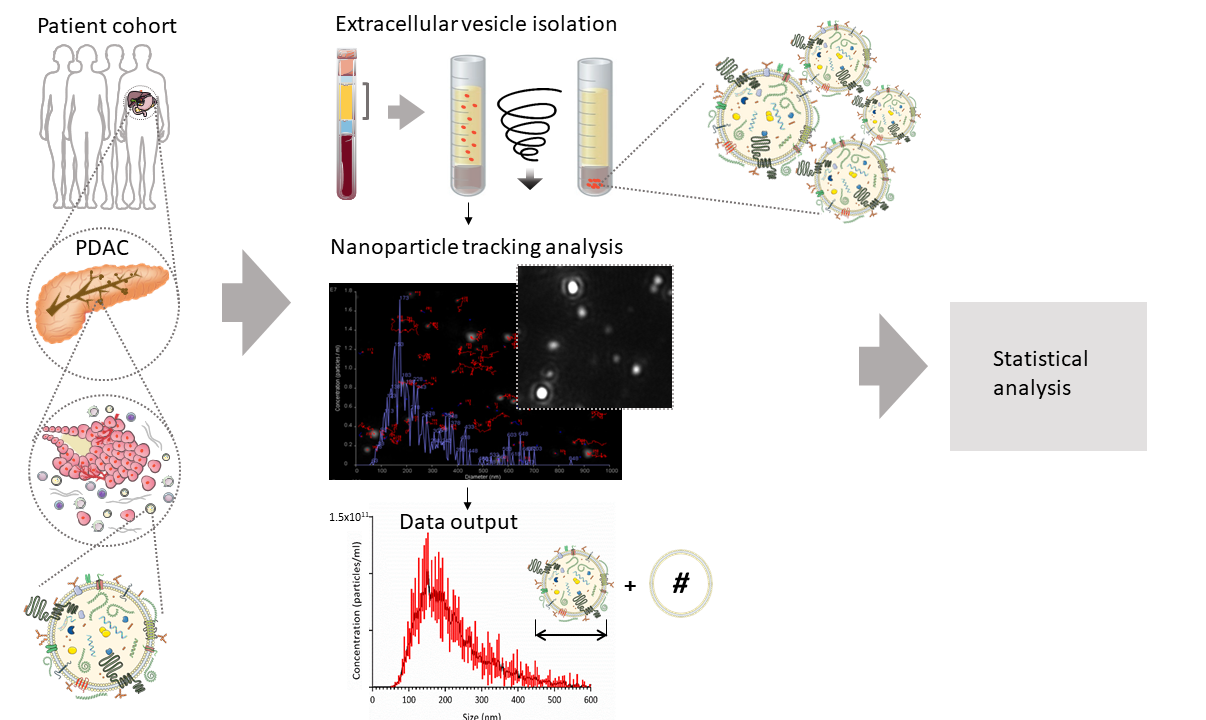
2.2. Small EV Isolation from Blood Plasma
2.3. Quantification of sEV Concentration and Size
2.4. Statistical Analysis
3. Results
3.1. Patient Characteristics
3.2. Patients’ Plasma sEV Characteristics
3.3. Association between Patients’ Clinical and Plasma sEV Characteristics
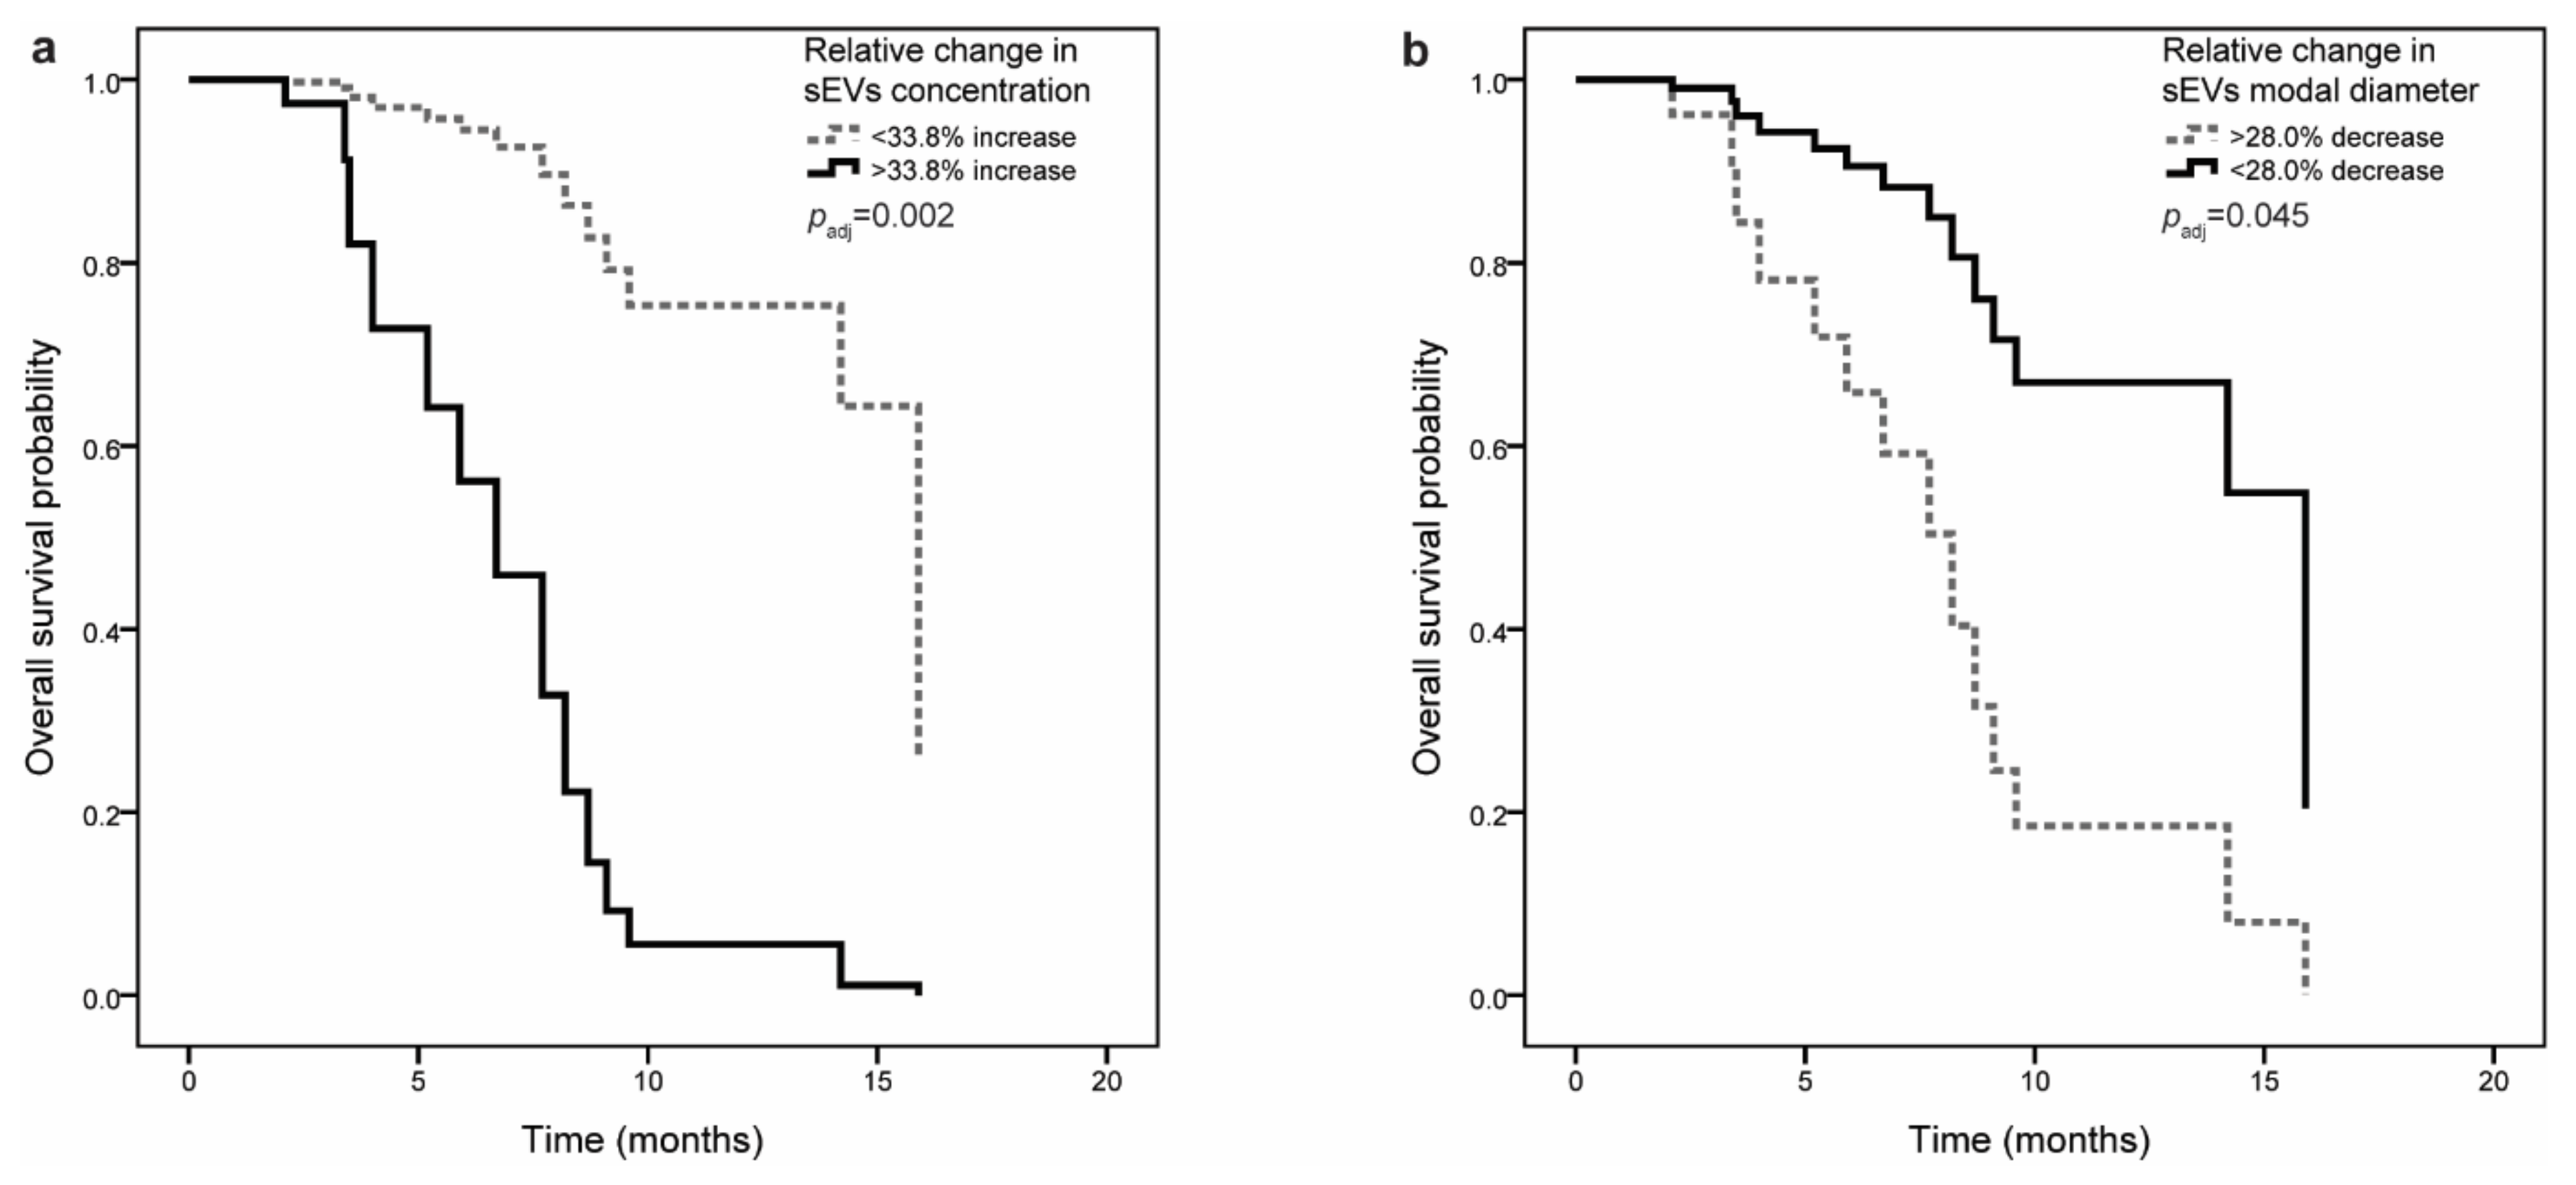
3.4. Patients’ Clinical and Plasma sEV Characteristics and Overall Survival
4. Discussion
Supplementary Materials
Author Contributions
Funding
Institutional Review Board Statement
Informed Consent Statement
Acknowledgments
Conflicts of Interest
References
- Siegel, R.L.; Miller, K.D.; Jemal, A. Cancer statistics, 2019. CA. Cancer J. Clin. 2019, 69, 7–34. [Google Scholar] [CrossRef] [PubMed]
- Malvezzi, M.; Bertuccio, P.; Levi, F.; La Vecchia, C.; Negri, E. European cancer mortality predictions for the year 2014. Ann. Oncol. 2014, 25, 1650–1656. [Google Scholar] [CrossRef] [PubMed]
- Ryan, D.P.; Hong, T.S.; Bardeesy, N. Pancreatic Adenocarcinoma. N. Engl. J. Med. 2014, 371, 1039–1049. [Google Scholar] [CrossRef] [PubMed]
- Ducreux, M.; Sa Cuhna, A.; Caramella, C.; Hollebecque, A.; Burtin, P.; Goéré, D.; Seufferlein, T.; Haustermans, K.; Van Laethem, J.L.; Brousse, P. Cancer of the pancreas: ESMO Clinical Practice Guidelines for diagnosis, treatment and follow-up. Ann. Oncol. 2015, 26, 56–68. [Google Scholar] [CrossRef] [PubMed]
- Hackert, T.; Ulrich, A.; Büchler, M.W. Borderline resectable pancreatic cancer. Cancer Lett. 2016, 375, 231–237. [Google Scholar] [CrossRef]
- Bockhorn, M.; Uzunoglu, F.G.; Adham, M.; Imrie, C.; Milicevic, M.; Sandberg, A.A.; Asbun, H.J.; Bassi, C.; Büchler, M.; Charnley, R.M.; et al. Borderline resectable pancreatic cancer: A consensus statement by the International Study Group of Pancreatic Surgery (ISGPS). Surgery 2014, 155, 977–988. [Google Scholar] [CrossRef]
- Nurmi, A.; Mustonen, H.; Parviainen, H.; Peltola, K.; Haglund, C.; Seppänen, H. Neoadjuvant therapy offers longer survival than upfront surgery for poorly differentiated and higher stage pancreatic cancer. Acta Oncol. (Madr). 2018, 57, 799–806. [Google Scholar] [CrossRef]
- Zhang, L.; Sanagapalli, S.; Stoita, A. Challenges in diagnosis of pancreatic cancer. World J. Gastroenterol. 2018, 24, 2047–2060. [Google Scholar] [CrossRef]
- Singhi, A.D.; Koay, E.J.; Chari, S.T.; Maitra, A. Early Detection of Pancreatic Cancer: Opportunities and Challenges. Gastroenterology 2019, 156, 2024–2040. [Google Scholar] [CrossRef]
- Van Veldhuisen, E.; Vogel, J.A.; Klompmaker, S.; Busch, O.R.; van Laarhoven, H.W.M.; van Lienden, K.P.; Wilmink, J.W.; Marsman, H.A.; Besselink, M.G. Added value of CA19-9 response in predicting resectability of locally advanced pancreatic cancer following induction chemotherapy. HPB (Oxford) 2018, 20, 605–611. [Google Scholar] [CrossRef]
- Barugola, G.; Partelli, S.; Marcucci, S.; Sartori, N.; Capelli, P.; Bassi, C.; Pederzoli, P.; Falconi, M. Resectable pancreatic cancer: Who really benefits from resection? Ann. Surg. Oncol. 2009, 16, 3316–3322. [Google Scholar] [CrossRef] [PubMed]
- Wasif, N.; Ko, C.Y.; Farrell, J.; Wainberg, Z.; Hines, O.J.; Reber, H.; Tomlinson, J.S. Impact of Tumor Grade on Prognosis in Pancreatic Cancer: Should We Include Grade in AJCC Staging? Ann. Surg. Oncol. 2010, 17, 2312–2320. [Google Scholar] [CrossRef] [PubMed]
- Groot, V.P.; Gemenetzis, G.; Blair, A.B.; Rivero-Soto, R.J.; Yu, J.; Javed, A.A.; Burkhart, R.A.; Rinkes, I.H.M.B.; Molenaar, I.Q.; Cameron, J.L.; et al. Defining and Predicting Early Recurrence in 957 Patients with Resected Pancreatic Ductal Adenocarcinoma. Ann. Surg. 2019, 269, 1154–1162. [Google Scholar] [CrossRef] [PubMed]
- Mattiucci, G.C.; Morganti, A.G.; Cellini, F.; Buwenge, M.; Casadei, R.; Farioli, A.; Alfieri, S.; Arcelli, A.; Bertini, F.; Calvo, F.A.; et al. Prognostic Impact of Presurgical CA19-9 Level in Pancreatic Adenocarcinoma: A Pooled Analysis. Transl. Oncol. 2019, 12, 1–7. [Google Scholar] [CrossRef] [PubMed]
- Larghi, A.; Correale, L.; Ricci, R.; Abdulkader, I.; Monges, G.; Iglesias-Garcia, J.; Giovannini, M.; Attili, F.; Vitale, G.; Hassan, C.; et al. Interobserver agreement and accuracy of preoperative endoscopic ultrasound-guided biopsy for histological grading of pancreatic cancer. Endoscopy 2014, 47, 308–314. [Google Scholar] [CrossRef]
- Qi, Z.-H.; Xu, H.-X.; Zhang, S.-R.; Xu, J.-Z.; Li, S.; Gao, H.-L.; Jin, W.; Wang, W.-Q.; Wu, C.-T.; Ni, Q.-X.; et al. The Significance of Liquid Biopsy in Pancreatic Cancer. J. Cancer 2018, 9, 3417–3426. [Google Scholar] [CrossRef]
- Otandault, A.; Anker, P.; Al Amir Dache, Z.; Guillaumon, V.; Meddeb, R.; Pastor, B.; Pisareva, E.; Sanchez, C.; Tanos, R.; Tousch, G.; et al. Recent advances in circulating nucleic acids in oncology. Ann. Oncol. 2019, 30, 374–384. [Google Scholar] [CrossRef]
- Luchini, C.; Veronese, N.; Nottegar, A.; Cappelletti, V.; Daidone, M.G.; Smith, L.; Parris, C.; Brosens, L.A.A.; Caruso, M.G.; Cheng, L.; et al. cancers Liquid Biopsy as Surrogate for Tissue for Molecular Profiling in Pancreatic Cancer: A Meta-Analysis Towards Precision Medicine. Cancers (Basel) 2019, 11, 1152. [Google Scholar] [CrossRef]
- Rofi, E.; Vivaldi, C.; Del Re, M.; Arrigoni, E.; Crucitta, S.; Funel, N.; Fogli, S.; Vasile, E.; Musettini, G.; Fornaro, L.; et al. The emerging role of liquid biopsy in diagnosis, prognosis and treatment monitoring of pancreatic cancer. Pharmacogenomics 2019, 20, 49–68. [Google Scholar] [CrossRef]
- Sun, K.; Jiang, P.; Chan, K.A.; Wong, J.; Cheng, Y.K.; Liang, R.H.; Chan, W.K.; Ma, E.S.; Chan, S.L.; Cheng, S.H.; et al. Plasma DNA tissue mapping by genome-wide methylation sequencing for noninvasive prenatal, cancer, and transplantation assessments. Proc. Nat. Acad. Sci. USA 2015, 112, E5503–E5512. [Google Scholar] [CrossRef]
- Gai, W.; Sun, K. Epigenetic Biomarkers in Cell-Free DNA and Applications in Liquid Biopsy. Genes (Basel) 2019, 10, 32. [Google Scholar] [CrossRef] [PubMed]
- González, E.; Falcón-Pérez, J.M. Cell-derived extracellular vesicles as a platform to identify low-invasive disease biomarkers. Expert Rev. Mol. Diagn. 2015, 15, 907–923. [Google Scholar] [CrossRef] [PubMed]
- Wong, C.-H.; Chen, Y.-C. Clinical significance of exosomes as potential biomarkers in cancer. World J. Clin. Cases 2019, 7, 171–190. [Google Scholar] [CrossRef] [PubMed]
- Massoumi, R.L.; Hines, O.J.; Eibl, G.; King, J.C. Emerging Evidence for the Clinical Relevance of Pancreatic Cancer Exosomes. Pancreas 2019, 48, 1–8. [Google Scholar] [CrossRef]
- Yee, N.S.; Zhang, S.; He, H.Z.; Zheng, S.Y. Extracellular vesicles as potential biomarkers for early detection and diagnosis of pancreatic cancer. Biomedicines 2020, 8, 1–20. [Google Scholar] [CrossRef]
- LeBleu, V.S.; Kalluri, R. Exosomes as a Multicomponent Biomarker Platform in Cancer. Trends Cancer 2020, 6, 767–774. [Google Scholar] [CrossRef]
- Allenson, K.; Castillo, J.; San Lucas, F.A.; Scelo, G.; Kim, D.U.; Bernard, V.; Davis, G.; Kumar, T.; Katz, M.; Overman, M.J.; et al. High prevalence of mutant KRAS in circulating exosome-derived DNA from early-stage pancreatic cancer patients. Ann. Oncol. Off. J. Eur. Soc. Med. Oncol. 2017, 28, 741–747. [Google Scholar] [CrossRef]
- Lai, X.; Wang, M.; McElyea, S.D.; Sherman, S.; House, M.; Korc, M. A microRNA signature in circulating exosomes is superior to exosomal glypican-1 levels for diagnosing pancreatic cancer. Cancer Lett. 2017, 393, 86–93. [Google Scholar] [CrossRef]
- Melo, S.A.; Luecke, L.B.; Kahlert, C.; Fernandez, A.F.; Gammon, S.T.; Kaye, J.; LeBleu, V.S.; Mittendorf, E.A.; Weitz, J.; Rahbari, N.; et al. Glypican-1 identifies cancer exosomes and detects early pancreatic cancer. Nature 2015, 523, 177–182. [Google Scholar] [CrossRef]
- Buscail, E.; Alix-Panabières, C.; Quincy, P.; Cauvin, T.; Chauvet, A.; Degrandi, O.; Caumont, C.; Verdon, S.; Lamrissi, I.; Moranvillier, I.; et al. High Clinical Value of Liquid Biopsy to Detect Circulating Tumor Cells and Tumor Exosomes in Pancreatic Ductal Adenocarcinoma Patients Eligible for Up-Front Surgery. Cancers (Basel) 2019, 11, 1656. [Google Scholar] [CrossRef]
- Clayton, A.; Buschmann, D.; Byrd, J.B.; Carter, D.R.F.; Cheng, L.; Compton, C.; Daaboul, G.; Devitt, A.; Falcon-Perez, J.M.; Gardiner, C.; et al. Summary of the ISEV workshop on extracellular vesicles as disease biomarkers, held in Birmingham, UK, during December 2017. J. Extracell. Vesicles 2018, 7, 1473707. [Google Scholar] [CrossRef] [PubMed]
- Holcar, M.; Ferdin, J.; Sitar, S.; Tušek-Žnidarič, M.; Dolžan, V.; Plemenitaš, A.; Žagar, E.; Lenassi, M. Enrichment of plasma extracellular vesicles for reliable quantification of their size and concentration for biomarker discovery. Sci. Rep. 2020. [CrossRef]
- Huang, K.; Fang, C.; Yi, K.; Liu, X.; Qi, H.; Tan, Y.; Zhou, J.; Li, Y.; Liu, M.; Zhang, Y.; et al. The role of PTRF/Cavin1 as a biomarker in both glioma and serum exosomes. Theranostics 2018, 8, 1540–1557. [Google Scholar] [CrossRef] [PubMed]
- Silva, J.; Garcia, V.; Rodriguez, M.; Compte, M.; Cisneros, E.; Veguillas, P.; Garcia, J.M.; Dominguez, G.; Campos-Martin, Y.; Cuevas, J.; et al. Analysis of exosome release and its prognostic value in human colorectal cancer. Genes. Chromosomes Cancer 2012, 51, 409–418. [Google Scholar] [CrossRef]
- Muller, L.; Muller-Haegele, S.; Mitsuhashi, M.; Gooding, W.; Okada, H.; Whiteside, T.L. Exosomes isolated from plasma of glioma patients enrolled in a vaccination trial reflect antitumor immune activity and might predict survival. Oncoimmunology 2015, 4, e1008347. [Google Scholar] [CrossRef]
- Navarro, A.; Molins, L.; Marrades, R.M.; Moises, J.; Viñolas, N.; Morales, S.; Canals, J.; Castellano, J.J.; Ramírez, J.; Monzo, M. Exosome Analysis in Tumor-Draining Pulmonary Vein Identifies NSCLC Patients with Higher Risk of Relapse after Curative Surgery. Cancers (Basel) 2019, 21, 11. [Google Scholar] [CrossRef]
- Takahasi, K.; Iinuma, H.; Wada, K.; Minezaki, S.; Kawamura, S.; Kainuma, M.; Ikeda, Y.; Shibuya, M.; Miura, F.; Sano, K. Usefulness of exosome-encapsulated microRNA-451a as a minimally invasive biomarker for prediction of recurrence and prognosis in pancreatic ductal adenocarcinoma. J. Hepato Biliary Pancreat. Sci. 2018, 25, 155–161. [Google Scholar] [CrossRef]
- Kawamura, S.; Iinuma, H.; Wada, K.; Takahashi, K.; Minezaki, S.; Kainuma, M.; Shibuya, M.; Miura, F.; Sano, K. Exosome-encapsulated microRNA-4525, microRNA-451a and microRNA-21 in portal vein blood is a high-sensitive liquid biomarker for the selection of high-risk pancreatic ductal adenocarcinoma patients. J. Hepato Biliary Pancreat. Sci. 2019, 26, 63–72. [Google Scholar] [CrossRef]
- Li, Z.; Yanfang, W.; Li, J.; Jiang, P.; Peng, T.; Chen, K.; Zhao, X.; Zhang, Y.; Zhen, P.; Zhu, J.; et al. Tumor-released exosomal circular RNA PDE8A promotes invasive growth via the miR-338/MACC1/MET pathway in pancreatic cancer. Cancer Lett. 2018, 432, 237–250. [Google Scholar] [CrossRef]
- Li, Z.; Tao, Y.; Wang, X.; Jiang, P.; Li, J.; Peng, M.; Zhang, X.; Chen, K.; Liu, H.; Zhen, P.; et al. Tumor-Secreted Exosomal miR-222 Promotes Tumor Progression via Regulating P27 Expression and Re-Localization in Pancreatic Cancer. Cell. Physiol. Biochem. 2018, 51, 610–629. [Google Scholar] [CrossRef]
- Oehme, F.; Krahl, S.; Gyorffy, B.; Muessle, B.; Rao, V.; Greif, H.; Ziegler, N.; Lin, K.; Thepkaysone, M.-L.; Polster, H.; et al. Low level of exosomal long non-coding RNA HOTTIP is a prognostic biomarker in colorectal cancer. RNA Biol. 2019, 1–7. [Google Scholar] [CrossRef] [PubMed]
- Helley, D.; Banu, E.; Bouziane, A.; Banu, A.; Scotte, F.; Fischer, A.-M.; Oudard, S. Platelet Microparticles: A Potential Predictive Factor of Survival in Hormone-Refractory Prostate Cancer Patients Treated with Docetaxel-Based Chemotherapy. Eur. Urol. 2009, 56, 479–485. [Google Scholar] [CrossRef] [PubMed]
- Matsumoto, Y.; Kano, M.; Akutsu, Y.; Hanari, N.; Hoshino, I.; Murakami, K.; Usui, A.; Suito, H.; Takahashi, M.; Otsuka, R.; et al. Quantification of plasma exosome is a potential prognostic marker for esophageal squamous cell carcinoma. Oncol. Rep. 2016, 36, 2535–2543. [Google Scholar] [CrossRef] [PubMed]
- Liu, Q.; Xiang, Y.; Yuan, S.; Xie, W.; Li, C.; Hu, Z.; Wu, N.; Wu, L.; Yu, Z.; Bai, L.; et al. Plasma exosome levels in non-small-cell lung cancer: Correlation with clinicopathological features and prognostic implications. Cancer Biomark. 2018, 22, 267–274. [Google Scholar] [CrossRef] [PubMed]
- Osti, D.; Del Bene, M.; Rappa, G.; Santos, M.; Matafora, V.; Richichi, C.; Faletti, S.; Beznoussenko, G.V.; Mironov, A.; Bachi, A.; et al. Clinical Significance of Extracellular Vesicles in Plasma from Glioblastoma Patients. Clin. Cancer Res. 2019, 5, 266–276. [Google Scholar] [CrossRef]
- Rodríguez Zorrilla, S.; Pérez-Sayans, M.; Fais, S.; Logozzi, M.; Torreira, M.G.; García García, A. A Pilot Clinical Study on the Prognostic Relevance of Plasmatic Exosomes Levels in Oral Squamous Cell Carcinoma Patients. Cancers (Basel) 2019, 11, 429. [Google Scholar] [CrossRef] [PubMed]
- Chan, B.D.; Wong, W.; Lee, M.M.; Cho, W.C.; Yee, B.K.; Kwan, Y.W.; Tai, W.C. Exosomes in Inflammation and Inflammatory Disease. Proteomics 2019, 19, 1800149. [Google Scholar] [CrossRef]
- Stevic, I.; Buescher, G.; Ricklefs, F.L. Monitoring Therapy Efficiency in Cancer through Extracellular Vesicles. Cells 2020, 9, 130. [Google Scholar] [CrossRef]
- Vasconcelos, M.H.; Caires, H.R.; Ābols, A.; Xavier, C.P.R.; Linē, A. Extracellular vesicles as a novel source of biomarkers in liquid biopsies for monitoring cancer progression and drug resistance. Drug Resist. Updates 2019, 47, 100647. [Google Scholar] [CrossRef]


| Variables # | Study Patients n = 34 | w/o Resection n = 16 | With Resection n = 18 | p-Value * | |
|---|---|---|---|---|---|
| Sex | Male, n (%) | 21 (61.8) | 11 (68.8) | 10 (55.6) | 0.497 c |
| Female, n (%) | 13 (38.2) | 5 (31.3) | 8 (44.4) | ||
| Age | Years, median (25–75%) | 68.5 (64.8–77.0) | 68.5 (65.0–76.5) | 67.5 (60.8–77.0) | 0.621 d |
| ASA score | 2, n (%) | 10 (30.3) [1] | 5 (31.3) | 5 (29.4) [1] | 1.000 c |
| 3, n (%) | 23 (69.7) | 11 (68.8) | 12 (70.6) | ||
| Smoking | No, n (%) | 14 (43.8) [2] | 7 (50.0) [2] | 7 (38.9) | 0.721 c |
| Yes, n (%) | 18 (56.3) | 7 (50.0) | 11 (61.1) | ||
| Alcohol consumption | None, n (%) | 9 (28.1) [2] | 4 (28.6) [2] | 5 (27.8) | 0.453 c |
| Occasional, n (%) | 12 (37.5) | 7 (50.0) | 5 (27.8) | ||
| Moderate, n (%) | 10 (31.3) | 3 (21.4) | 7 (38.9) | ||
| Heavy, n (%) | 1 (3.1) | 0 (0.0) | 1 (5.6) | ||
| BMI a | kg/m2, median (25–75%) | 24.9 (21.5–28.2) | 25.3 (22.4–27.9) | 23.3 (21.5–28.6) | 0.613 |
| WBC count a | ×109/l, median (25–75%) | 7.5 (5.6–9.1) [1] | 7.5 (5.9–8.7) | 7.5 (5.4–9.5) [1] | 0.901 d |
| CRP a | mg/l, median (25–75%) | 5 (5–22) [1] | 8.5 (5.0–34.3) | 5 (5–8.5) [1] | 0.102 d |
| CA 19-9 a | kU/L, median (25–75%) | 787.1 (48.0–4568.1) | 1967 (61–4699.2) | 439.0 (48–4055.5) | 0.597 d |
| CEA a | µg/L, median (25–75%) | 4.4 (1.9–8.2) | 4.7 (2.1–8.6) | 4.4 (1.9–7.5) | 0.905 d |
| Preoperatively evaluatedtumor size | mm, median (25–75%) | 30 (25–44.5) [1] | 34 (25.8–46.5) | 28 (24.5–39) [1] | 0.309 d |
| Borderline resectable | No, n (%) | 24 (70.6) | 9 (37.5) | 15 (62.5) | 0.134 |
| Yes, n (%) | 10 (29.4) | 7 (70.0) | 3 (30.0) | ||
| Distant metastases b | No, n (%) | 23 (67.6) | 7 (43.8) | 16 (88.9) | 0.009 c |
| Yes, n (%) | 11 (32.4) | 9 (56.3) | 2 (11.1) | ||
| Tumor differentiation c | Poor, n (%) | 14 (45.2) [3] | 7 (50.0) [2] | 7 (41.2) [1] | 1.000 c |
| Moderate, n (%) | 16 (51.6) | 7 (50.0) | 9 (52.9) | ||
| Well, n (%) | 1 (3.2) | 0 (0.0) | 1 (5.9) | ||
| Adjuvant chemotherapy † | No, n (%) | 15 (44.1) | 8 (50.0) | 7 (38.9) | 0.730 c |
| Yes, n (%) | 19 (55.9) | 8 (50.0) | 11 (61.1) |
| Small EV Characteristics | Study Patients n = 34 Median (25–75%) | w/o Resection n = 16 Median (25–75%) | With Resection n = 18 Median (25–75%) | p-Value * | |
|---|---|---|---|---|---|
| Before surgery | Concentration (×1010/mL) | 6.02 (4.84–7.91) | 6.02 (4.83–7.73) | 6.10 (5.03–9.03) | 0.646 |
| Mean diameter (nm) | 168.1 (157.4–177.2) | 165 (155.3–176.2) | 173.2 (157.4–178.1) | 0.528 | |
| Modal diameter (nm) | 136.3 (114.1–150.1) | 132.2 (107.8–137.4) | 144 (124.3–155) | 0.039 | |
| Median diameter (nm) | 153.2 (143.8–162.2) | 149.8 (144.9–159.9) | 157.3 (139.7–165.1) | 0.330 | |
| After one month | Concentration (×1010/mL) | 6.46 (6.00–8.40) [7] | 7.71 (5.67–15.3) | 6.40 (6.05–7.08) | 0.359 |
| Mean diameter (nm) | 174.9 (165.3–182.6) [7] | 175.9 (152.1–186.9) [6] | 174.9 (167.1–182.6) [1] | 0.675 | |
| Modal diameter (nm) | 133.3 (120.1–153.5) [7] | 124.8 (109.9–145.8) [6] | 136.5 (125.5–154) [1] | 0.286 | |
| Median diameter (nm) | 155.7 (150.1–165.9) [7] | 156.9 (136–168) [6] | 155.7 (154.3–165.9) [1] | 0.505 | |
| Relative change | Concentration (%) | 12.7 (−17.9 do 36.4) [7] | 14.7 (−18.3–101.5) [6] | 3.1 (−33–31.7) [1] | 0.309 |
| Mean diameter (%) | 5.1 (−1.3 do 12.5) [7] | 6.7 (−11.9–15.4) [6] | 3.9 (0–10.3) [1] | 1.000 | |
| Modal diameter (%) | 3.6 (−11.1 do 17.9) [7] | 7.4 (−17.5–18.1) [6] | −1.5 (−13.1–20.6) [1] | 0.902 | |
| Median diameter (%) | 4.7 (−2.0 do 12.4) [7] | 8.1 (−12.3–13.4) [6] | 4.3 (−0.4–11.9) [1] | 1.000 |
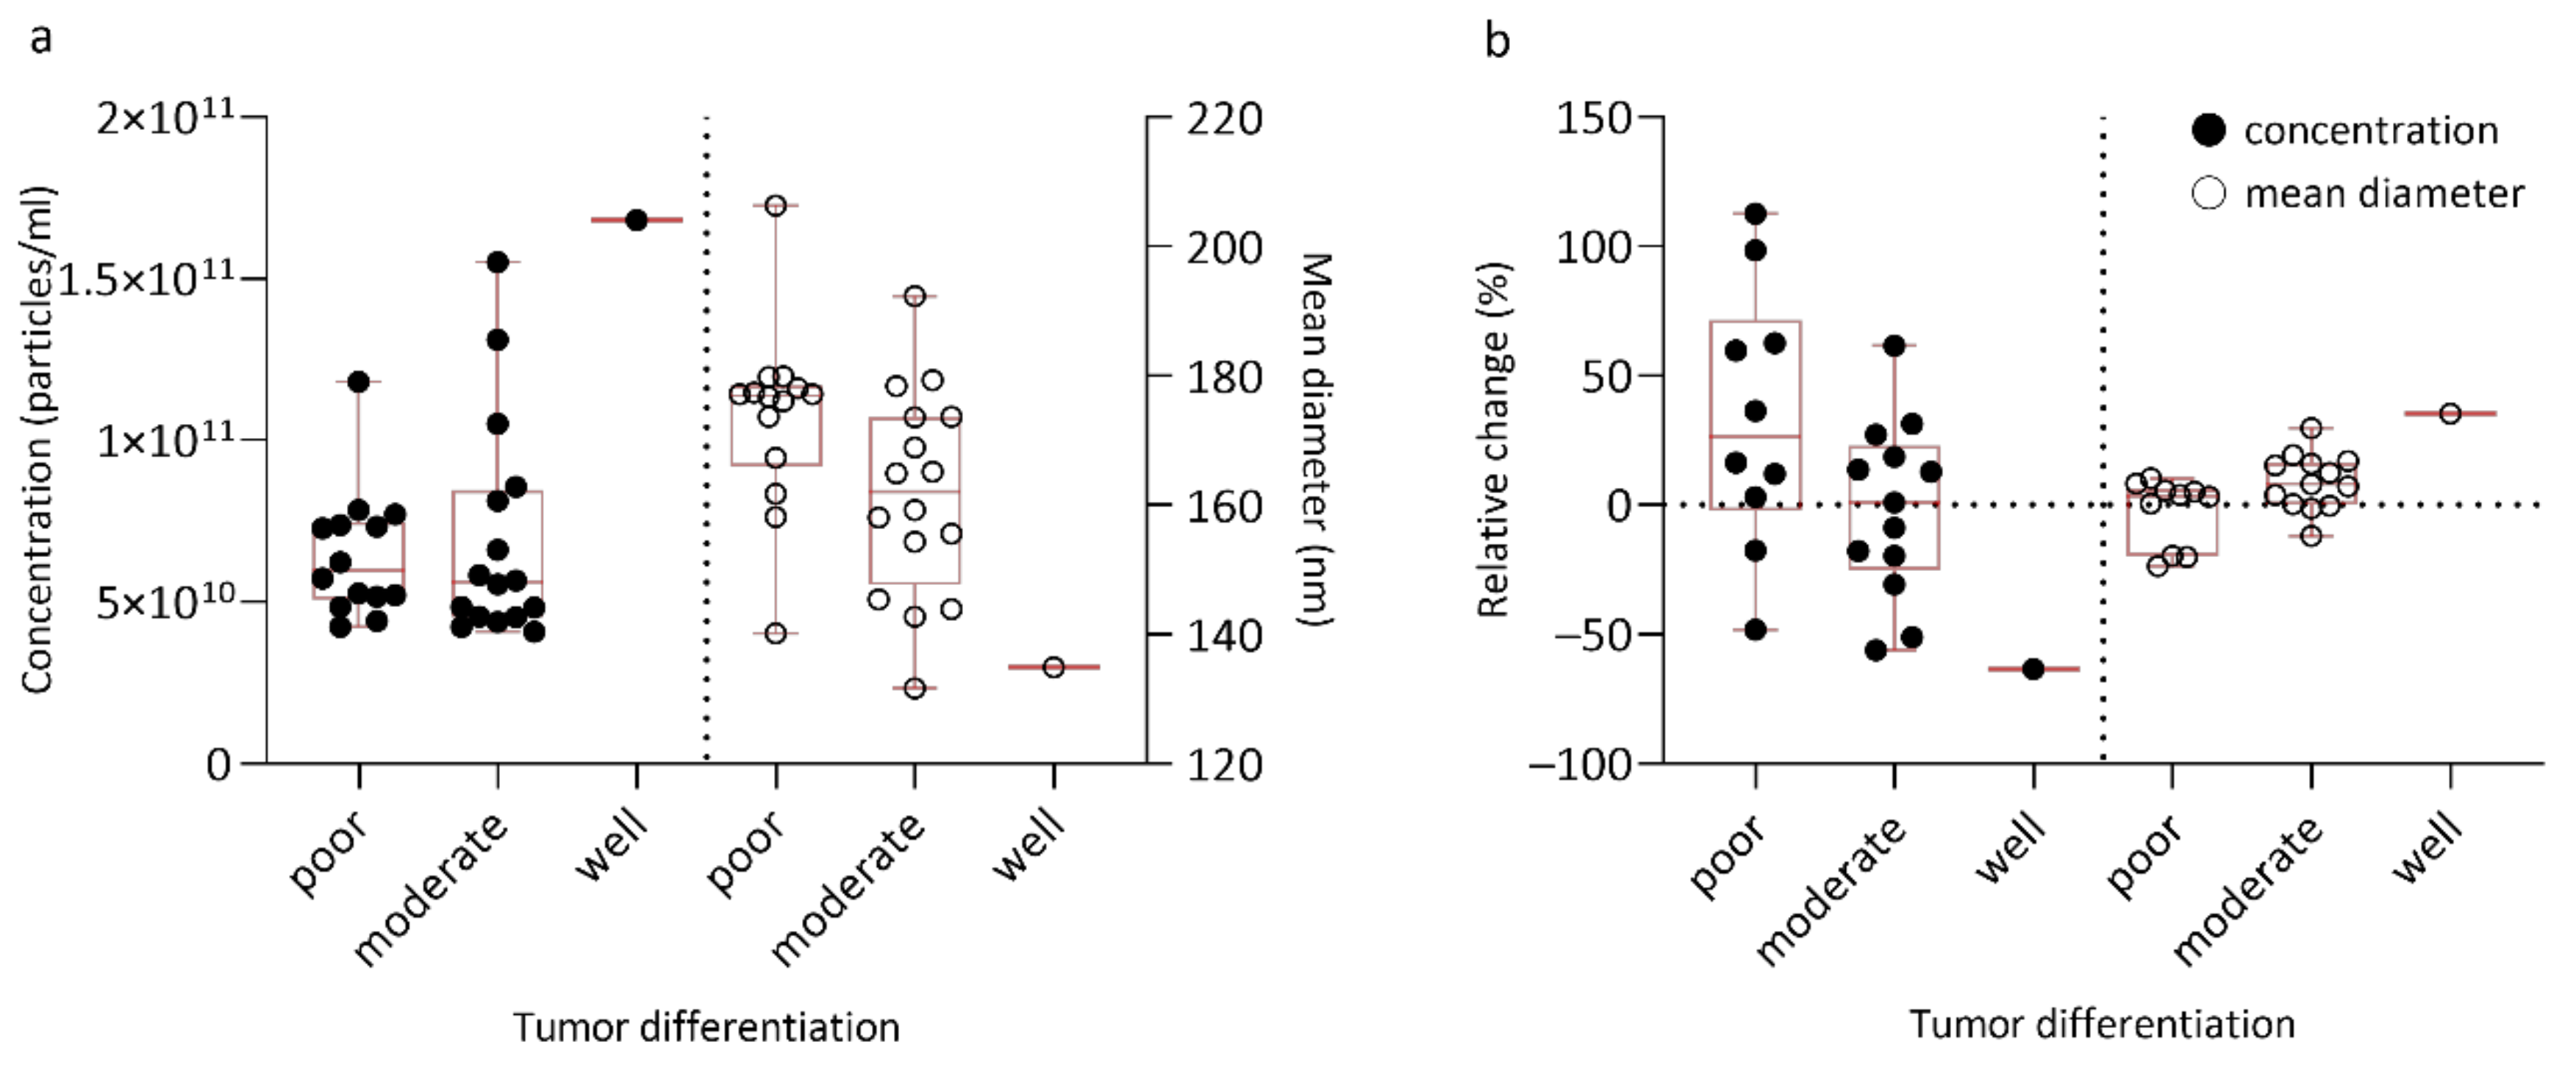
| Small EV Characteristics | Poor Differentiation Median (25–75%) | Well/moderate Differentiation Median (25–75%) | p-Value * | |
|---|---|---|---|---|
| Before surgery | Concentration (×1010/mL) | 5.97 (5.08–7.46) | 5.66 (4.53–9.55) | 0.984 |
| Mean diameter (nm) | 176.9 (165.9–178.5) | 149.2 (144.7–173.6) | 0.021 | |
| Modal diameter (nm) | 139.8 (130.9–154.2) | 135.1 (99.6–143.3) | 0.077 | |
| Median diameter (nm) | 159.9 (149–165.7) | 149.2 (125.0–157.1) | 0.023 | |
| After one month | Concentration (×1010/mL) | 6.91 (6.06–10.12) | 6.22 (5.10–6.93) | 0.096 |
| Mean diameter (nm) | 177.7 (158.5–186.9) | 174.2 (169.2–182.5) | 0.796 | |
| Modal diameter (nm) | 139.9 (113.6–157.9) | 129.9 (123.8–143.3) | 0.666 | |
| Median diameter (nm) | 164.2 (142.7–168.2) | 154.7 (153.7–165.2) | 0.508 | |
| Relative change | Concentration (%) | 26.3 (−2.1–71.5) | -3.9 (−35.8 to 20.8) | 0.056 |
| Mean diameter (%) | 3.5 (−19.7–6.2) | 10.3 (0.2–17.6) | 0.056 | |
| Modal diameter (%) | 1.1 (−35.1–12.9) | 5.7 (−10.7 to 32.9) | 0.341 | |
| Median diameter (%) | 4.5 (−22.5–9.7) | 8.2 (0.1–22.1) | 0.192 |
| Small EV Characteristics | HR (95% CI) * | p-Value | HR (95% CI)adj * | p-Valueadj | |
|---|---|---|---|---|---|
| Before surgery | Concentration (×1010/mL) | 1.00 (1.00–1.00) | 0.458 | 1.00 (1.00–1.00) | 0.220 |
| Mean diameter (nm) | 1.03 (0.77–1.36) | 0.865 | 1.10 (0.81–1.50) | 0.551 | |
| Modal diameter (nm) | 0.95 (0.79–1.14) | 0.571 | 1.08 (0.87–1.34) | 0.486 | |
| Median diameter (nm) | 0.98 (0.76–1.28) | 0.904 | 1.07 (0.79–1.44) | 0.663 | |
| Relative change | Concentration (%) | 1.11 (0.98–1.27) | 0.106 | 1.25 (1.05–1.50) | 0.015 |
| Mean diameter (%) | 0.65 (0.40–1.05) | 0.076 | 0.69 (0.44–1.10) | 0.117 | |
| Modal diameter (%) | 0.86 (0.68–1.08) | 0.197 | 0.74 (0.57–0.95) | 0.019 | |
| Median diameter (%) | 0.76 (0.50–1.16) | 0.199 | 0.76 (0.52–1.12) | 0.165 |
Publisher’s Note: MDPI stays neutral with regard to jurisdictional claims in published maps and institutional affiliations. |
© 2021 by the authors. Licensee MDPI, Basel, Switzerland. This article is an open access article distributed under the terms and conditions of the Creative Commons Attribution (CC BY) license (http://creativecommons.org/licenses/by/4.0/).
Share and Cite
Badovinac, D.; Goričar, K.; Zavrtanik, H.; Petrič, M.; Lavrin, T.; Mavec, N.; Dolžan, V.; Tomažič, A.; Lenassi, M. Plasma Extracellular Vesicle Characteristics Correlate with Tumor Differentiation and Predict Overall Survival in Patients with Pancreatic Ductal Adenocarcinoma Undergoing Surgery with Curative Intent. J. Pers. Med. 2021, 11, 77. https://doi.org/10.3390/jpm11020077
Badovinac D, Goričar K, Zavrtanik H, Petrič M, Lavrin T, Mavec N, Dolžan V, Tomažič A, Lenassi M. Plasma Extracellular Vesicle Characteristics Correlate with Tumor Differentiation and Predict Overall Survival in Patients with Pancreatic Ductal Adenocarcinoma Undergoing Surgery with Curative Intent. Journal of Personalized Medicine. 2021; 11(2):77. https://doi.org/10.3390/jpm11020077
Chicago/Turabian StyleBadovinac, David, Katja Goričar, Hana Zavrtanik, Miha Petrič, Teja Lavrin, Nina Mavec, Vita Dolžan, Aleš Tomažič, and Metka Lenassi. 2021. "Plasma Extracellular Vesicle Characteristics Correlate with Tumor Differentiation and Predict Overall Survival in Patients with Pancreatic Ductal Adenocarcinoma Undergoing Surgery with Curative Intent" Journal of Personalized Medicine 11, no. 2: 77. https://doi.org/10.3390/jpm11020077
APA StyleBadovinac, D., Goričar, K., Zavrtanik, H., Petrič, M., Lavrin, T., Mavec, N., Dolžan, V., Tomažič, A., & Lenassi, M. (2021). Plasma Extracellular Vesicle Characteristics Correlate with Tumor Differentiation and Predict Overall Survival in Patients with Pancreatic Ductal Adenocarcinoma Undergoing Surgery with Curative Intent. Journal of Personalized Medicine, 11(2), 77. https://doi.org/10.3390/jpm11020077