
Automated Epileptic Seizure Detection in Pediatric Subjects of CHB-MIT EEG Database—A Survey

 ,
,  , ,
, ,
Abstract
1. Introduction
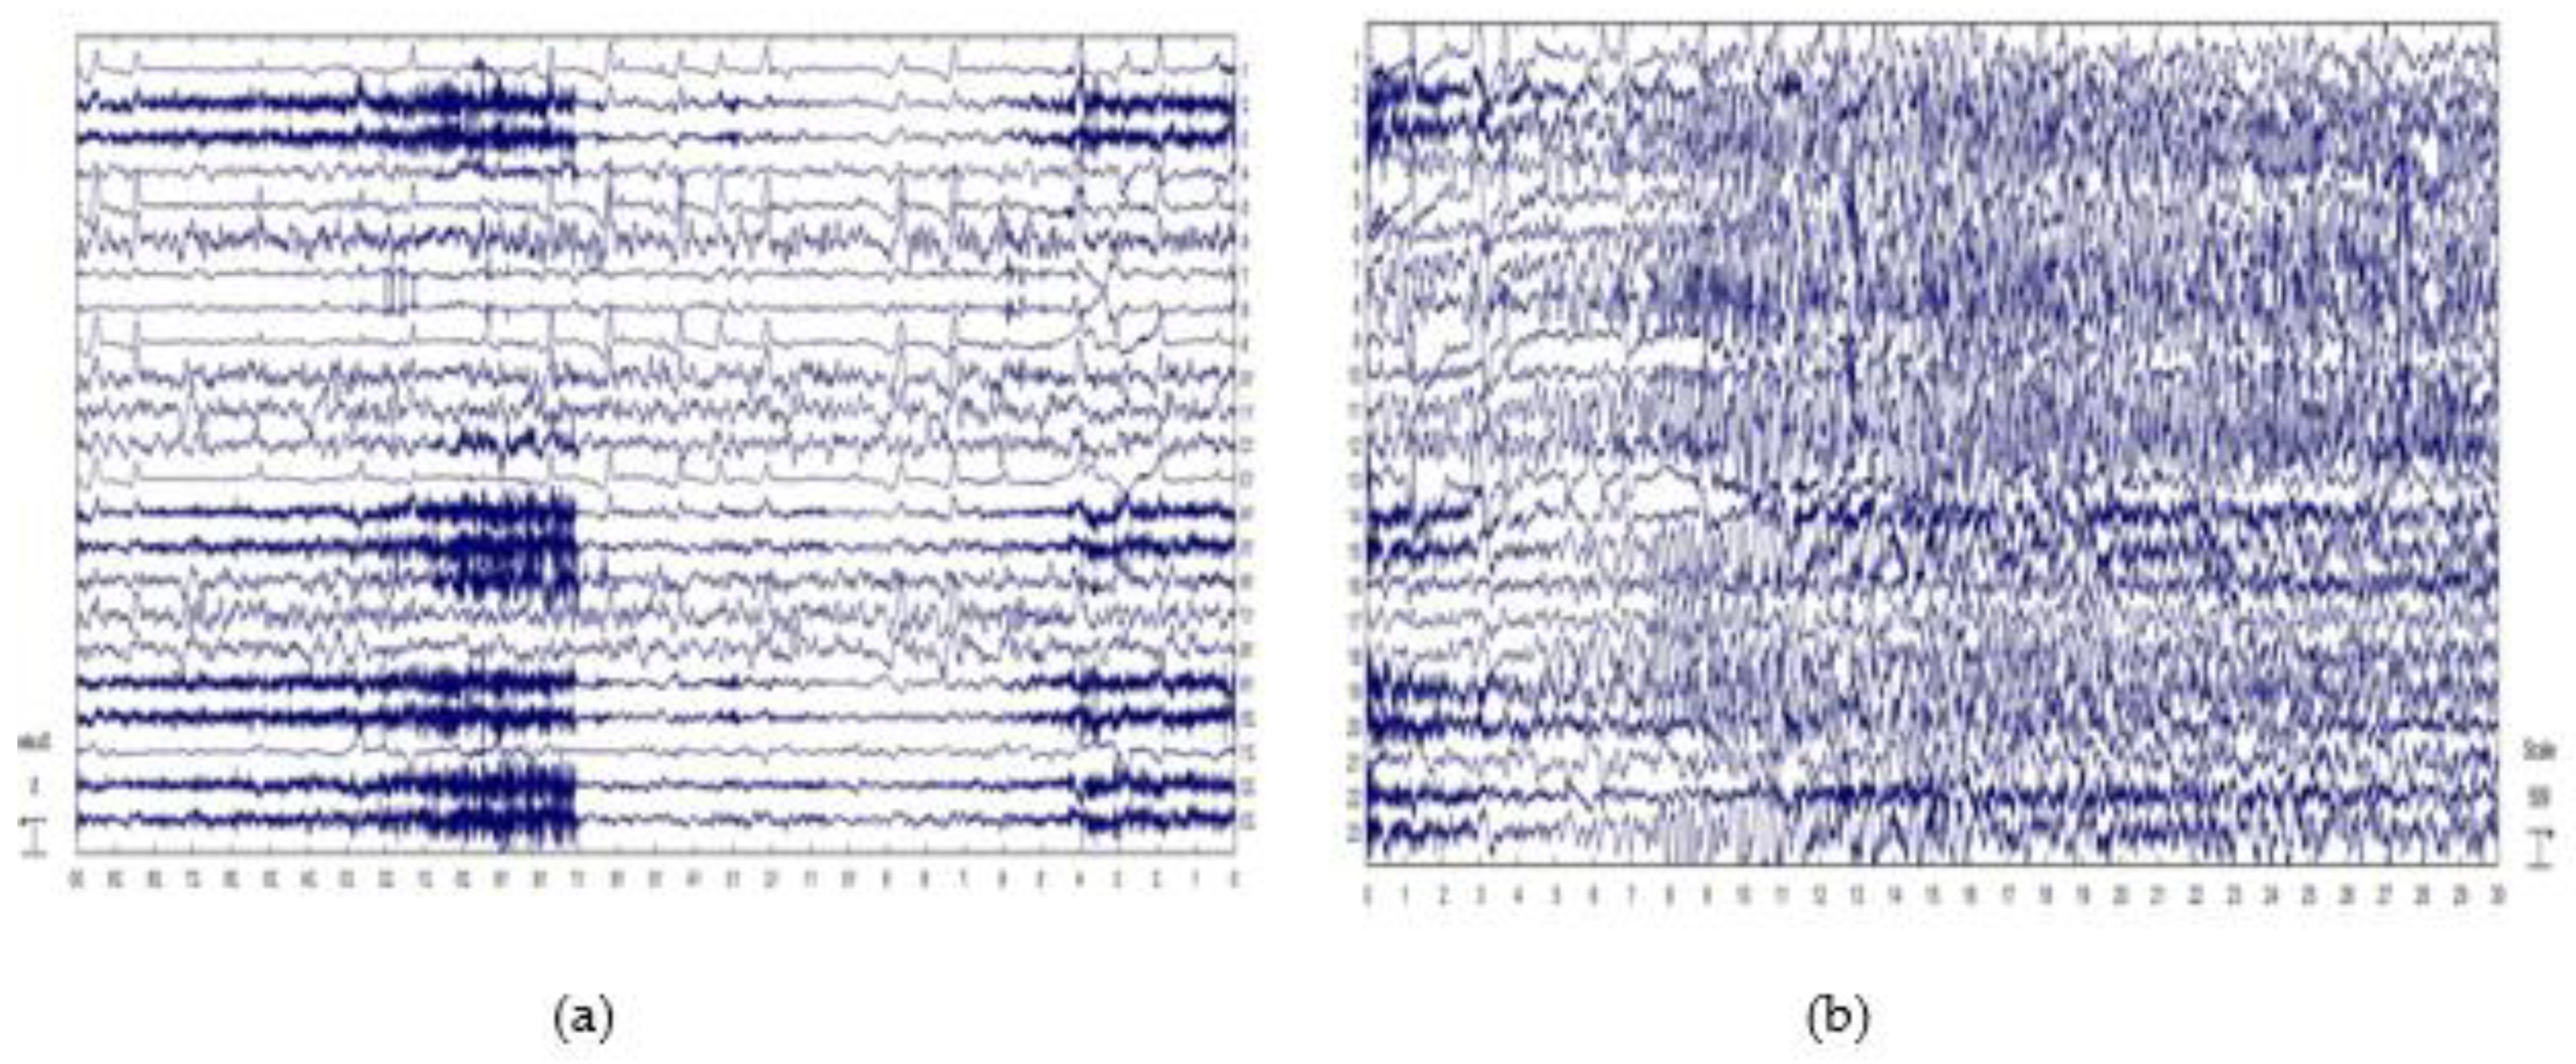
2. Dataset Used
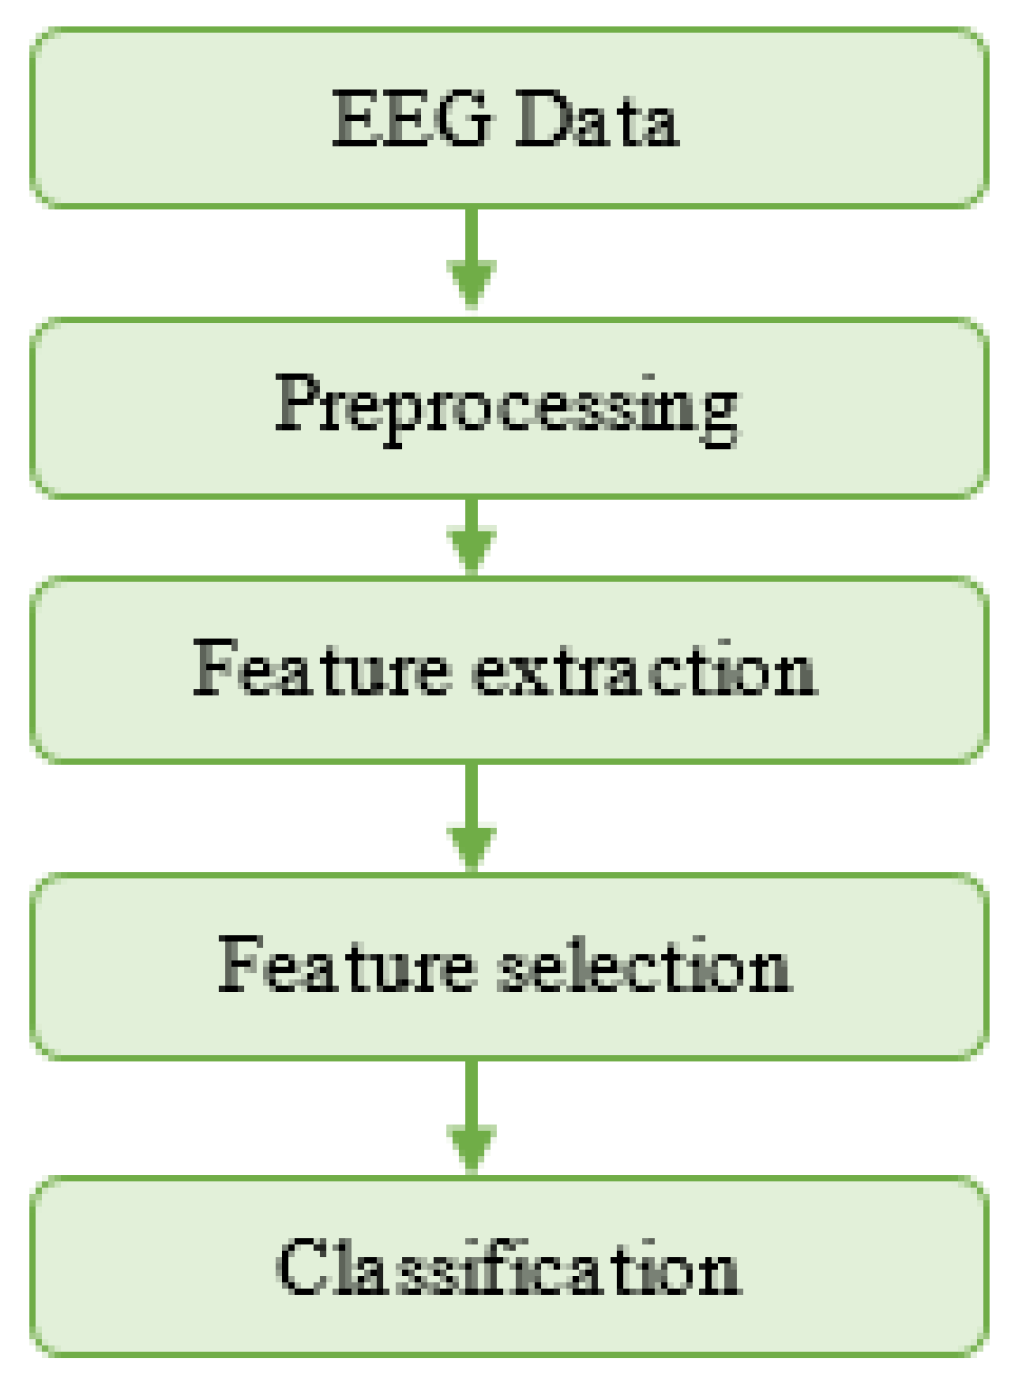
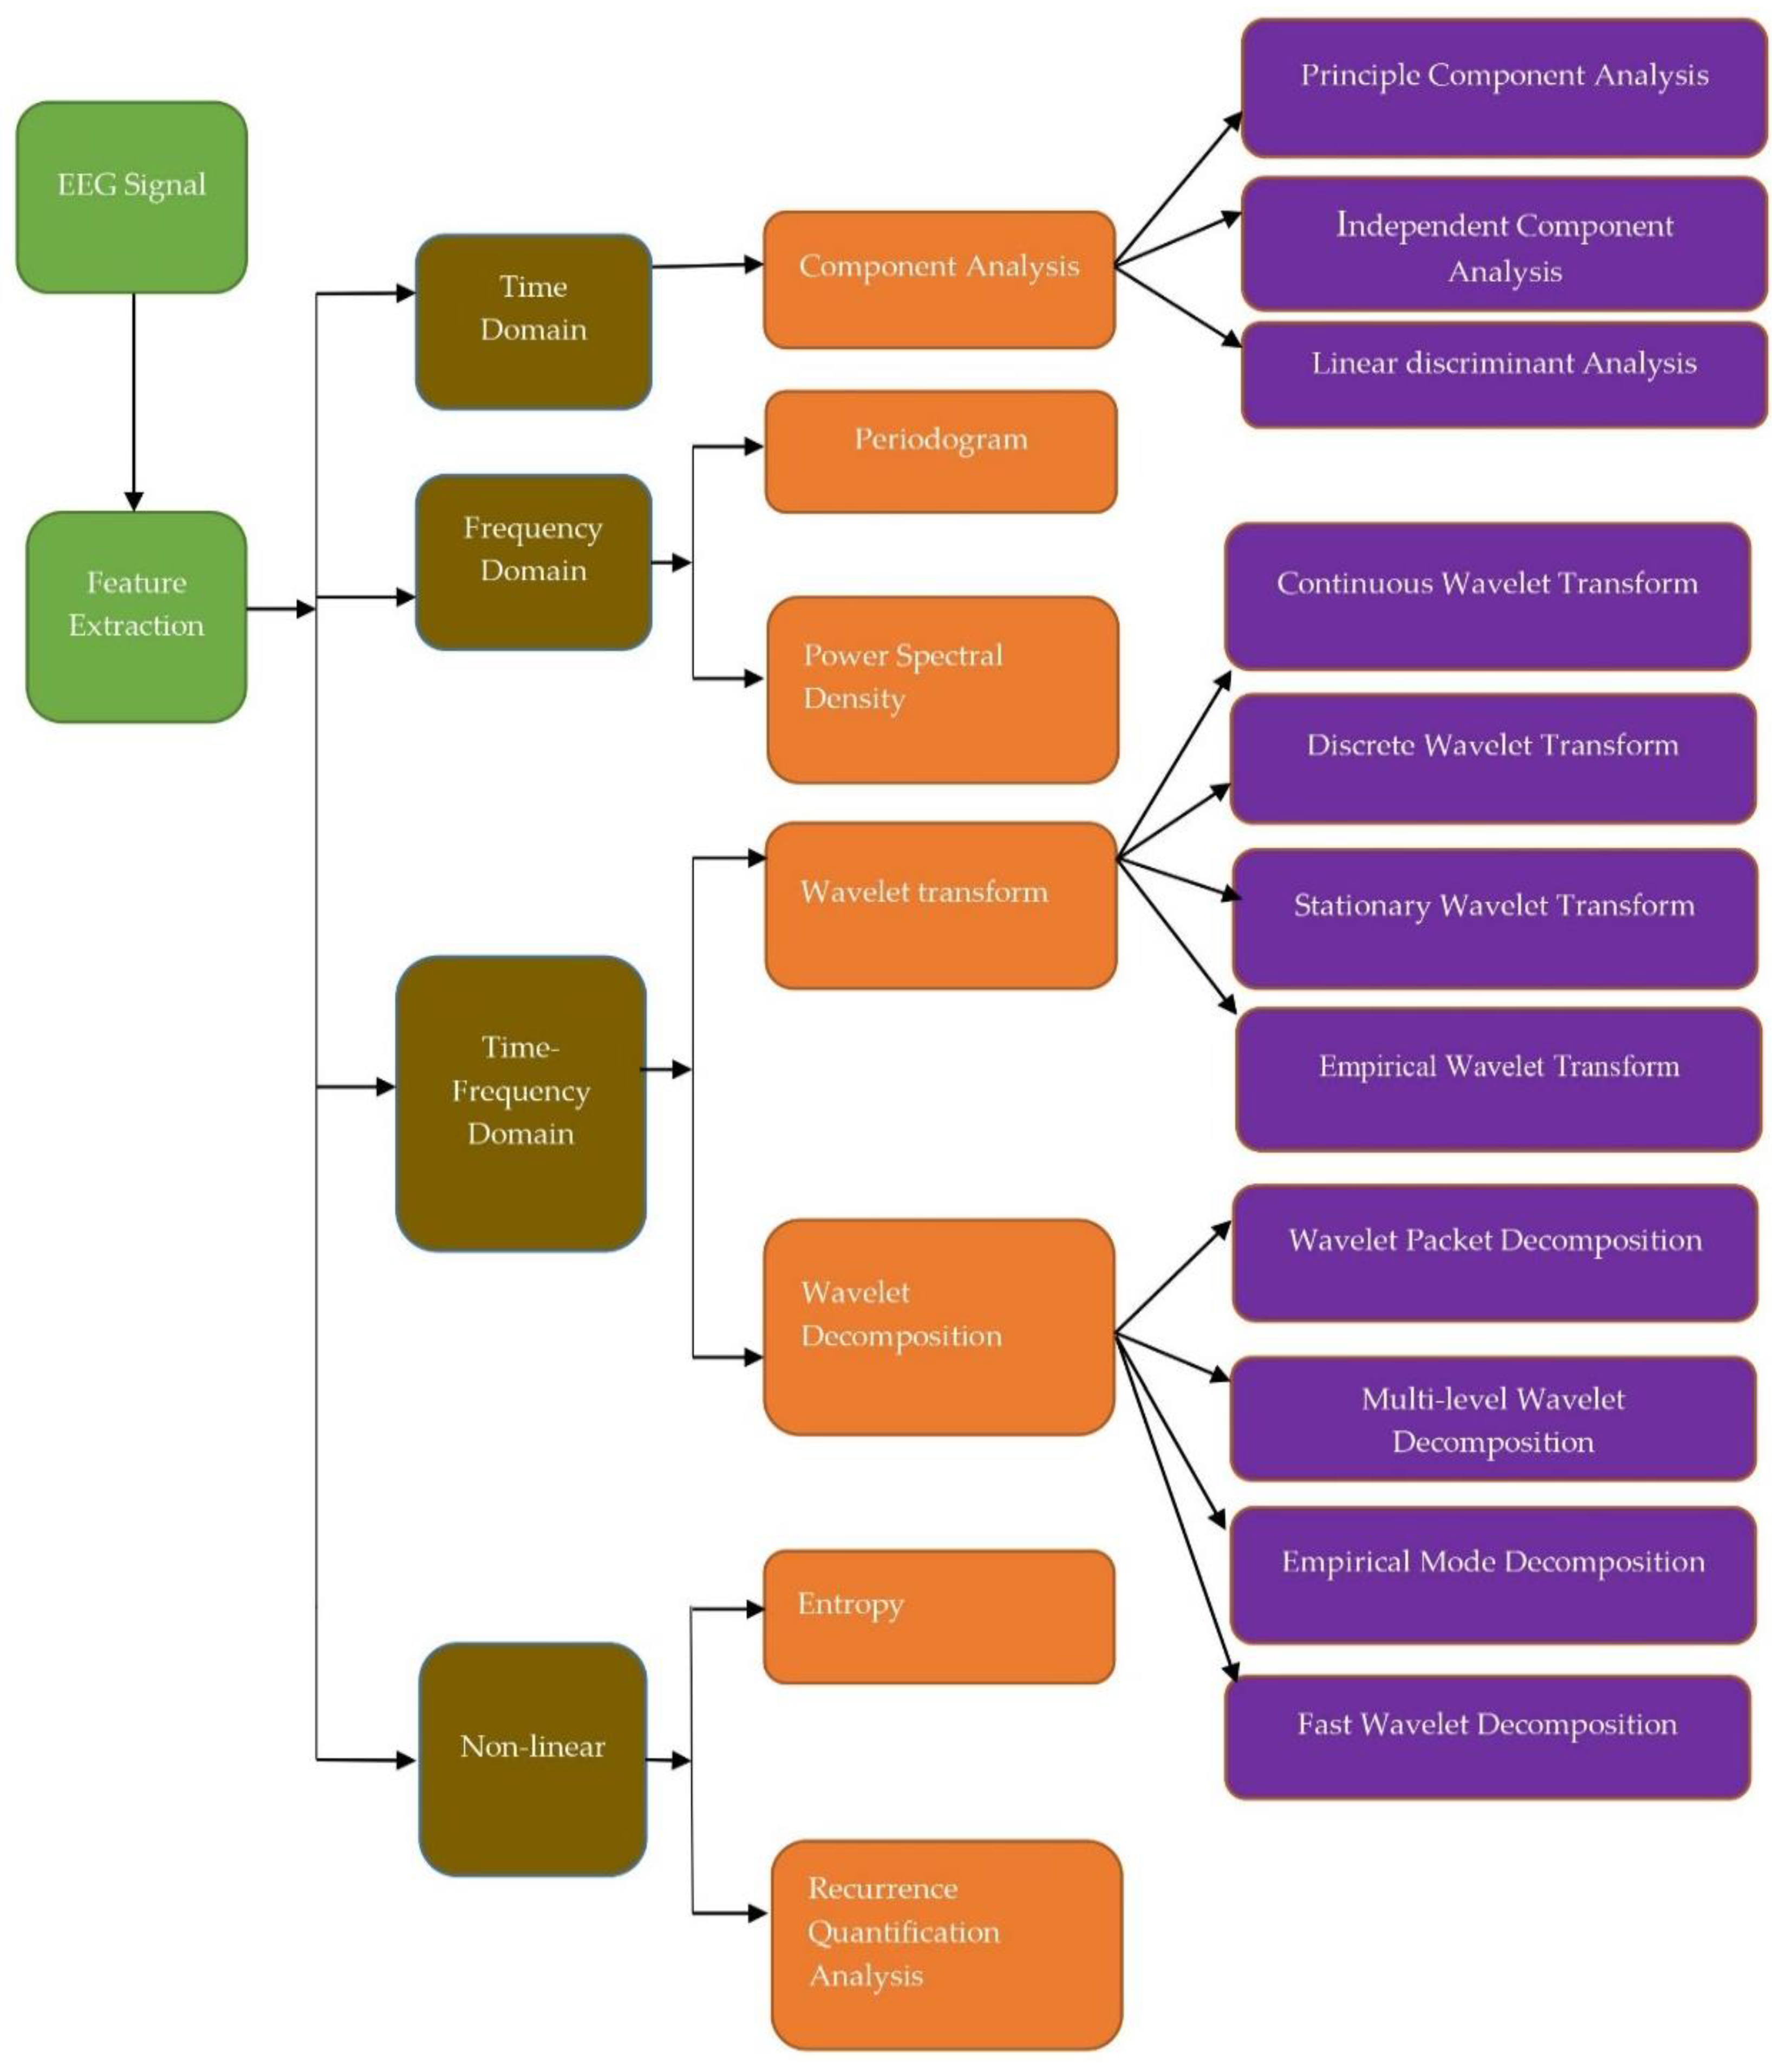
3. Methods
3.1. Time Domain
3.2. Frequency Domain
3.3. Time-Frequency Domain
3.3.1. Wavelet Transform (WT)
3.3.2. Continuous Wavelet Transform (CWT)
3.3.3. Discrete Wavelet Transform (DWT)
3.3.4. Wavelet Packet Decomposition (WPD)
3.4. Nonlinear Domain
3.4.1. Recurrence Quantification Analysis (RQA)
3.4.2. Entropy
3.4.3. Hjorth’s Parameters
3.5. Other Feature Extraction Methods
3.6. Statistical Analysis Tests
4. Classification
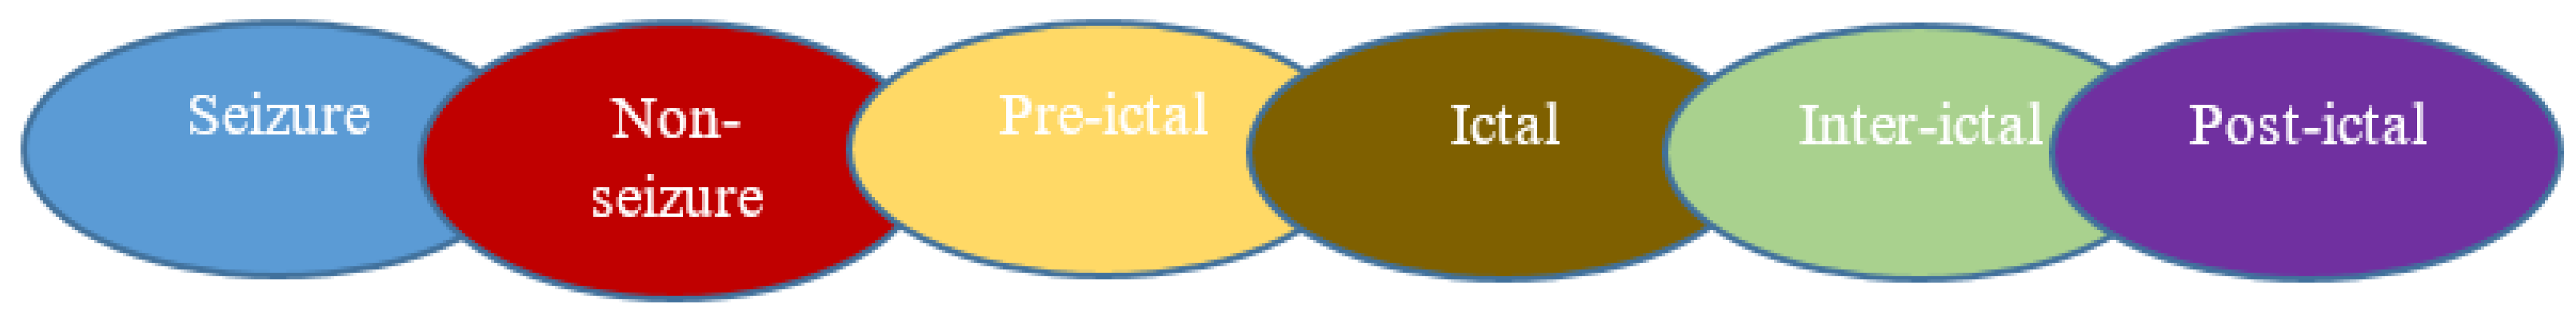
4.1. Two Class Classification (Seizure and Non-Seizure)
4.2. Classification between Ictal, Preictal, Interictal, Postictal
4.3. Classification Performance
5. Conclusions
Author Contributions
Funding
Institutional Review Board Statement
Informed Consent Statement
Data Availability Statement
Conflicts of Interest
References
- Trenite, K.; Cook, M.; Beniczky, S. Clinical Utility of EEG in Diagnosing and Monitoring Epilepsy in Adults. Clin. Neurophysiol. 2018, 129, 1056–1082. [Google Scholar]
- Acharya, U.R.; Sree, S.V.; Swapna, G.; Joy, R.; Suri, J.S. Knowledge-Based Systems Automated EEG analysis of epilepsy: A review. Knowl.-Based Syst. 2013, 45, 147–165. [Google Scholar] [CrossRef]
- Artameeyanant, P. Electroencephalography-based feature extraction using the complex network for automated epileptic seizure detection. Expert. Syst. 2017, 34, 1–21. [Google Scholar] [CrossRef]
- Zandi, A.S.; Tafreshi, R.; Javidan, M.; Dumont, G.A. Predicting Epileptic Seizures in Scalp EEG Based on a Variational Bayesian Gaussian Mixture Model of Zero-Crossing Intervals. IEEE Trans. Biomed. Eng. 2013, 60, 1401–1413. [Google Scholar] [CrossRef] [PubMed]
- Falco-Walter, J.J.; Scheffer, I.E.; Fisher, R.S. The new definition and classification of seizures and epilepsy. Epilepsy Res. 2018, 139, 73–79. [Google Scholar] [CrossRef] [PubMed]
- Sarmast, S.T.; Abdullahi, A.M.; Jahan, N. Current classification of seizures and epilepsies: Scope, limitations and recommendations for future action. Cureus 2020, 12, e10549. [Google Scholar] [CrossRef] [PubMed]
- Fisher, R.S.; Bonner, A.M. The revised definition and classification of epilepsy for neurodiagnostic technologists. Neurodiagn. J. 2018, 58, 1–10. [Google Scholar] [CrossRef] [PubMed]
- Noda, Y.; Nakamura, M.; Saeki, T.; Inoue, M.; Iwanari, H.; Kasai, K. Potentiation of quantitative electroencephalograms following prefrontal repetitive transcranial magnetic stimulation in patients with major depression. Neurosci. Res. 2013, 77, 70–77. [Google Scholar] [CrossRef]
- Backhouse, F.A.; Noda, Y.; Knyahnytska, Y.; Farzan, F.; Downar, J.; Rajji, T.K.; Blumberger, D.M. Characteristics of ictal EEG in magnetic seizure therapy at various stimulation frequencies. Clin. Neurophysiol. 2018, 129, 1770–1779. [Google Scholar] [CrossRef]
- Mutlag, A.A.; Ghani, M.K.A.; Mohammed, M.A.; Lakhan, A.; Mohd, O.; Garcia-Zapirain, B.; Abdulkareem, K.H. Multi-Agent Systems in Fog-Cloud Computing for a Critical Healthcare Tasks Management Model (CHTM) Used for ECG Monitoring. Sensors 2021, 20, 1853. [Google Scholar] [CrossRef]
- Birvinskas, D.; Jusas, V.; Martisius, I.; Damasevicius, R. EEG dataset reduction and feature extraction using discrete cosine transform. UKSim-AMSS 6th European Modelling Symposium. EMS 2012, 2012, 199–204. [Google Scholar] [CrossRef]
- Martisius, I.; Damasevicius, R.; Jusas, V.; Birvinskas, D. Using higher-order nonlinear operators for SVM classification of EEG data. Electron. Electr. Eng. 2012, 119, 99–102. [Google Scholar] [CrossRef][Green Version]
- Martisius, I.; Birvinskas, D.; Damasevicius, R.; Jusas, V. EEG dataset reduction and classification using wave atom transform. In Artificial Neural Networks and Machine Learning; International Conference on Artificial Neural Networks; Springer: Berlin/Heidelberg, Germany, 2013; pp. 208–215. [Google Scholar] [CrossRef]
- Shoeb, A.; Kharbouch, A.; Soegaard, J.; Schachter, S.; Guttag, J. An algorithm for detecting seizure termination in scalp EEG. Proc. Annu. Int. Conf. IEEE Eng. Med. Biol. Soc. EMBS 2011, 22, 1443–1446. [Google Scholar]
- Rafiuddin, N.; Khan, Y.U.; Farooq, O. Feature extraction and classification of EEG for automatic seizure detection. In Proceedings of the 2011 International Conference on Multimedia, Signal Processing and Communication Technologies, IMPACT 2011, Aligarh, India, 17–19 December 2011; pp. 184–187. [Google Scholar]
- Chiang, B.; Chang, N.; Chen, T.; Chen, H.; Chen, L. Seizure Prediction Based on Classification of EEG Synchronization Patterns with On-line Retraining and Post-Processing Scheme. In Proceedings of the 33rd Annual International Conference of the IEEE EMBS, Boston, MA, USA, 30 August–3 September 2011; pp. 7564–7569. [Google Scholar]
- Lee, K.H.; Jang, K.J.; Shoeb, A.; Verma, N. A data-driven modeling approach to stochastic computation for low-energy biomedical devices. In Proceedings of the 33rd Annual International Conference of the IEEE EMBS, Boston, MA, USA, 30 August–3 September 2011; Volume 2011, pp. 826–829. [Google Scholar]
- Shoaib, M.; Jha, N.K.; Verma, N. Enabling advanced inference on sensor nodes through direct use of compressively-sensed signals. In Proceedings of the Conference on Design, Automation and Test in Europe, Dresden, Germany, 12–16 March 2012; pp. 437–442. [Google Scholar]
- Khan, Y.U.; Rafiuddin, N.; Farooq, O. Automated seizure detection in scalp EEG using multiple wavelet scales. In Proceedings of the 2012 IEEE International Conference on Signal Processing, Computing and Control, ISPCC 2012, Solan, India, 15–17 March 2012; pp. 1–5. [Google Scholar]
- Awais, M.; Altaf, B.; Yoo, J. A 1.52 uJ/classification Patient-Specific Seizure Classification Processor using Linear SVM. In Proceedings of the Circuits and Systems (ISCAS), 2013 IEEE International Symposium, Beijing, China, 19–23 May 2013; pp. 849–852. [Google Scholar]
- Zabihi, M.; Kiranyaz, S.; Ince, T.; Gabbouj, M. Patient-specific epileptic seizure detection in long-term EEG recording in paediatric patients with intractable seizures. In Proceedings of the IET Intelligent Signal Processing Conference 2013 (ISP 2013), London, UK, 2–3 December 2013; pp. 1–7. [Google Scholar]
- Kiranyaz, S.; Ince, T.; Zabihi, M.; Ince, D. Automated patient-specific classification of long-term Electroencephalography. J. Biomed. Inform. 2014, 49, 16–31. [Google Scholar] [CrossRef]
- Chen, L.L.; Zhang, J.; Zou, J.Z.; Zhao, C.J.; Wang, G.S. A framework on wavelet-based non-linear features and extreme learning machine for epileptic seizure detection. Biomed. Signal Process. Control 2014, 10, 1–10. [Google Scholar] [CrossRef]
- Ahammad, N.; Fathima, T.; Joseph, P.; Ahammad, N.; Fathima, T.; Joseph, P. Detection of Epileptic Seizure Event and Onset Using EEG, Detection of Epileptic Seizure Event and Onset Using EEG. Biomed. Res. Int. 2014, 2014, 450573. [Google Scholar] [CrossRef]
- Supratak, A.; Li, L.; Guo, Y. Feature extraction with stacked autoencoders for epileptic seizure detection. In Proceedings of the 36th Annual International Conference of the IEEE Engineering in Medicine and Biology Society, EMBC 2014, Chicago, IL, USA, 26–30 August 2014; pp. 4184–4187. [Google Scholar]
- Sharanya, B.; Murali, L.; Manigandan, T. Adaptive filtering of EEG and epilepsy detection using Recurrence Quantification Analysis. In Proceedings of the IEEE International Conference on Advanced Communication, Control and Computing Technologies, ICACCCT 2014, Ramanathapuram, India, 8–10 May 2014; pp. 1316–1320. [Google Scholar]
- Xiang, J.; Li, C.; Li, H.; Cao, R.; Wang, B.; Han, X.; Chen, J. The detection of epileptic seizure signals based on fuzzy entropy. J. Neurosci. Methods 2015, 243, 18–25. [Google Scholar] [CrossRef]
- Menshawy, M.E.L.; Benharref, A.; Serhani, M. An automatic mobile-health based approach for EEG epileptic seizures detection. Expert Syst. Appl. 2015, 42, 7157–7174. [Google Scholar] [CrossRef]
- Samiee, K.; Kiranyaz, S.; Gabbouj, M.; Saramäki, T. Long-term epileptic EEG classification via 2D mapping and textural features. Expert Syst. Appl. 2015, 42, 7175–7185. [Google Scholar] [CrossRef]
- Van Esbroeck, A.; Smith, L.; Syed, Z.; Singh, S.; Karam, Z.N. Multi-task seizure detection: Addressing intra-patient variation in seizure morphologies. Mach. Learn. 2016, 102, 309–321. [Google Scholar] [CrossRef]
- Murali, L.; Chitra, D.; Manigandan, T.; Sharanya, B. An Efficient Adaptive Filter Architecture for Improving the Seizure Detection in EEG Signal. Circuits. Syst. Signal Process. 2016, 35, 2914–2931. [Google Scholar] [CrossRef]
- Fergus, P.; Hignett, D.; Hussain, A.; Al-jumeily, D.; Abdel-aziz, K. Automatic Epileptic Seizure Detection Using Scalp EEG and Advanced Artificial Intelligence Techniques. Biomed. Res. Int. 2015, 2015, 1–17. [Google Scholar] [CrossRef]
- Behnam, M.; Pourghassem, H. Singular Lorenz Measures Method for seizure detection using KNN-Scatter Search optimization algorithm. In Proceedings of the Signal Processing and Intelligent Systems Conference, (SPIS) 2015, Tehran, Iran, 16–17 December 2015; pp. 67–72. [Google Scholar]
- Zabihi, M.; Kiranyaz, S.; Rad, A.B.; Katsaggelos, A.K.; Gabbouj, M.; Ince, T. Analysis of High-Dimensional Phase Space via Poincaré Section for Patient-Specific Seizure Detection. IEEE Trans. Neural Syst. Rehabil. Eng. 2016, 24, 386–398. [Google Scholar] [CrossRef]
- Satirasethawong, C.; Lek-Uthai, A.; Chomtho, K. Amplitude-integrated EEG processing and its performance for automatic seizure detection. In Proceedings of the IEEE International Conference on Signal and Image Processing Applications ICSIPA 2015, Kuala Lumpur, Malaysia, 19–21 October 2015; pp. 551–556. [Google Scholar]
- Shahid, A.; Kamel, N.; Malik, A.S.; Jatoi, M.A. Epileptic seizure detection using singular values and classical features of EEG signals. In Proceedings of the International Conference on Biosignal Analysis, Processing and Systems (ICBAPS), Kuala Lumpur, Malaysia, 26–28 May 2013; pp. 652–655. [Google Scholar]
- Zhang, A.; Altaf, M.A.B.; Yoo, J. A 16-channel, 1-Second Latency Patient-Specific Seizure Onset and Termination Detection Processor with Dual Detector Architecture and Digital Hysteresis. In Proceedings of the Custom Integrated Circuit Conference (CICC), San Jose, CA, USA, 28–30 September 2015; pp. 1–4. [Google Scholar]
- Ontivero-Ortega, M.; Garcia-Puente, Y.; Martínez-Montes, E. Comparison of Classifiers to Detect Epileptic Seizures via PARAFAC Decomposition. In Proceedings of the VI Latin American Congress on Biomedical Engineering (CLAIB), Paraná, Entre Ríos, Argentina, 29–31 October 2014; pp. 500–503. [Google Scholar]
- Xun, G.; Jia, X.; Zhang, A. Detecting epileptic seizures with electroencephalogram via a context-learning model. BMC Med. Inform. Decis. Mak. 2016, 16, 70. [Google Scholar] [CrossRef]
- Fergus, P.; Hussain, A.J.; Hignett, D.; Aljumeily, D.; Abdel-Aziz, K.; Hamdan, H. A machine learning system for automated whole-brain seizure detection. Appl. Comput. Inform. 2016, 12, 70–89. [Google Scholar] [CrossRef]
- Orosco, L.; Correa, A.G.; Diez, P.; Laciar, E. Patient non-specific algorithm for seizures detection in scalp EEG. Comput. Biol. Med. 2016, 71, 128–134. [Google Scholar] [CrossRef]
- Behnam, M.; Pourghassem, H. Real-time seizure prediction using RLS filtering and interpolated histogram feature based on hybrid optimization algorithm of Bayesian classifier and Hunting search. Comput. Methods Programs Biomed. 2016, 132, 115–136. [Google Scholar] [CrossRef]
- Zhang, C.; Altaf, M.A.B.; Yoo, J. Design and Implementation of an On-Chip Patient-Specific Closed-Loop Seizure Onset and Termination Detection System. IEEE J. Biomed. Health Inform. 2016, 20, 996–1007. [Google Scholar] [CrossRef]
- Altaf, M.A.B.; Zhang, C.; Radakovic, L.; Yoo, J. Design of energy-efficient on-chip EEG classification and recording processors for wearable environments. In Proceedings of the IEEE International Symposium on Circuits and Systems, Montreal, QC, Canada, 22–25 May 2016; pp. 1126–1129. [Google Scholar]
- Amin, S.; Kamboh, A.M. A robust approach towards epileptic seizure detection. In Proceedings of the IEEE International Workshop on Machine Learning for Signal ProcessingVietrisul Mare, Salerno, Italy, 13–16 September 2016; pp. 1–6. [Google Scholar]
- Bugeja, S.; Garg, L.; Audu, E.E. A novel method of EEG data acquisition, feature extraction and feature space creation for early detection of epileptic seizures. In Proceedings of the the Annual International Conference of the IEEE Engineering in Medicine and Biology Society, EMBS, Orlando, FL, USA, 16–20 August 2016; pp. 837–840. [Google Scholar]
- Guan, T.; Zeng, X.; Huang, L.; Guan, T.; Seok, M. Neural Network-based Seizure Detection System using Raw EEG Data. In Proceedings of the In SoC Design Conference (ISOCC), Orlando, FL, USA, 17–20 August 2016; pp. 211–212. [Google Scholar]
- Janjarasjitt, S. Epileptic seizure classifications of single-channel scalp EEG data using wavelet-based features and SVM. Med. Biol. Eng. Comput. 2017, 55, 1743–1761. [Google Scholar] [CrossRef]
- Ammar, S.; Senouci, M. Seizure Detection with Single-Channel EEG using Extreme Learning Machine. In Proceedings of the 17th international conference on sciences and techniques of automatic control and computer engineering (STA), Sousse, Tunisia, 19–21 December 2016; pp. 776–779. [Google Scholar]
- Chu, H.; Chung, C.K.; Jeong, W.; Cho, K.H. Predicting epileptic seizures from scalp EEG based on attractor state analysis. Comput. Methods Programs Biomed. 2017, 143, 75–87. [Google Scholar] [CrossRef]
- Pukenas, K. Algorithm for the Detection of Changes in the Dynamics of a Multivariate Time Series via Sliced Cross-Bispectrum. Circuits. Syst. Signal Process. 2018, 37, 873–882. [Google Scholar] [CrossRef]
- Cho, E.; Min, B.; Kim, J.; Lee, B. EEG-Based Prediction of Epileptic Seizures Using Phase Synchronization Elicited from Noise-Assisted Multivariate Empirical Mode Decomposition. IEEE Trans. Neural Syst. Rehabil. Eng. 2017, 25, 1309–1318. [Google Scholar] [CrossRef]
- Ahmad, M.Z.; Kamboh, A.M.; Saleem, S.; Khan, A.A. Mallat’s Scattering Transform Based Anomaly Sensing for Detection of Seizures in Scalp EEG. IEEE Access 2017, 5, 16919–16929. [Google Scholar] [CrossRef]
- Bhattacharyya, A.; Pachori, R.B. A Multivariate Approach for Patient-Specific EEG Seizure Detection Using Empirical Wavelet Transform. IEEE Trans. Biomed. Eng. 2017, 64, 2003–2015. [Google Scholar]
- Samiee, K.; Kovács, P.; Gabbouj, M. Epileptic seizure detection in long-term EEG records using sparse rational decomposition and local Gabor binary patterns feature extraction. Knowl.-Based Syst. 2017, 118, 228–240. [Google Scholar] [CrossRef]
- Baldominos, A.; Ramon-Lozano, C. Optimizing EEG energy-based seizure detection using genetic algorithms. In Proceedings of the 2017 IEEE Congress on Evolutionary Computation (CEC), San Sebastián, Spain, 5–8 June 2017; pp. 2338–2345. [Google Scholar]
- Vidyaratne, L.S.; Iftekharuddin, K.M. Real-Time Epileptic Seizure Detection Using EEG. IEEE Trans. Neural Syst. Rehabil. Eng. 2017, 25, 2146–2156. [Google Scholar] [CrossRef]
- Janjarasjitt, S. Performance of epileptic single-channel scalp EEG classifications using single wavelet-based features. Australas. Phys. Eng. Sci. Med. 2017, 40, 57–67. [Google Scholar] [CrossRef]
- Ghasemi, N.; Mosavi, M.R. Seizure Prediction using EEG Segmentation Change Points. In Proceedings of the 2017 3rd Iranian Conference on Intelligent Systems and Signal Processing (ICSPIS), Shahrood, Iran, 20–21 December 2017; pp. 17–22. [Google Scholar]
- Prathap, P.; Devi, T.A. EEG spectral feature-based seizure prediction using an efficient sparse classifier. In Proceedings of the 2017 International Conference on Intelligent Computing, Instrumentation and Control Technologies (ICICICT), Kerala, India, 6–7 July 2017; pp. 721–725. [Google Scholar]
- Selvathi, D.; Selvaraj, H. FPGA Implementation for Epileptic Seizure Detection Using Amplitude and Frequency Analysis of EEG Signals. In Proceedings of the 2017 25th International Conference on Systems Engineering (ICSEng), Las Vegas, NV, USA, 22–24 August 2017; pp. 183–192. [Google Scholar]
- Khan, M.R.; Saadeh, W.; Awais, M.; Altaf, B. A Low Complexity Patient-Specific threshold-based Accelerator for the Grand-Mal Seizure Disorder. Biomed. Circuits Syst. (BioCAS) 2017, 2, 7–10. [Google Scholar]
- Khanmohammadi, S.; Chou, C.-A. Adaptive Seizure Onset Detection Framework Using a Hybrid PCA—CSP Approach. IEEE J. Biomed. Health Inform. 2018, 22, 154–160. [Google Scholar] [CrossRef]
- Ramakrishnan, S.; Murugavel, A.S.M. Epileptic seizure detection using fuzzy-rules-based sub-band specific features and layered multi-class SVM. Pattern Anal. Appl. 2018, 22, 1161–1176. [Google Scholar] [CrossRef]
- Truong, N.D.; Nguyen, A.D.; Kuhlmann, L.; Bonyadi, M.R.; Yang, J.; Ippolito, S.; Kavehei, O. Convolutional neural networks for seizure prediction using intracranial and scalp electroencephalogram. Neural Netw. 2018, 105, 104–111. [Google Scholar] [CrossRef] [PubMed]
- Harpale, V.; Bairagi, V. An adaptive method for feature selection and extraction for the classification of epileptic EEG signal insignificant states. J. King Saud Univ.—Comput. Inf. Sci. 2018, 33, 1–9. [Google Scholar]
- Selvakumari, R.S.; Mahalakshmi, M. Epileptic seizure detection by analyzing high dimensional phase space via Poincaré section. Multidimens. Syst. Signal Process. 2018, 30, 1–11. [Google Scholar] [CrossRef]
- Alickovic, F.; Kevric, J.; Subasi, A. Performance evaluation of empirical mode decomposition, discrete wavelet transform, and wavelet packed decomposition for automated epileptic seizure detection and prediction. Biomed. Signal Process. Control 2018, 39, 94–102. [Google Scholar] [CrossRef]
- Tsiouris, Κ.; Pezoulas, V.C.; Zervakis, M.; Konitsiotis, S.; Koutsouris, D.D.; Fotiadis, D.I. A Long Short-Term Memory deep learning network for the prediction of epileptic seizures using EEG signals. Comput. Biol. Med. 2018, 99, 24–37. [Google Scholar] [CrossRef] [PubMed]
- Tsiouris, Κ.; Markoula, S.; Konitsiotis, S.; Koutsouris, D.D.; Fotiadis, D.I. A robust unsupervised epileptic seizure detection methodology to accelerate large EEG database evaluation. Biomed. Signal Process. Control 2018, 40, 275–285. [Google Scholar] [CrossRef]
- Park, C.; Choi, G.; Kim, J.; Kim, S.; Kim, T.-J.; Min, K.; Jung, K.-Y.; Chong, J. Epileptic Seizure Detection for Multi-channel EEG with Deep Convolutional Neural Network. In Proceedings of the International Conference on Electronics, Information, and Communication (ICEIC), Honolulu, HI, USA, 24–27 January 2018; pp. 1–5. [Google Scholar]
- Ke, G.; Chen, D.; Li, X.; Tang, Y.; Shah, T.; Ranjan, R. Towards Brain Big Data Classification: Epileptic EEG Identification with a Lightweight VGGNet on Global MIC. IEEE Access 2018, 6, 14722–14733. [Google Scholar] [CrossRef]
- Tsiouris, K.M.; Konitsiotis, S.; Markoula, S.; Rigas, G.; Koutsouris, D.D.; Fotiadis, D.I. Unsupervised detection of epileptic seizures from EEG Signals: A Channel-specific Analysis of Long-term Recordings. In Proceedings of the 2018 IEEE EMBS International Conference on Biomedical and Health Informatics, Las Vegas, NV, USA, 4–7 March 2018; pp. 4–7. [Google Scholar]
- Lin, S.; Qomah, I.; Lin, Y.; Lin, C. Design and Implementation of a Smart Headband for Epileptic Seizure Detection and Its Verification Using Clinical Database. In Proceedings of the IEEE International Symposium on Circuits and Systems (ISCAS), Florence, Italy, 27–30 May 2018; pp. 1–5. [Google Scholar]
- Fan, M.; Chou, C.A. Detecting Abnormal Pattern of Epileptic Seizures via Temporal Synchronization of EEG Signals. IEEE Trans. Biomed. Eng. 2018, 66, 601–608. [Google Scholar] [CrossRef]
- Deng, Z.; Xu, P.; Xie, L.; Choi, K.S.; Wang, S. Transductive Joint-Knowledge-Transfer TSK FS for Recognition of Epileptic EEG Signals. IEEE Trans. Neural Syst. Rehabil. Eng. 2018, 26, 1481–1494. [Google Scholar] [CrossRef]
- Sopic, D.; Aminifar, A.; Atienza, D. e-Glass: A Wearable System for Real-Time Detection of Epileptic Seizures in Children. In Proceedings of the IEEE International Symposium on Circuits and Systems (ISCAS), Florence, Italy, 27–30 May 2018; pp. 1–5. [Google Scholar]
- Ke, H.; Chen, S.; Zhang, H.; Tang, Y.; Liu, Y.; Chen, D.; Li, X. A shallow-dense network approach to synchronization pattern classification of multivariate epileptic EEG. Lect. Notes Electr. Eng. 2018, 459, 553–563. [Google Scholar]
- Ibrahim, S.; Djemal, R.; Alsuwailem, A. Electroencephalography (EEG) signal processing for epilepsy and autism spectrum disorder diagnosis. Biocybern. Biomed. Eng. 2018, 38, 16–26. [Google Scholar] [CrossRef]
- Strungaru, R.; Hurezeanu, B.; Ungureanu, G.M.N. The Automatic Detection of Epileptic Seizures Based on EEG Signals Processing: Investigation of Different Features and Classification Algorithms. In Proceedings of the World Congress on Medical Physics and Biomedical Engineering; Springer: Singapore, 2018; pp. 393–397. [Google Scholar]
- Usman, S.M.; Khalid, S.; Aslam, M.H. Epileptic seizures prediction using deep learning techniques. IEEE Access 2020, 8, 39998–40007. [Google Scholar] [CrossRef]
- Liang, W.; Pei, H.; Cai, Q.; Wang, Y. Scalp EEG epileptogenic zone recognition and localization based on a long-term recurrent convolutional network. Neurocomputing 2020, 396, 569–576. [Google Scholar] [CrossRef]
- Raghu, S.; Sriram, N.; Gommer, E.D.; Hilkman, D.M.W.; Temel, Y.; Rao, S.V.; Hegde, A.S.; Kubben, P.L. Cross-database evaluation of EEG based epileptic seizures detection driven by adaptive median feature baseline correction. Clin. Neurophysiol. 2020, 131, 1567–1578. [Google Scholar] [CrossRef] [PubMed]
- Vetterli, M.; Herley, C. Wavelets and Filter Banks: Theory and Design. IEEE Trans. Signal Process. 1992, 40, 2207–2232. [Google Scholar] [CrossRef]
- Wornell, G.W. Wavelet-Based Representations for the l/f Family of Fractal Processes. Proc. IEEE 1993, 81, 1428–1450. [Google Scholar] [CrossRef]
- Mallat, S. A Wavelet Tour of Signal Processing, 3rd ed.; the Sparse Way, AP Professional; Academic Press: Cambridge, MA, USA, 2009. [Google Scholar]
- Faust, O.; Acharya, U.R.; Adeli, H.; Adeli, A. Wavelet-based EEG processing for computer-aided seizure detection and epilepsy diagnosis. Seizure Eur. J. Epilepsy 2015, 26, 56–64. [Google Scholar] [CrossRef] [PubMed]
- Learned, R.E.; Willsky, A.S. A Wavelet Packet Approach to Transient Signal Classification. Appl. Comput. Harmon. Anal. 1993, 2, 265–278. [Google Scholar] [CrossRef]
- Kutlu, Y.; Kuntalp, D. Feature extraction for ECG heartbeats using higher-order statistics of WPD coefficients. Comput. Methods Programs Biomed. 2011, 105, 257–267. [Google Scholar] [CrossRef]
- Alotaiby, T.N.; Alshebeili, S.A.; Alshawi, T.; Ahmad, I.; El-Samie, F.E.A. EEG seizure detection and prediction algorithms: A survey. EURASIP J. Adv. Signal Process. 2014, 2014, 183. [Google Scholar] [CrossRef]
- Fan, M.; Chou, C. Recognizing Affective State Patterns using Regularized Learning with Nonlinear Dynamical Features of EEG. In Proceedings of the 2018 IEEE EMBS International Conference on Biomedical & Health Informatics (BHI), Las Vegas, NV, USA, 4–7 March 2018; pp. 4–7. [Google Scholar]
- Acharya, U.R.; Fujita, H.; Sudarshan, V.K.; Bhat, S.; Koh, J.E.W. Knowledge-Based Systems Application of entropies for automated diagnosis of epilepsy using EEG signals: A review. Knowl.-Based Syst. 2015, 88, 85–96. [Google Scholar] [CrossRef]
- Sharma, R.; Pachori, R.B.; Acharya, U.R. Application of Entropy Measures on Intrinsic Mode Functions for the Automated Identification of Focal Electroencephalogram Signals. Entropy 2015, 17, 669–691. [Google Scholar] [CrossRef]
- Mutlag, A.A.; Ghani, M.K.A.; Mohammed, M.A. A Healthcare Resource Management Optimization Framework for ECG Biomedical Sensors. In Efficient Data Handling for Massive Internet of Medical Things; Chakraborty, C., Ghosh, U., Ravi, V., Shelke, Y., Eds.; Springer: Cham, Switzerland, 2021. [Google Scholar] [CrossRef]
- Subathra, M.S.P.; Mohammed, M.A.; Maashi, M.S.; Garcia-Zapirain, B.; Sairamya, N.J.; George, S.T. Detection of focal and non-focal electroencephalogram signals using fast Walsh-Hadamard transform and artificial neural network. Sensors 2020, 20, 4952. [Google Scholar]
- Hjorth, B. EEG analysis based on time domain properties. Electroencephalogr. Clin. Neurophysiol. 1970, 29, 306–310. [Google Scholar] [CrossRef]
- Damasevicius, R.; Maskeliunas, R.; Wozniak, M.; Polap, D. Visualization of physiologic signals based on Hjorth parameters and Gramian Angular Fields. In Proceedings of the 2018 IEEE 16th World Symposium on Applied Machine Intelligence and Informatics (SAMI), Kosice and Herlany, Slovakia, 7–10 February 2018; pp. 000091–000096. [Google Scholar] [CrossRef]
- Ma, D.; Zheng, J.; Peng, L. Performance Evaluation of Epileptic Seizure Prediction Using Time, Frequency, and Time–Frequency Domain Measures. Processes 2021, 9, 682. [Google Scholar] [CrossRef]
- Ilakiyaselvan, N.; Nayeemulla Khan, A.; Shahina, A. Deep learning approach to detect seizure using reconstructed phase space images. J. Biomed. Res. 2020, 34, 240–250. [Google Scholar] [CrossRef]
- Damasevicius, R.; Martisius, I.; Jusas, V.; Birvinskas, D. Fractional delay time embedding of EEG signals into high dimensional phase space. Electron. Electr. Eng. 2014, 20, 55–58. [Google Scholar] [CrossRef]


| Feature Extraction Method | Subjects | Window Size | Features | Classifier | Performance (%) |
|---|---|---|---|---|---|
| 1 s non-overlapping window [21] | 4 patient, 21 h recording | 1 s | Time: skewness, kurtosis, No. of maxima and minima, mean, variation, standard deviation, and Shannon, entropy, ApEn, energy, standard variation, variance, and energy of auto-covariance and COV, RMS. | SVM | Sen: 90.62 Spe: 99.32 |
| 1 s non-overlapping frames [23] | 21 patients (excluding patients 6, 12, 16) | 1 s | Time: No. of maxima and minima, skewness, kurtosis, standard deviation, COV, RMS, Shannon entropy, ApEn, energy, standard variation, mean, variation variance, the energy of auto-covariance. Frequency: mean of the power spectrum, spectral entropy, median frequency. maximum, minimum, and Time-frequency: relative scale energy, COV, frequency regularity index, maximum, minimum, Shannon entropy, variance, mean, std-deviation, No. of extrema, and energy Nonlinear: Lyapunov exponent | SVM, multi-dimensional PSO | Sen: 89 Spe: 93 |
| Time domain approach [28] | 23 patient | Mean, std-deviation, median, skewness, kurtosis, PA value, NA_value, mean of 1st and 2nd derivative and a maximum of 1st and 2nd derivative, RMS amplitude, line length, COV | K-means clustering | ||
| PCA [34] | 23 patients excluding 15 | 1 s | Range, quantile, IQR, Shannon entropy, RMS amplitude, COV, and energy | LDA, NB | Sen: 88.26 Spe: 93.21 |
| SVD [36] | 1 s | Classical features such as mean, variance, kurtosis, skewness, power | SVM | Acc: 94.82 | |
| PARAFAC decomposition [38] | 1 patient | Spatio-spectral features | LDA, SVM, K-means | ||
| PCA and LDA [40] | 171 seizures 171 non-seizures | 60 s | Peak frequency, median frequency, variance, RMS, sample entropy, skewness, and kurtosis | k-NN classifier | Sen: 88 Spe: 88 Acc: 93 |
| 2 s non-overlapping window [43] | 24 patient 198 seizures | 600 s | Spectral energy features | Linear SVM, A | Sen: 95.1 Spe: 96.2 |
| SVD [51] | 23 patient | 4 s | 2D eigenvalues, cross bi-spectrum in the spatial and spectral direction | ||
| PCA [62] | 23 patient | 1 s | Quantile, Inter quantile, range, Shannon entropy, RMS, COV, and energy | SVM NB | Sen: 95.01 Selectivity: 97.97 Acc: 96.77 |
| Feature Extraction Method | Subjects | Window Size | Features | Classifier | Performance (%) |
|---|---|---|---|---|---|
| Welch algorithm with 50% overlap [14] | 22 patients 133 seizures | 5 s | Spatial and spectral | SVM | Acc: 90 |
| Frequency band [21] | 4 patients, 21 h recording | 1 s | Maximum, minimum, and mean of the power spectrum, spectral entropy, median frequency. | SVM | Sen: 90.62 Spe: 99.32 |
| Discrete Fourier Transform [28] | 23 patients | Frequency: FFT_AP and RP of the delta, theta, alpha, gamma bands | K-means clustering | ||
| Filter bank [30] | 23 patients | 20 s | Temporal variability information | SVM | Sen:100 |
| PSD [32] | 24 patients | 60 s | Peak frequency, max frequency, median frequency, RMS, sample entropy, correlation dimension, skewness, kurtosis, | K-NN | Sen: 93 Spe: 94 |
| IHF based [42] | 23 patients, 163 seizures | 30 s | Arithmetic mean, geometric mean, variance, COV, mode, median, Pearson and Bowley’s, and moment measure of skewness, kurtosis, and negative entropy | MLP, Bayesian classifier | Sen: 97.27 Acc: 86.56 Precision rate: 86.53 |
| Attractor state analysis [47] | 13 patients 143 seizures | 20 s | Fourier coefficients of six EEG frequency bands | Sen: 86.67 | |
| Sparse Bayesian multinomial logistic regression [60] | 17 patients 78 seizures | 4 s | Spectral power and spectral power ratios such as absolute spectral power, relative spectral power, the spectral power ratio | Kernel sparse representation classifier | Sen: 86.11 |
| STFT [70] | 24 patients 198 seizures | 1 s | Spectral analysis, variation in EEG energy distribution over the delta, theta, and alpha rhythms | SSM | Sen: 88 |
| STFT [73] | 24 patient 185 seizures | 1 s | The energy of delta, theta, and alpha frequency bands | SSM | Sen: 95.1 |
| Welch method with 90% overlap [80] | 24 patients | 20 s | Amplitude, skewness, kurtosis, entropy, maxPSD, maxF, mean Gamma, mean Beta, mean Theta, mean Delta, varPSD | SVM, RF | Acc: 94 |
| Feature Extraction Method | Subjects | Window Size | Features | Classifier | Performance (%) |
|---|---|---|---|---|---|
| Wavelet decomposition [15] | 24 patients 156 seizures | 1 s | IQR, MAD | LDA | |
| CWT [16] | 7 patients | 5 s | Bivariate features | SVM | Sen: 52.2 |
| Daubechies 4 wavelet transform [17] | Spectral energy | SVM | |||
| Wavelet decomposition [19] | 5 patients | 1 s | COV, RCOV, NCOV, | LDA | Sen: 83.6 Spe: 100 Acc: 91.8 |
| Wavelet decomposition [20] | 23 patient | 20 s | Temporal variation | Linear SVM | Acc: 82.7 |
| DWT [21] | 4 patients, 21 h recording | 1 s | Time-frequency: relative scale energy, Shannon entropy, COV, frequency regularity index, maximum, minimum, variance, mean, std-deviation, No. of extrema and energy | SVM | Sen: 90.62 Spe: 99.32 |
| Wavelet decomposition [23] | 12 patients (patients 1–12) | 25 s | Sample entropy, ROA features | ELM, SVM | Sen: 92.6 |
| WT [24] | 24 patients | 1 s | Energy, entropy, std-deviation, maximum, minimum, mean, wavelet-based features, IQR, MAD | Linear Classifier | Sen: 98.5 Acc: 84.2 |
| DWT [28] | 23 patients | Mean, std-deviation, min, max, median, skewness, kurtosis, energy, entropy, mean and maximum of 1st and 2nd derivative, zero crossing, COV | K-means clustering | ||
| 2D mapping [29] | 24 patients | Uniformity, dissimilarity, contrast, correlation, autocorrelation, sum average, variance, sum variance, entropy, sum entropy, diff entropy, diff variance, homogeneity, cluster shade, cluster prominence, max probability | SVM | Sen: 70.19 Spe: 97.74 | |
| Frequency-time division multiplexing architecture [37] | 23 patients | Spectral energy | Linear SVM | Sen: 95.7 Spe: 98 | |
| SWT [41] | 18 patients | 2 s | Spectral and energy features 176 frequency features 88 energy features | LDA PRNN | Sen: 87.5 Spe: 99.5 |
| Multilevel wavelet decomposition [46] | 22 patients 192 seizures | 10, 20, 30 min | Magnitude, spectral energy variation, and relevance frequency | SVM ELM | SVM: - Sen: 97.98 Spe: 89.90 ELM: - Sen: 99.48 Spe: 81.39 |
| DWT [48] | 24 patients | 2 s | Mean, std-deviation, and all wavelet-based features | SVM | Sen: 72.99 Spe: 98.13 Acc: 96.87 |
| Wavelet transform [49] | 3 patients | 2 s | Mean, normalized COV, standard deviation, skewness, kurtosis, mean DSP, Peak_PSD | ELM | Acc: 94.85 |
| EMD, MEMD, and NA- MEMD [52] | 21 patients 65 seizures | 1, 5, 10, 15 s | Phase locking value | SVM | |
| Mallat’s scattering transform [53] | 24 patients | 1 s | Modulation spectra, Shannon entropy, Renyi entropy, permutation entropy, spectral entropy, Hurst exponent, line length, power spectra, fractal dimension | Spe: 86 | |
| EMD [54] | 24 patients | 1 s | Mean of joint instantaneous amplitude, mean monotonic absolute AM change, a variance of monotonic AM change | RF,FT, K-NN, C4.5, Bayes naïve, Bayes net | Sen: 97.91 Spe: 99.57 Acc: 99.41 |
| FWT [57] | 22 patients | 2 s | Fractal dimension, correlation, wavelet coefficients, energy, and HWPT features | RVM | Sen: 96 Acc: 99.8 |
| DWT [58] | 12 patients | 2 s | Wavelet-based spectral features | Sen: 83.34 Spe: 93.53 Acc: 93.24 | |
| EMD [68] | 21 patients | 8 s | Mean of coefficients, the average power of coefficient in every sub-band, std-deviation of coefficients, skewness, kurtosis | SVM, RF,MLP, K-NN | Sen: 99.65 Spe: 99.8 Acc: 99.7 |
| DWT [69] | 24 patients 185 seizures | 5 s | Statistical moments, standard deviation, zero crossings, peak-to-peak voltage, total signal area, energy percentage at delta, theta, alpha, beta, gamma bands, cross-correlation and autocorrelation, local and global measures | LSTM | Segment based: Sen: 99.84 Spe: 99.86 Event-based: Sen: 100 |
| WPD [76] | 24 patients | 10 s | Wavelet coefficients, energy features | ANFIS classifier | Sen:9 1.91 Spe: 93.16 Acc: 94.04 |
| DWT [77] | 10 patients 55 seizures | 4 s | Sample, permutation, Renyi, Shannon and Tsallis entropies, and power features | RF | Sen: 93.60 Spe: 93.37 |
| DWT [79] | 10 patients | 23.6 s | Std-deviation, Band power, Shannon entropy, largest Lyapunov exponent | K-NN SVM, LDA, ANN | Acc: 94.6 |
| Feature Extraction Method | Subjects | Window Size | Features | Classifier | Performance (%) |
|---|---|---|---|---|---|
| Nonlinear based [21] | 4 patients, 21 h recording | 1 s | Lyapunov exponent | SVM | Sen: 90.62 Spe: 99.32 |
| RQA [26] | 10 seizure file | Determinism, Avg-diagonal line length, entropy, laminarity, trapping time | Sen: 97.4 Spe: 93.5 | ||
| Entropy [28] | 23 patients | Entropy-based: spectral, Shannon entropies | K-means clustering | ||
| RQA [31] | 10 seizure files | Determinism, Avg-diagonal line length, entropy, laminarity, trapping time | ECOC | Sen: 97.4 Spe: 93.5 | |
| RQA [75] | 23 patients 182 seizures | 1 s | Spatial and temporal synchronization patterns and theoretic feature | Sen: 98.48 |
Publisher’s Note: MDPI stays neutral with regard to jurisdictional claims in published maps and institutional affiliations. |
© 2021 by the authors. Licensee MDPI, Basel, Switzerland. This article is an open access article distributed under the terms and conditions of the Creative Commons Attribution (CC BY) license (https://creativecommons.org/licenses/by/4.0/).
Share and Cite
Prasanna, J.; Subathra, M.S.P.; Mohammed, M.A.; Damaševičius, R.; Sairamya, N.J.; George, S.T. Automated Epileptic Seizure Detection in Pediatric Subjects of CHB-MIT EEG Database—A Survey. J. Pers. Med. 2021, 11, 1028. https://doi.org/10.3390/jpm11101028
Prasanna J, Subathra MSP, Mohammed MA, Damaševičius R, Sairamya NJ, George ST. Automated Epileptic Seizure Detection in Pediatric Subjects of CHB-MIT EEG Database—A Survey. Journal of Personalized Medicine. 2021; 11(10):1028. https://doi.org/10.3390/jpm11101028
Chicago/Turabian StylePrasanna, J., M. S. P. Subathra, Mazin Abed Mohammed, Robertas Damaševičius, Nanjappan Jothiraj Sairamya, and S. Thomas George. 2021. "Automated Epileptic Seizure Detection in Pediatric Subjects of CHB-MIT EEG Database—A Survey" Journal of Personalized Medicine 11, no. 10: 1028. https://doi.org/10.3390/jpm11101028
APA StylePrasanna, J., Subathra, M. S. P., Mohammed, M. A., Damaševičius, R., Sairamya, N. J., & George, S. T. (2021). Automated Epileptic Seizure Detection in Pediatric Subjects of CHB-MIT EEG Database—A Survey. Journal of Personalized Medicine, 11(10), 1028. https://doi.org/10.3390/jpm11101028