Article

Whole Body 3.0 T Magnetic Resonance Imaging in Lymphomas: Comparison of Different Sequence Combinations for Staging Hodgkin’s and Diffuse Large B Cell Lymphomas

1
Centre for Medical Imaging, University College London, 2nd Floor Charles Bell House, 43-45 Foley Street, London W1W 7TS, UK
2
The Royal Marsden Hospital, Downs road, Sutton, Surrey SM2 5PT, UK
3
Department of Radiology, University College London Hospitals NHS Foundation Trust, 235 Euston Road, London NW1 2BU, UK
4
Department of Medical Physics and Biomedical Engineering, University College London Hospitals NHS Foundation Trust, 235 Euston Road, London NW1 2BU, UK
5
Institute of Nuclear Medicine, University College London Hospitals NHS Foundation Trust, 235 Euston Road, London NW1 2BU, UK
6
Department of Haematology, University College London Hospitals NHS Foundation Trust, 235 Euston Road, London NW1 2BU, UK
*
Author to whom correspondence should be addressed.
J. Pers. Med. 2020, 10(4), 284; https://doi.org/10.3390/jpm10040284
Submission received: 1 November 2020 / Revised: 9 December 2020 / Accepted: 11 December 2020 / Published: 16 December 2020
(This article belongs to the Special Issue Biomedical Imaging and Cancers)

Abstract

:
To investigate the diagnostic value of different whole-body magnetic resonance imaging (WB-MRI) protocols for staging Hodgkin and diffuse-large B-cell lymphomas (HL and DLBCL), twenty-two patients (M/F 12/10, median age 32, range 22–87, HL/DLBCL 14/8) underwent baseline WB-MRI and 18F-2-fluoro-2-deoxy-D-glucose (18F-FDG) positron emission tomography (PET) fused with computed tomography (CT) scan 18F-FDG-PET-CT. The 3.0 T WB-MRI was performed using pre-contrast modified Dixon (mDixon), T2-weighted turbo-spin-echo (TSE), diffusion-weighted-imaging (DWI), dynamic-contrast-enhanced (DCE) liver/spleen, contrast-enhanced (CE) lung MRI and CE whole-body mDixon. WB-MRI scans were divided into: (1) “WB-MRI DWI+IP”: whole-body DWI + in-phase mDixon (2) “WB-MRI T2-TSE”: whole-body T2-TSE (3) “WB-MRI Post-C”: whole-body CE mDixon + DCE liver/spleen and CE lung mDixon (4) “WB-MRI All “: the entire protocol. Two radiologists evaluated WB-MRIs at random, independently and then in consensus. Two nuclear-medicine-physicians reviewed 18F-FDG PET-CT in consensus. An enhanced-reference-standard (ERS) was derived using all available baseline and follow-up imaging. The sensitivity and specificity of WB-MRI protocols for nodal and extra-nodal staging was derived against the ERS. Agreement between the WB-MRI protocols and the ERS for overall staging was assessed using kappa statistic. For consensus WB-MRI, the sensitivity and specificity for nodal staging were 75%, 98% for WB-MRI DWI+IP, 76%, 98% for WB-MRI Post-C, 83%, 99% for WB-MRI T2-TSE and 87%, 100% for WB-MRI All. The sensitivity and specificity for extra-nodal staging were 67% 100% for WB-MRI DWI+IP, 89%, 100% for WB-MRI Post-C, 89%, 100% for WB-MRI T2-TSE and 100%, 100% for the WB-MRI All. The consensus WB-MRI All read had perfect agreement with the ERS for overall staging [kappa = 1.00 (95% CI: 1.00-1.00)]. The best diagnostic performance is achieved combining all available WB-MRI sequences.

1. Introduction

Lymphomas, including Hodgkin’s lymphoma (HL) and non-Hodgkin’s lymphoma (NHL), are estimated to account for 3–4% of cancers worldwide [1]. Following histopathological confirmation, accurate staging is of great importance for treatment planning and prognostication. Staging in HL and NHL is predominantly based on the current Lugano classification [2] taking into account the number of involved sites, the type of lesions (nodal or extra-nodal), and the distribution of disease.
The current gold standard imaging for assessment of most common subtypes of adults’ lymphoma is 18F-2-fluoro-2-deoxy-D-glucose (18F-FDG) positron emission tomography (PET) fused with computed tomography (CT) scan (18F-FDG PET-CT) [2,3,4]. However, 18F-FDG PET-CT is a cost intensive imaging modality and in many countries access to PET-CT services is geographically limited to large tertiary care centers [5,6]. The more wide-spread availability of magnetic resonance imaging (MRI), coupled with numerous advances in software and hardware developments, makes it a useful technique for studying a range of diseases, including various types of malignancies. Over the past decade, whole-body MRI (WB-MRI) has been developed and investigated as an alternative radiation-free imaging technique and its feasibility has been demonstrated for a range of malignancies including lymphoma [7,8,9,10,11].
However, the most appropriate combination of MRI sequences for use within a WB-MRI protocol remains to be established, and studies to date have used a variety of acquisitions [12,13,14].
Diffusion weighted imaging (DWI) is commonly applied as part of WB-MRI protocols, and may offer an alternative to 18F-FDG PET-CT for lymphoma staging [5,13]. Some reports suggest DWI can complement conventional anatomical WB-MRI sequences [14], whilst others indicate that it adds little value to conventional imaging [15].
In this study, we aim to prospectively evaluate the diagnostic performance of differing 3.0 T WB-MRI protocols (comprising combinations of whole body T1 and T2 weighted imaging, DWI and contrast-enhanced (CE) imaging) for initial staging of adult HL and diffuse large B-cell lymphoma (DLBCL, the commonest subtype of NHL) against an enhanced reference standard based on 18F-FDG PET-CT and follow-up imaging.

2. Materials and Methods
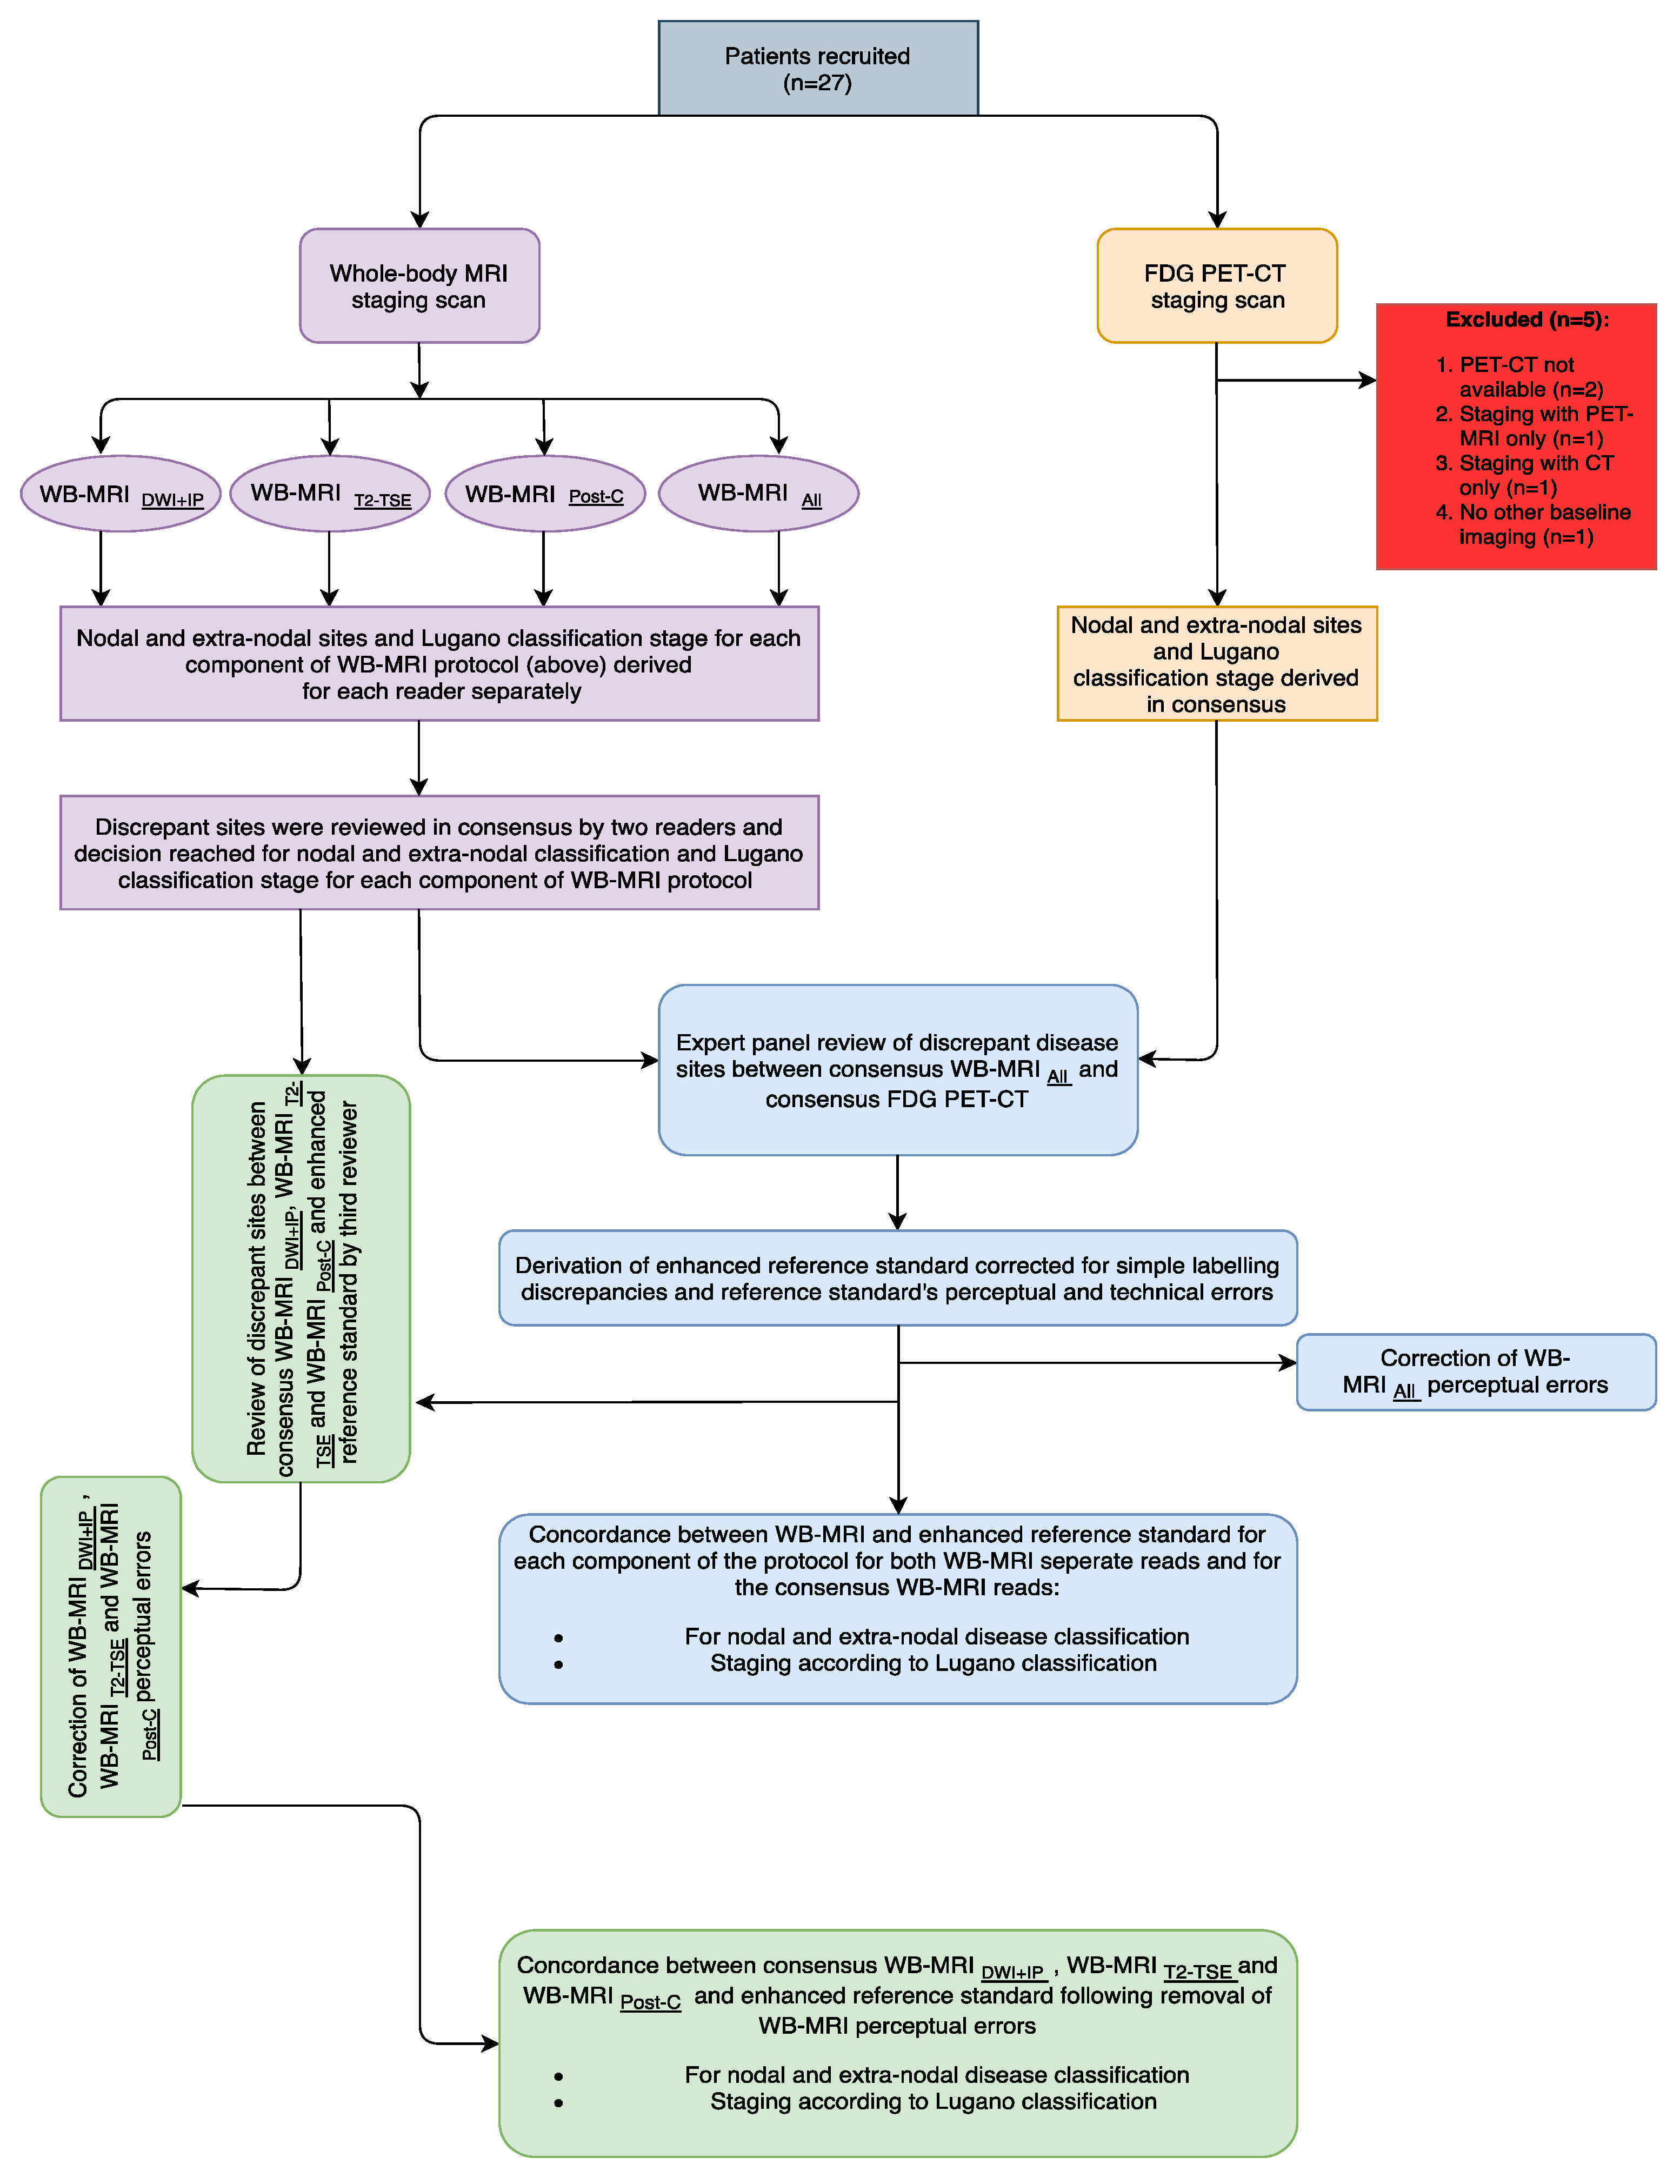
A prospective single-arm observational study was piloted following institutional ethical permission (Research Ethic Committee reference number: 12/LO/0428). Participants were recruited from a single center (blinded for review) and gave written informed consent.

2.1. Patient Cohort

Adult patients were identified from a tertiary lymphoma referral center between June 2012 and November 2015 inclusive. Inclusion criteria were: age ≥ 18 years; histopathologically proven HL or DLBCL; no previous malignancy, chemotherapy or radiotherapy; eGFR > 50 mL/min/1.73 m2 and no contraindication to MRI.

2.2. Study Summary

All recruited patients underwent a multi-parametric (T2 weighted imaging, DWI, T1 and contrast enhanced) WB-MRI scan at baseline in addition to conventional staging imaging (based on 18F-FDG PET-CT). Thereafter, as part of usual clinical care, patients underwent interim (where clinically relevant) and end-of-treatment assessments and were then followed for a minimum of 12 months after completion of chemo/radiotherapy. Recruited patients were also asked to attend for subsequent additional multi-parametric WB-MRI scans at the time they were scheduled for interim and/or end-of-treatment conventional imaging assessment.

2.3. Multi-Parametric Whole Body MRI Protocol

Imaging was performed using a 3.0 T wide-bore MR scanner (Ingenia; Phillips Healthcare, Best, Netherlands). WB-MRI coverage was from vertex to mid-thigh and was obtained through multi-station acquisition of contiguous body regions with the manufacturers’ head coil, two anterior surface coils and table embedded posterior coils. Full scanning parameters are summarized in Table 1.
In brief, anatomical T1 weighted imaging was performed using a coronal two-point modified Dixon (mDixon) imaging sequence. This was followed by axial T2 weighted turbo spin echo (TSE), axial DWI (with 4 b-values, b0,100,300 and 1000 s/mm2) and finally contrast enhanced (CE) MRI acquisitions.
CE MR imaging consisted of axial dynamic contrast enhanced (DCE) MRI of the liver and spleen, coronal CE whole-body mDixon and CE axial mDixon lung MRI. For DCE imaging, pre-contrast mDixon images were acquired in breath-hold to include the entire liver and spleen. This acquisition was then repeated during and after intravenous (IV) injection of 20 mL of gadoterate meglumine (Dotarem, Guebert, France) at 3 mL/s using a pump injector. Multiple arterial, venous and delayed phase acquisitions of liver and spleen were followed by two-stations axial CE lung images from apex of the lung to the top of the liver using mDixon MRI. Finally, whole-body coronal CE mDixon imaging was conducted.
All mDixon images were post-processed online using scanner software to create in-phase, out-of-phase, fat-only and water-only images [16].

2.4. 18F-FDG PET-CT Protocol

18F-FDG PET-CT was performed on a combined GE Discovery LS 18F-FDG PET-CT in-line system (GE Healthcare, Milwaukee, Wisconsin, USA). Patients fasted for 6 h and blood glucose levels were tested to exclude hyperglycemia (levels >150 mg/dL).
A standard dose of 5.5 MBq/kg of 18F-FDG was intravenously injected 60 min before imaging. Whole-body examinations were performed in the supine position, from skull base to mid-thigh level with 5 bed scans in most of the patients, following the European association of nuclear medicine (EANM) guidelines for injection and scanning [17]. Prior to acquiring the whole-body PET emission scan, a non-contrast CT of the body was obtained using the integrated four-slice CT scanner (140kVp, 80mA tube current, 0.8 s rotation time, 4 × 3.75 mm detectors, pitch 1.5, 5 mm collimation). PET images were reconstructed using the CT for attenuation correction. Combined trans-axial emission images of 18F-FDG PET and CT were then reconstructed at 128 × 128 resolution and 2.5 mm thickness.

2.5. Whole Body MRI Interpretation

Four WB-MRI datasets were created from each pre-treatment multi-parametric WB-MRI study:
(1)
“WB-MRI DWI+IP”: Whole-body pre-contrast in-phase mDixon + whole-body DWI (b1000)
(2)
“WB-MRI T2-TSE”: Whole-body T2-TSE only,
(3)
“WB-MRI Post-C”: Whole-body post-contrast water-only mDixon, DCE liver/spleen and CE lung mDixon,
(4)
“WB-MRI All”: all components from 1–3 above.
Two radiologists (M.K.J.D and M.K with 12 and 6 years of experience) reviewed the anonymized datasets separately, blinded to the clinical history (other than the diagnosis of lymphoma) and all other imaging investigations. All images were reviewed using Osirix (V 4.1, Pixmeo SARL, Bernex, Switzerland) on a Mac (Apple, Cupertino, CA, USA) workstation.
At each reading session, the reporting radiologist evaluated one of each of the four components of the WB-MRI datasets at random. At each reading session, only one dataset for a given patient was revealed to reporting radiologists. To reduce recognition bias, a minimum two-week interval was instituted between reading sessions. A maximum of 6 patients (datasets) were reviewed per session to avoid reader fatigue.
For each dataset, radiologists recorded disease status at 18 nodal sites (cervical [right (R) and left (L)], supraclavicular (R and L), subpectoral (R and L), axillary (R and L), mediastinal, splenic hilar, liver hilar, mesenteric, retroperitoneal, iliac (R and L), inguinal (R and L) and “other” sites, and 12 extra-nodal sites, lung, pleura, pericardium, chest wall, liver, spleen, kidney, stomach, bowel, pancreas, bone and “other” sites) as well as final Lugano classification overall stage (2) were derived.
For the nodal sites, the maximum short-axis dimension of the largest nodal mass in a given region was measured using software calipers. Disease positivity was defined as a mass with a short-axis dimension equal or greater than 1 cm [7,18,19].
The extra-nodal sites were assessed using pre-defined positivity/negativity criteria as described previously [7,18,19,20].
Finally, the time to report each component of WB-MRI read was recorded for each reader.
After completion of the radiologists’ individual reads for all datasets for all patients, a consensus meeting was held between the two radiologists where anatomical sites discrepant for disease positivity for a given patient dataset were re-evaluated to reach a final consensus on disease status. Where no consensus was reached, a third independent radiologist (S.P) was available for adjudication to reach an overall majority opinion.

2.6. 18F-FDG PET-CT Interpretation

18F-FDG PET-CT images were reviewed by two nuclear medicine physicians (F.F and D.N with 10 and 5 years of experience) in consensus. Readers were aware of the diagnosis of lymphoma but were unaware of the WB-MRI findings. All images were assessed on a workstation (Xeleris 2; GE Healthcare, Milwaukee, WI, USA) and results were recorded for the regional divisions defined above for WB-MR imaging.
Nodal dimension was measured on the CT component of the 18F-FDG PET-CT and the maximum standardized uptake value (SUVmax) for the node exhibiting the greatest uptake at each anatomic site was recorded. Disease positivity was defined as the presence of nodes with increased FDG uptake greater than that of the mediastinal and liver pools in a location incompatible with normal physiologic activity [2,21] and/or unexplained nodal enlargement [2]. Extra-nodal disease was defined as previously described [2].

Expert Panel Review and Derivation of Enhanced Reference Standard

Given the potential limitations of standard imaging and the risk of radiologist/nuclear medicine physician perceptual errors [7,20] influencing the WB-MRI and 18F-FDG PET-CT staging, a retrospective enhanced reference standard (ERS) was produced to better evaluate the potential accuracy of WB-MRI as previously described [22]. Specifically, all discrepancies between consensus WB-MRI All and 18F-FDG PET-CT at initial staging were reviewed by an expert panel comprising of two reporting radiologists and two reporting nuclear medicine physicians (Figure 1).
The expert panel re-evaluated the 18F-FDG PET-CT and the WB-MRI All dataset. Unlike the initial image interpretations, the panel had access to all clinical data and concurrent imaging investigations, including the follow-up 18F-FDG PET-CT and WB-MRI where performed.
Firstly, by directly matching PET-CT and WB-MRI images, the panel corrected for labelling discrepancies resulting from different interpretation of anatomical boundaries between WB-MRI and 18F-FDG PET-CT readers [20]. Secondly, based on all the available imaging and follow up data, remaining discrepancies between consensus WB-MRI All and 18F-FDG PET-CT were reviewed to identify and correct for perceptual errors on 18F-FDG PET-CT [20]. For example, unequivocal areas of disease positivity on consensus WB-MRI All that were missed on the original 18F-FDG PET-CT interpretation but visible on the 18F-FDG PET-CT in retrospect were corrected.
Sites positive for disease on consensus WB-MRI All but not visible on 18F-FDG PET-CT even in retrospect were reviewed in light of other imaging and follow-up to identify technical failures of 18F-FDG PET-CT (10). Only unequivocal disease sites on consensus WB-MRI All that demonstrated a clear response to treatment were considered technical failures of 18F-FDG PET-CT (and deemed these positive by ERS); otherwise such findings were classified as consensus WB-MRI All false positives [20]. In a similar fashion, the panel also identified any false positive findings on 18F-FDG PET-CT (and deemed these negative by ERS).
Consensus WB-MRI All findings discrepant to the ERS were classified into perceptual errors, when the abnormality was visible in retrospect on the WB-MRI, or technical error when it was not [7,20].
Finally, in order to delineate the errors for consensus WB-MRI DWI+IP, WB-MRI T2-TSE and WB-MRI Post-C, a separate review of each dataset compared to ERS was undertaken by a consultant radiologist (H.S with 6 years of experience in WB-MR imaging) who was not involved with the initial image reviewing of the study. All the discrepant sites between WB-MRI DWI+IP, WB-MRI T2-TSE and WB-MRI Post-C and ERS were reviewed and categorized into anatomical boundaries discrepancies, perceptual and technical errors as previously described [20].

2.7. Statistical Analysis

Statistical analysis was performed using Prism software (Prism Version 6.0, GraphPad, San Diego, CA, USA) by the study clinical research fellow (blinded for review).
Initially the analysis was performed for nodal and extra-nodal staging, for each of the four WB-MRI generated datasets for each reader against the ERS. Following the initial analysis, the WB-MRI nodal and extra-nodal staging consensus reads (for each component) were compared against the ERS.
For each analysis, the agreement rate, true positive rate (TPR), false positive rate (FPR) and kappa agreement of WB-MRI for nodal and extra-nodal staging were derived.
Agreement between the WB-MRI reads and the ERS for overall staging was tested using a weighted kappa statistic.
The same analysis of agreement rate, TPR, FPR and kappa agreement as well as agreement for overall staging were repeated following correction for anatomical boundaries discrepancies and WB-MRI’s perceptual errors for each of the four WB-MRI generated datasets.
Finally, a repeated measure analysis of variance (ANOVA) with Tukey’s multiple comparison test was used to assess time to report each sequence for each reader; p-values < 0.05 were considered as statistically significant.

3. Results

3.1. Patient Characteristics

The study flowchart is presented in Figure 1.
Twenty-seven patients were prospectively recruited (M: F 13: 14, median age 43, range 22–87 years). Five patients were excluded from the analysis; 1 had 18F-FDG PET-MRI, 1 only had whole-body CT scan, 1 did not initially consent to any imaging with radiation exposure and 2 did not have the 18F-FDG PET-CT images available for comparison. The demographics, disease subtype, treatment regimen and overall baseline stage of the final 22 patient study cohort is shown in Table 2.
Staging WB-MRI performed within median 10 days (range 0–44 days) of 18F-FDG PET-CT without any complication, and before treatment in all patients.

3.2. Expert Panel Review and Enhanced Reference Standard

Across the cohort there were 633 anatomical sites (390 nodal and 243 extra-nodal sites) evaluated by both WB-MRI and 18F-FDG PET-CT.
The expert panel consensus review identified and resolved 11 anatomical boundary labelling discrepancies (Figure 2).
One 18F-FDG PET-CT extra-nodal false negative perceptual error (Figure 3) and one 18F-FDG PET-CT nodal false positive perceptual error was identified and corrected, resulting in 52 nodal and 9 extra-nodal positive disease sites on enhanced reference standard.
There were 3 patients with bone marrow (n = 3) metastasis as well as spleen (n = 1), lung (n = 1), pericardium (n = 1), chest wall (n = 1), liver (n = 1) and maxillary sinus (n = 1) extra-nodal involvements.

3.3. Comparison of Whole-Body MRI and Enhanced Reference Standard

The agreement rate, TPR, FPR and kappa agreement for nodal and extra-nodal staging for each reader and for consensus read of the four generated WB-MRI datasets is summarised in Table 3, Table 4 and Table 5, respectively.
The agreement rate, TPR, FPR and kappa agreement for WB-MRI All consensus nodal staging were 98%, 87%, 0 and 0.92 (95% CI: 0.86–0.98). The agreement rate, TPR, FPR and kappa agreement for WB-MRI All consensus extra-nodal staging were 100% 100%, 0 and 1.00 (1.00–1.00).

3.4. Comparison of Whole-Body MRI and Enhanced Reference Standard following Correction for Perceptual Errors

For consensus WB-MRI All, there were 7 false negative disease sites due to technical failure in detection of sub-centimeter lymph nodes against the ERS (Figure 4).
Following the additional review by the third radiologist, the anatomical boundaries discrepancies and perceptual errors for consensus WB-MRI DWI+IP (nodal anatomical boundaries discrepancies: 6, nodal perceptual errors: 2 and extra-nodal perceptual error: 1), consensus WB-MRI T2-TSE (nodal anatomical boundaries discrepancies: 5, nodal perceptual errors: 1) and consensus WB-MRI Post-C (nodal anatomical boundaries discrepancies: 6, nodal perceptual errors: 3 and extra-nodal perceptual error: 1) were identified and corrected.
Excluding the 7 false negative nodal disease sites (technical failure in detection of sub-centimeter lymph nodes) on WB-MRI All, there were additional 3 and 2 technical errors for nodal and extra-nodal sites on WB-MRI DWI+IP and 1 extra-nodal technical error for WB-MRI T2-TSE respectively.
The agreement rate, TPR, FPR and kappa agreement for nodal and extra-nodal staging for consensus WB-MRI DWI+IP, WB-MRI T2-TSE and WB-MRI Post-C following correction of the anatomical boundaries discrepancies and perceptual errors are tabulated in Table 6.

3.5. Overall Stage

The kappa agreement for the staging based on the Lugano classification (2) of all 4 component of the WB-MRI protocol for each reader and for the consensus read (before and and following correction of the anatomical boundaries discrepancies and WB-MRI perceptual errors) against the ERS is summarised in Table 7.
Compared to the ERS, WB-MRI DWI+IP consensus (following correction of the anatomical boundaries discrepancies and perceptual errors) under-staged 3 patients. One patient was under-staged due to false negative interpretation of bone marrow involvement while in the other 2 cases false negative nodal involvement (in mediastinum and supraclavicular stations) resulted in under-staging of disease (Figure 5).
WB-MRI T2-TSE consensus read under-staged 1 patient due false negative interpretation of bone marrow involvement.
The consensus WB-MRI All and WB-MRI Post-C (following correction of the anatomical boundaries discrepancies and perceptual errors) read had perfect agreement with ERS for overall staging according to the Lugano classification (2) [kappa = 1.00 (95% Confidence interval: 1.00-1.00)].
The mean (standard deviation) for time to report WB-MRI DWI+IP, WB-MRI Post-C, WB-MRI T2-TSE and WB-MRI All were 7.4 (2.4), 7.9 (2.0), 8.5 (2.5) and 8.7 (3.2) minute for reader 1 and 8.1 (2.3), 7.8 (2.4), 8.7 (3.1) and 7.5 (2.3) minute for reader 2, respectively.
For both readers, there was no significant difference for time to report for WB-MRI DWI+IP, WB-MRI Post-C, WB-MRI T2-TSE and WB-MRI All reads.

4. Discussion

In this study we investigated the diagnostic performance of different WB-MRI protocols, using a variety of MRI sequences, as part of a multi-parametric WB-MRI protocol design for staging of HL and DLBCL lymphomas. We found that the overall performance of WB-MRI for nodal and extra-nodal staging was best when all available sequences (WB-MRI All) were reviewed, both for individual and consensus reads. We also found that for the overall staging, there was a similar pattern of increased agreement with the ERS when all available sequences were assessed concurrently showing a perfect agreement between WB-MRI All and ERS.
The feasibility of using WB-MRI for staging lymphoma has been investigated in several previous studies [5,7,12,15,20]. Additionally, a more widespread availability of MRI scanners (compare to 18F-FDG PET-CT scanners) [6] and lower cost of WB-MRI to 18F-FDG PET-CT [23] makes it a potential alternative/adjunct to current gold-standard imaging technique.
For instance, health economy analysis has shown that for staging lung cancers, there is approximately 50% cost reduction for WB-MRI staging compared to standard staging pathway (including PET-CT) [24]. However, the majority of the published work either used a single morphological/functional sequence [22] or investigated the sequential added value of multiple sequences [10,12,15] as part of the WB-MRI protocol. Rarely in the literature has the diagnostic yield of each sequence been investigated separately for the evaluation of the same subject. Kwee et al. [15] reported no additional advantage for supplementing DWI to combined T1 and T2-w WB-MRI for staging lymphomas. In their cohort of 108 patients with various subtypes of lymphoma, they found that T1 and T2-weighted WB-MRI without DWI was concordant with CT staging in 66.6% of cases, compared to 65.4% concordance for that T1 and T2-weighted WB-MRI with DWI.
In our study, WB-MRI DWI+IP was inferior compared with other sequence combinations for nodal and extra-nodal staging, for both readers and for the consensus read. Following the consensus read and correction of the anatomical boundaries discrepancies and perceptual errors, there were 3 cases that were under-staged with WB-MRI DWI+IP compared to ERS in our cohort, giving a concordance rate of 86%.
Using a 3.0T WB-MRI, Tsuji et al. [12] showed that whole-body DWI alone was concordant with reference standard 18F-FDG PET-CT in 78% (n = 22) of 28 patients with DLBCL (n = 17) and follicular lymphoma (n = 11). However, they also showed that agreement improved (26/28) when T2-weighted imaging was added to whole-body DWI, highlighting the limitation of DWI only imaging for WB-MRI. We observed that WB-MRI T2-TSE has an improved diagnostic ability compared to WB-MRI DWI+IP for nodal and extra-nodal disease detection and overall staging. The final consensus WB-MRI T2-TSE had concordance rate of 95% (21/22) for the overall staging in our cohort, with one patient under-staged due to a false negative interpretation of bone involvement.
We also found that the consensus WB-MRI Post-C had perfect concordance rate for the overall staging following correction of the anatomical boundaries discrepancies and perceptual errors.
Recently, in a study of 18 patients with various malignancies including lymphoma (n = 7), Obara et al. [25] showed that, compared to reference standard 18F-FDG PET-CT, CE WB-MRI outperformed both DWI and fat-suppressed T2 only WB-MRI in terms of sensitivity and specificity for malignant disease detection. Whilst our results also suggest a less favourable outcome for WB-MRI DWI+IP for initial staging of HL and DLBCL, we believe the additional significant information provided by DWI may be helpful for interim and end-of-treatment response evaluation in lymphomas [26,27,28,29].
Of note, we found even following the consensus WB-MRI All reads, there were seven false negative nodal technical errors, all relating to sub-centimeter FDG avid nodes, corroborating the findings of authors who have highlighted the limitations of size-criteria alone for nodal disease positivity [7]. However, in our cohort the technical errors for WB-MRI All reads did not change the disease stage of individual patients.
Our study has several limitations. The patient cohort is small and so the power of our study to identify small differences in performance between MRI sequences is statistically limited. We deliberately choose to use size criteria as the primary differentiator of positive and negative nodal status and sequences were used primarily as tools for anatomical localization. Hence, we did not test the value of signal derived quantitative metrics in differentiating between positive and negative nodes. This was informed by growing evidence that application of quantitative metric cut-off values may not be useful in discriminating between positive and negative nodes in lymphoma [20].
Finally, we were unable to obtain histological samples from all suspicious disease sites, as this would not be ethically and/or technically feasible, therefore we used an expert consensus panel and follow-up to derive an enhanced reference standard. Whilst such an approach is imperfect, it is often necessary for diagnostic accuracy studies [7,10,15,20].

5. Conclusions

In conclusion, our results suggest that best diagnostic performance is achieved when all imaging sequences are combined (WB-MRI All). However, this protocol would require 75 min to complete and is unlikely to be suitable for widespread clinical implementation. Where constrained for time, an abbreviated protocol using T2-weighted and contrast-enhanced sequences (which provided best individual performance for nodal and extra-nodal staging respectively) could be considered.

Author Contributions

Conceptualization, A.L. and S.P.; methodology, A.L., S.P. and A.B.; validation, A.L., S.P. and A.B.; formal analysis, A.L., S.P., H.S., M.K.J.D., M.K., D.N. and F.F.; investigation, A.L., S.P., H.S., M.K.J.D., M.K., D.N., F.F., J.L. and K.M.A.; data curation, A.L., S.P., H.S., M.K.J.D., M.K., D.N., F.F., J.L. and K.M.A.; writing—original draft preparation, A.L. and S.P.; writing—review and editing, A.L., S.P., H.S., M.K.J.D., M.K., D.N., F.F., J.L. and K.M.A.; supervision, S.P.; project administration, A.L. All authors have read and agreed to the published version of the manuscript.

Funding

This research received no external funding.

Acknowledgments

This work was undertaken at the Comprehensive Biomedical Centre (BRC), University College Hospital London (UCLH), which received a proportion of the funding from the National Institute for Health Research (NIHR). The views expressed in this publication are those of the authors and not necessarily those of the UK Department of Health.

Conflicts of Interest

The authors declare no conflict of interest.

References

  1. Saito, E.; Matsuoka, J. International comparison of Hodgkin and non-Hodgkin lymphoma incidence. Jpn. J. Clin. Oncol. 2020, 50, 96–97. [Google Scholar] [CrossRef] [PubMed]
  2. Cheson, B.D.; Fisher, R.I.; Barrington, S.F.; Cavalli, F.; Schwartz, L.H.; Zucca, E.; Lister, T.A. Alliance, Australasian Leukaemia and Lymphoma Group; Eastern Cooperative Oncology Group; Italian Lymphoma Foundation; et al. European Mantle Cell Lymphoma Consortium Recommendations for Initial Evaluation, Staging, and Response Assessment of Hodgkin and Non-Hodgkin Lymphoma: The Lugano Classification. J. Clin. Oncol. 2014, 32, 3059–3067. [Google Scholar] [CrossRef] [PubMed]
  3. Cronin, C.G.; Swords, R.; Truong, M.T.; Viswanathan, C.; Rohren, E.; Giles, F.J.; O’Dwyer, M.; Bruzzi, J.F. Clinical Utility of PET/CT in Lymphoma. Am. J. Roentgenol. 2010, 194, W91–W103. [Google Scholar] [CrossRef] [PubMed]
  4. Ghielmini, M.; Vitolo, U.; Kimby, E.; Montoto, S.; Walewski, J.; Pfreundschuh, M.; Federico, M.; Hoskin, P.; McNamara, C.; Caligaris-Cappio, F.; et al. ESMO Guidelines consensus conference on malignant lymphoma 2011 part 1: Diffuse large B-cell lymphoma (DLBCL), follicular lymphoma (FL) and chronic lymphocytic leukemia (CLL). Ann. Oncol. 2013, 24, 561–576. [Google Scholar] [CrossRef] [PubMed]
  5. Mayerhoefer, M.E.; Karanikas, G.; Kletter, K.; Prosch, H.; Kiesewetter, B.; Skrabs, C.; Porpaczy, E.; Weber, M.; Pinker-Domenig, K.; Berzaczy, D.; et al. Evaluation of Diffusion-Weighted MRI for Pretherapeutic Assessment and Staging of Lymphoma: Results of a Prospective Study in 140 Patients. Clin. Cancer Res. 2014, 20, 2984–2993. [Google Scholar] [CrossRef] [PubMed] [Green Version]
  6. Matsumoto, M.; Koike, S.; Kashima, S.; Awai, K. Geographic Distribution of CT, MRI and PET Devices in Japan: A Longitudinal Analysis Based on National Census Data. PLoS ONE 2015, 10, e0126036. [Google Scholar] [CrossRef] [PubMed] [Green Version]
  7. Punwani, S.; Taylor, S.A.; Bainbridge, A.; Prakash, V.; Bandula, S.; De Vita, E.; Olsen, O.E.; Hain, S.F.; Stevens, N.; Daw, S.; et al. Pediatric and Adolescent Lymphoma:Comparison of Whole-Body STIR Half-Fourier RARE MR Imaging with an Enhanced PET/CT Reference for Initial Staging. Radiology 2010, 255, 182–190. [Google Scholar] [CrossRef] [PubMed]
  8. Padhani, A.R.; Lecouvet, F.E.; Tunariu, N.; Koh, D.-M.; De Keyzer, F.; Collins, D.J.; Sala, E.; Schlemmer, H.P.; Petralia, G.; Vargas, H.A.; et al. METastasis Reporting and Data System for Prostate Cancer: Practical Guidelines for Acquisition, Interpretation, and Reporting of Whole-body Magnetic Resonance Imaging-based Evaluations of Multiorgan Involvement in Advanced Prostate Cancer. Eur. Urol. 2017, 71, 81–92. [Google Scholar] [CrossRef] [Green Version]
  9. Latifoltojar, A.; Hall-Craggs, M.; Bainbridge, A.; Rabin, N.; Popat, R.; Rismani, A.; D’Sa, S.; Dikaios, N.; Sokolska, M.; Antonelli, M.; et al. Whole-body MRI quantitative biomarkers are associated significantly with treatment response in patients with newly diagnosed symptomatic multiple myeloma following bortezomib induction. Eur. Radiol. 2017, 27, 5325–5336. [Google Scholar] [CrossRef]
  10. Latifoltojar, A.; Humphries, P.D.; Menezes, L.J.; Haroon, A.; Daw, S.; Shankar, A.; Punwani, S. Whole-body magnetic resonance imaging in paediatric Hodgkin lymphoma—Evaluation of quantitative magnetic resonance metrics for nodal staging. Pediatric Radiol. 2019, 49, 1285–1298. [Google Scholar] [CrossRef] [Green Version]
  11. Lecouvet, F.E.; Van Nieuwenhove, S.; Jamar, F.; Lhommel, R.; Guermazi, A.; Pasoglou, V.P. Whole-Body MR Imaging: The Novel, "Intrinsically Hybrid," Approach to Metastases, Myeloma, Lymphoma, in Bones and Beyond. PET Clin. 2018, 13, 505–522. [Google Scholar] [CrossRef] [PubMed]
  12. Tsuji, K.; Kishi, S.; Tsuchida, T.; Yamauchi, T.; Ikegaya, S.; Urasaki, Y.; Rt, Y.F.; Ueda, T.; Okazawa, H.; Kimura, H. Evaluation of staging and early response to chemotherapy with whole-body diffusion-weighted MRI in malignant lymphoma patients: A comparison with FDG-PET/CT. J. Magn. Reson. Imaging 2015, 41, 1601–1607. [Google Scholar] [CrossRef] [PubMed]
  13. Regacini, R.; Puchnick, A.; Shigueoka, D.C.; Iared, W.; Lederman, H.M. Whole-body diffusion-weighted magnetic resonance imaging versus FDG-PET/CT for initial lymphoma staging: Systematic review on diagnostic test accuracy studies. Sao Paulo Med. J. 2015, 133, 141–150. [Google Scholar] [CrossRef] [PubMed] [Green Version]
  14. Gu, J.; Chan, T.; Zhang, J.; Leung, A.Y.H.; Kwong, Y.L.; Khong, P.-L. Whole-Body Diffusion-Weighted Imaging: The Added Value to Whole-Body MRI at Initial Diagnosis of Lymphoma. Am. J. Roentgenol. 2011, 197, W384–W391. [Google Scholar] [CrossRef] [PubMed]
  15. Kwee, T.C.; Vermoolen, M.A.; Akkerman, E.A.; Kersten, M.J.; Fijnheer, R.; Ludwig, I.; Beek, F.J.A.; Van Leeuwen, M.S.; Bierings, M.B.; Bruin, M.C.A.; et al. Whole-body MRI, including diffusion-weighted imaging, for staging lymphoma: Comparison with CT in a prospective multicenter study. J. Magn. Reson. Imaging 2014, 40, 26–36. [Google Scholar] [CrossRef] [PubMed]
  16. Bray, T.J.; Singh, S.; Latifoltojar, A.; Rajesparan, K.; Rahman, F.; Narayanan, P.; Naaseri, S.; Lopes, A.; Bainbridge, A.; Punwani, S.; et al. Diagnostic utility of whole body Dixon MRI in multiple myeloma: A multi-reader study. PLoS ONE 2017, 12, e0180562. [Google Scholar] [CrossRef] [Green Version]
  17. Boellaard, R.; Delgado-Bolton, R.; Oyen, W.J.G.; Giammarile, F.; Tatsch, K.; Eschner, W.; Verzijlbergen, F.J.; Barrington, S.F.; Pike, L.C.; Weber, W.A.; et al. FDG PET/CT: EANM procedure guidelines for tumour imaging: Version 2.0. Eur. J. Nucl. Med. Mol. Imaging 2015, 42, 328–354. [Google Scholar] [CrossRef]
  18. Johnston, E.W.; Latifoltojar, A.; Sidhu, H.S.; Ramachandran, N.; Sokolska, M.; Bainbridge, A.; Moore, C.; Ahmed, H.U.; Dikaios, N. Multiparametric whole-body 3.0-T MRI in newly diagnosed intermediate- and high-risk prostate cancer: Diagnostic accuracy and interobserver agreement for nodal and metastatic staging. Eur. Radiol. 2019, 29, 3159–3169. [Google Scholar] [CrossRef] [Green Version]
  19. Ganeshalingam, S.; Koh, D.-M. Nodal staging. Cancer Imaging 2009, 9, 104–111. [Google Scholar] [CrossRef] [Green Version]
  20. Latifoltojar, A.; Punwani, S.; Lopes, A.; Humphries, P.D.; Klusmann, M.; Menezes, L.J.; Daw, S.; Shankar, A.; Neriman, D.; Fitzke, H.; et al. Whole-body MRI for staging and interim response monitoring in paediatric and adolescent Hodgkin’s lymphoma: A comparison with multi-modality reference standard including 18F-FDG-PET-CT. Eur. Radiol. 2019, 29, 202–212. [Google Scholar] [CrossRef] [Green Version]
  21. Johnson, S.A.; Kumar, A.; Matasar, M.J.; Schöder, H.; Rademaker, J. Imaging for Staging and Response Assessment in Lymphoma. Radiology 2015, 276, 323–338. [Google Scholar] [CrossRef] [PubMed] [Green Version]
  22. Brennan, D.D.; Gleeson, T.; Coate, L.E.; Cronin, C.; Carney, D.; Eustace, S.J. A Comparison of Whole-Body MRI and CT for the Staging of Lymphoma. Am. J. Roentgenol. 2005, 185, 711–716. [Google Scholar] [CrossRef] [PubMed]
  23. NICE Guideline; Myeloma: Diagnosis and Management (February 2016). Available online: https://www.nice.org.uk/guidance/ng35/evidence/full-guideline-pdf-2306487277 (accessed on 5 December 2020).
  24. Taylor, S.A.; Mallett, S.; Ball, S.; Beare, S.; Bhatnagar, G.; Bhowmik, A.; Boavida, P.; Bridgewater, J.; Clarke, C.S.; Duggan, M.; et al. Diagnostic accuracy of whole-body MRI versus standard imaging pathways for metastatic disease in newly diagnosed non-small-cell lung cancer: The prospective Streamline L trial. Lancet Respir. Med. 2019, 7, 523–532. [Google Scholar] [CrossRef] [Green Version]
  25. Obara, P.; Loening, A.M.; Taviani, V.; Iagaru, A.; Hargreaves, B.A.; Vasanawala, S.S. Relative value of three whole-body MR approaches for PET-MR, including gadofosveset-enhanced MR, in comparison to PET-CT. Clin. Imaging 2018, 48, 62–68. [Google Scholar] [CrossRef] [PubMed]
  26. Punwani, S.; Taylor, S.A.; Saad, Z.Z.; Bainbridge, A.; Groves, A.; Daw, S.; Shankar, A.; Halligan, S.; Humphries, P.D. Diffusion-weighted MRI of lymphoma: Prognostic utility and implications for PET/MRI? Eur. J. Nucl. Med. Mol. Imaging 2013, 40, 373–385. [Google Scholar] [CrossRef] [PubMed]
  27. Punwani, S.; Prakash, V.; Bainbridge, A.; Taylor, S.A.; Bandula, S.; Olsen, O.E.; Hain, S.F.; Shankar, A.; Daw, S.; Humphries, P. Quantitative diffusion weighted MRI: A functional biomarker of nodal disease in Hodgkin lymphoma? Cancer Biomarkers 2011, 7, 249–259. [Google Scholar] [CrossRef]
  28. Lin, C.; Itti, E.; Luciani, A.; Zegai, B.; Lin, S.-J.; Kuhnowski, F.; Pigneur, F.; Gaillard, I.; Paone, G.; Meignan, M.; et al. Whole-Body Diffusion-Weighted Imaging with Apparent Diffusion Coefficient Mapping for Treatment Response Assessment in Patients With Diffuse Large B-Cell Lymphoma. Investig. Radiol. 2011, 46, 341–349. [Google Scholar] [CrossRef]
  29. Mayerhoefer, M.E.; Karanikas, G.; Kletter, K.; Prosch, H.; Kiesewetter, B.; Skrabs, C.; Porpaczy, E.; Weber, M.; Knogler, T.; Sillaber, C.; et al. Evaluation of Diffusion-Weighted Magnetic Resonance Imaging for Follow-up and Treatment Response Assessment of Lymphoma: Results of an 18F-FDG-PET/CT–Controlled Prospective Study in 64 Patients. Clin. Cancer Res. 2015, 21, 2506–2513. [Google Scholar] [CrossRef] [Green Version]
Figure 1. Study flowchart.
Jpm 10 00284 g001
Figure 2. Anatomical boundary descriptive error. Images of a 31-year-old female patient with Ann Arbor stage II Hodgkin’s lymphoma. Patient had bulky mediastinal disease (not shown here) and right-sided supraclavicular nodal involvement. (a) T2-TSE, (b) contrast-enhanced water-only mDixon and (c) fused 18F-FDG PET-CT. The right supraclavicular node (arrows) is shown on a, b and c but was considered as supraclavicular on WB-MRI and deep cervical on 18F-FDG PET-CT. Following consensus read, the nodal station discrepancy was considered as anatomical boundary descriptive error.
Jpm 10 00284 g002
Figure 3. Images of a 24-year-old female patient with Hodgkin’s lymphoma highlighting extra-nodal perceptual error on 18F-FDG PET-CT. Splenic involvement was considered positive on WB-MRI and negative on 18F-FDG PET-CT. Following the consensus review, the panel corrected the disease site to be positive on 18F-FDG PET-CT and subsequently, the enhanced reference standard was positive for splenic involvement. (a) T2-TSE, (b) DWI b1000, (c) ADC map, (d) 18F-FDG PET, (e) DCE spleen: early-arterial phase, (f) DCE spleen: mid- arterial phase, (g,h) DCE spleen: late-arterial phase. Arrows showing a focal lesion in spleen.
Jpm 10 00284 g003
Figure 4. Images of 46-year-old male patient with Hodgkin’s lymphoma highlighting a false negative technical error on WB-MRI. A sub-centimeter FDG avid (SUVmax 5.1) retrocrural lymph node that was considered negative nodal site on WB-MRI. The positive nodal station is shown (arrows) on (a) T2-TSE, (b) DWI b1000 and (c) Contrast-enhanced in-phase mDixon WB-MRI images and (d) CT scan, (e) fused 18F-FDG PET-CT and (f) 18F-FDG PET images.
Jpm 10 00284 g004
Figure 5. Images of a 22-year-old female patient with stage II Hodgkin’s lymphoma. Patient had left supraclavicular nodal disease (not shown here) and mediastinal disease. (a) Fused 18F-FDG PET-CT DWI b1000 (b) T2-TSE and (c) contrast-enhanced water-only mDixon showing the mediastinal disease (arrows). Mediastinal disease was not evident in (d) DWI b1000 and (e) pre-contrast in-phase mDixon resulting in under-staging of disease.
Jpm 10 00284 g005
Table 1. Whole-body MRI sequence parameters.
T2-TSEmDixon
(Pre and Post-Contrast #)
DWI
(b0, 100, 300, 1000)
DCE
(Liver and Spleen)
Post-Contrast Lung
Imaging PlaneTransverseCoronalTransverseTransverseTransverse
TE (ms)801.02/1.8711.02/1.81.02/1.8
TR (ms)12283.063713.03.0
FOV (mm*mm)500*300502*300500*306512*512512*512
Voxel Size (mm*mm)1*12.1*2.14*4.21.2*1.21.2*1.2
Number of Slices40120408068
Slice Thickness (mm)55556
Acquisition Matrix500*286144*238124*72256*254336*332
ETL9123922
Acceleration Factor (SENSE)222.52.82.8
Pixel Bandwidth (Hz)53719923369189042055
Acquisition Time per Station (s)47171521717
Number of Stations64612
T2-TSE: T2-weighted turbo spin echo, mDixon: modified Dixon, DWI: diffusion weighted imaging, DCE: dynamic contrast enhanced, TE: time of echo, TR: time of repetition, FOV: field of view, ETL: echo train length, SENSE: sensitivity encoding. # Contrast agent 20 mL intravenous gadoterate meglumine, Dotarem, Guerbet, France.
Table 2. Patients’ demographics.
Patient Characteristic (N = 22)Number or Median (Range)
Age32 (22–87)
SexMale/Female: 12/10
Overall stage
I7
II8
III2
IV5
Subtype
HL14
DLBCL8
Chemotherapy regimen
ABVD10
RCHOP8
ABVD-BEACOPP3
Rituximab1
HL: Hodgkin’s lymphoma; DLBCL: diffuse large B-cell lymphoma; ABVD: adriamycin, bleomycin, vinblastine, dacarbazine; RCHOP: rituximab, cyclophosphamide, doxorubicin, vincristine, prednisolone; BEACOPP: bleomycin, etoposide, doxorubicin, cyclophosphamide, vincristine, procarbazine, prednisone.
Table 3. Comparison of different MRI sequences as part of the WB-MRI protocol for nodal and extra-nodal disease evaluation for reader 1.
Analyses (Reader 1)Agreement RateTPRFPRKappa (95% CI)
WB-MRI DWI+IP
Nodal Sites92% (360/390)60% (31/52) <1% (9/338)0.63 (0.51–0.75)
Extra-nodal sites97% (237/243)44% (4/9) <1% (1/234)0.56 (0.25–0.87)
WB-MRI T2-TSE
Nodal Sites94% (367/390)66% (34/52) <1% (5/338)0.71 (0.60–0.82)
Extra-nodal sites98% (239/243)67% (6/9) <1% (1/234)0.74 (0.50–0.98)
WB-MRI Post-C
Nodal Sites96% (373/390)77% (40/52) <1% (5/338)0.80 (0.71–0.89)
Extra-nodal sites96% (233/243)67% (6/9) <1% (7/234)0.52 (0.27–0.78)
WB-MRI All
Nodal Sites95% (371/390)67% (35/52) <1% (2/338)0.76 (0.66-0.86)
Extra-nodal sites>99% (241/243)89% (8/9) <1% (1/234)0.88 (0.73–1.00)
WB-MRI: whole-body magnetic resonance imaging; DWI+IP: whole-body diffusion weighted imaging + pre-contrast in-phase mDixon; Post-C: whole-body post-contrast water only mDixon + dynamic contrast enhanced liver and spleen + contrast enhanced lung; T2-TSE: whole-body T2-weighted turbo spin echo; All: whole-body MRI with all available sequences; TPR: true positive rate; FPR: false positive rate; CI: confidence interval.
Table 4. Comparison of different MRI sequences as part of the WB-MRI protocol for nodal and extra-nodal disease evaluation for reader 2.
Analyses (Reader 2)Agreement RateTPRFPRKappa (95% CI)
WB-MRI DWI+IP
Nodal Sites95% (369/390)73% (38/52) <1% (7/338)0.75 (0.65–0.85)
Extra-nodal sites97% (237/243)44% (4/9)<1% (1/234)0.56 (0.25–0.87)
WB-MRI T2-TSE
Nodal Sites96% (374/390)75% (39/52)<1% (3/338)0.81 (0.71–0.90)
Extra-nodal sites>99% (241/243)89% (8/9)<1% (1/234)0.88 (0.73–1.00)
WB-MRI Post-C
Nodal Sites96% (374/390)85% (44/52)<1% (8/338)0.82 (0.74–0.91)
Extra-nodal sites99% (240/243)78% (7/9) <1% (7/234)0.59 (0.35–0.83)
WB-MRI All
Nodal Sites97% (378/390)83% (43/52)<1% (3/338)0.86 (0.78 to 0.94)
Extra-nodal sites>99% (242/243)89% (8/9) 0% (0/234)0.94 (0.82 to 1.00)
WB-MRI: whole-body magnetic resonance imaging; DWI+IP: whole-body diffusion weighted imaging + pre-contrast in-phase mDixon; Post-C: whole-body post-contrast water only mDixon + dynamic contrast enhanced liver and spleen + contrast enhanced lung; T2-TSE: whole-body T2-weighted turbo spin echo; All: whole-body MRI with all available sequences; TPR: true positive rate; FPR: false positive rate; CI: confidence interval.
Table 5. Comparison of different MRI sequences as part of the WB-MRI protocol for nodal and extra-nodal disease evaluation for the consensus read.
Analyses (Consensus)Agreement RateTPRFPRKappa (95% CI)
WB-MRI DWI+IP
Nodal Sites95% (372/390)75% (39/52)<1% (5/338)0.79 (0.69–0.88)
Extra-nodal sites97% (240/243)67% (6/9) 0% (0/234)0.79 (0.57–1.00)
WB-MRI T2-TSE
Nodal Sites97% (377/390)83% (43/52)<1% (4/338)0.85 (0.77–0.93)
Extra-nodal sites>99% (242/243)89% (8/9) 0% (0/234)0.93 (0.82–1.00)
WB-MRI Post-C
Nodal Sites96% (373/390)77% (40/52)<1% (5/338)0.80 (0.71–0.89)
Extra-nodal sites>99% (242/243)89% (8/9)0% (0/234)0.94 (0.82–1.00)
WB-MRI All
Nodal Sites98% (383/390)87% (45/52)0% (0/338)0.92 (0.86–0.98)
Extra-nodal sites100% (243/243)100% (9/9) 0% (0/234)1.00 (1.00–1.00)
WB-MRI: whole-body magnetic resonance imaging; DWI+IP: whole-body diffusion weighted imaging + pre-contrast in-phase mDixon; Post-C: whole-body post-contrast water only mDixon + dynamic contrast enhanced liver and spleen + contrast enhanced lung; T2-TSE: whole-body T2-weighted turbo spin echo; All: whole-body MRI with all available sequences; TPR: true positive rate; FPR: false positive rate; CI: confidence interval.
Table 6. Comparison of different MRI sequences as part of the WB-MRI protocol for nodal and extra-nodal disease evaluation for the consensus read following correction of the anatomical boundaries discrepancies and WB-MRI perceptual errors.
Analyses
(Consensus/Post Correction)
Agreement RateTPRFPRKappa (95% CI)
WB-MRI DWI+IP
Nodal Sites97% (380/390)81% (42/52)0% (0/338)0.88 (0.81–0.95)
Extra-nodal sites>99% (241/243)78% (7/9)0% (0/234)0.87 (0.69–1.00)
WB-MRI T2-TSE
Nodal Sites98% (383/390)87% (45/52)0% (0/338)0.92 (0.86–0.98)
Extra-nodal sites>99% (242/243)89% (8/9)0% (0/234)0.93 (0.82–1.00)
WB-MRI Post-C
Nodal Sites98% (383/390)87% (45/52)0% (0/338)0.92 (0.86–0.98)
Extra-nodal sites100% (243/243)100% (9/9)0% (0/234)0.94 (0.84–0.97)
WB-MRI All
Nodal Sites98% (383/390)87% (45/52)0% (0/338)0.92 (0.86–0.98)
Extra-nodal sites100% (243/243)100% (9/9)0% (0/234)1.00 (1.00–1.00)
WB-MRI: whole-body magnetic resonance imaging; DWI+IP: whole-body diffusion weighted imaging + pre-contrast in-phase mDixon; Post-C: whole-body post-contrast water only mDixon + dynamic contrast enhanced liver and spleen + contrast enhanced lung; T2-TSE: whole-body T2-weighted turbo spin echo; All: whole-body MRI with all available sequences; TPR: true positive rate; FPR: false positive rate; CI: confidence interval.
Table 7. Evaluation of different MRI sequences as part of the WB-MRI protocol for overall staging compared to enhanced reference standard staging. Weighted kappa agreement and 95% confidence interval are shown.
WB-MRI
DWI+IPPost-CT2-TSEAll
Reader 10.55 (0.30–0.80)0.69 (0.46–0.93)0.69 (0.46–0.91)0.88 (0.72–0.97)
Reader 20.62 (0.37–0.87)0.76 (0.53–0.98)0.88 (0.71–1.00)0.88 (0.71–1.00)
Consensus 0.75 (0.52–0.97)0.94 (0.82–1.00)0.94 (0.82–1.00)1.00 (1.00–1.00)
Post-correction0.81 (0.61–1.00)1.00 (1.00–1.00)0.94 (0.82–1.00)1.00 (1.00–1.00)
WB-MRI: whole-body magnetic resonance imaging; DWI+IP: whole-body diffusion weighted imaging + pre-contrast in-phase mDixon; Post-C: whole-body post-contrast water only mDixon + dynamic contrast enhanced liver and spleen + contrast enhanced lung; T2-TSE: whole-body T2-weighted turbo spin echo; All: whole-body MRI with all available sequences; 95% CI: 95% confidence interval
Publisher’s Note: MDPI stays neutral with regard to jurisdictional claims in published maps and institutional affiliations.

