Bioinformatics Data Mining Repurposes the JAK2 (Janus Kinase 2) Inhibitor Fedratinib for Treating Pancreatic Ductal Adenocarcinoma by Reversing the KRAS (Kirsten Rat Sarcoma 2 Viral Oncogene Homolog)-Driven Gene Signature


Abstract
1. Introduction
2. Materials and Methods
2.1. Preparation of the Differentially Expressed Genes
2.2. Pathway Enrichment and Gene Set Enrichment Analysis
2.3. Cancer Genomics Analysis via the cBioPortal Website
2.4. Connectivity Map Analysis
2.5. Drug Sensitivity Profiling in Pancreatic Ductal Adenocarcinoma Cell Lines
3. Results
3.1. Identification of a Common Gene Signature in Human Pancreatic Ductal Adenocarcinoma
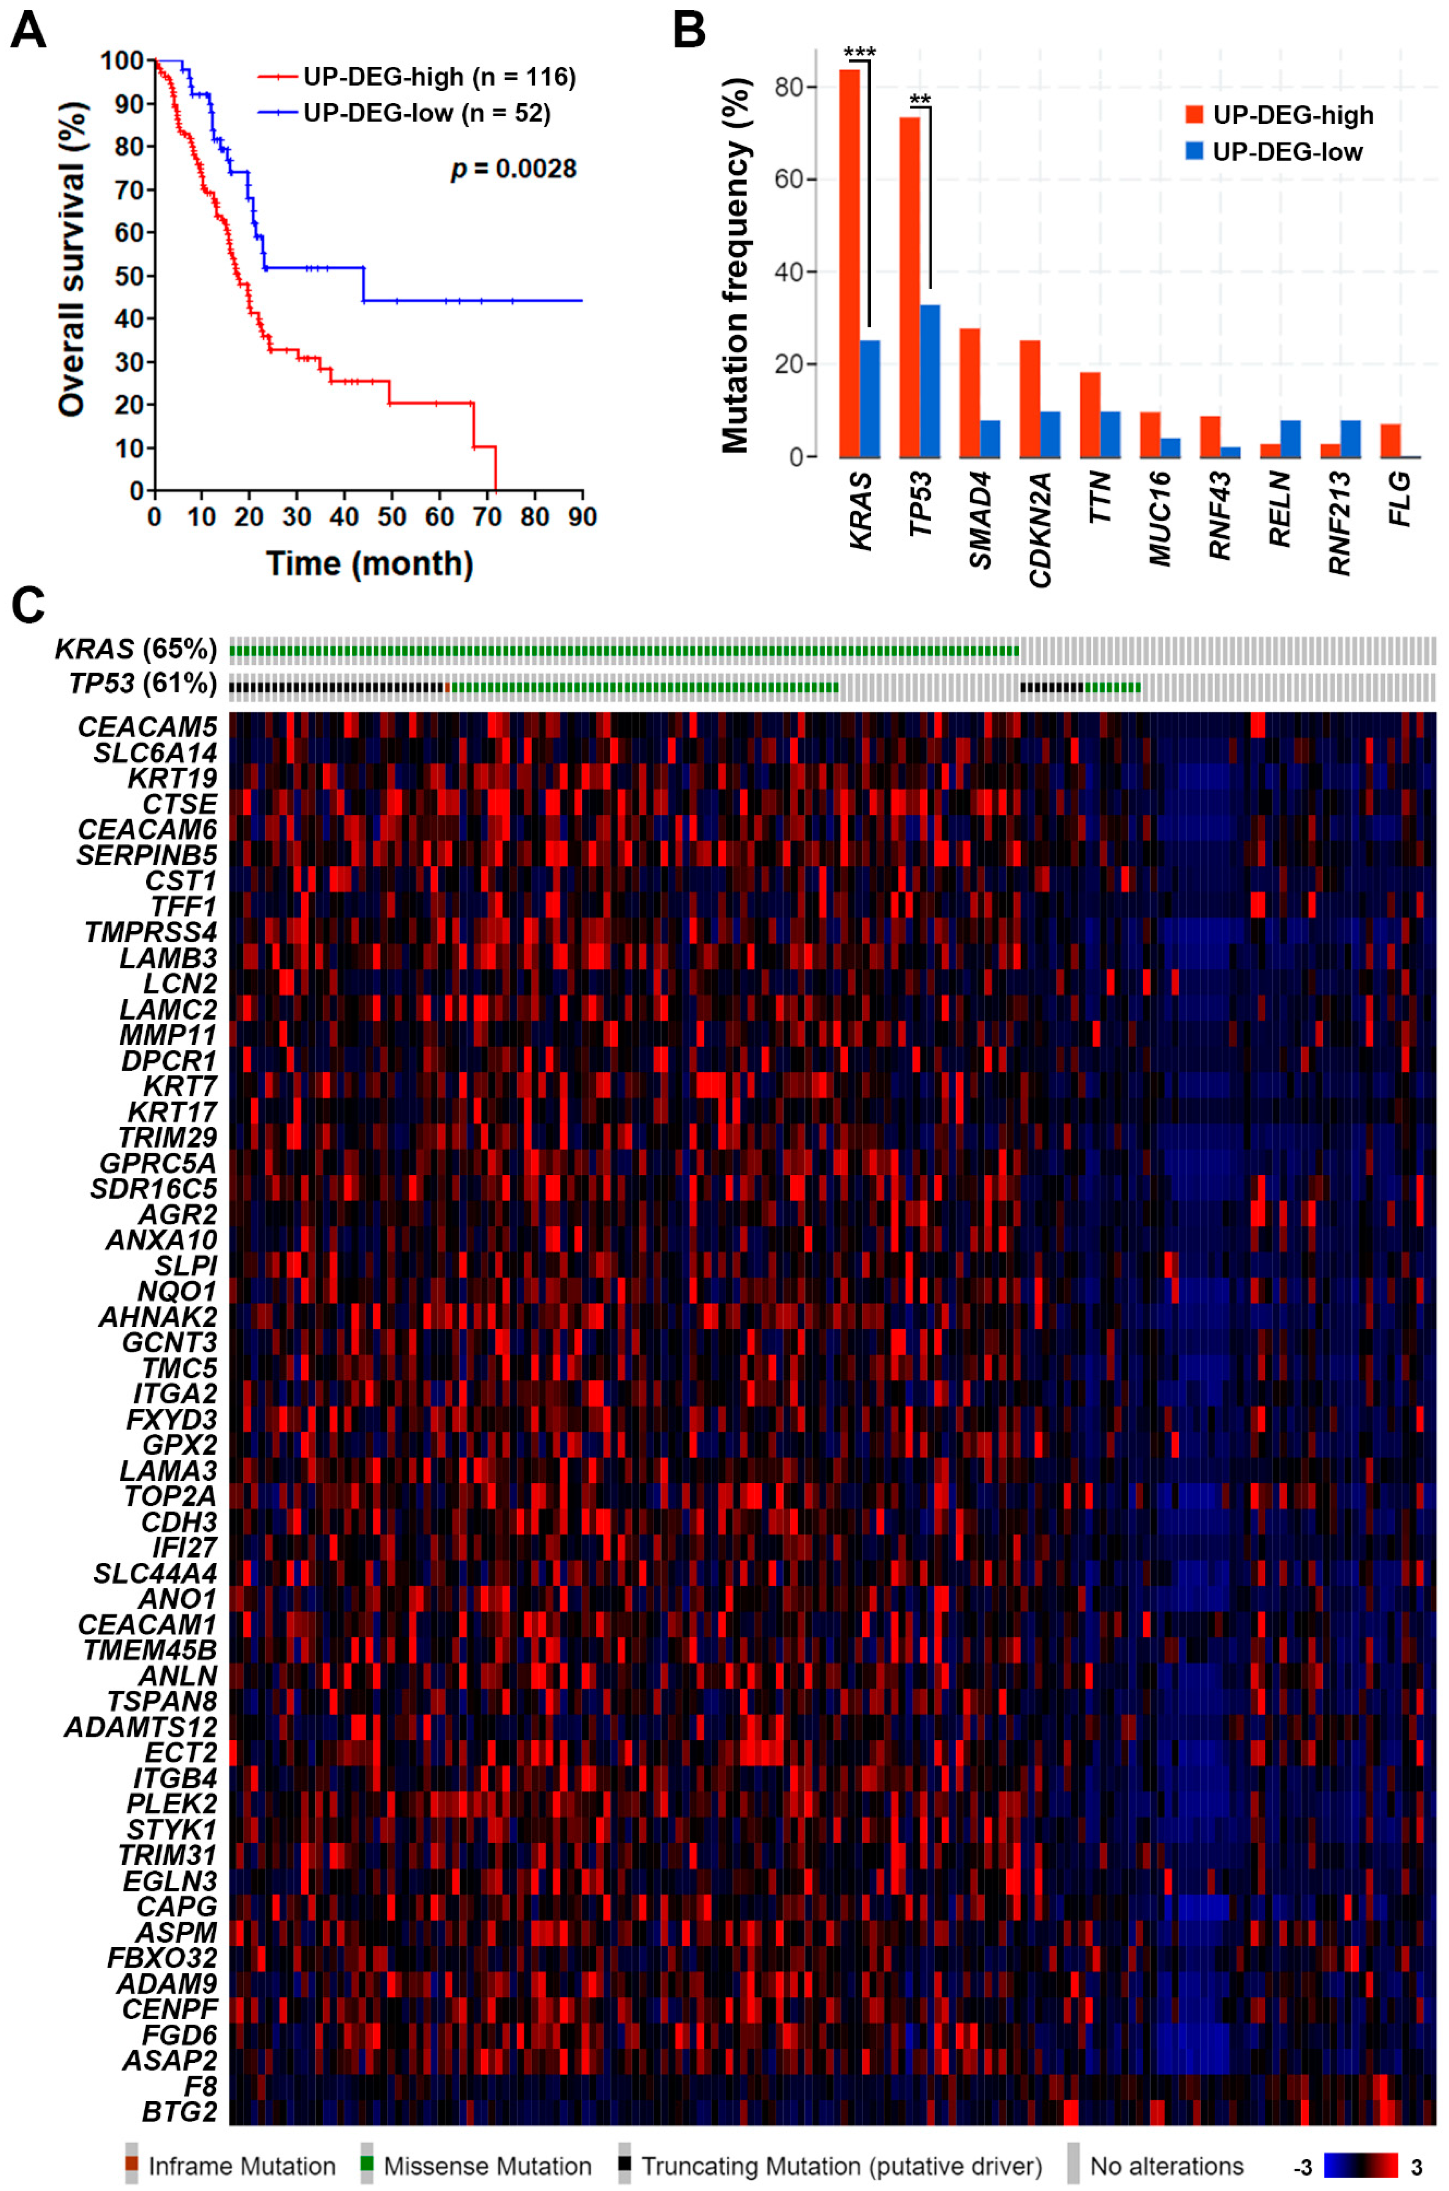
3.2. The Pancreatic Ductal Adenocarcinoma Gene Signature Was Associated with KRAS and TP53 Gene Mutations
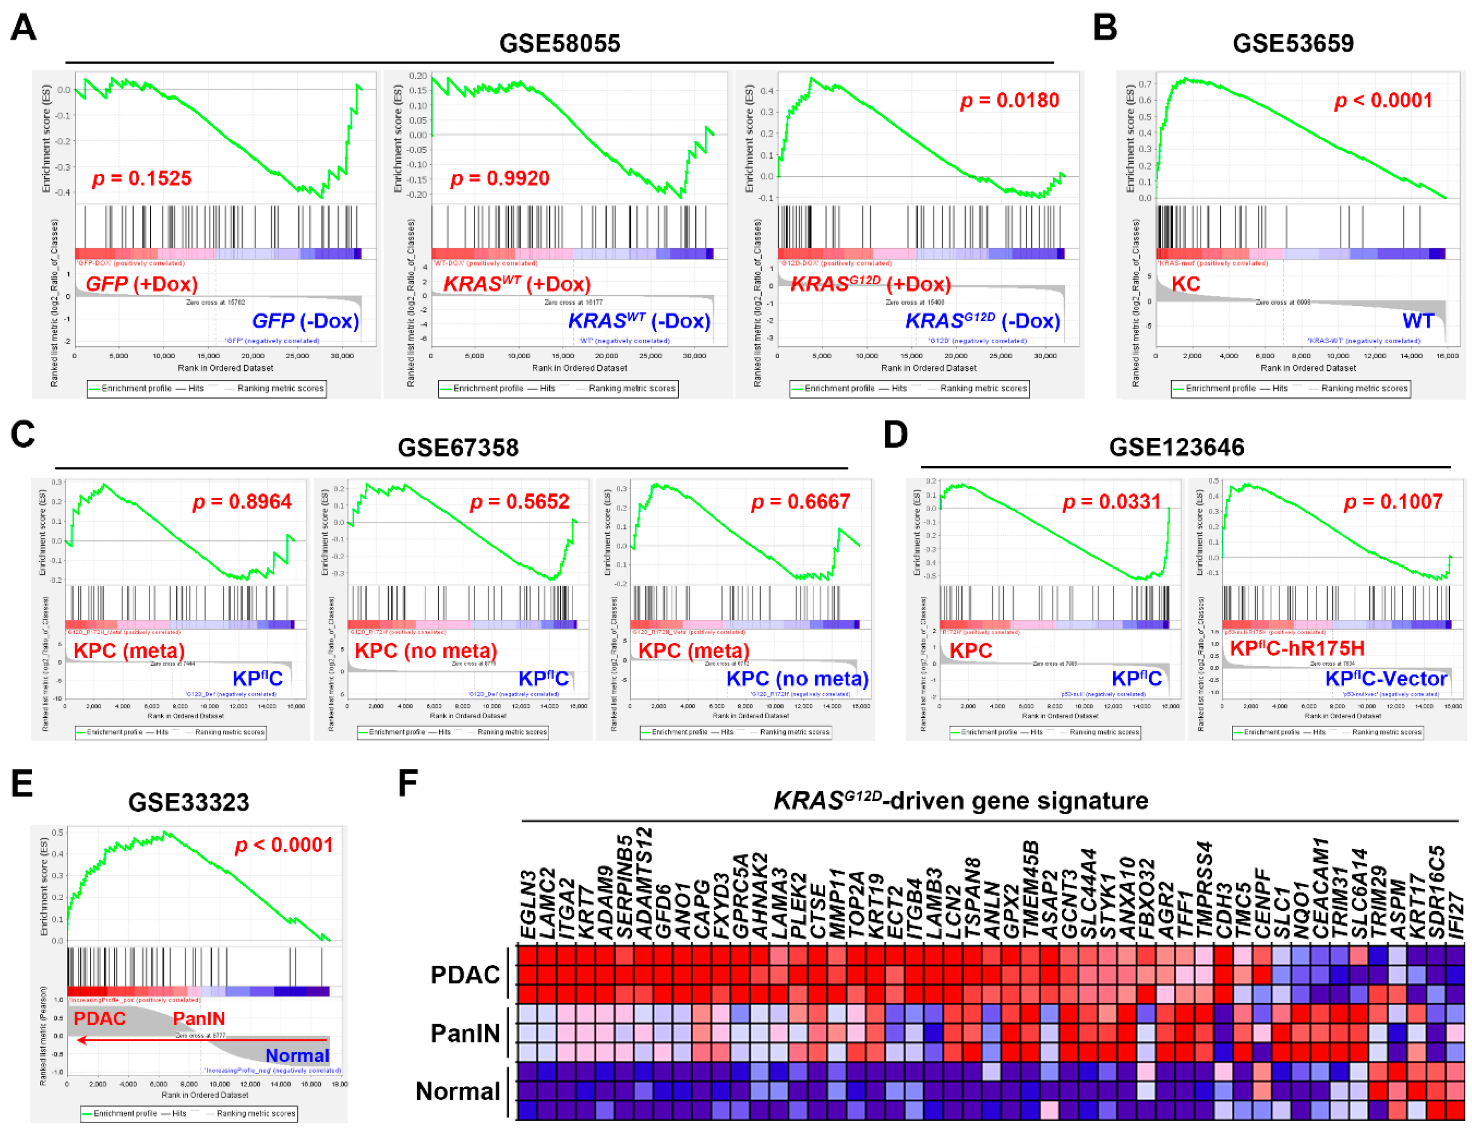
3.3. Gene Set Enrichment Analysis Revealed That the Pancreatic Ductal Adenocarcinoma Gene Signature Was Driven by KRAS Gene Mutation
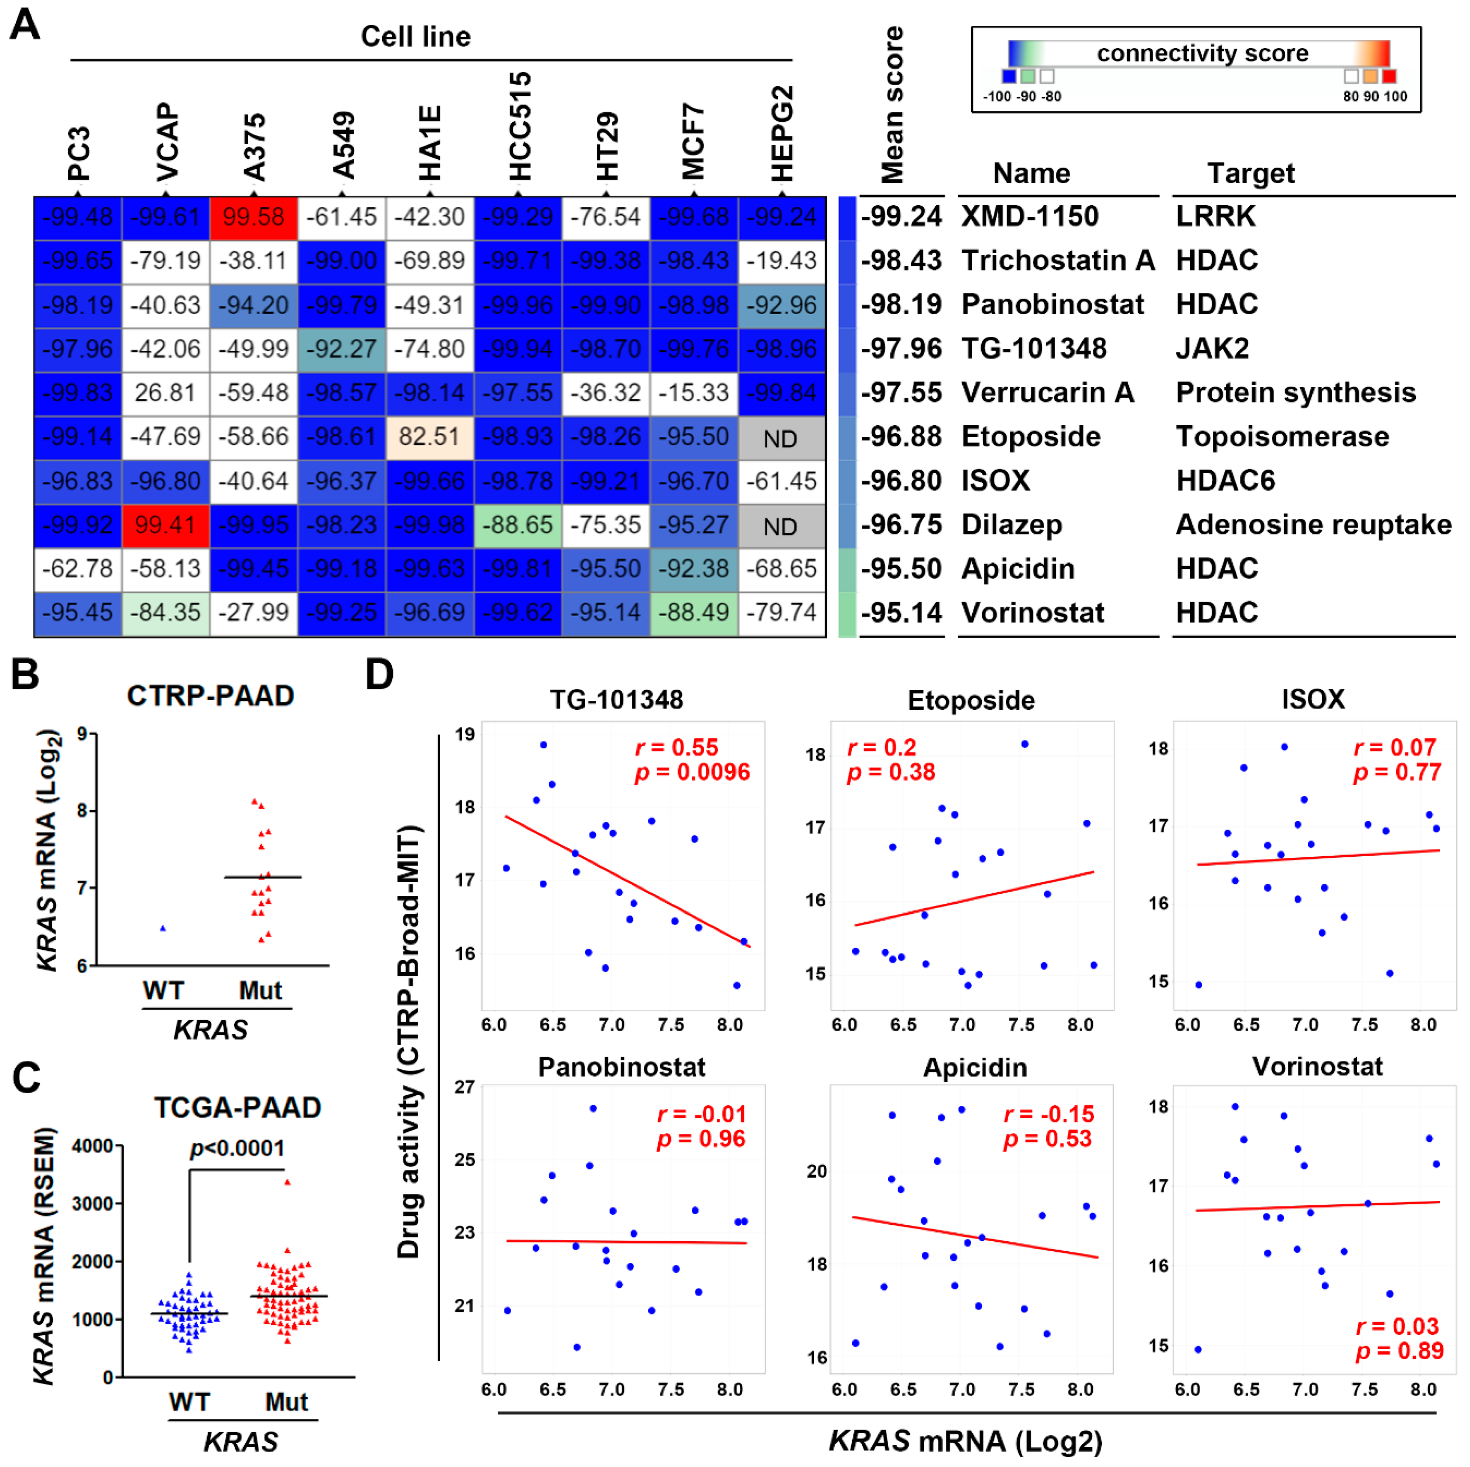
3.4. Connectivity Map Analysis and Drug Sensitivity Profiling Identify TG-101348 (Fedratinib) as a Potential Drug Reversing KRAS-Driven Pancreatic Ductal Adenocarcinoma Gene Signature
4. Discussion
5. Conclusions
Supplementary Materials
Author Contributions
Funding
Acknowledgments
Conflicts of Interest
References
- Ryan, D.P.; Hong, T.S.; Bardeesy, N. Pancreatic adenocarcinoma. N. Engl. J. Med. 2014, 371, 1039–1049. [Google Scholar] [CrossRef] [PubMed]
- Siegel, R.L.; Miller, K.D.; Jemal, A. Cancer statistics, 2020. CA Cancer J. Clin. 2020, 70, 7–30. [Google Scholar] [CrossRef] [PubMed]
- Kamisawa, T.; Wood, L.D.; Itoi, T.; Takaori, K. Pancreatic cancer. Lancet 2016, 388, 73–85. [Google Scholar] [CrossRef]
- Manji, G.A.; Olive, K.P.; Saenger, Y.M.; Oberstein, P. Current and Emerging Therapies in Metastatic Pancreatic Cancer. Clin. Cancer Res. 2017, 23, 1670–1678. [Google Scholar] [CrossRef] [PubMed]
- Binenbaum, Y.; Na’ara, S.; Gil, Z. Gemcitabine resistance in pancreatic ductal adenocarcinoma. Drug Resist. Updates 2015, 23, 55–68. [Google Scholar] [CrossRef]
- Storz, P.; Crawford, H.C. Carcinogenesis of Pancreatic Ductal Adenocarcinoma. Gastroenterology 2020, 158, 2072–2081. [Google Scholar] [CrossRef]
- Raphael, B.J.; Hruban, R.H.; Aguirre, A.J.; Moffitt, R.A.; Yeh, J.J.; Stewart, C.; Robertson, A.G.; Cherniack, A.D.; Gupta, M.; Getz, G.; et al. Integrated Genomic Characterization of Pancreatic Ductal Adenocarcinoma. Cancer Cell 2017, 32, 185–203.e13. [Google Scholar] [CrossRef]
- Moore, A.R.; Rosenberg, S.C.; McCormick, F.; Malek, S. RAS-targeted therapies: Is the undruggable drugged? Nat. Rev. Drug Discov. 2020, 19, 533–552. [Google Scholar] [CrossRef]
- Canon, J.; Rex, K.; Saiki, A.Y.; Mohr, C.; Cooke, K.; Bagal, D.; Gaida, K.; Holt, T.; Knutson, C.G.; Koppada, N.; et al. The clinical KRAS(G12C) inhibitor AMG 510 drives anti-tumour immunity. Nature 2019, 575, 217–223. [Google Scholar] [CrossRef]
- Hallin, J.; Engstrom, L.D.; Hargis, L.; Calinisan, A.; Aranda, R.; Briere, D.M.; Sudhakar, N.; Bowcut, V.; Baer, B.R.; Ballard, J.A.; et al. The KRASG12C Inhibitor MRTX849 Provides Insight toward Therapeutic Susceptibility of KRAS-Mutant Cancers in Mouse Models and Patients. Cancer Discov. 2020, 10, 54–71. [Google Scholar] [CrossRef]
- Amgen. Amgen Announces New Clinical Data Evaluating Novel Investigational KRAS(G12C) Inhibitor in Larger Patient Group at WCLC 2019. Available online: https://www.amgen.com/media/news-releases/2019/09/amgen-announces-new-clinical-data-evaluating-novel-investigational-krasg12c-inhibitor-in-larger-patient-group-at-wclc-2019/ (accessed on 16 June 2020).
- Badea, L.; Herlea, V.; Dima, S.O.; Dumitrascu, T.; Popescu, I. Combined gene expression analysis of whole-tissue and microdissected pancreatic ductal adenocarcinoma identifies genes specifically overexpressed in tumor epithelia. Hepatogastroenterology 2008, 55, 2016–2027. [Google Scholar] [PubMed]
- Idichi, T.; Seki, N.; Kurahara, H.; Yonemori, K.; Osako, Y.; Arai, T.; Okato, A.; Kita, Y.; Arigami, T.; Mataki, Y.; et al. Regulation of actin-binding protein ANLN by antitumor miR-217 inhibits cancer cell aggressiveness in pancreatic ductal adenocarcinoma. Oncotarget 2017, 8, 53180–53193. [Google Scholar] [CrossRef] [PubMed]
- Ellsworth, K.A.; Eckloff, B.W.; Li, L.; Moon, I.; Fridley, B.L.; Jenkins, G.D.; Carlson, E.; Brisbin, A.; Abo, R.; Bamlet, W.; et al. Contribution of FKBP5 genetic variation to gemcitabine treatment and survival in pancreatic adenocarcinoma. PLoS ONE 2013, 8, e70216. [Google Scholar] [CrossRef] [PubMed]
- Li, L.; Zhang, J.-W.; Jenkins, G.; Xie, F.; Carlson, E.E.; Fridley, B.L.; Bamlet, W.R.; Petersen, G.M.; McWilliams, R.R.; Wang, L. Genetic variations associated with gemcitabine treatment outcome in pancreatic cancer. Pharm. Genom. 2016, 26, 527–537. [Google Scholar] [CrossRef]
- Pei, H.; Li, L.; Fridley, B.L.; Jenkins, G.D.; Kalari, K.R.; Lingle, W.; Petersen, G.; Lou, Z.; Wang, L. FKBP51 affects cancer cell response to chemotherapy by negatively regulating Akt. Cancer Cell 2009, 16, 259–266. [Google Scholar] [CrossRef]
- Donahue, T.R.; Tran, L.M.; Hill, R.; Li, Y.; Kovochich, A.; Calvopina, J.H.; Patel, S.G.; Wu, N.; Hindoyan, A.; Farrell, J.J.; et al. Integrative survival-based molecular profiling of human pancreatic cancer. Clin. Cancer Res. 2012, 18, 1352–1363. [Google Scholar] [CrossRef]
- Toste, P.A.; Li, L.; Kadera, B.E.; Nguyen, A.H.; Tran, L.M.; Wu, N.; Madnick, D.L.; Patel, S.G.; Dawson, D.W.; Donahue, T.R. p85alpha is a microRNA target and affects chemosensitivity in pancreatic cancer. J. Surg. Res. 2015, 196, 285–293. [Google Scholar] [CrossRef]
- Yang, S.; He, P.; Wang, J.; Schetter, A.; Tang, W.; Funamizu, N.; Yanaga, K.; Uwagawa, T.; Satoskar, A.R.; Gaedcke, J.; et al. A Novel MIF Signaling Pathway Drives the Malignant Character of Pancreatic Cancer by Targeting NR3C2. Cancer Res. 2016, 76, 3838–3850. [Google Scholar] [CrossRef]
- Klett, H.; Fuellgraf, H.; Levit-Zerdoun, E.; Hussung, S.; Kowar, S.; Kusters, S.; Bronsert, P.; Werner, M.; Wittel, U.; Fritsch, R.; et al. Identification and Validation of a Diagnostic and Prognostic Multi-Gene Biomarker Panel for Pancreatic Ductal Adenocarcinoma. Front. Genet. 2018, 9, 108. [Google Scholar] [CrossRef]
- Barrett, T.; Wilhite, S.E.; Ledoux, P.; Evangelista, C.; Kim, I.F.; Tomashevsky, M.; Marshall, K.A.; Phillippy, K.H.; Sherman, P.M.; Holko, M.; et al. NCBI GEO: Archive for functional genomics data sets–update. Nucleic. Acids Res. 2013, 41, D991–D995. [Google Scholar] [CrossRef]
- Heberle, H.; Meirelles, G.V.; da Silva, F.R.; Telles, G.P.; Minghim, R. InteractiVenn: A web-based tool for the analysis of sets through Venn diagrams. BMC Bioinform. 2015, 16, 169. [Google Scholar] [CrossRef] [PubMed]
- Liao, Y.; Wang, J.; Jaehnig, E.J.; Shi, Z.; Zhang, B. WebGestalt 2019: Gene set analysis toolkit with revamped UIs and APIs. Nucleic Acids Res. 2019, 47, W199–W205. [Google Scholar] [CrossRef] [PubMed]
- Szklarczyk, D.; Gable, A.L.; Lyon, D.; Junge, A.; Wyder, S.; Huerta-Cepas, J.; Simonovic, M.; Doncheva, N.T.; Morris, J.H.; Bork, P.; et al. STRING v11: Protein-protein association networks with increased coverage, supporting functional discovery in genome-wide experimental datasets. Nucleic Acids Res. 2019, 47, D607–D613. [Google Scholar] [CrossRef] [PubMed]
- Ashburner, M.; Ball, C.A.; Blake, J.A.; Botstein, D.; Butler, H.; Cherry, J.M.; Davis, A.P.; Dolinski, K.; Dwight, S.S.; Eppig, J.T.; et al. Gene ontology: Tool for the unification of biology. The Gene Ontology Consortium. Nat. Genet. 2000, 25, 25–29. [Google Scholar] [CrossRef] [PubMed]
- The Gene Ontology Consortium. The Gene Ontology Resource: 20 years and still GOing strong. Nucleic Acids Res. 2019, 47, D330–D338. [Google Scholar] [CrossRef]
- Kanehisa, M.; Goto, S. KEGG: Kyoto encyclopedia of genes and genomes. Nucleic Acids Res. 2000, 28, 27–30. [Google Scholar] [CrossRef]
- Liberzon, A.; Birger, C.; Thorvaldsdottir, H.; Ghandi, M.; Mesirov, J.P.; Tamayo, P. The Molecular Signatures Database (MSigDB) hallmark gene set collection. Cell Syst. 2015, 1, 417–425. [Google Scholar] [CrossRef]
- Ling, J.; Kang, Y.a.; Zhao, R.; Xia, Q.; Lee, D.-F.; Chang, Z.; Li, J.; Peng, B.; Fleming, J.B.; Wang, H.; et al. KrasG12D-induced IKK2/beta/NF-kappaB activation by IL-1alpha and p62 feedforward loops is required for development of pancreatic ductal adenocarcinoma. Cancer Cell 2012, 21, 105–120. [Google Scholar] [CrossRef]
- Tsang, Y.H.; Dogruluk, T.; Tedeschi, P.M.; Wardwell-Ozgo, J.; Lu, H.; Espitia, M.; Nair, N.; Minelli, R.; Chong, Z.; Chen, F.; et al. Functional annotation of rare gene aberration drivers of pancreatic cancer. Nat. Commun. 2016, 7, 10500. [Google Scholar] [CrossRef]
- Stellas, D.; Szabolcs, M.; Koul, S.; Li, Z.; Polyzos, A.; Anagnostopoulos, C.; Cournia, Z.; Tamvakopoulos, C.; Klinakis, A.; Efstratiadis, A. Therapeutic effects of an anti-Myc drug on mouse pancreatic cancer. J. Natl. Cancer Inst. 2014, 106. [Google Scholar] [CrossRef]
- Miller, B.W.; Morton, J.P.; Pinese, M.; Saturno, G.; Jamieson, N.B.; McGhee, E.; Timpson, P.; Leach, J.; McGarry, L.; Shanks, E.; et al. Targeting the LOX/hypoxia axis reverses many of the features that make pancreatic cancer deadly: Inhibition of LOX abrogates metastasis and enhances drug efficacy. EMBO Mol. Med. 2015, 7, 1063–1076. [Google Scholar] [CrossRef] [PubMed]
- Vennin, C.; Melenec, P.; Rouet, R.; Nobis, M.; Cazet, A.S.; Murphy, K.J.; Herrmann, D.; Reed, D.A.; Lucas, M.C.; Warren, S.C.; et al. CAF hierarchy driven by pancreatic cancer cell p53-status creates a pro-metastatic and chemoresistant environment via perlecan. Nat. Commun. 2019, 10, 3637. [Google Scholar] [CrossRef] [PubMed]
- Mootha, V.K.; Lindgren, C.M.; Eriksson, K.F.; Subramanian, A.; Sihag, S.; Lehar, J.; Puigserver, P.; Carlsson, E.; Ridderstrale, M.; Laurila, E.; et al. PGC-1alpha-responsive genes involved in oxidative phosphorylation are coordinately downregulated in human diabetes. Nat. Genet. 2003, 34, 267–273. [Google Scholar] [CrossRef] [PubMed]
- Subramanian, A.; Tamayo, P.; Mootha, V.K.; Mukherjee, S.; Ebert, B.L.; Gillette, M.A.; Paulovich, A.; Pomeroy, S.L.; Golub, T.R.; Lander, E.S.; et al. Gene set enrichment analysis: A knowledge-based approach for interpreting genome-wide expression profiles. Proc. Natl. Acad. Sci. USA 2005, 102, 15545–15550. [Google Scholar] [CrossRef]
- Cerami, E.; Gao, J.; Dogrusoz, U.; Gross, B.E.; Sumer, S.O.; Aksoy, B.A.; Jacobsen, A.; Byrne, C.J.; Heuer, M.L.; Larsson, E.; et al. The cBio cancer genomics portal: An open platform for exploring multidimensional cancer genomics data. Cancer Discov. 2012, 2, 401–404. [Google Scholar] [CrossRef]
- Gao, J.; Aksoy, B.A.; Dogrusoz, U.; Dresdner, G.; Gross, B.; Sumer, S.O.; Sun, Y.; Jacobsen, A.; Sinha, R.; Larsson, E.; et al. Integrative analysis of complex cancer genomics and clinical profiles using the cBioPortal. Sci. Signal 2013, 6, pl1. [Google Scholar] [CrossRef]
- Subramanian, A.; Narayan, R.; Corsello, S.M.; Peck, D.D.; Natoli, T.E.; Lu, X.; Gould, J.; Davis, J.F.; Tubelli, A.A.; Asiedu, J.K.; et al. A Next Generation Connectivity Map: L1000 Platform and the First 1,000,000 Profiles. Cell 2017, 171, 1437–1452.e1417. [Google Scholar] [CrossRef]
- Lamb, J. The Connectivity Map: A new tool for biomedical research. Nat. Rev. Cancer 2007, 7, 54–60. [Google Scholar] [CrossRef]
- Lamb, J.; Crawford, E.D.; Peck, D.; Modell, J.W.; Blat, I.C.; Wrobel, M.J.; Lerner, J.; Brunet, J.-P.; Subramanian, A.; Ross, K.N.; et al. The Connectivity Map: Using gene-expression signatures to connect small molecules, genes, and disease. Science 2006, 313, 1929–1935. [Google Scholar] [CrossRef]
- Rajapakse, V.N.; Luna, A.; Yamade, M.; Loman, L.; Varma, S.; Sunshine, M.; Iorio, F.; Sousa, F.G.; Elloumi, F.; Aladjem, M.I.; et al. CellMinerCDB for Integrative Cross-Database Genomics and Pharmacogenomics Analyses of Cancer Cell Lines. iScience 2018, 10, 247–264. [Google Scholar] [CrossRef]
- Basu, A.; Bodycombe, N.E.; Cheah, J.H.; Price, E.V.; Liu, K.; Schaefer, G.I.; Ebright, R.Y.; Stewart, M.L.; Ito, D.; Wang, S.; et al. An interactive resource to identify cancer genetic and lineage dependencies targeted by small molecules. Cell 2013, 154, 1151–1161. [Google Scholar] [CrossRef] [PubMed]
- Rees, M.G.; Seashore-Ludlow, B.; Cheah, J.H.; Adams, D.J.; Price, E.V.; Gill, S.; Javaid, S.; Coletti, M.E.; Jones, V.L.; Bodycombe, N.E.; et al. Correlating chemical sensitivity and basal gene expression reveals mechanism of action. Nat. Chem. Biol. 2016, 12, 109–116. [Google Scholar] [CrossRef] [PubMed]
- Seashore-Ludlow, B.; Rees, M.G.; Cheah, J.H.; Cokol, M.; Price, E.V.; Coletti, M.E.; Jones, V.; Bodycombe, N.E.; Soule, C.K.; Gould, J.; et al. Harnessing Connectivity in a Large-Scale Small-Molecule Sensitivity Dataset. Cancer Discov. 2015, 5, 1210–1223. [Google Scholar] [CrossRef] [PubMed]
- Furukawa, T.; Duguid, W.P.; Rosenberg, L.; Viallet, J.; Galloway, D.A.; Tsao, M.S. Long-term culture and immortalization of epithelial cells from normal adult human pancreatic ducts transfected by the E6E7 gene of human papilloma virus 16. Am. J. Pathol. 1996, 148, 1763–1770. [Google Scholar] [PubMed]
- Ouyang, H.; Mou, L.; Luk, C.; Liu, N.; Karaskova, J.; Squire, J.; Tsao, M.S. Immortal human pancreatic duct epithelial cell lines with near normal genotype and phenotype. Am. J. Pathol. 2000, 157, 1623–1631. [Google Scholar] [CrossRef]
- Hingorani, S.R.; Petricoin, E.F.; Maitra, A.; Rajapakse, V.; King, C.; Jacobetz, M.A.; Ross, S.; Conrads, T.P.; Veenstra, T.D.; Hitt, B.A.; et al. Preinvasive and invasive ductal pancreatic cancer and its early detection in the mouse. Cancer Cell 2003, 4, 437–450. [Google Scholar] [CrossRef]
- Hingorani, S.R.; Wang, L.; Multani, A.S.; Combs, C.; Deramaudt, T.B.; Hruban, R.H.; Rustgi, A.K.; Chang, S.; Tuveson, D.A. Trp53R172H and KrasG12D cooperate to promote chromosomal instability and widely metastatic pancreatic ductal adenocarcinoma in mice. Cancer Cell 2005, 7, 469–483. [Google Scholar] [CrossRef]
- Morton, J.P.; Timpson, P.; Karim, S.A.; Ridgway, R.A.; Athineos, D.; Doyle, B.; Jamieson, N.B.; Oien, K.A.; Lowy, A.M.; Brunton, V.G.; et al. Mutant p53 drives metastasis and overcomes growth arrest/senescence in pancreatic cancer. Proc. Natl. Acad. Sci. USA 2010, 107, 246–251. [Google Scholar] [CrossRef]
- Ho, W.J.; Jaffee, E.M.; Zheng, L. The tumour microenvironment in pancreatic cancer clinical challenges and opportunities. Nat. Rev. Clin. Oncol. 2020, 17, 527–540. [Google Scholar] [CrossRef]
- Hosein, A.N.; Brekken, R.A.; Maitra, A. Pancreatic cancer stroma: An update on therapeutic targeting strategies. Nat. Rev. Gastroenterol. Hepatol. 2020, 17, 487–505. [Google Scholar] [CrossRef]
- Stopa, K.B.; Kusiak, A.A.; Szopa, M.D.; Ferdek, P.E.; Jakubowska, M.A. Pancreatic Cancer and Its Microenvironment-Recent Advances and Current Controversies. Int. J. Mol. Sci. 2020, 21, 3218. [Google Scholar] [CrossRef] [PubMed]
- Blair, H.A. Fedratinib: First Approval. Drugs 2019, 79, 1719–1725. [Google Scholar] [CrossRef] [PubMed]
- Mullally, A.; Hood, J.; Harrison, C.; Mesa, R. Fedratinib in myelofibrosis. Blood Adv. 2020, 4, 1792–1800. [Google Scholar] [CrossRef] [PubMed]
- Corcoran, R.B.; Contino, G.; Deshpande, V.; Tzatsos, A.; Conrad, C.; Benes, C.H.; Levy, D.E.; Settleman, J.; Engelman, J.A.; Bardeesy, N. STAT3 plays a critical role in KRAS-induced pancreatic tumorigenesis. Cancer Res. 2011, 71, 5020–5029. [Google Scholar] [CrossRef] [PubMed]
- Feng, W.; Zhang, B.; Cai, D.; Zou, X. Therapeutic potential of histone deacetylase inhibitors in pancreatic cancer. Cancer Lett. 2014, 347, 183–190. [Google Scholar] [CrossRef] [PubMed]
- Damaskos, C.; Garmpis, N.; Karatzas, T.; Nikolidakis, L.; Kostakis, I.D.; Garmpi, A.; Karamaroudis, S.; Boutsikos, G.; Damaskou, Z.; Kostakis, A.; et al. Histone Deacetylase (HDAC) Inhibitors: Current Evidence for Therapeutic Activities in Pancreatic Cancer. Anticancer Res. 2015, 35, 3129–3135. [Google Scholar]
- Chao, M.W.; Chang, L.H.; Tu, H.J.; Chang, C.D.; Lai, M.J.; Chen, Y.Y.; Liou, J.P.; Teng, C.M.; Pan, S.L. Combination treatment strategy for pancreatic cancer involving the novel HDAC inhibitor MPT0E028 with a MEK inhibitor beyond K-Ras status. Clin. Epigenetics 2019, 11, 85. [Google Scholar] [CrossRef]
- Henderson, S.E.; Ding, L.Y.; Mo, X.; Bekaii-Saab, T.; Kulp, S.K.; Chen, C.S.; Huang, P.H. Suppression of Tumor Growth and Muscle Wasting in a Transgenic Mouse Model of Pancreatic Cancer by the Novel Histone Deacetylase Inhibitor AR-42. Neoplasia 2016, 18, 765–774. [Google Scholar] [CrossRef]
- Bahr, J.C.; Robey, R.W.; Luchenko, V.; Basseville, A.; Chakraborty, A.R.; Kozlowski, H.; Pauly, G.T.; Patel, P.; Schneider, J.P.; Gottesman, M.M.; et al. Blocking downstream signaling pathways in the context of HDAC inhibition promotes apoptosis preferentially in cells harboring mutant Ras. Oncotarget 2016, 7, 69804–69815. [Google Scholar] [CrossRef]


| Access Number | Platform | # of Cases | # of DEGs 1 | References | ||
|---|---|---|---|---|---|---|
| Normal | Tumor | Up | Down | |||
| GSE15471 | HG-U133_Plus_2 2 | 39 | 39 | 1548 | 232 | [12,13] |
| GSE16515 | HG-U133_Plus_2 | 16 | 36 | 1345 | 471 | [14,15,16] |
| GSE32676 | HG-U133_Plus_2 | 7 | 25 | 552 | 220 | [17,18] |
| GSE62452 | HG-U133_Plus_2 | 61 | 69 | 189 | 105 | [19] |
| GSE101448 | Illumina_HT-12_V4 3 | 19 | 24 | 1165 | 910 | [20] |
| GSE15471 | GSE16515 | GSE32676 | GSE62452 | GSE101448 | Average FC | |
|---|---|---|---|---|---|---|
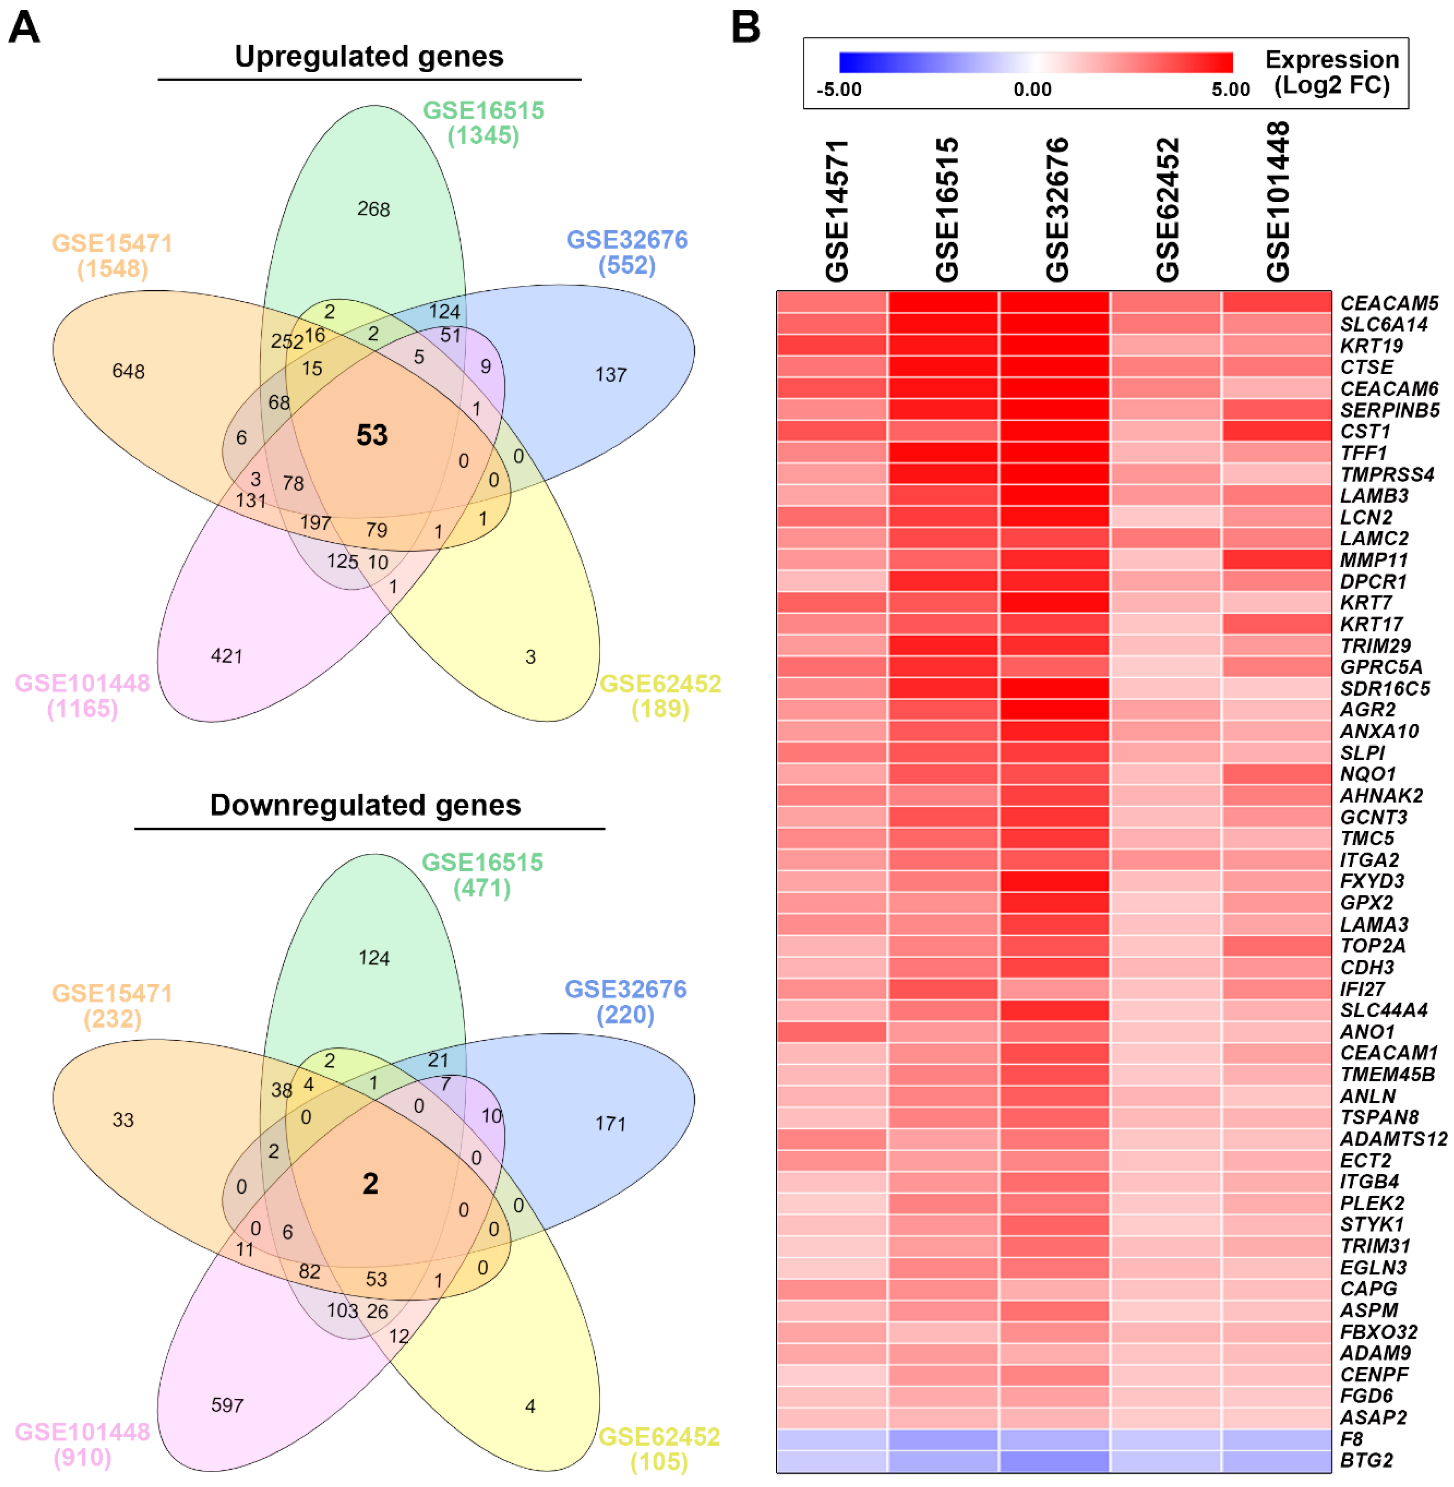
| CEACAM5 | 2.77 | 6.25 | 6.81 | 2.79 | 3.68 | 4.46 |
| SLC6A14 | 3.01 | 4.63 | 5.88 | 2.66 | 2.39 | 3.71 |
| KRT19 | 3.71 | 4.47 | 6.22 | 1.83 | 2.22 | 3.69 |
| CTSE | 2.73 | 4.62 | 5.12 | 2.55 | 2.69 | 3.54 |
| CEACAM6 | 3.35 | 4.53 | 5.79 | 2.42 | 1.56 | 3.53 |
| SERPINB5 | 2.32 | 4.39 | 5.62 | 1.97 | 3.22 | 3.50 |
| CST1 | 3.35 | 3.04 | 4.90 | 1.65 | 3.96 | 3.38 |
| TFF1 | 2.40 | 4.68 | 5.06 | 1.51 | 2.12 | 3.15 |
| TMPRSS4 | 1.96 | 4.50 | 5.76 | 2.06 | 1.36 | 3.13 |
| LAMB3 | 1.79 | 3.67 | 4.87 | 2.08 | 2.64 | 3.01 |
| LCN2 | 2.89 | 3.79 | 4.59 | 1.12 | 2.15 | 2.91 |
| LAMC2 | 2.18 | 3.55 | 3.59 | 2.65 | 2.51 | 2.90 |
| MMP11 | 2.05 | 3.05 | 4.16 | 1.23 | 3.99 | 2.90 |
| DPCR1 | 1.35 | 4.15 | 4.23 | 1.78 | 2.47 | 2.80 |
| KRT7 | 3.11 | 3.29 | 4.65 | 1.49 | 1.34 | 2.77 |
| KRT17 | 2.38 | 3.27 | 3.77 | 1.18 | 3.20 | 2.76 |
| TRIM29 | 2.00 | 4.30 | 4.06 | 1.28 | 2.01 | 2.73 |
| GPRC5A | 2.85 | 4.05 | 3.14 | 1.01 | 2.53 | 2.72 |
| SDR16C5 | 2.32 | 4.18 | 4.78 | 1.20 | 1.07 | 2.71 |
| AGR2 | 2.05 | 3.37 | 4.83 | 1.86 | 1.36 | 2.69 |
| ANXA10 | 2.01 | 3.25 | 4.32 | 1.94 | 1.70 | 2.64 |
| SLPI | 2.67 | 3.31 | 3.79 | 1.73 | 1.61 | 2.62 |
| NQO1 | 1.80 | 3.28 | 3.45 | 1.31 | 2.98 | 2.56 |
| AHNAK2 | 2.54 | 2.48 | 3.71 | 1.51 | 2.54 | 2.56 |
| GCNT3 | 1.85 | 3.35 | 3.93 | 1.34 | 2.15 | 2.52 |
| TMC5 | 2.36 | 3.00 | 3.86 | 1.55 | 1.55 | 2.46 |
| ITGA2 | 2.00 | 2.83 | 3.29 | 2.14 | 2.02 | 2.46 |
| FXYD3 | 1.80 | 2.59 | 4.57 | 1.32 | 1.91 | 2.44 |
| GPX2 | 2.07 | 2.18 | 4.20 | 1.07 | 2.01 | 2.31 |
| LAMA3 | 2.26 | 2.33 | 3.75 | 1.24 | 1.81 | 2.28 |
| TOP2A | 1.51 | 2.46 | 3.36 | 1.16 | 2.86 | 2.27 |
| CDH3 | 1.50 | 2.68 | 3.65 | 1.43 | 2.07 | 2.27 |
| IFI27 | 2.24 | 3.33 | 2.10 | 1.23 | 2.36 | 2.25 |
| SLC44A4 | 1.56 | 2.68 | 4.06 | 1.08 | 1.55 | 2.18 |
| ANO1 | 2.97 | 2.03 | 2.83 | 1.20 | 1.36 | 2.08 |
| CEACAM1 | 1.42 | 2.24 | 3.47 | 1.10 | 1.84 | 2.01 |
| TMEM45B | 1.41 | 2.49 | 3.39 | 1.12 | 1.54 | 1.99 |
| ANLN | 1.52 | 2.44 | 3.18 | 1.47 | 1.15 | 1.95 |
| TSPAN8 | 1.30 | 2.48 | 3.02 | 1.39 | 1.49 | 1.94 |
| ADAMTS12 | 2.42 | 1.87 | 2.69 | 1.14 | 1.25 | 1.87 |
| ECT2 | 2.18 | 1.93 | 2.40 | 1.19 | 1.55 | 1.85 |
| ITGB4 | 1.23 | 2.09 | 2.87 | 1.23 | 1.63 | 1.81 |
| PLEK2 | 1.01 | 2.47 | 2.71 | 1.09 | 1.64 | 1.78 |
| STYK1 | 1.25 | 2.08 | 3.05 | 1.03 | 1.42 | 1.77 |
| TRIM31 | 1.06 | 1.97 | 2.84 | 1.27 | 1.68 | 1.76 |
| EGLN3 | 1.06 | 2.38 | 2.70 | 1.39 | 1.25 | 1.76 |
| CAPG | 2.23 | 2.23 | 1.62 | 1.22 | 1.30 | 1.72 |
| ASPM | 1.38 | 2.17 | 2.80 | 1.03 | 1.21 | 1.72 |
| FBXO32 | 1.82 | 1.39 | 2.21 | 1.45 | 1.51 | 1.68 |
| ADAM9 | 1.76 | 2.00 | 1.65 | 1.20 | 1.33 | 1.59 |
| CENPF | 1.00 | 2.03 | 2.44 | 1.12 | 1.24 | 1.57 |
| FGD6 | 1.26 | 1.68 | 1.87 | 1.18 | 1.07 | 1.41 |
| ASAP2 | 1.27 | 1.44 | 1.47 | 1.03 | 1.04 | 1.25 |
| F8 | −1.11 | −1.83 | −1.56 | −1.07 | −1.37 | −1.39 |
| BTG2 | −1.02 | −1.61 | −2.17 | −1.12 | −1.51 | −1.49 |
| Access Number | Platform | Samples | Reference |
|---|---|---|---|
| GSE58055 | Agilent SurePrint G3 Human Gene Expression 8x60K v2 Microarray | Immortalized HPDE-E6/E7 cells stably transfected with a doxycycline (Dox)-inducible KRASWT (n = 4) or KRASG12D (n = 6) plasmid, or a control GFP vector (n = 6). | [30] |
| GSE53659 | Affymetrix Mouse Genome 430 2.0 Array | Normal pancreas from WT mice (n = 5); PDAC cells from KC (Pdx1-Cre/KrasG12D/+) mice (n = 6) | [31] |
| GSE67358 | Affymetrix Mouse Genome 430 2.0 Array | Metastatic (n = 7) and non-metastatic (n = 7) PDAC cells from KPC (Pdx1-Cre/KrasG12D/+/Trp53R172H/+) mice; PDAC cells (n = 5) from KPflC (Pdx1-Cre/KrasG12D/+/Trp53-/+) mice. | [32] |
| GSE123646 | Affymetrix Mouse Genome 430 2.0 Array | KPC (n = 3) and KPflC (n = 3) PDAC cells; KPflC PDAC cells transfected with either a human TP53R175H plasmid (n = 3) or a control vector (n = 3). | [33] |
| GSE33323 | Affymetrix Mouse Gene 1.0 ST Array | Normal pancreas (n = 3), pancreatic intraepithelial neoplasia (PanIN; n = 3) and PDAC (n = 3) from KC mice | [29] |
© 2020 by the authors. Licensee MDPI, Basel, Switzerland. This article is an open access article distributed under the terms and conditions of the Creative Commons Attribution (CC BY) license (http://creativecommons.org/licenses/by/4.0/).
Share and Cite
Liu, L.-W.; Hsieh, Y.-Y.; Yang, P.-M. Bioinformatics Data Mining Repurposes the JAK2 (Janus Kinase 2) Inhibitor Fedratinib for Treating Pancreatic Ductal Adenocarcinoma by Reversing the KRAS (Kirsten Rat Sarcoma 2 Viral Oncogene Homolog)-Driven Gene Signature. J. Pers. Med. 2020, 10, 130. https://doi.org/10.3390/jpm10030130
Liu L-W, Hsieh Y-Y, Yang P-M. Bioinformatics Data Mining Repurposes the JAK2 (Janus Kinase 2) Inhibitor Fedratinib for Treating Pancreatic Ductal Adenocarcinoma by Reversing the KRAS (Kirsten Rat Sarcoma 2 Viral Oncogene Homolog)-Driven Gene Signature. Journal of Personalized Medicine. 2020; 10(3):130. https://doi.org/10.3390/jpm10030130
Chicago/Turabian StyleLiu, Li-Wei, Yao-Yu Hsieh, and Pei-Ming Yang. 2020. "Bioinformatics Data Mining Repurposes the JAK2 (Janus Kinase 2) Inhibitor Fedratinib for Treating Pancreatic Ductal Adenocarcinoma by Reversing the KRAS (Kirsten Rat Sarcoma 2 Viral Oncogene Homolog)-Driven Gene Signature" Journal of Personalized Medicine 10, no. 3: 130. https://doi.org/10.3390/jpm10030130
APA StyleLiu, L.-W., Hsieh, Y.-Y., & Yang, P.-M. (2020). Bioinformatics Data Mining Repurposes the JAK2 (Janus Kinase 2) Inhibitor Fedratinib for Treating Pancreatic Ductal Adenocarcinoma by Reversing the KRAS (Kirsten Rat Sarcoma 2 Viral Oncogene Homolog)-Driven Gene Signature. Journal of Personalized Medicine, 10(3), 130. https://doi.org/10.3390/jpm10030130