Article

Inhaled Xenon Washout as a Biomarker of Alzheimer’s Disease

1
Department of Chemistry, Lakehead University, 955 Oliver Rd, Thunder Bay, ON P7B 5E1, Canada
2
Thunder Bay Regional Health Research Institute, 980 Oliver Rd, Thunder Bay, ON P7B 5E1, Canada
3
Thunder Bay Regional Health Sciences Centre, 980 Oliver Rd, Thunder Bay, ON P7B 5E1, Canada
4
Northern Ontario School of Medicine, 955 Oliver Rd, Thunder Bay, ON P7B 5E1, Canada
*
Author to whom correspondence should be addressed.
Diagnostics 2018, 8(2), 41; https://doi.org/10.3390/diagnostics8020041
Submission received: 3 May 2018 / Revised: 28 May 2018 / Accepted: 5 June 2018 / Published: 6 June 2018
(This article belongs to the Special Issue Alzheimer's Disease Imaging Biomarkers)

Abstract

:
Biomarkers have the potential to aid in the study of Alzheimer’s disease (AD); unfortunately, AD biomarker values often have a high degree of overlap between healthy and AD individuals. This study investigates the potential utility of a series of novel AD biomarkers, the sixty second 129Xe retention time, and the xenon washout parameter, based on the washout of hyperpolarized 129Xe from the brain of AD participants following inhalation. The xenon washout parameter is influenced by cerebral perfusion, T1 relaxation of xenon, and the xenon partition coefficient, all factors influenced by AD. Participants with AD (n = 4) and healthy volunteers (n = 4) were imaged using hyperpolarized 129Xe magnetic resonance imaging (MRI) and magnetic resonance spectroscopy (MRS) to determine the amount of retained xenon in the brain. At 60 s after the breath hold, AD patients retained significantly higher amounts of 129Xe compared to healthy controls. Data was fit to a pharmacokinetic model and the xenon washout parameter was extracted. Xenon washout in white and grey matter occurs at a slower rate in Alzheimer’s participants (129Xe half-life time of 42 s and 43 s, respectively) relative to controls (20 s and 16 s, respectively). Following larger scale clinical trials for validation, the xenon washout parameter has the potential to become a useful biomarker for the support of AD diagnosis.

1. Introduction

Alzheimer’s disease (AD) is an age-related neurodegenerative disorder that compromises the memory and executive function of affected individuals [1]. The etiology of AD is complex, with a variety of factors such as genetics [2,3,4,5,6], the amyloid-β (Aβ) protein [7,8,9,10,11], the microtubule tau protein [8,12,13,14,15], and inflammation [16,17,18], amongst others, interacting with one another to influence the pathology and progression of AD. While the amyloid cascade hypothesis and its variants [7,19,20,21] remain the favored AD hypothesis, the exact cause of AD remains contentious [22,23,24,25].
Cerebro-vascular factors have been demonstrated to both influence and to be influenced by AD pathology [26,27,28]. These vascular effects include an increased risk of stroke in AD patients [29]. Paradoxically, a history of strokes excludes a diagnosis of AD in favor of vascular dementia [30]. This only muddies the waters in differentiating between these two causes of dementia and raises discordance: If an individual suffers a stroke and then presents with dementia symptoms, the dementia is likely to be differentiated as vascular dementia, yet if an AD patient suffers a stroke following diagnosis, the stroke is likely to be attributed to the AD pathology.
The various pathological factors involved in AD have allowed for the discovery of an abundance of AD biomarkers based on data obtained from medical imaging, cerebrospinal fluid and blood plasma [31,32,33,34,35,36]. Medical imaging, including positron emission tomography (PET) [37,38,39,40] and magnetic resonance imaging (MRI) [41,42,43,44,45], has provided a wealth of information on the pathology of AD both in research settings and as confirmatory diagnostic tools [38,46,47,48].
Impaired cerebral perfusion is one of the many pathological hallmarks of AD [49] and its use as a biomarker for AD was established even before the amyloid cascade hypothesis was first posited [50] in the early 1990s. Numerous research groups have observed a reduction in cerebral perfusion in AD patients using a variety of techniques [51,52,53]. In one such example, Perani, et al. showed a reduction in global cerebral perfusion compared to healthy controls using technetium-99m hexamethylpropyleneamine oxime ([99mTc]HM-PAO) Single Positron Emission Tomography (SPECT) [54]. Parkes and colleagues employed arterial spin labelling (ASL), an MRI-based technique, to demonstrate a decrease in the grey matter to white matter (GM:WM) perfusion ratio, which was attributed to the reduction in GM perfusion [55]. Work by Du et al. and Johnson et al. localized areas of hypoperfusion to the parietal cortex [56,57]. In addition to localizing impaired cerebral perfusion to the parietal cortices, Schuff, and colleagues localized impaired perfusion to the frontal cortices [56]. ASL and phase contrast MRI have been used to detect changes in cerebral blood flow (CBF) in order to stage AD disease severity [58,59].
In addition to detecting endogenous nuclei in the body (i.e., protons), MRI can also be used to detect exogeneous nuclei. A variety of techniques have been developed to increase the sensitivity of MRI to these exogeneous nuclei. One of these techniques involves hyperpolarizing the nuclei of a variety of elements such as 3He [60], 129Xe [61,62,63] and 13C [64], to align their nuclear spin angular momentum, providing an increase in the signal-to-noise (SNR) ratio of approximately five orders of magnitude [65]. Because these nuclei are not ubiquitous to the body under ordinary physiological conditions, they can be detected and tracked throughout the body using MRI and magnetic resonance spectroscopy (MRS) [66,67,68]. In particular, a hyperpolarized (HP) gas, 129Xe, dissolves into the blood following inhalation [69] and then travels throughout the vasculature and accumulates in highly perfused tissues such as the brain [70,71]. This process is referred to as xenon wash-in. Xenon then washes out of the brain tissue, dissolving in the blood and is then exhaled following gas exchange in the lungs.
The diagnosis of AD is a diagnosis of exclusion and is primarily based upon clinical presentation [30]. Biomarkers obtained from the cerebrospinal fluid (CSF) or from imaging may be used as confirmatory tools [72]. One of the difficulties in using AD-associated biomarkers for AD diagnosis is the large overlap in values between AD patients and healthy individuals; while the mean values between the two populations may be statistically significant, many AD patients may have biomarker values close to the “normal” range, and vice versa [73]. Abnormal Aβ42 levels are typically set at <550 ng/L [74]. This overlap has motivated the search for AD biomarkers with higher diagnostic accuracy. Recently, Nakamura, et al. demonstrated convincing plasma AD biomarkers at accuracies exceeding 90% using highly sensitive immunoprecipitation and mass spectrometry [75]. At present, biomarkers are ideally suited to quantitatively monitor disease progression over time, comparing current values to baseline values.
In the present study, we employed HP 129Xe, MRI and MRS to probe the xenon gas exchange characteristics in the brain of AD participants [63]. We demonstrate the preliminary results of two potential biomarkers of AD based on the washout of HP 129Xe from the brain of AD participants, which was detected using 129Xe MRS. The washout of the 129Xe from the brain can be used as an indirect measure of brain perfusion. In contrast to the high degree of overlap of many existing AD biomarkers, our preliminary data demonstrate a five standard deviation difference of 129Xe-GM signal retention at 60 s following the breath hold and a nearly two standard deviation difference in the xenon washout parameter between AD participants and healthy controls. The xenon washout parameter is calculated by fitting the xenon signal curve to a pharmacokinetic equation (see Equation (1) in results). The difference in xenon retention values between AD participants and healthy controls makes these potential biomarkers candidates for larger scale future studies.

2. Materials and Methods

2.1. Ethical Approval and Consent to Participate

This research study was approved by the research ethics boards (REB) of Lakehead University (LU) and the Thunder Bay Regional Health Sciences Centre (TBRHSC) (Reference number RP-307) and was conducted in accordance with the Tri-Council Policy Statement-2 (TCPS-2). All participants consented to their data being used for publication.

2.2. Participant Recruitment

Four participants diagnosed with mild to moderate AD were recruited from the community for participation in this study. AD patients were diagnosed using clinical criteria by a qualified neurologist or gerontologist. Additionally, four age-matched healthy volunteers were recruited to serve as controls. Age-matched control participants were all cognitively normal. Informed consent was obtained from all human participants.

2.3. 1H Magnetic Resonance Imaging

Participants were placed into a dual tuned 1H/129Xe head coil (Clinical MR Solutions LLC, Brookfield, WI, USA) in a Philips Achieva 3T clinical MRI scanner. T2-weighted 1H MRI was acquired using a turbo-spin echo (TSE) sequence with the following parameters: FOV = 250 mm × 250 mm, matrix = 256 × 256, TR/TE = 3 s/80 ms, NSA = 5, FA = 90°.

2.4. 129Xe Magnetic Resonance Spectroscopy

Enriched 129Xe was polarized to ~35% using a Xemed xenon (Xemed LLC, Durham, NH, USA) gas polarizer and dispensed into a 500 mL Tedlar bag. The participants inhaled the Xe gas and held their breath for 20 s. Sixty dynamic spectra were acquired every 2 s beginning with Xe inhalation. Xe MRS parameters were as follows: 60 dynamic scans, bandwidth 32 kHz, sample number: 4096, TR/TE = 2 s/0.17 ms, FA = 10°. The signal was a single voxel encompassing the entirety of the brain region. We used a low flip angle to maintain polarization of the 129Xe gas throughout all dynamic scans. Both Xe-GM and Xe-WM peaks were plotted as a function of time. Signal intensity was calculated by measuring the peak divided by the standard deviation of the noise.

2.5. 129Xe Magnetic Resonance Imaging

Enriched 129Xe was polarized to ~35% as described above and dispensed into two 1 L Tedlar bags. Acquisition parameters were as follows: FOV = 250 mm × 250 mm, matrix = 32 × 32, TR/TE = 250 ms/0.84 ms, NSA = 1, FA = 12.5°, Bandwidth 150 Hz/pixel. Three dynamic scans were acquired at 10 s, 20 s and 30 s following inhalation.

2.6. 129Xe Image Processing

All images were processed using a custom Matlab script that converted the raw data in k-space into an MR image using a Fast Fourier Transform (FFT) algorithm. SNR maps were created by dividing each pixel by the standard deviation of the noise. Complete details on how the SNR maps were created are contained within the supplementary information.

2.7. Xenon Washout Parameter Maps Image Processing

The three dynamic 129Xe MRI were processed as described above. A custom Matlab script was used to calculate the xenon washout parameter of each pixel as described above to create a “xenon washout parameter map”. Xenon washout parameter maps from all individuals were averaged to create a mean xenon washout parameter map for all AD participants and healthy age-matched controls. A mask was created to remove noise from outside the brain region for image clarity. The xenon washout parameter maps were overlaid on T2W anatomical MRI using GIMP v.2.8 image processing software.

2.8. Statistical Analysis

Data for all participants was aggregated and the means and standard deviations were calculated. 16 data points for healthy controls and 13 data points for AD were used. (Each participant had xenon washout measured 3 or 4 times). A Welsh’s t-test (2-tail, unpaired) was conducted to establish statistical significance. For all comparisons, p < 0.01. However, due to the preliminary nature of this study and small sample size, p values were not stated.

3. Results

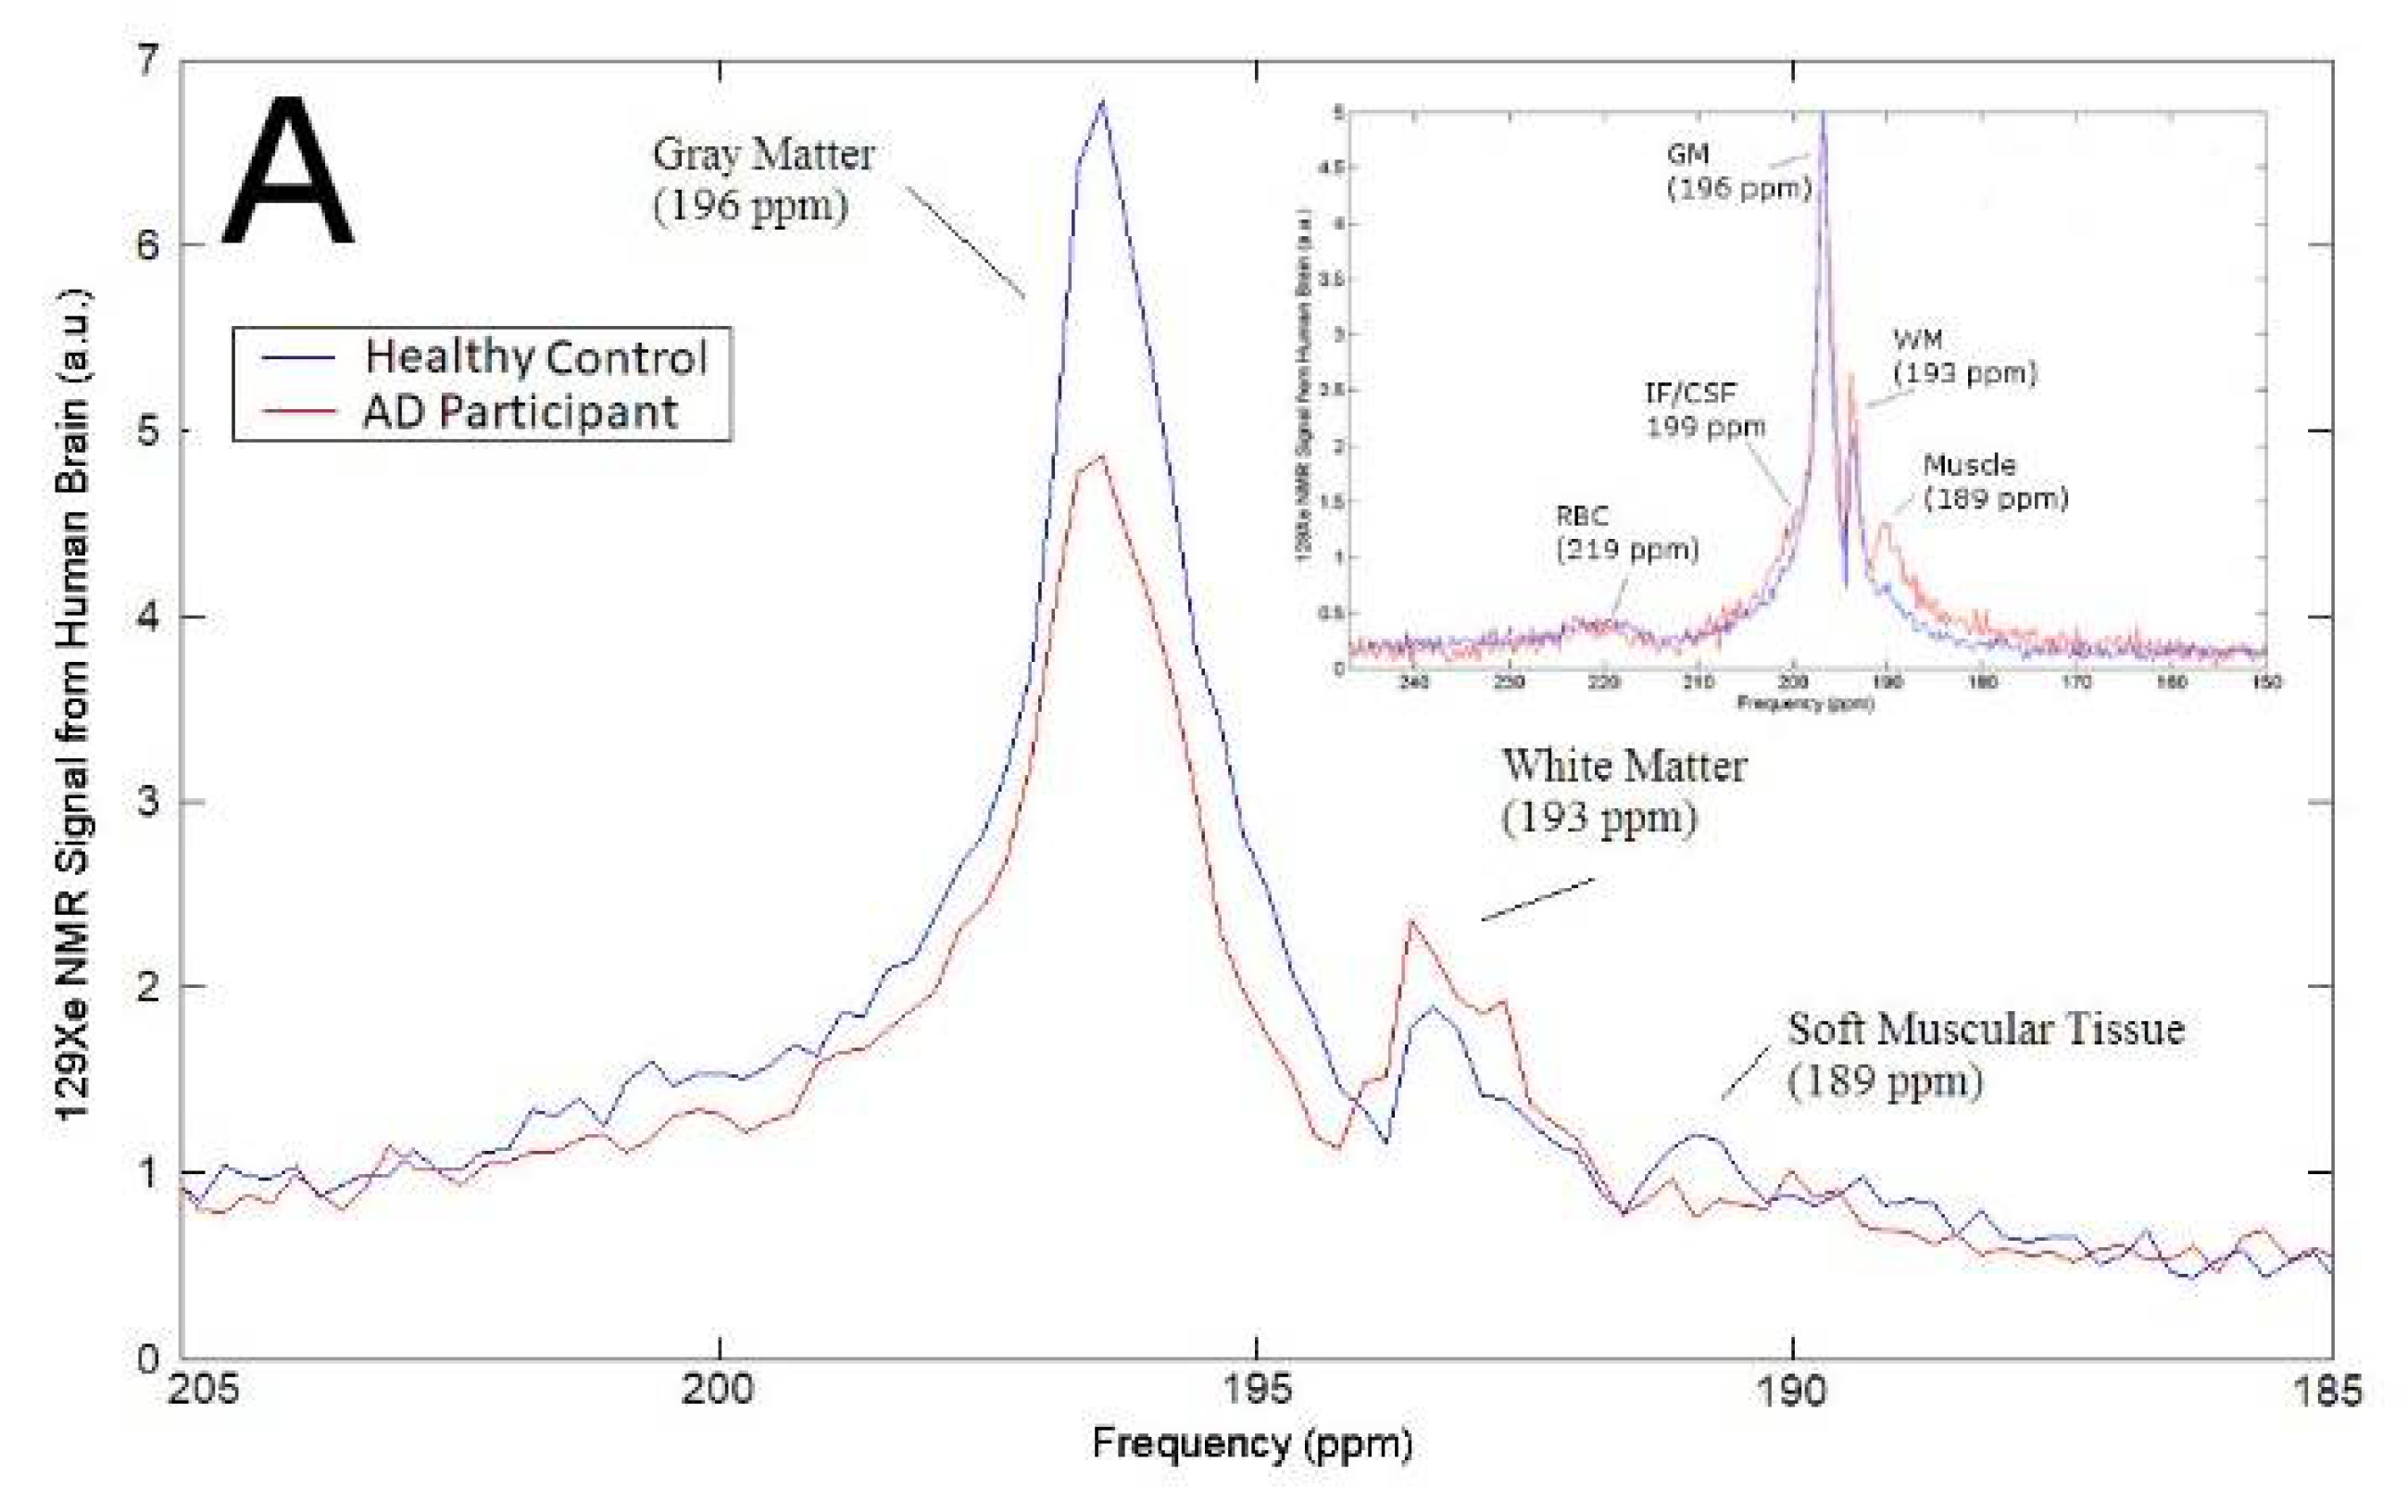
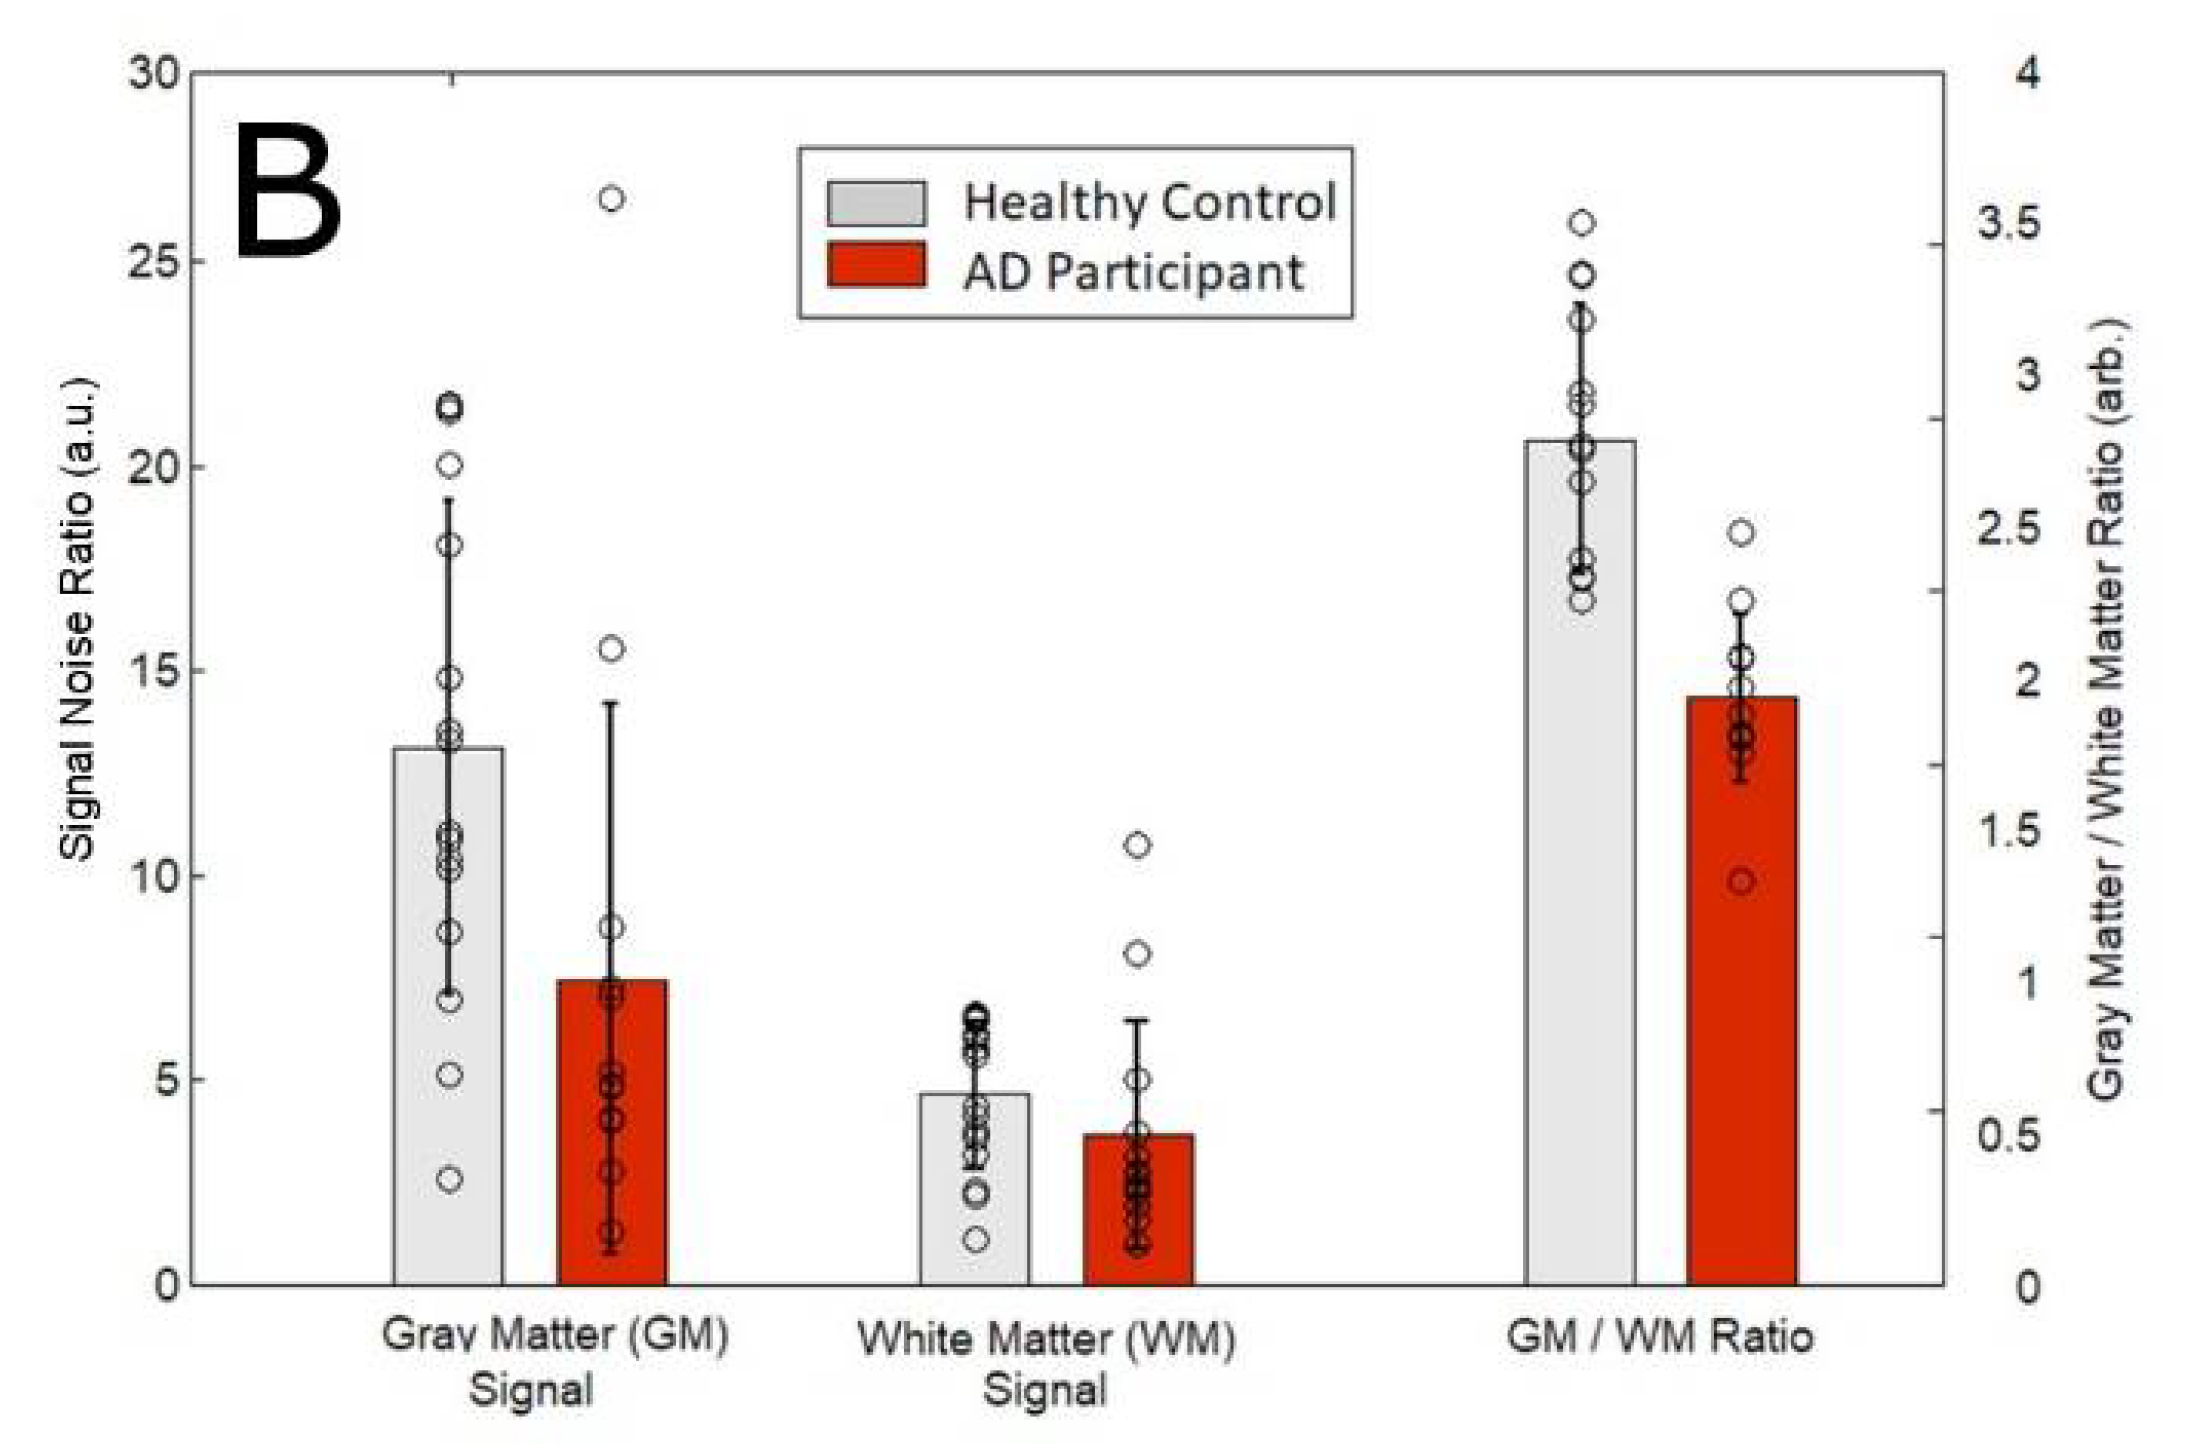
3.1. Magnetic Resonance Spectroscopy

In this work, we analyzed the 129Xe magnetic resonance (MR) spectra from the brains of AD participants (n = 4) compared to healthy controls as a function of time. We began our study by ensuring that the 129Xe spectra we acquired were consistent with previously reported spectra. We observed five 129Xe MRS peaks measured at +189 ppm, +193 ppm, +196 ppm, +199 ppm, +219 ppm (Figure 1A). These peaks are consistent with previously reported spectra that assigned these peaks to 129Xe interacting with muscle, WM, GM, CSF and red blood cells (RBC), respectively [71,76]. The chemical shift of the 129Xe MRS acquired from AD participants did not differ appreciably from the MRS acquired from healthy controls. However, the signal intensity of brain matter peaks differed in AD participants versus healthy controls (Figure 1A). The 129Xe-GM signal was 43% lower in AD participants than in healthy controls. Whereas the 129Xe-WM was not statistically different between healthy controls and AD participants (Figure 1B). We also quantified the ratio of GM to WM. We calculated that the 129Xe-GM/129Xe-WM was 32% lower in AD participants than in healthy controls.

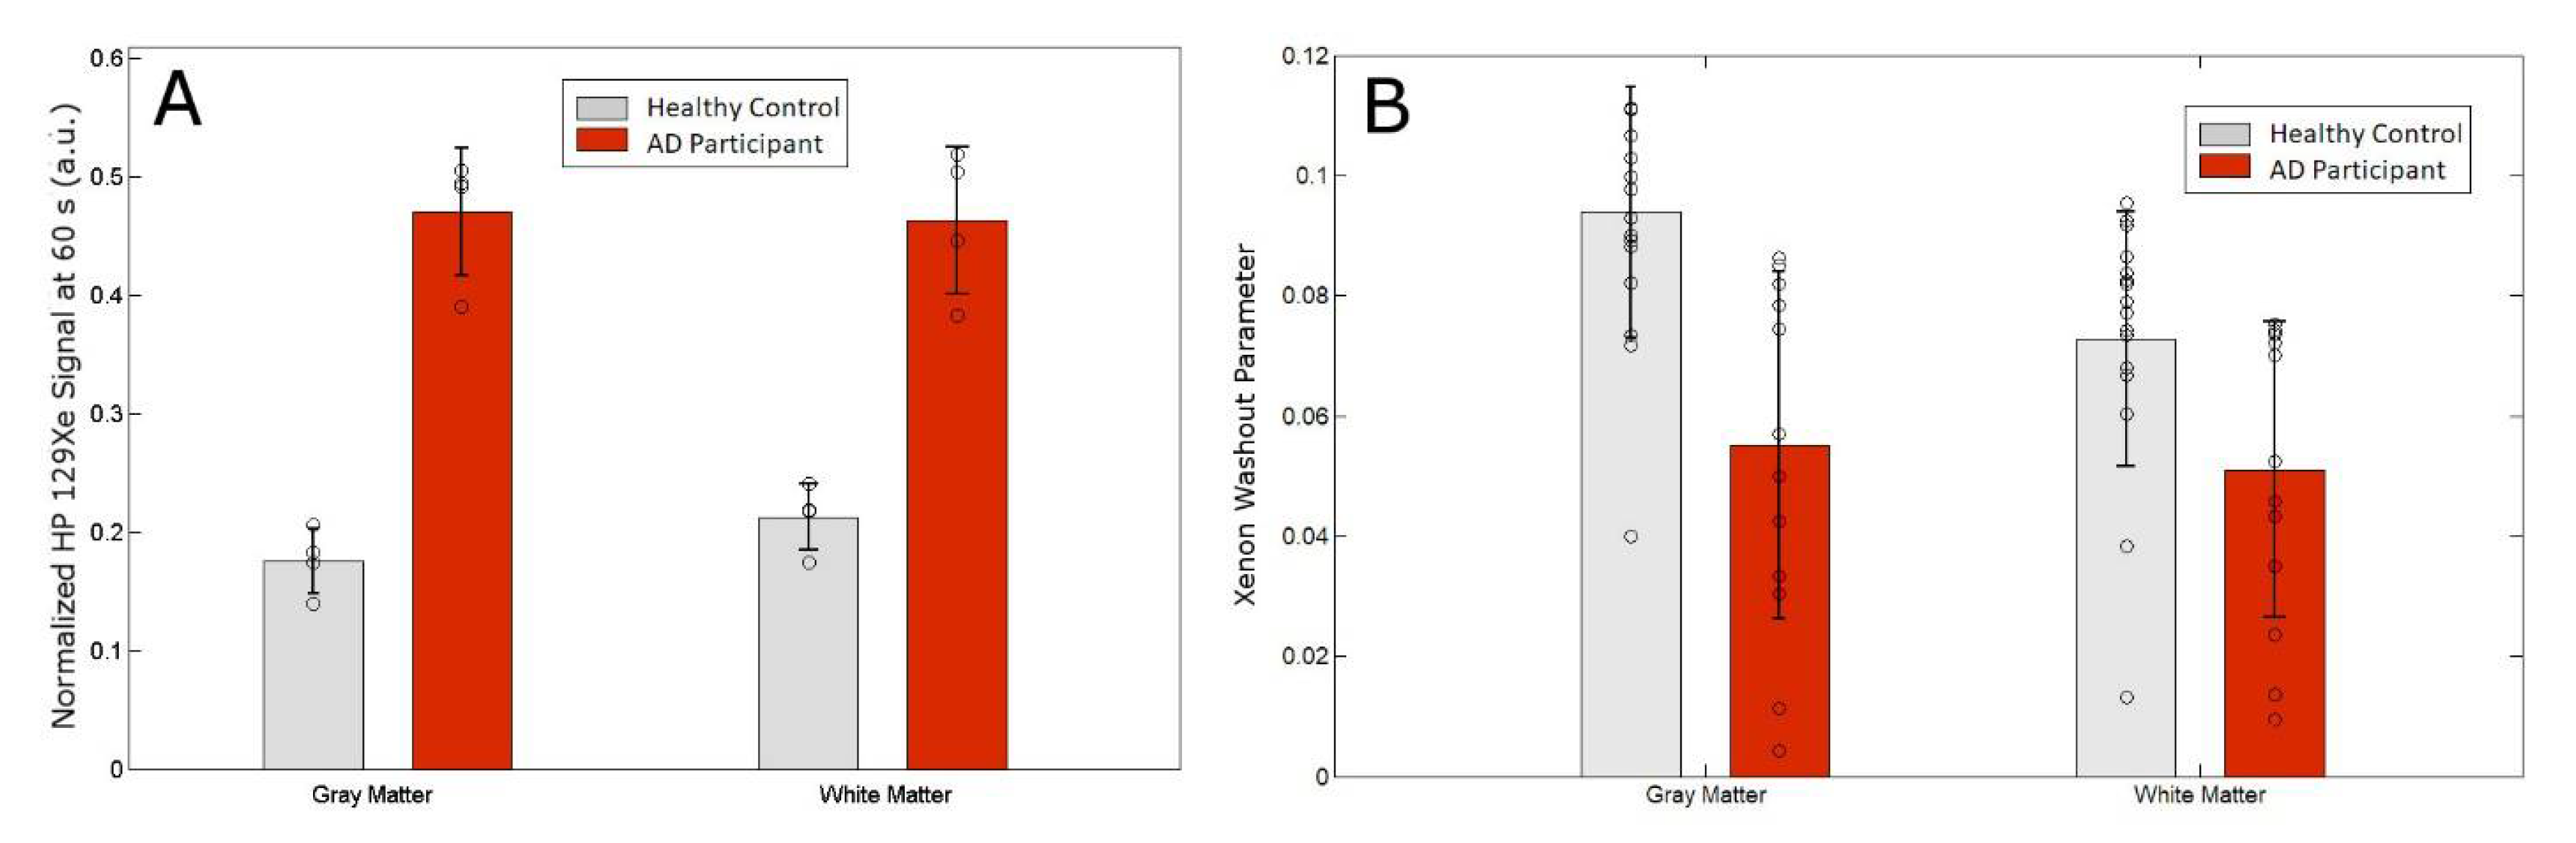
3.2. MRS as a Function of Time
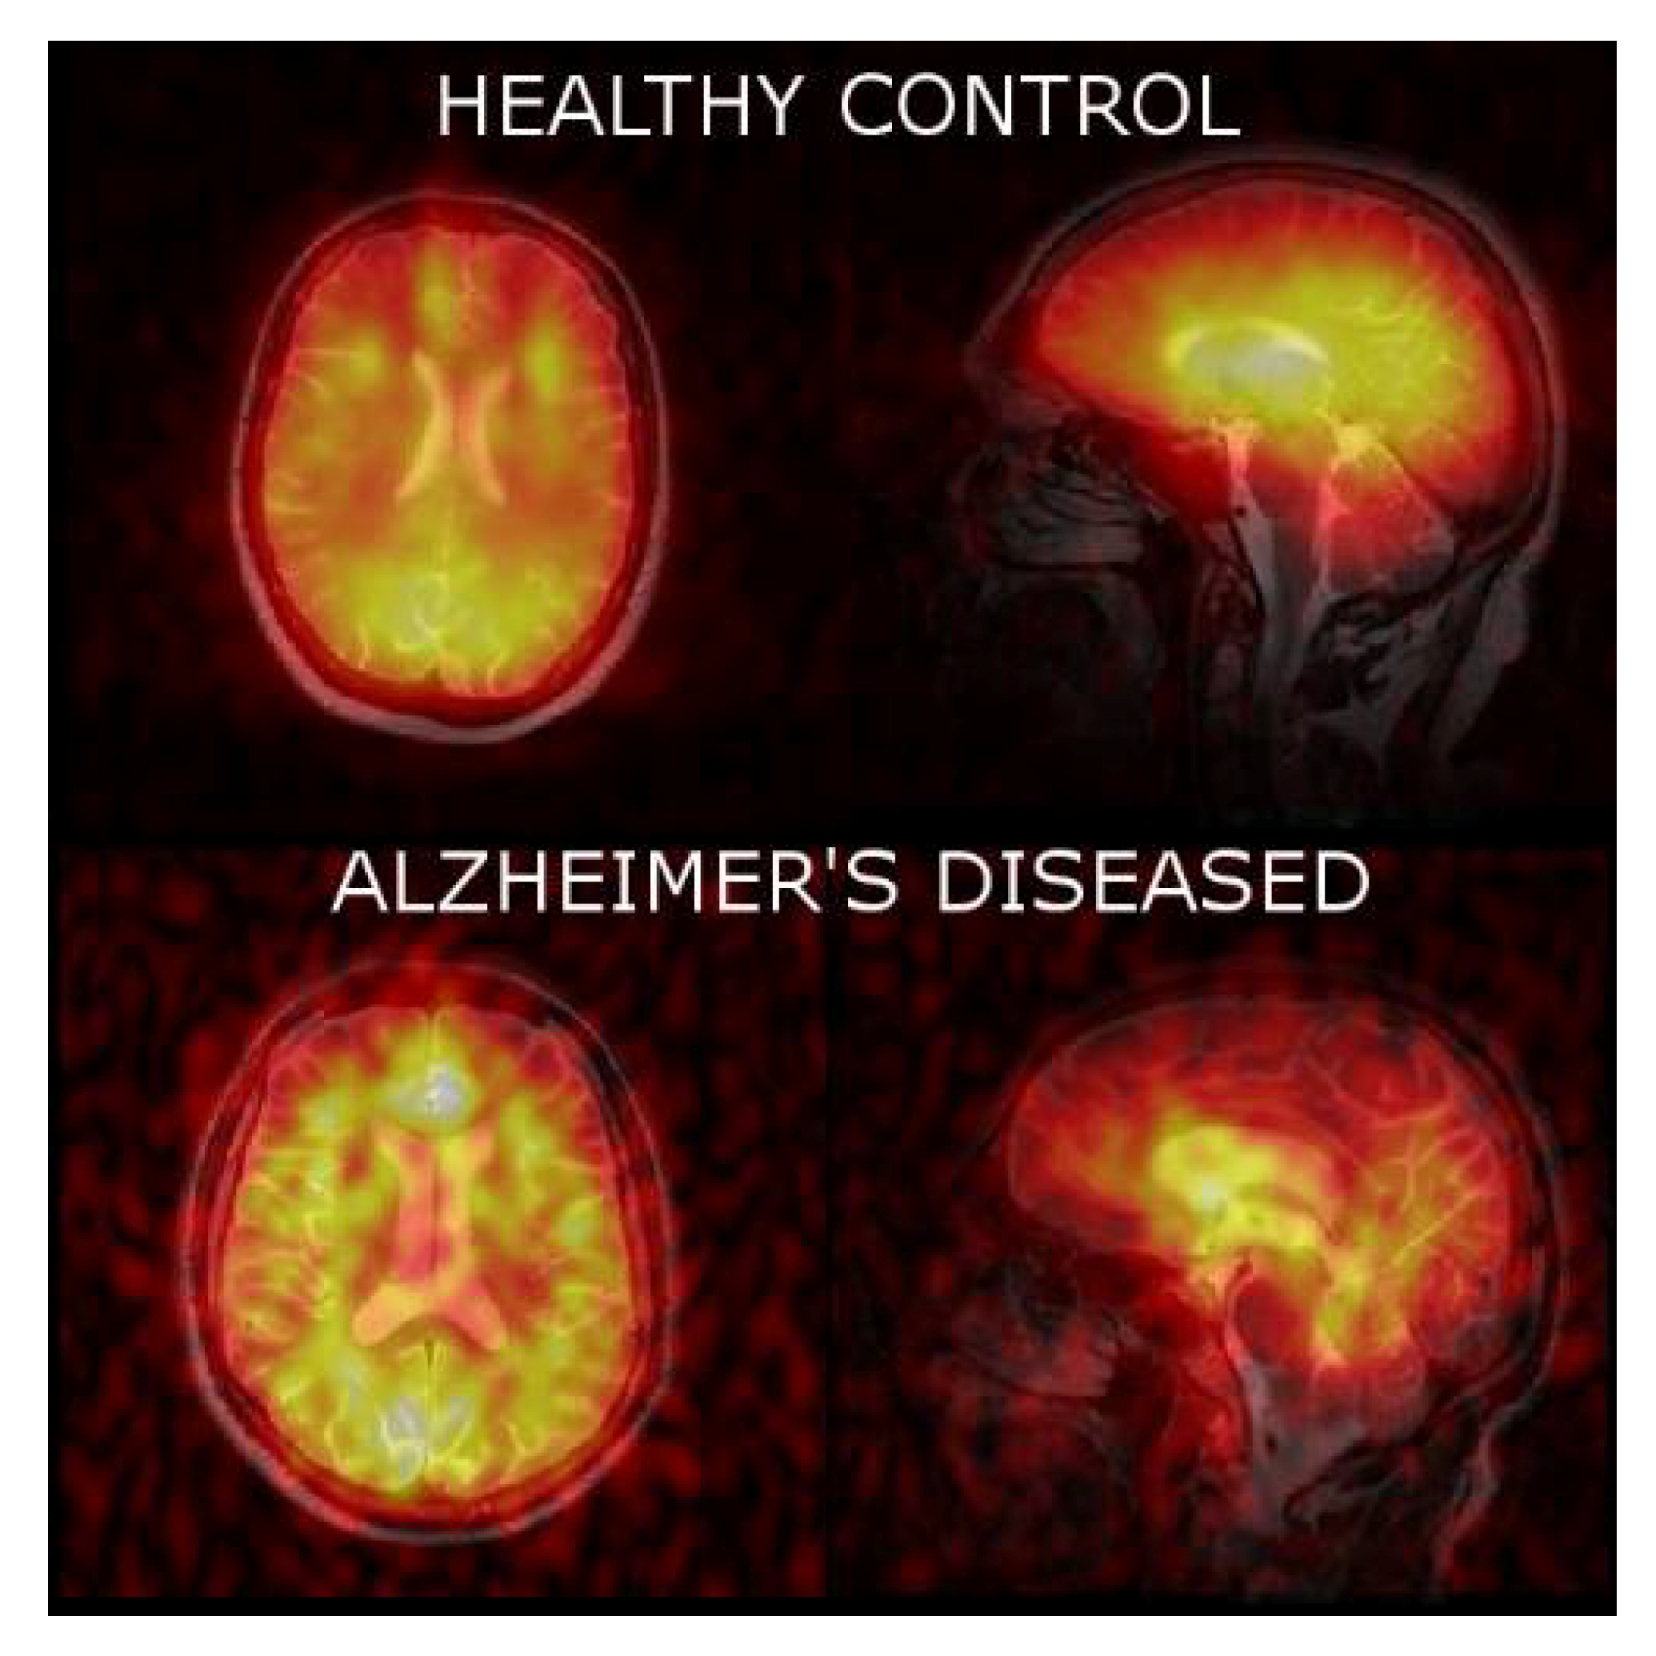
Next, we tracked the SNR of the 129Xe-WM and 129Xe-GM to probe the effect of AD on the washout time of 129Xe from the brain (Figure 2). We observed a considerable difference in 129Xe washout between AD participants and healthy controls. Healthy controls had a 129Xe washout half-life of 20 s and 16 s in WM and GM, respectively; while AD participants had a 129Xe washout half-life time of 42 s and 43 s in WM and GM, respectively. AD participants had a slower washout compared to healthy controls indicating increased 129Xe retention in the WM and GM of the brain. Sixty seconds (60 s) following 129Xe inhalation, we observed a five standard deviation difference in the 129Xe-GM between healthy controls and AD participants (Table 1, Figure 2D and Figure 3A). In fact, there was no overlap between healthy controls and AD participants.
We then quantified this washout time by applying the following pharmacokinetic model to the 129Xe washout signal [77]:
S ( t ) = S ( T ) · e β ( t T ) · cos ( t 2 1 ) α
where β is the xenon washout parameter and is defined as,
β =   f p + T 1 1
where S is the SNR as a function of time since exhalation, S(T) is the maximum xenon SNR at time T, f is the cerebral perfusion, p is the xenon partition coefficient, T1 is the 129Xe spin-lattice relaxation time in tissue, and α is the MR flip angle. By fitting the data to this model, we were able to extract the xenon washout parameter for each subject (Figure 3B).
We calculated a 41% and 31% reduction in the GM and WM xenon washout parameters, respectively, in AD patients compared to healthy controls (Table 1).

3.3. 129Xe MRI

Lastly, we acquired 129Xe MRI from the brain of healthy controls and AD participants (Figure 4). We were able to obtain significantly higher SNR images from healthy controls than from AD participants.
By fitting the SNR of each voxel in the three dynamic images, we were able to calculate a xenon washout parameter in each pixel to create a xenon washout parameter map (Figure 5). Similar to our spectroscopic results, we qualitatively observe a higher xenon washout parameter in age-matched healthy controls (Figure 5, top) than in AD patients (Figure 5, bottom). Additionally, the xenon washout parameter remains similar in caudal brain regions in AD participants versus healthy controls, whereas there is a reduction in the localized xenon washout parameter in the prefrontal regions of AD participants.

4. Discussion

In this work, we made two significant findings. Firstly, AD participants have significantly lower 129Xe in the GM than healthy controls. Secondly, we found that AD subjects retain 129Xe within both the GM and WM of the brain significantly longer than healthy controls. Our results support the hypothesis that cerebral perfusion may be affected by AD pathology.
AD is considered primarily a disease of grey matter; however, white matter has been implicated as well in the AD pathology [78]. Our observed decrease in 129Xe-GM signal between AD participants and healthy controls suggests a reduction in GM volume or a decrease in 129Xe uptake in the GM. In contrast, the 129Xe-WM signal was not different between AD participants and healthy controls.
While there is considerable overlap in many AD biomarkers between healthy controls and AD patients, we calculated a five standard deviation difference in the 129Xe retention in the GM between AD patients compared to healthy controls (Table 1, Figure 2D and Figure 3A). Furthermore, no AD patients had 129Xe retention values below that of any healthy control and no healthy control had 129Xe retention values higher than the lowest AD 129Xe retention values.
Additionally, we introduce a potential AD biomarker that we denote as the xenon washout parameter from Equation (1). The measurement of xenon signal as a function of time (i.e., Xe washout) using 129Xe MRS was fit to a pharmacokinetic model (Equation (1)) and the xenon washout parameter was calculated. While other pharmacokinetic models [76] have been developed and fit our data, we utilized the model developed by Martin, et al. [77] because it was a better fit for our data as it is only applied to the washout phase and therefore relied on fewer assumptions than the model developed by Kilian et al. [76]. We calculated that the xenon washout parameter is nearly 2 standard deviations lower in AD participants than in healthy controls for grey matter.
In addition to our spectroscopic data, we were able to localize the xenon washout parameter to different brain regions. Our analysis of the localized xenon washout parameter from the xenon washout parameter maps indicates a lower xenon washout parameter in AD participants than in healthy controls (Figure 5). While this observation is consistent with our spectroscopic results, the xenon washout parameter obtained from imaging is less accurate than that obtained from spectroscopy because the model was fit using only three data points (three dynamic 129Xe images) for the imaging data compared to 60 data points for the spectroscopic data. From our qualitative observations of the sagittal β-parameter maps, we observed that the xenon washout parameter is higher in the caudal regions than it is in the frontal lobes (Figure 5) for both healthy controls and AD participants. In AD participants, while the mean xenon washout parameter decreases throughout the brain, the xenon washout parameter remains higher in the posterior regions of the brain. This observation could possibly indicate lower perfusion in the frontal lobes than in the caudal brain regions. This observation is consistent with previous reports indicating that AD pathology begins near the rostral regions of the brain and slowly migrates towards the caudal regions of the brain [79].
The cerebral perfusion, T1 of 129Xe in the brain, and the xenon partition coefficient all influence the xenon washout parameter as expressed in Equation (2). Cerebral perfusion has long been demonstrated to be reduced in AD patients [50,51,52,53,54,55,56,57,58]. Work by Binnewijzend et al. reported a difference of cerebral perfusion of approximately 27% which was one standard deviation lower in AD patients compared to healthy controls [58]. In contrast, we observed a difference in the xenon washout parameter of 42% or nearly two standard deviations between AD subjects and healthy controls. Since the xenon washout parameter is a function of cerebral perfusion, our results raise the question of why the xenon washout parameter demonstrates a greater difference between AD participants and healthy controls. While ASL provides a direct measure of cerebral perfusion, our technique incorporates additional factors, such as T1 and the xenon lipid diffusion coefficient, that may be affected in AD patients.
It is possible that the xenon washout parameter is affected by a difference in T1 relaxation time values between healthy controls and AD participants. It is interesting to speculate that small changes in T1 may be caused by the abundance of trace metals in the brain of AD participants [10,80,81,82,83].
An alternative hypothesis is that the partition coefficient of xenon in the brain tissues is different in AD participants compared to healthy controls. It is well established that Aβ affects the membrane properties of the brain [84,85,86,87,88,89]. We speculate that because of the increased membrane permeability in AD brain tissue, the partition coefficient of xenon in the brain of AD participants is increased, creating a reservoir of xenon that causes a slower wash out. Additionally, AD is known to breakdown the blood brain barrier (BBB) [90]. This breakdown may affect the clearance of xenon from the brain tissue into the blood. However, it is more likely that this phenomenon would cause increased xenon clearance (and hence faster washout in AD patients) rather than our observations of greater retained xenon in AD brains. This biomarker may offer some advantages over existing biomarkers, especially those relying on CSF. Our proposed biomarker does not require an invasive spinal tap and, so far in our preliminary results, shows a greater difference between AD participants and healthy controls compared to CSF Aβ values.
Like all techniques, this proposed biomarker has a number of limitations. First, it requires an expensive and highly specialized 129Xe polarizer to polarize the 129Xe gas. Secondly, this technique relies on the patient holding their breath for 20 s, a task that some individuals with dementia could have difficulty with.
Moreover, this study has notable limitations. Firstly, it relied on a small number of subjects precluding accurate determination of the sensitivity and specificity of this technique. Second, because of the small sample size, we were unable to infer the predictive power of this study or to correlate disease severity with the xenon washout parameter value. Lastly, we were unable to differentiate whether our proposed biomarkers are indicative of just AD or all dementias, or even, any neurologic disease. Regardless of these limitations, the proposed 129Xe xenon washout parameter biomarker has the potential for validation with a larger sample size study to determine both its accuracy and predictive power of impending AD. Additionally, future experiments could attempt to correlate the Montreal Cognitive Assessment (MOCA) scores to 129Xe retention and the xenon washout parameter; these biomarkers could be tested as a potential correlate to future AD risk.
In conclusion, we demonstrate a difference in the 129Xe retention between AD participants and healthy controls. Additionally, we introduce the termed xenon washout parameter which accounts for changes in cerebral perfusion, and differences in 129Xe T1 relaxation and lipid partition coefficients associated with AD pathology. The xenon washout parameter is considerably different in healthy controls and AD participants with little overlap between the two groups.

Supplementary Materials

The following are available online at https://www.mdpi.com/2075-4418/8/2/41/s1.

Author Contribution

F.T.H. designed experiments, conducted experiments, analyzed data, interpreted data and wrote the manuscript. T.L. designed experiments, conducted experiments, analyzed data, and wrote the manuscript. J.-A.P. designed experiments. A.H. analyzed neurological data. K.G. analyzed radiological images. M.S.A. designed experiments and interpreted data. All authors reviewed the final manuscript.

Funding

M.S.A. is funded by a grant from the Weston Foundation (TR140072). F.T.H. holds post-doctoral fellowships from the BrightFocus Foundation (A2015344F) and the Canadian Institutes for Health Research (358549).

Acknowledgments

F.T.H. wishes to acknowledge the BrightFocus Foundation and its generous donors for support of this work. The authors would like to thank the numerous administrative and technical staff that assisted us in the conduct of these experiments including Railli Pellizzari, Elizabeth Tuburchuk, Jessica Dickson, Lori-Anne Moon, Kendra Rhys, Nicole Rigato, Erin Venn, Melanie Scaravelli, Sue Wright, Laurel Knowles, Robyn Harris, and Crystal Forsyth. This project would not have been possible without the diligent assistance of these individuals.

Conflict of Interest

The authors declare no conflicts of interest.

Trial Registration

More information regarding this clinical trial can be found at clinicaltrials.gov NCT02638519.

References

  1. Scheltens, P.; Blennow, K.; Breteler, M.M.B.; de Strooper, B.; Frisoni, G.B.; Salloway, S.; Van der Flier, W.M. Alzheimer’s disease. Lancet 2016, 388, 505–517. [Google Scholar] [CrossRef]
  2. Robinson, M.; Lee, B.Y.; Hane, F.T. Recent Progess in Alzheimer’s disease Research, Part 2: Genetics and Epidemiology. J. Alzheimers Dis. 2017, 57, 317–330. [Google Scholar] [CrossRef] [PubMed]
  3. Medway, C.; Morgan, K. Review: The genetics of Alzheimer’s disease; putting flesh on the bones. Neuropathol. Appl. Neurobiol. 2014, 40, 97–105. [Google Scholar] [CrossRef] [PubMed]
  4. Wiseman, F.K.; Al-janabi, T.; Hardy, J.; Karmiloff-smith, A.; Nizetic, D.; Tybulewicz, V.L.J.; Fisher, E.M.C.; Strydom, A. A genetic cause of Alzheimer disease: Mechanistic insights from Down syndrome. Nat. Rev. Neurosci. 2015, 16, 564–574. [Google Scholar] [CrossRef] [PubMed]
  5. Tanzi, R.E.; Bertram, L. Twenty years of the Alzheimer’s disease amyloid hypothesis: A genetic perspective. Cell 2005, 120, 545–555. [Google Scholar] [CrossRef] [PubMed]
  6. Bertram, L.; Tanzi, R.E. The genetic epidemiology of neurodegenerative disease. J. Clin. Investig. 2005, 115, 1449–1457. [Google Scholar] [CrossRef] [PubMed] [Green Version]
  7. Selkoe, D.J. The molecular pathology of Alzheimer’s disease. Neuron 1991, 6, 487–498. [Google Scholar] [CrossRef]
  8. Savelieff, M.G.; Lee, S.; Liu, Y.; Lim, M.H. Untangling Amyloid-β, Tau, and Metals in Alzheimer’s Disease. ACS Chem. Biol. 2013, 8, 856–865. [Google Scholar] [CrossRef] [PubMed]
  9. Mattson, M.P. Pathways towards and away from Alzheimer’s disease. Nature 2004, 430, 631–639. [Google Scholar] [CrossRef] [PubMed]
  10. Hane, F.; Leonenko, Z. Effect of metals on kinetic pathways of amyloid-β aggregation. Biomolecules 2014, 4, 101–116. [Google Scholar] [CrossRef] [PubMed]
  11. Hane, F.T.; Lee, B.Y.; Leonenko, Z. Recent Progress in Alzheimer’s Disease Research, Part 1: Pathology. J. Alzheimers Dis. 2017, 57, 1–28. [Google Scholar] [CrossRef] [PubMed]
  12. Wang, Y.; Mandelkow, E. Tau in physiology and pathology. Nat. Rev. Neurosci. 2015, 17, 22–35. [Google Scholar] [CrossRef] [PubMed]
  13. De Calignon, A.; Polydoro, M.; Suárez-Calvet, M.; William, C.; Adamowicz, D.H.; Kopeikina, K.J.; Pitstick, R.; Sahara, N.; Ashe, K.H.; Carlson, G.A.; et al. Propagation of Tau Pathology in a Model of Early Alzheimer’s Disease. Neuron 2012, 73, 685–697. [Google Scholar] [CrossRef] [PubMed]
  14. Ittner, L.M.; Götz, J. Amyloid-β and tau—A toxic pas de deux in Alzheimer’s disease. Nat. Rev. Neurosci. 2011, 12, 65–72. [Google Scholar] [CrossRef] [PubMed]
  15. Sotiropoulos, I.; Catania, C.; Pinto, L.G.; Silva, R.; Pollerberg, G.E.; Takashima, A.; Sousa, N.; Almeida, O.F.X. Stress acts cumulatively to precipitate Alzheimer’s disease-like tau pathology and cognitive deficits. J. Neurosci. 2011, 31, 7840–7847. [Google Scholar] [CrossRef] [PubMed]
  16. Wyss-Coray, T.; Rogers, J. Inflammation in Alzheimer disease—A brief review of the basic science and clinical literature. Cold Spring Harb. Perspect. Med. 2012, 2, a006346. [Google Scholar] [CrossRef] [PubMed]
  17. Zimmer, E.R.; Leuzy, A.; Benedet, A.L.; Breitner, J.; Gauthier, S.; Rosa-Neto, P. Tracking neuroinflammation in Alzheimer’s disease: The role of positron emission tomography imaging. J. Neuroinflamm. 2014, 11, 120. [Google Scholar] [CrossRef] [PubMed]
  18. Heppner, F.L.; Ransohoff, R.M.; Becher, B. Immune attack: The role of inflammation in Alzheimer disease. Nat. Rev. Neurosci. 2015, 16, 358–372. [Google Scholar] [CrossRef] [PubMed]
  19. Selkoe, D. Toward a comprehensive theory for Alzheimer’s disease. Hypothesis: Alzheimer’s disease is caused by the cerebral accumulation and cytotoxicity of amyloid-β protein. Ann. N. Y. Acad. Sci. 2006, 924, 17–25. [Google Scholar] [CrossRef]
  20. Hardy, J.; Selkoe, D.J. The amyloid hypothesis of Alzheimer’s disease: Progress and problems on the road to therapeutics. Science 2002, 297, 353–356. [Google Scholar] [CrossRef] [PubMed]
  21. Walsh, D.; Selkoe, D. Aβ oligomers—A decade of discovery. J. Neurochem. 2007, 101, 1172–1184. [Google Scholar] [CrossRef] [PubMed]
  22. Herrup, K. The case for rejecting the amyloid cascade hypothesis. Nat. Neurosci. 2015, 18, 794–799. [Google Scholar] [CrossRef] [PubMed]
  23. Whitehouse, P.J.; George, D.R.; D’Alton, S. Describing the dying days of “Alzheimer’s disease”. J. Alzheimers Dis. 2011, 24, 11–13. [Google Scholar] [CrossRef] [PubMed]
  24. Zhang, S. Is the Alzheimer’s Amyloid Hypothesis Wrong? Atlantic 2017. Available online: https://www.theatlantic.com/health/archive/2017/02/alzheimers-amyloid-hypothesis/517185/ (accessed on 5 June 2018).
  25. Morris, G.P.; Clark, I.A.; Vissel, B. Inconsistencies and controversies surrounding the amyloid hypothesis of Alzheimer’s disease. Acta Neuropathol. Commun. 2014, 2, 135. [Google Scholar] [CrossRef] [PubMed]
  26. Roy, S.; Rauk, A. Alzheimer’s disease and the “ABSENT” hypothesis: Mechanism for amyloid beta endothelial and neuronal toxicity. Med. Hypotheses 2005, 65, 123–137. [Google Scholar] [CrossRef] [PubMed]
  27. Kisler, K.; Nelson, A.R.; Montagne, A.; Zlokovic, B.V. Cerebral blood flow regulation and neurovascular dysfunction in Alzheimer disease. Nat. Rev. Neurosci. 2017, 18, 419–434. [Google Scholar] [CrossRef] [PubMed] [Green Version]
  28. De la Torre, J.C. Are Major Dementias Triggered by Poor Blood Flow to the Brain? Theoretical Considerations. J. Alzheimers Dis. 2017, 57, 353–371. [Google Scholar] [CrossRef] [PubMed]
  29. Chi, N.-F.; Chien, L.-N.; Ku, H.-L.; Hu, C.-J.; Chiou, H.-Y. Alzheimer disease and risk of stroke: A population-based cohort study. Neurology 2013, 80, 705–711. [Google Scholar] [CrossRef] [PubMed]
  30. McKhann, G.M.; Knopman, D.S.; Chertkow, H.; Hyman, B.T.; Jack, C.R.; Kawas, C.H.; Klunk, W.E.; Koroshetz, W.J.; Manly, J.J.; Mayeux, R.; et al. The diagnosis of dementia due to Alzheimer’s disease: Recommendations from the National Institute on Aging-Alzheimer’s Association workgroups on diagnostic guidelines for Alzheimer’s disease. Alzheimers Dement. 2011, 7, 263–269. [Google Scholar] [CrossRef] [PubMed]
  31. Klunk, W.E.; Engler, H.; Nordberg, A.; Wang, Y.; Blomqvist, G.; Holt, D.P.; Bergström, M.; Savitcheva, I.; Huang, G.F.; Estrada, S.; et al. Imaging Brain Amyloid in Alzheimer’s Disease with Pittsburgh Compound-B. Ann. Neurol. 2004, 55, 306–319. [Google Scholar] [CrossRef] [PubMed]
  32. Sperling, R.A.; Jack, C.R.; Black, S.E.; Frosch, M.P.; Greenberg, S.M.; Hyman, B.T.; Scheltens, P.; Carrillo, M.C.; Thies, W.; Bednar, M.M.; et al. Amyloid-related imaging abnormalities in amyloid-modifying therapeutic trials: Recommendations from the Alzheimer’s Association Research Roundtable Workgroup. Alzheimers Dement. 2011, 7, 367–385. [Google Scholar] [CrossRef] [PubMed] [Green Version]
  33. Walhovd, K.B.; Fjell, A.M.; Brewer, J.; McEvoy, L.K.; Fennema-Notestine, C.; Hagler, D.J.; Jennings, R.G.; Karow, D.; Dale, A.M. Alzheimer’s Disease Neuroimaging Initiative Combining MR imaging, positron-emission tomography, and CSF biomarkers in the diagnosis and prognosis of Alzheimer disease. Am. J. Neuroradiol. 2010, 31, 347–354. [Google Scholar] [CrossRef] [PubMed]
  34. Mapstone, M.; Cheema, A.K.; Fiandaca, M.S.; Zhong, X.; Mhyre, T.R.; MacArthur, L.H.; Hall, W.J.; Fisher, S.G.; Peterson, D.R.; Haley, J.M.; et al. Plasma phospholipids identify antecedent memory impairment in older adults. Nat. Med. 2014, 20, 415–418. [Google Scholar] [CrossRef] [PubMed] [Green Version]
  35. Brys, M.; Pirraglia, E.; Rich, K.; Rolstad, S.; Mosconi, L.; Switalski, R.; Glodzik-Sobanska, L.; De Santi, S.; Zinkowski, R.; Mehta, P.; et al. Prediction and longitudinal study of CSF biomarkers in mild cognitive impairment. Neurobiol. Aging 2009, 30, 682–690. [Google Scholar] [CrossRef] [PubMed] [Green Version]
  36. Mattsson, N.; Zetterberg, H.; Hansson, O.; Andreasen, N.; Parnetti, L.; Jonsson, M.; Herukka, S.-K.; Flier, W.M.; van der Blankenstein, M.A.; Ewers, M.; et al. CSF Biomarkers and Incipient Alzheimer Disease in Patients With Mild Cognitive Impairment. JAMA 2009, 302, 385–393. [Google Scholar] [CrossRef] [PubMed]
  37. Barthel, H.; Gertz, H.-J.; Dresel, S.; Peters, O.; Bartenstein, P.; Buerger, K.; Hiemeyer, F.; Wittemer-Rump, S.M.; Seibyl, J.; Reininger, C.; et al. Cerebral amyloid-β PET with florbetaben (18F) in patients with Alzheimer’s disease and healthy controls: A multicentre phase 2 diagnostic study. Lancet Neurol. 2011, 10, 424–435. [Google Scholar] [CrossRef]
  38. Villemagne, V.L.; Fodero-Tavoletti, M.T.; Masters, C.L.; Rowe, C.C. Tau imaging: Early progress and future directions. Lancet Neurol. 2015, 14, 114–124. [Google Scholar] [CrossRef]
  39. Wang, L.; Benzinger, T.L.; Su, Y.; Christensen, J.; Friedrichsen, K.; Aldea, P.; McConathy, J.; Cairns, N.J.; Fagan, A.M.; Morris, J.C.; et al. Evaluation of Tau Imaging in Staging Alzheimer Disease and Revealing Interactions Between β-Amyloid and Tauopathy. JAMA Neurol. 2016, 63110, 1–8. [Google Scholar] [CrossRef] [PubMed]
  40. Brier, M.R.; Gordon, B.; Friedrichsen, K.; McCarthy, J.; Stern, A.; Christensen, J.; Owen, C.; Aldea, P.; Su, Y.; Hassenstab, J.; et al. Tau and A-beta imaging, CSF measures, and cognition in Alzheimer’s disease. Sci. Transl. Med. 2016, 8, 338ra66. [Google Scholar] [CrossRef] [PubMed]
  41. Dickerson, B.C.; Wolk, D.A. MRI cortical thickness biomarker predicts AD-like CSF and cognitive decline in normal adults. Neurology 2012, 78, 84–90. [Google Scholar] [CrossRef] [PubMed]
  42. Basser, P.; Pierpaoli, C. Microstructural and physiological features of tissues elucidated by quantitative-diffusion-tensor MRI. J. Magn. Reson. 1996, 111, 209–219. [Google Scholar] [CrossRef]
  43. Pierpaoli, C.; Basser, P. Toward a quantitative assessment of diffusion anisotropy. Magn. Reson. Med. 1996, 36, 893–906. [Google Scholar] [CrossRef] [PubMed]
  44. Douaud, G.; Groves, A.R.; Tamnes, C.K.; Tjelta, L.; Duff, E.P.; Engvig, A.; Walhovd, K.B.; James, A.; Gass, A.; Monsch, A.U.; et al. A common brain network links development, aging, and vulnerability to disease. Proc. Natl. Acad. Sci. USA 2014, 111, 17648–17653. [Google Scholar] [CrossRef] [PubMed] [Green Version]
  45. Douaud, G.; Jbabdi, S.; Behrens, T.E.J.; Menke, R.A.; Gass, A.; Monsch, A.U.; Rao, A.; Whitcher, B.; Kindlmann, G.; Matthews, P.M.; et al. DTI measures in crossing-fibre areas: Increased diffusion anisotropy reveals early white matter alteration in MCI and mild Alzheimer’s disease. Neuroimage 2011, 55, 880–890. [Google Scholar] [CrossRef] [PubMed]
  46. Hane, F.T.; Robinson, M.; Lee, B.Y.; Bai, O.; Leonenko, Z.; Albert, M.S. Recent Progress in Alzheimer’s Disease Research, Part 3: Diagnosis and Treatment. J. Alzheimers Dis. 2017, 57, 645–665. [Google Scholar] [CrossRef] [PubMed]
  47. Herholz, K.; Ebmeier, K. Clinical amyloid imaging in Alzheimer’s disease. Lancet Neurol. 2011, 10, 667–670. [Google Scholar] [CrossRef]
  48. Teipel, S.; Drzezga, A.; Grothe, M.J.; Barthel, H.; Chételat, G.; Schuff, N.; Skudlarski, P.; Cavedo, E.; Frisoni, G.B.; Hoffmann, W.; et al. Multimodal imaging in Alzheimer’s disease: Validity and usefulness for early detection. Lancet Neurol. 2015, 14, 1037–1053. [Google Scholar] [CrossRef]
  49. Iadecola, C. Neurovascular regulation in the normal brain and in Alzheimer’s disease. Nat. Rev. Neurosci. 2004, 5, 347–360. [Google Scholar] [CrossRef] [PubMed]
  50. Prohovnik, I.; Mayeux, R.; Sackeim, H.A.; Smith, G.; Stern, Y.; Alderson, P.O. Cerebral perfusion as a diagnostic marker of early Alzheimer’s disease. Neurology 1988, 38, 931–937. [Google Scholar] [CrossRef] [PubMed]
  51. Alsop, D.C.; Dai, W.; Grossman, M.; Detre, J.A. Arterial Spin Labeling Blood Flow MRI: Its Role in the Early Characterization of Alzheimer’s Disease. J. Alzheimers Dis. 2010, 20, 871–880. [Google Scholar] [CrossRef] [PubMed]
  52. Alsop, D.C.; Detre, J.A.; Grossman, M. Assessment of cerebral blood flow in Alzheimer’s disease by spin-labeled magnetic resonance imaging. Ann. Neurol. 2000, 47, 93–100. [Google Scholar] [CrossRef]
  53. Musiek, E.S.; Chen, Y.; Korczykowski, M.; Saboury, B.; Martinez, P.M.; Reddin, J.S.; Alavi, A.; Kimberg, D.Y.; Wolk, D.A.; Juline, P.; et al. Direct comparison of fluorodeoxyglucose positron emission tomography and arterial spin labeling magnetic resonance imaging in Alzheimer’s disease. Alzheimers Dement. 2012, 8, 51–59. [Google Scholar] [CrossRef] [PubMed]
  54. Perani, D.; Di Piero, V.; Vallar, G.; Cappa, S.; Messa, C.; Bottini, G.; Berti, A.; Passafiume, D.; Scarlato, G.; Gerundini, P. Technetium-99m HM-PAO-SPECT study of regional cerebral perfusion in early Alzheimer’s disease. J. Nucl. Med. 1988, 29, 1507–1514. [Google Scholar] [PubMed]
  55. Parkes, L.M.; Rashid, W.; Chard, D.T.; Tofts, P.S. Normal cerebral perfusion measurements using arterial spin labeling: Reproducibility, stability, and age and gender effects. Magn. Reson. Med. 2004, 51, 736–743. [Google Scholar] [CrossRef] [PubMed] [Green Version]
  56. Du, A.T.; Jahng, G.H.; Hayasaka, S.; Kramer, J.H.; Rosen, H.J.; Gorno-Tempini, M.L.; Rankin, K.P.; Miller, B.L.; Weiner, M.W.; Schuff, N. Hypoperfusion in frontotemporal dementia and Alzheimer disease by arterial spin labeling MRI. Neurology 2006, 67, 1215–1220. [Google Scholar] [CrossRef] [PubMed] [Green Version]
  57. Johnson, N.A.; Jahng, G.-H.; Weiner, M.W.; Miller, B.L.; Chui, H.C.; Jagust, W.J.; Gorno-Tempini, M.L.; Schuff, N. Pattern of cerebral hypoperfusion in Alzheimer disease and mild cognitive impairment measured with arterial spin-labeling MR imaging: Initial experience. Radiology 2005, 234, 851–859. [Google Scholar] [CrossRef] [PubMed]
  58. Binnewijzend, M.A.A.; Kuijer, J.P.A.; Benedictus, M.R.; van der Flier, W.M.; Wink, A.M.; Wattjes, M.P.; van Berckel, B.N.M.; Scheltens, P.; Barkhof, F. Cerebral Blood Flow Measured with 3D Pseudocontinuous Arterial Spin-labeling MR Imaging in Alzheimer Disease and Mild Cognitive Impairment: A Marker for Disease Severity. Radiology 2013, 267, 221–230. [Google Scholar] [CrossRef] [PubMed]
  59. Leijenaar, J.F.; van Maurik, I.S.; Kuijer, J.; van der Flier, W.; Scheltens, P.; Barkhof, F.; Prins, N. Lower cerebral blood flow in subjects with Alzheimer’s dementia, mild cognitive impairment, and subjective cognitive decline using 2D phase-contrast MRI. Alzheimers Dement. Diagn. Assess. Dis. Monit. 2017. [Google Scholar] [CrossRef]
  60. Black, R.D.; Middleton, H.L.; Cates, G.D.; Cofer, G.P.; Driehuys, B.; Happer, W.; Hedlund, L.W.; Johnson, G.A.; Shattuck, M.D.; Swartz, J.C. In vivo He-3 MR images of guinea pig lungs. Radiology 1996, 199, 867–870. [Google Scholar] [CrossRef] [PubMed]
  61. Albert, M.S.; Cates, G.D.; Driehuys, B.; Happer, W.; Saam, B.; Springer, C.S.; Wishnia, A. Biological magnetic resonance imaging using laser-polarized 129Xe. Nature 1994, 370, 199–201. [Google Scholar] [CrossRef] [PubMed]
  62. Walker, T.; Happer, W. Spin-exchange optical pumping of noble-gas nuclei. Rev. Mod. Phys. 1997, 69, 629–642. [Google Scholar] [CrossRef]
  63. Happer, W. Optical Pumping. Rev. Mod. Phys. 1972, 44, 169–240. [Google Scholar] [CrossRef]
  64. Ardenkjaer-Larsen, J.H.; Fridlund, B.; Gram, A.; Hansson, G.; Hansson, L.; Lerche, M.H.; Servin, R.; Thaning, M.; Golman, K. Increase in signal-to-noise ratio of >10,000 times in liquid-state NMR. Proc. Natl. Acad. Sci. USA 2003, 100, 10158–10163. [Google Scholar] [CrossRef] [PubMed]
  65. Albert, M.S.; Hane, F.T. Hyperpolarized and Inert Gas MRI: From Technology to Applications in Research and Medicine; Elsevier: New York, NY, USA, 2017; ISBN 9780128036754. [Google Scholar]
  66. Day, S.E.; Kettunen, M.I.; Gallagher, F.A.; Hu, D.-E.; Lerche, M.; Wolber, J.; Golman, K.; Ardenkjaer-Larsen, J.H.; Brindle, K.M. Detecting tumor response to treatment using hyperpolarized 13C magnetic resonance imaging and spectroscopy. Nat. Med. 2007, 13, 1382–1387. [Google Scholar] [CrossRef] [PubMed]
  67. Golman, K.; Ardenkjaer-Larsen, J.H.; Petersson, J.S.; Mansson, S.; Leunbach, I. Molecular imaging with endogenous substances. Proc. Natl. Acad. Sci. USA 2003, 100, 10435–10439. [Google Scholar] [CrossRef] [PubMed] [Green Version]
  68. Kirby, M.; Pike, D.; Coxson, H.; McCormack, D.; Parraga, G. Hyperpolarized (3)He ventilation defects used to predict pulmonary exacerbations in mild to moderate chronic obstructive pulmonary disease. Radiology 2014, 273, 887–896. [Google Scholar] [CrossRef] [PubMed]
  69. Hane, F.T.; Imai, H.; Kimura, A.; Fujiwara, H.; Rao, M.; Wild, J.M.; Albert, M.S. Chapter 16—Brain Imaging Using Hyperpolarized Xenon MRI, 1st ed.; Elsevier: New York, NY, USA, 2017; ISBN 978-0-12-803675-4. [Google Scholar]
  70. Rao, M.R.; Stewart, N.J.; Griffiths, P.D.; Norquay, G.; Wild, J.M. Imaging Human Brain Perfusion with Inhaled Hyperpolarized 129Xe MR Imaging. Radiology 2017, 31, 162881. [Google Scholar] [CrossRef] [PubMed]
  71. Rao, M.; Stewart, N.J.; Norquay, G.; Griffiths, P.D.; Wild, J.M. High resolution spectroscopy and chemical shift imaging of hyperpolarized 129Xe dissolved in the human brain in vivo at 1.5 tesla. Magn. Reson. Med. 2016, 75, 2227–2234. [Google Scholar] [CrossRef] [PubMed]
  72. Jack, C.R.; Vemuri, P.; Wiste, H.J.; Weigand, S.D.; Aisen, P.S.; Trojanowski, J.Q.; Shaw, L.M.; Bernstein, M.A.; Petersen, R.C.; Weiner, M.W.; et al. Evidence for ordering of Alzheimer disease biomarkers. Arch. Neurol. 2011, 68, 1526–1235. [Google Scholar] [CrossRef] [PubMed]
  73. Olsson, B.; Lautner, R.; Andreasson, U.; Öhrfelt, A.; Portelius, E.; Bjerke, M.; Hölttä, M.; Rosén, C.; Olsson, C. Articles CSF and blood biomarkers for the diagnosis of Alzheimer’s disease: A systematic review and meta-analysis. Lancet Neurol. 2016, 15, 673–684. [Google Scholar] [CrossRef]
  74. Uttner, I.; Schurig, N.; von Arnim, C.A.F.; Lange-asschenfeldt, C.; Brettschneider, J.; Riepe, M.W.; Tumani, H. Amyloid beta 1–42 in cerebrospinal fluid is associated with cognitive plasticity. Psychiatry Res. 2011, 190, 132–136. [Google Scholar] [CrossRef] [PubMed]
  75. Nakamura, A.; Kaneko, N.; Villemagne, V.L.; Kato, T.; Doecke, J.; Doré, V.; Fowler, C.; Li, Q.-X.; Martins, R.; Rowe, C.; et al. High performance plasma amyloid-β biomarkers for Alzheimer’s disease. Nature 2018, 554, 249–254. [Google Scholar] [CrossRef] [PubMed]
  76. Kilian, W.; Seifert, F.; Rinneber, G. Dynamic NMR spectroscopy of hyperpolarized 129Xe in human brain analyzed by an uptake model. Magn. Reson. Med. 2004, 51, 843–847. [Google Scholar] [CrossRef] [PubMed]
  77. Martin, C.; Williams, R.; Gao, J.-H.; Nickerson, L.; Xiong, J.; Fox, P. The pharmokinetics of hyperpolarized xenon: Implications for cerebral MRI. J. Magn. Reson. Imag. 1997, 7, 848–854. [Google Scholar] [CrossRef]
  78. Sachdev, P.S.; Zhuang, L.; Braidy, N.; Wen, W. Is Alzheimer’s a disease of the white matter? Curr. Opin. Psychiatry 2013, 26, 244–251. [Google Scholar] [CrossRef] [PubMed]
  79. Jucker, M.; Walker, L.C. Pathogenic protein seeding in Alzheimer disease and other neurodegenerative disorders. Ann. Neurol. 2011, 70, 532–540. [Google Scholar] [CrossRef] [PubMed]
  80. Greenough, M.; Camakaris, J.; Bush, A.I. Metal dyshomeostasis and oxidative stress in Alzheimer’s disease. Neurochem. Int. 2013, 62, 540–555. [Google Scholar] [CrossRef] [PubMed]
  81. Curtain, C.C.; Ali, F.; Volitakis, I.; Cherny, R.A.; Norton, R.S.; Beyreuther, K.; Barrow, C.J.; Masters, C.L.; Bush, A.I.; Barnham, K.J. Alzheimer’s Disease Amyloid-β Binds Copper and Zinc to Generate an Allosterically Ordered Membrane-penetrating Structure Containing Superoxide Dismutase-like Subunits. J. Biol. Chem. 2001, 276, 20466–20473. [Google Scholar] [CrossRef] [PubMed]
  82. Frederickson, C.J.; Koh, J.-Y.; Bush, A.I. The neurobiology of zinc in health and disease. Nat. Rev. Neurosci. 2005, 6, 449–462. [Google Scholar] [CrossRef] [PubMed]
  83. Bush, A.; Pettingell, W.; Multhaup, G.; Paradis, M.; Vonsattel, J.; Gusella, J.; Beyreuther, K.; Masters, C.; Tanzi, R. Rapid induction of Alzheimer A beta amyloid formation by zinc. Science 1994, 265, 1464–1467. [Google Scholar] [CrossRef] [PubMed]
  84. Drolle, E.; Hane, F.; Lee, B.; Leonenko, Z. Atomic force microscopy to study molecular mechanisms of amyloid fibril formation and toxicity in Alzheimer’s disease. Drug Metab. Rev. 2014, 46, 207–223. [Google Scholar] [CrossRef] [PubMed]
  85. Burke, K.A.; Yates, E.A.; Legleiter, J.; Montie, H.L.; Jefferson, T. Biophysical insights into how surfaces, including lipid membranes, modulate protein aggregation related to neurodegeneration. Front. Neurol. 2013, 4, 17. [Google Scholar] [CrossRef] [PubMed]
  86. Burke, K.; Yates, E.; Legleiter, J. Amyloid-forming proteins alter the local mechanical properties of lipid membranes. Biochemistry 2013, 52, 808–817. [Google Scholar] [CrossRef] [PubMed]
  87. Hane, F.; Drolle, E.; Gaikwad, R.; Faught, E.; Leonenko, Z. Amyloid-beta aggregation on model lipid membranes: An atomic force microscopy study. J. Alzheimers Dis. 2011, 26, 485–494. [Google Scholar] [CrossRef] [PubMed]
  88. Dante, S.; Hauss, T.; Steitz, R.; Canale, C.; Dencher, N.A. Nanoscale structural and mechanical effects of beta-amyloid (1–42) on polymer cushioned membranes: A combined study by neutron reflectometry and AFM Force Spectroscopy. Biochim. Biophys. Acta Biomembr. 2011, 1808, 2646–2655. [Google Scholar] [CrossRef] [PubMed]
  89. Drolle, E.; Negoda, A.; Hammond, K.; Pavlov, E.; Leonenko, Z. Changes in lipid membranes may trigger amyloid toxicity in Alzheimer’s disease. PLoS ONE 2017, 12, e0182194. [Google Scholar] [CrossRef] [PubMed]
  90. Montagne, A.; Zhao, Z.; Zlokovic, B.V. Alzheimer’s disease: A matter of blood-brain barrier dysfunction? J. Exp. Med. 2017, 214, 3151–3169. [Google Scholar] [CrossRef] [PubMed]
Figure 1. (A) Representative 129Xe MRS of healthy controls and AD participants. (B) Signal intensity of GM, WM, and the ratio of GM to WM in healthy controls compared to AD participants. a.u. = arbitrary units.
Diagnostics 08 00041 g001aDiagnostics 08 00041 g001b
Figure 2. (A) Stack plot of dynamic 129Xe NMR spectra for healthy controls (blue) and AD patients (red). (B) Topographic “streak” plot of (A) depicting the NMR dynamic spectra from the top with SNR in “hotter” colors. Notice a higher SNR in AD patients for a longer time than that of the healthy controls. SNR of 129Xe-WM (C) and 129Xe-GM (D) as a function of time for healthy controls (blue) and AD participants (red). The participants inhaled 500 mL of HP 129Xe and held their breath for 20 s. 129Xe MRS from the brain region was acquired every 2 s. Notice an increase in 129Xe signal after approximately 10 s as the 129Xe reached the brain. At 20 s, the participant exhaled and the 129Xe signal began to decrease at different rates for AD participants vs. healthy controls for WM and GM.
Diagnostics 08 00041 g002
Figure 3. (A) Normalized 129Xe retention at 60 s after the breath-hold for Xe-WM and Xe-GM. (B) Xenon washout parameter for gray matter and white matter.
Diagnostics 08 00041 g003
Figure 4. Axial and sagittal 129Xe MRI of healthy controls and AD participants. An observably higher SNR was obtained for healthy controls relative to AD participants.
Diagnostics 08 00041 g004
Figure 5. Xenon washout parameter maps of healthy controls age-matched to AD patients overlaid on T2W anatomical images.
Diagnostics 08 00041 g005
Table 1. Statistics of healthy controls & Alzheimer’s disease (AD) Characteristics ± SD.
Healthy Controls (n = 4)Alzheimer’s Participants (n = 4)
Mean Age (years)70.0 ± 4.571.3 ± 6.2
Age of AD DiagnosisN/A64.8 ± 4.3
Sex2 males/2 females3 males/1 female
MoCA Score28 ± 121 ± 3
Norm. Xe-WM signal @ 60 s0.200 ± 0.01630.458 ± 0.0531
Norm. Xe-GM signal @ 60 s0.174 ± 0.02520.465 ± 0.569
Xe Washout Parameter–WM0.073 ± 0.0210.051 ± 0.025
Xe Washout Parameter−GM0.094 ± 0.0210.055 ± 0.029

