1. Introduction
Effective symptom management is a critical component of oncology care, directly influencing quality of life and treatment adherence. Individuals undergoing chemotherapy often experience a range of symptoms, including pain, fatigue, nausea, vomiting, and cognitive disturbances, which vary based on cancer type, disease stage, and treatment regimen [
1]. According to the National Cancer Institute, between 20% and 50% of those receiving treatment experience pain, while fatigue is reported in 14% to 96% of cases [
2]. Addressing these symptoms requires a multidisciplinary approach integrating evidence-based strategies, digital health technologies, and machine learning techniques [
3].
Studies have demonstrated that proactive symptom monitoring improves outcomes by enabling early interventions and reducing the severity of treatment-related side effects [
4,
5,
6]. Chemotherapy, while a cornerstone of cancer treatment, often leads to severe adverse effects that compromise well-being, including extreme fatigue, gastrointestinal issues, immune suppression, and neurotoxicity [
7]. These side effects frequently contribute to treatment nonadherence, which impacts overall survival and disease progression [
1]. Recent studies indicate that integrating self-reported symptoms into clinical workflows enhances symptom detection, extends survival, and improves overall care [
8].
The rapid advancement of digital health technologies has facilitated real-time symptom monitoring, allowing automated symptom tracking and timely clinical interventions [
9]. Telemonitoring systems have gained widespread acceptance among individuals with chronic conditions and seniors [
10,
11,
12], providing a structured means for tracking symptom deterioration and alerting healthcare providers to potential complications [
13,
14]. The implementation of these digital systems has demonstrated significant potential in addressing the evolving and complex needs of individuals undergoing treatment, their caregivers, and healthcare providers [
15]. However, a major challenge remains in utilizing self-reported outcomes to predict symptom escalation and determine the optimal timing for clinical intervention [
16]. Traditional symptom management protocols often lack specificity, making it difficult for healthcare providers to decide when interventions are necessary [
17,
18].
Literature Review
There is a crucial demand for novel approaches that provide seamless and ongoing support to improve symptom oversight in patients with cancer. To address these limitations, machine learning (ML) and deep learning (DL) models have emerged as powerful tools for predicting symptom escalation [
19,
20]. Among these, Long Short-Term Memory (LSTM) networks and Convolutional Neural Networks (CNNs) have demonstrated substantial promise in analyzing longitudinal self-reported data [
21,
22,
23,
24]. LSTM models effectively capture temporal dependencies in sequential symptom data, identifying early patterns indicative of impending deterioration [
25,
26,
27,
28]. In contrast, CNNs leverage spatial feature extraction to identify patterns within structured symptom datasets, offering an alternative approach to symptom trajectory modeling [
29,
30,
31].
Several studies have explored the potential of deep learning to predict symptom progression based on self-reported outcomes [
32,
33,
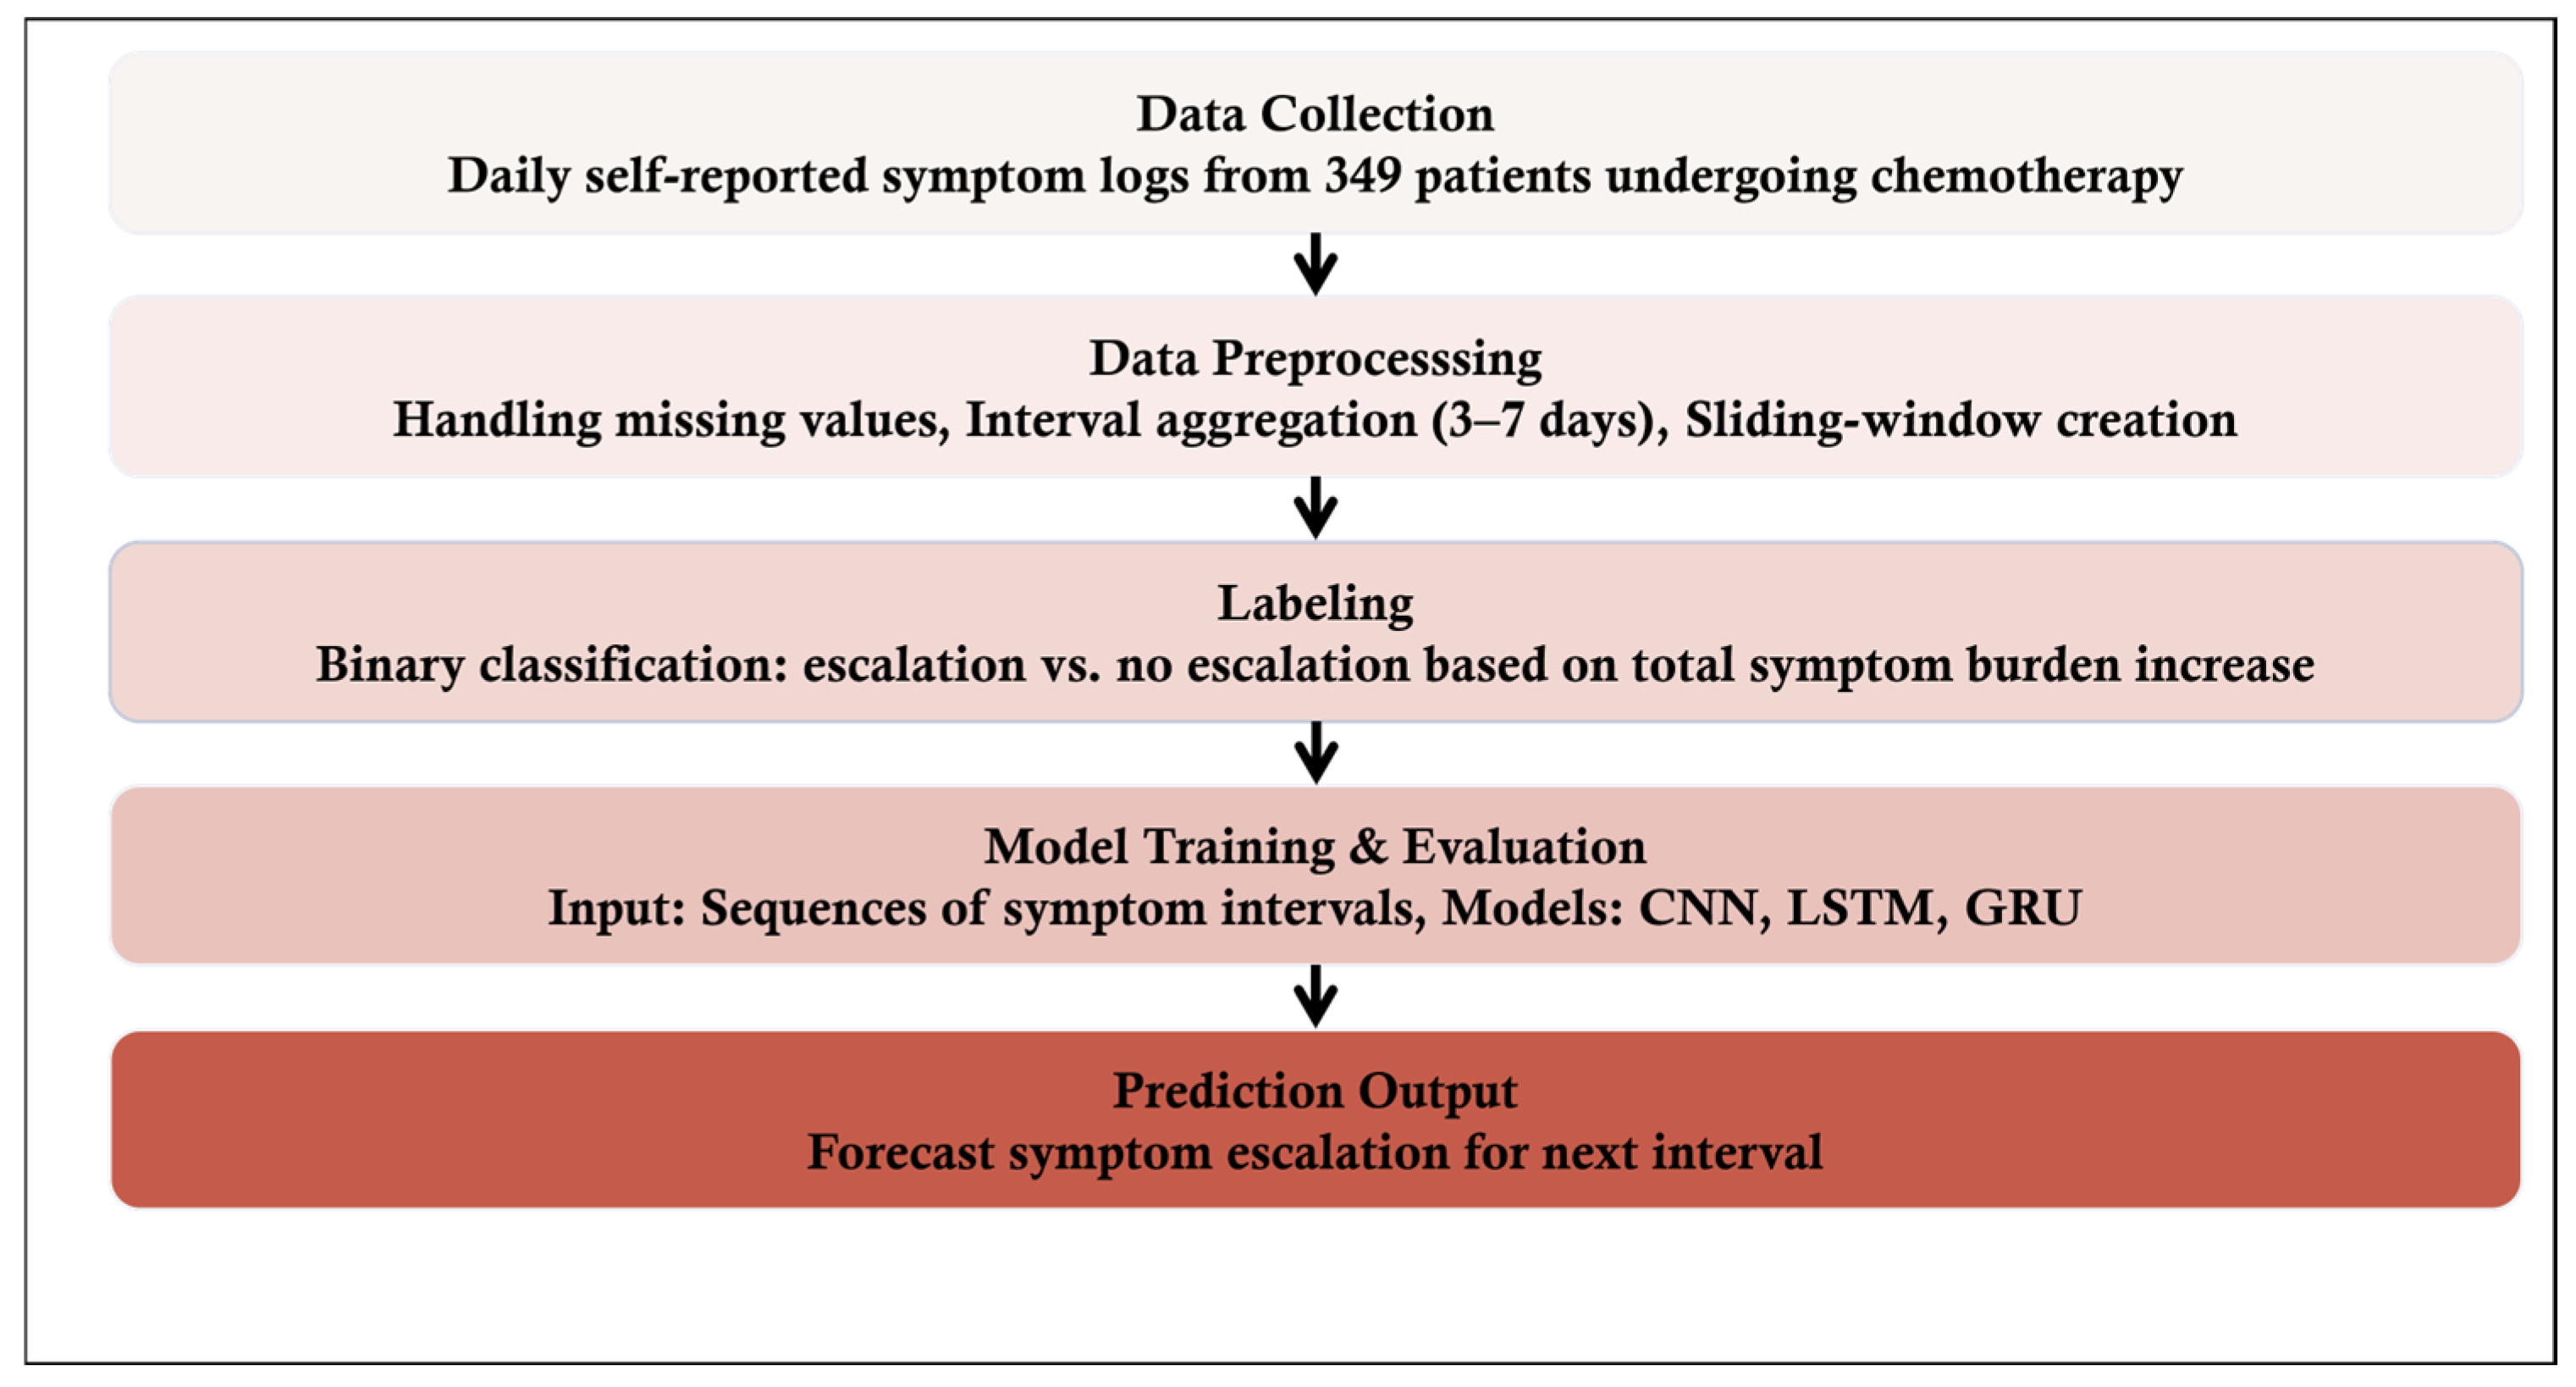
34]. This study builds on prior research by investigating the predictive capabilities of CNN, LSTM, and Gated Recurrent Unit (GRU) models in forecasting chemotherapy-related symptom escalation. By analyzing self-reported symptom data across varying time intervals (3 to 7 days), this study evaluates the effectiveness of each model in detecting significant symptom escalation. The findings aim to enhance symptom prediction accuracy, allowing healthcare providers to intervene earlier and personalize treatment strategies.
By integrating deep learning models into digital health systems, clinicians can receive real-time alerts on symptom escalation, enabling proactive management and potentially improving overall treatment outcomes. This study makes several key contributions to the growing field of AI-driven healthcare: (1) it evaluates and compares the performance of three deep learning models—CNN, LSTM, and GRU—using high-frequency, real-world symptom data from chemotherapy patients; (2) it explores varying time intervals and a sliding-window approach to optimize temporal prediction; and (3) it distinguishes between physical and mental symptoms to support more targeted interventions. This research contributes to the growing field of AI-driven healthcare by demonstrating how predictive models can be leveraged to optimize symptom monitoring, reduce distress, and improve adherence to therapy.
2. Methods
Data Collection and Preprocessing
This study utilized data from the Symptom Care at Home Study [
35], comprising a total of 26,599 symptom records collected from individuals undergoing chemotherapy. The dataset included a diverse range of participants with variations in age, gender, ethnicity, and socioeconomic status.
Table 1 presents a comprehensive demographic summary of the study population. The most common diagnoses are breast cancer (156 participants), lung cancer (61 participants), and ovarian cancer (36 participants), followed by other conditions such as colorectal (26), pancreatic (21), and head and neck cancers (13).
To ensure consistent and reliable data collection, participants were instructed to record their symptoms daily using a technology-based system. This allows continuous tracking of symptom progression. The dataset included 12 key symptoms, categorized into two primary groups:
Physical Symptoms: Nausea/vomiting, sore mouth, diarrhea, fatigue, hair loss/weight change, pain/discomfort, numbness/tingling, and fever-related distress. These symptoms reflect physiological responses to chemotherapy and cancer-related effects.
Mental Symptoms: Trouble thinking, feeling blue or nervous/anxious, and trouble sleeping. These symptoms represent cognitive and emotional challenges associated with treatment.
For each symptom, two quantitative metrics were recorded:
Severity (rated from 1 to 10, where 10 represents the most intense experience).
Distress (rated from 1 to 10, indicating the level of emotional burden associated with the symptom).
If a symptom was not reported on a given day, both metrics were recorded as zero. Fever was an exception, where only distress values were recorded. A daily symptom burden score was computed by summing all severity and distress values, resulting in a total possible score range of 0 to 230 per day.
The dataset included 349 participants, each undergoing an average of three chemotherapy cycles, with a median participation period of 81 days. Missing values in the dataset, particularly for symptom severity and distress, were addressed using linear interpolation, which estimated values based on adjacent days’ records. This approach ensured the continuity and reliability of data without introducing artificial fluctuations.
Due to the highly imbalanced nature of the dataset, where 84% of recorded instances indicated no symptom escalation, we implemented a resampling strategy to enhance the model’s ability to detect meaningful symptom variations. Symptom data were aggregated into multi-day intervals (3 to 7 days), thereby reducing the number of zero scores while preserving temporal progression. This interval-based approach enabled a more balanced distribution of data, allowing for improved model training and detection of symptom escalation trends.
3. Resampling and Interval-Based Data Structuring
To optimize model performance, symptom data were grouped into intervals of 3, 4, 5, 6, or 7 days. Within each interval, symptom scores were averaged to capture overall symptom trends, rather than day-to-day fluctuations, while maintaining temporal relationships.
To ensure statistical robustness, only individuals with at least (n × 7) days of continuous data were included in the analysis, where n represents the interval length. For example, for a 3-day interval, participants needed at least 21 days of data to be included in the model. Individuals with insufficient records were excluded to ensure uniformity in training and testing datasets. Shorter intervals (e.g., 3 days) retained high temporal resolution, but increased data variability and longer intervals (e.g., 7 days) provided smoother trends but potentially masked short-term symptom escalations.
A binary classification variable was assigned for each interval: 1 (escalation detected) if the total symptom burden score increased beyond a predefined threshold and 0 (no escalation) if the symptom burden remained stable or decreased.
The predictive framework used data from past intervals (e.g., intervals 1–3) to forecast symptom escalation in the next interval (e.g., interval 4). This sliding-window approach ensured that the model learned from sequential patterns in symptom progression.
4. Deep Learning Model Architecture
Deep learning models were selected for their strong performance in modeling complex and temporal relationships in patient-reported outcome data. Long Short-Term Memory (LSTM) and Gated Recurrent Unit (GRU) are types of recurrent neural networks (RNNs) designed to capture sequential dependencies and long-term patterns across time-series data, making them well-suited for predicting symptom progression. Convolutional Neural Networks (CNNs), although originally developed for image analysis, have shown strong performance in extracting features from structured time-series data due to their ability to recognize localized patterns. These models were chosen to evaluate different learning mechanisms and identify the most effective approach for forecasting physical and mental symptom escalation during chemotherapy. The architectural details of each deep learning model are described in the following subsections.
4.1. Long Short-Term Memory (LSTM)
LSTM networks are designed to capture longitudinal dependencies within sequential data, making them well-suited for symptom prediction. The architecture included the following:
A 50-unit LSTM layer to process temporal trends.
A dropout layer (0.2 probability) to mitigate overfitting.
A fully connected (dense) layer with sigmoid activation for binary classification.
Binary cross-entropy loss function with the Adam optimizer for efficient learning.
4.2. Convolutional Neural Network (CNN)
CNNs were used to detect localized patterns in symptom data, recognizing critical escalation features across intervals. The model structure comprised the following:
A 1D convolutional layer (64 filters, kernel size = 3) for feature extraction.
Max-pooling and flattening layers to reduce data dimensionality.
Dense layers with ReLU activation for feature refinement.
A dropout layer for regularization.
A sigmoid-activated output layer for binary classification.
4.3. Gated Recurrent Unit (GRU)
GRUs are an efficient alternative to LSTMs, designed to process sequential patterns with fewer computational requirements. The model included the following:
A 50-unit GRU layer for learning temporal dependencies.
Dropout regularization to prevent overfitting.
A final sigmoid-activated layer for binary classification.
Each model was trained using 80% of the dataset, while 20% was reserved for evaluation. Performance was assessed using key classification metrics, including accuracy, precision, recall, F1 score, and area under the receiver operating characteristic curve (AUC).
An overview of the proposed symptom prediction framework is illustrated in
Figure 1.
5. Ethical Considerations
This study was conducted in compliance with ethical research standards and received Institutional Review Board (IRB) approval from the University of Utah (IRB protocol: IRB_00017472).
6. Results
The performance of deep learning models (CNN, LSTM, and GRU) was assessed for predicting physical and mental symptom escalation in chemotherapy patients. The dataset was analyzed using different interval lengths (3, 4, 5, 6, and 7 days), with model evaluation metrics including accuracy, precision, recall, F1 score, and AUC (area under the curve). A summary of the results across models and time intervals is provided in
Table 2,
Table 3,
Table 4,
Table 5,
Table 6 and
Table 7.
For predicting physical symptom escalation, the 3-day interval consistently demonstrated the highest predictive accuracy across all models. The CNN, LSTM, and GRU models exhibited distinct strengths across the assessed metrics (
Table 2,
Table 3 and
Table 4). Among them, GRU demonstrated the highest overall performance, achieving an accuracy of 80.05% and an F1 score of 82.50% at the 3-day interval, making it the most effective model for short-term symptom prediction.
For mental symptoms,
Table 5,
Table 6 and
Table 7 present the performance metrics of each model across different interval lengths. Among the models, CNN exhibited a slight advantage in AUC, achieving 77.26%, whereas LSTM outperformed the others in recall (63.45%) and F1 score (67.23%) at the 3-day interval, indicating its effectiveness in capturing symptom escalation patterns over short-term periods.
All models demonstrated comparable effectiveness in predicting both physical and mental symptom escalation, with their highest performance metrics observed at the 3-day interval. As the interval length increased, a decline in predictive performance was evident across all models. While CNN, LSTM, and GRU exhibited slight variations in specific metrics, their overall performance remained relatively similar, suggesting that no single model consistently outperformed the others across all evaluation criteria.
7. Discussion
The findings of this study highlight the potential of deep learning models—particularly LSTM, CNN, and GRU—in predicting symptom escalation among chemotherapy patients. Model performance was strongest when using shorter intervals (n = 3 days). However, as the interval length increased, accuracy and recall declined across all models, though precision remained relatively stable. These results suggest that shorter intervals are more effective for tracking rapid symptom fluctuations, a common challenge in chemotherapy symptom management.
The comparative analysis of these models underscores their complementary strengths. While LSTMs and GRUs excel at learning sequential dependencies in symptom progression, CNNs enhance feature extraction, potentially improving prediction accuracy in structured patient-generated data. This multi-model approach can be adapted for various clinical applications, particularly in continuous symptom monitoring scenarios where early intervention is critical. Implementing these models in digital health systems could enable real-time symptom tracking and automated alerts for healthcare providers, facilitating proactive interventions for patients at high risk of symptom escalation. This aligns with the growing trend of integrating AI into oncological care, where early symptom management has been shown to improve clinical outcomes and patient satisfaction.
A key challenge in this study was the highly imbalanced dataset, with 84% of recorded symptom instances showing no escalation. To address this, symptom data were aggregated into multi-day intervals, reducing the dominance of zero scores and improving model training. However, the observed decline in predictive performance for longer intervals suggests that additional strategies are needed to manage class imbalance effectively. Future research should explore techniques such as oversampling, synthetic data generation, and advanced resampling strategies to further enhance the models’ ability to detect symptom escalation across varying time frames.
Although our study included 349 participants, the dataset encompassed over 26,000 daily symptom entries, offering substantial longitudinal data for model training and evaluation. The application of temporal aggregation and sliding-window techniques enabled efficient use of this data by capturing dynamic symptom trends over time. However, we acknowledge that a larger and more demographically diverse participant pool could enhance the generalizability and robustness of the models.
This study focused on deep learning models due to their proven effectiveness in capturing temporal dependencies and complex nonlinear patterns in sequential health data. These architectures are particularly well-suited for modeling symptom progression over time, which is critical in the context of chemotherapy monitoring. While traditional machine learning models such as Random Forest and Support Vector Machines have shown utility in various clinical prediction tasks, they are often limited in their ability to handle time-series data without extensive feature engineering. Future work will include benchmarking against these classical models to provide a more comprehensive comparison and assess the added value of deep learning approaches in symptom prediction.
Our findings align closely with previous studies highlighting the potential of deep learning in predictive modeling of sequential patient-generated data [
31,
32,
33,
34,
36]. Despite the promising results, several limitations should be considered. This study relied on self-reported symptom data, which may be subject to biases such as underreporting or inconsistencies in daily logging. Future research could integrate objective physiological markers (e.g., heart rate, activity levels) [
37,
38] and data from electronic health records (EHRs) [
24,
39] to supplement self-reported symptoms, enhancing prediction accuracy and robustness. Enrichment of self-reported symptoms by real-world data extracted from electronic health records (EHRs) can help improve the predictive model performance [
40,
41]. Clinical decision support for early identification of cancer symptom deterioration embedded into EHRs can potentially improve the quality of life of cancer patients undergoing chemotherapy [
42,
43]. Additionally, this study focused on chemotherapy patients, and further investigation is needed to assess the generalizability of these models across different cancer types and treatment regimens and broader patient populations [
44].
8. Conclusions
This study demonstrates the effectiveness of deep learning models—CNN, LSTM, and GRU—in predicting symptom escalation in chemotherapy patients. By leveraging AI-driven symptom monitoring, healthcare providers can deliver more personalized, proactive care, potentially improving patient outcomes and quality of life. By integrating these models into digital health platforms or electronic health records, clinicians could receive real-time alerts, enabling timely interventions that may prevent complications, improve patient comfort, and support treatment adherence. Future work should focus on refining these models for extended time intervals, addressing data imbalance more effectively, and exploring their applicability across diverse clinical settings to maximize their impact on patient care.
Author Contributions
Methodology, J.F. and A.S.; Software, A.S.; Validation, J.F. and K.M.; Formal analysis, A.S.; Investigation, A.S.; Resources, J.F. and K.M.; Data curation, A.S., C.E. and K.M.; Writing—original draft, A.S.; Writing—review & editing, J.F.; Supervision, J.F. and K.M.; Project administration, A.S. and C.E.; Funding acquisition, J.F. and K.M. All authors have read and agreed to the published version of the manuscript.
Funding
The project was in part funded by the contract HT9425-24-1-0264-P00001 from the Congressionally Directed Medical Research Program (CDMRP).
Institutional Review Board Statement
This study was conducted in compliance with ethical research standards and received Institutional Review Board (IRB) approval from the University of Utah (IRB protocol: IRB_00017472, approval date 21 September 2019).
Informed Consent Statement
Informed consent was obtained from all subjects involved in the study.
Data Availability Statement
The data presented in this study are available on request from the corresponding author.
Conflicts of Interest
The authors declare no conflict of interest.
References
- Lizán, L.; Pérez-Carbonell, L.; Comellas, M. Additional Value of Patient-Reported Symptom Monitoring in Cancer Care: A Systematic Review of the Literature. Cancers 2021, 13, 4615. [Google Scholar] [CrossRef] [PubMed]
- Sanft, T.; Day, A.; Ansbaugh, S.; Armenian, S.; Baker, K.S.; Ballinger, T.; Demark-Wahnefried, W.; Dickinson, K.; Fairman, N.P.; Felciano, J.; et al. NCCN Guidelines® Insights: Survivorship, Version 1.2023. J. Natl. Compr. Canc Netw. 2023, 21, 792–803. [Google Scholar] [CrossRef] [PubMed]
- Ream, E.; Hughes, A.E.; Cox, A.; Skarparis, K.; Richardson, A.; Pedersen, V.H.; Wiseman, T.; Forbes, A.; Bryant, A. Telephone interventions for symptom management in adults with cancer. Cochrane Database Syst. Rev. 2020, 6, CD007568. [Google Scholar] [CrossRef] [PubMed]
- Kamdar, M.; Jethwani, K.; Centi, A.J.; Agboola, S.; Fischer, N.; Traeger, L.; Rinaldi, S.; Strand, J.; Ritchie, C.; Temel, J.S.; et al. A Digital Therapeutic Application (ePAL) to Manage Pain in Patients with Advanced Cancer: A Randomized Controlled Trial. J. Pain Symptom Manag. 2024, 68, 261–271. [Google Scholar] [CrossRef] [PubMed]
- Agboola, S.; Kamdar, M.; Flanagan, C.; Searl, M.; Traeger, L.; Kvedar, J.; Jethwani, K. Pain management in cancer patients using a mobile app: Study design of a randomized controlled trial. JMIR Res. Protoc. 2014, 3, e76. [Google Scholar] [CrossRef] [PubMed] [PubMed Central]
- Basch, E.; Schrag, D.; Henson, S.; Jansen, J.; Ginos, B.; Stover, A.M.; Carr, P.; Spears, P.A.; Jonsson, M.; Deal, A.M.; et al. Effect of Electronic Symptom Monitoring on Patient-Reported Outcomes Among Patients with Metastatic Cancer: A Randomized Clinical Trial. JAMA 2022, 327, 2413–2422. [Google Scholar] [CrossRef] [PubMed] [PubMed Central]
- Daly, B.; Nicholas, K.; Flynn, J.; Silva, N.; Panageas, K.; Mao, J.J.; Gazit, L.; Gorenshteyn, D.; Sokolowski, S.; Newman, T.; et al. Analysis of a Remote Monitoring Program for Symptoms Among Adults with Cancer Receiving Antineoplastic Therapy. JAMA Netw. Open 2022, 5, e221078. [Google Scholar] [CrossRef]
- Basch, E.; Leahy, A.B.; Dueck, A.C. Benefits of Digital Symptom Monitoring with Patient-Reported Outcomes During Adjuvant Cancer Treatment. J. Clin. Oncol. 2021, 39, 701–703. [Google Scholar] [CrossRef]
- Patt, D.A.; Patel, A.M.; Bhardwaj, A.; Hudson, K.E.; Christman, A.; Amondikar, N.; Escudier, S.M.; Townsend, S.; Books, H.; Basch, E. Impact of Remote Symptom Monitoring with Electronic Patient-Reported Outcomes on Hospitalization, Survival, and Cost in Community Oncology Practice: The Texas Two-Step Study. JCO Clin. Cancer Inform. 2023, 7, e2300182. [Google Scholar] [CrossRef]
- Liljeroos, M.; Arkkukangas, M. Implementation of Telemonitoring in Health Care: Facilitators and Barriers for Using eHealth for Older Adults with Chronic Conditions. Risk Manag. Healthc. Policy 2023, 16, 43–53. [Google Scholar] [CrossRef] [PubMed] [PubMed Central]
- Aggelidis, X.; Kritikou, M.; Makris, M.; Miligkos, M.; Papapostolou, N.; Papadopoulos, N.G.; Xepapadaki, P. Tele-Monitoring Applications in Respiratory Allergy. J. Clin. Med. 2024, 13, 898. [Google Scholar] [CrossRef] [PubMed] [PubMed Central]
- Ezeamii, V.C.; Okobi, O.E.; Wambai-Sani, H.; Perera, G.S.; Zaynieva, S.; Okonkwo, C.C.; Ohaiba, M.M.; William-Enemali, P.C.; Obodo, O.R.; Obiefuna, N.G. Revolutionizing Healthcare: How Telemedicine Is Improving Patient Outcomes and Expanding Access to Care. Cureus 2024, 16, e63881. [Google Scholar] [CrossRef] [PubMed] [PubMed Central]
- Zini, E.M.; Lanzola, G.; Quaglini, S.; Bossi, P.; Licitra, L.; Resteghini, C. A pilot study of a smartphone-based monitoring in-tervention on head and neck cancer patients undergoing concurrent chemo-radiotherapy. Int. J. Med. Inform. 2019, 129, 404–412. [Google Scholar] [CrossRef] [PubMed]
- Rusli, E.; Wujcik, D.; Galaznik, A. Remote Symptom Alerts and Patient-Reported Outcomes (PROS) in Real-World Breast Cancer Practice: Innovative Data to Derive Symptom Burden and Quality of Life. Bioengineering 2024, 11, 846. [Google Scholar] [CrossRef] [PubMed] [PubMed Central]
- Fraterman, I.; Wollersheim, B.M.; Tibollo, V.; Glaser, S.L.C.; Medlock, S.; Cornet, R.; Gabetta, M.; Gisko, V.; Barkan, E.; di Flora, N.; et al. An eHealth App (CAPABLE) Providing Symptom Monitoring, Well-Being Interventions, and Educational Material for Patients with Melanoma Treated with Immune Checkpoint Inhibitors: Protocol for an Exploratory Intervention Trial. JMIR Res. Protoc. 2023, 12, e49252. [Google Scholar] [CrossRef] [PubMed] [PubMed Central]
- Snyder, C.F.; Blackford, A.L.; Okuyama, T.; Akechi, T.; Yamashita, H.; Toyama, T.; Carducci, M.A.; Wu, A.W. Using the EORTC-QLQC30 in clinical practice for patient management: Identifying scores requiring a clinician’s attention. Qual. Life Res. 2013, 22, 2685–2691. [Google Scholar] [CrossRef]
- Jeon, S.; Given, C.W.; Sikorskii, A.; Given, B. The utility of screening in the design of trials for symptom management in cancer. J. Pain. Symptom Manag. 2009, 38, 606–614. [Google Scholar] [CrossRef]
- Oldenmenger, W.H.; de Raaf, P.J.; de Klerk, C.; van der Rijt, C.C. Cut points on 0–10 numeric rating scales for symptoms included in the Edmonton Symptom Assessment Scale in cancer patients: A systematic review. J. Pain. Symptom Manag. 2013, 45, 1083–1093. [Google Scholar] [CrossRef]
- Zhang, J.; Lv, X.N.; Wang, M.; Zhang, J.; Qi, F. Continuous nursing symptom management in cancer chemotherapy patients using deep learning. Sci. Rep. 2025, 15, 7990. [Google Scholar] [CrossRef]
- Moraza, J.; Esteban-Aizpiri, C.; Aramburu, A.; García, P.; Sancho, F.; Resino, S.; Chasco, L.; Conde, F.J.; Gutiérrez, J.A.; Santano, D.; et al. Using machine learning to predict deterioration of symptoms in COPD patients within a telemonitoring program. Sci. Rep. 2025, 15, 7064. [Google Scholar] [CrossRef]
- Wang, Y.; Van Dijk, L.; Mohamed, A.S.R.; Fuller, C.D.; Zhang, X.; Marai, G.E.; Canahuate, G. Predicting late symptoms of head and neck cancer treatment using LSTM and patient reported outcomes. In Proceedings of the 25th International Database Engineering & Applications Symposium, Montreal, QC, Canada, 14–16 July 2021; Volume 2021, pp. 273–279. [Google Scholar] [CrossRef] [PubMed] [PubMed Central]
- Wang, Y.; Van Dijk, L.; Mohamed, A.S.R.; Naser, M.; Fuller, C.D.; Zhang, X.; Marai, G.E.; Canahuate, G. Improving Prediction of Late Symptoms using LSTM and Patient-reported Outcomes for Head and Neck Cancer Patients. In Proceedings of the 2023 IEEE 11th International Conference on Healthcare Informatics (ICHI), Houston, TX, USA, 26–29 June 2023; Volume 2023, pp. 292–300. [Google Scholar] [CrossRef] [PubMed] [PubMed Central]
- Badura, A.; Bienkowska, M.; Mysliwiec, A.; Pietka, E. Continuous Short-Term Pain Assessment in Temporomandibular Joint Therapy Using LSTM Models Supported by Heat-Induced Pain Data Patterns. IEEE Trans. Neural Syst. Rehabil. Eng. 2024, 32, 3565–3576. [Google Scholar] [CrossRef] [PubMed]
- Lindvall, C.; Deng, C.Y.; Agaronnik, N.D.; Kwok, A.; Samineni, S.; Umeton, R.; Mackie-Jenkins, W.; Kehl, K.L.; Tulsky, J.A.; Enzinger, A.C. Deep Learning for Cancer Symptoms Monitoring on the Basis of Electronic Health Record Unstructured Clinical Notes. JCO Clin. Cancer Inform. 2022, 6, e2100136. [Google Scholar] [CrossRef] [PubMed] [PubMed Central]
- Chae, S.; Street, W.N.; Ramaraju, N.; Gilbertson-White, S. Prediction of cancer symptom trajectory using longitudinal electronic health record data and long short-term memory neural network. JCO Clin. Cancer Inform. 2024, 8, e2300039. [Google Scholar] [CrossRef]
- Zeinali, N.; Youn, N.; Albashayreh, A.; Fan, W.; Gilbertson White, S. Machine Learning Approaches to Predict Symptoms in People with Cancer: Systematic Review. JMIR Cancer 2024, 10, e52322. [Google Scholar] [CrossRef] [PubMed] [PubMed Central]
- Papachristou, N.; Puschmann, D.; Barnaghi, P.; Cooper, B.; Hu, X.; Maguire, R.; Apostolidis, K.; Conley, Y.P.; Hammer, M.; Katsaragakis, S.; et al. Learning from data to predict future symptoms of oncology patients. PLoS ONE 2018, 13, e0208808. [Google Scholar] [CrossRef] [PubMed] [PubMed Central]
- Pan, L.C.; Wu, X.R.; Lu, Y.; Zhang, H.Q.; Zhou, Y.L.; Liu, X.; Liu, S.L.; Yan, Q.Y. Artificial intelligence empowered digital health technologies in cancer survivorship care: A scoping review. Asia Pac. J. Oncol. Nurs. 2022, 9, 100127. [Google Scholar] [CrossRef] [PubMed] [PubMed Central]
- Pinzon-Arenas, J.O.; Kong, Y.; Chon, K.H.; Posada-Quintero, H.F. Design and Evaluation of Deep Learning Models for Continuous Acute Pain Detection Based on Phasic Electrodermal Activity. IEEE J. Biomed. Health Inform. 2023, 27, 4250–4260. [Google Scholar] [CrossRef] [PubMed]
- Metzger, M.H.; Gadji, A.; Haj Salah, N.; Kane, W.; Boue, F. Deep Learning Methods for Detecting Side Effects of Cancer Chemotherapies Reported in a Remote Monitoring Web Application. Stud. Health Technol. Inform. 2022, 294, 880–881. [Google Scholar] [CrossRef] [PubMed]
- Verma, S.; Raj, S.; Kumar, S.; Raj, S.; Rautaray, S.S.; Pandey, M. Disease Predictive System Based on Symptom Analysis Using ML Algorithm. In Smart Systems: Innovations in Computing; Somani, A.K., Mundra, A., Gupta, R.K., Bhattacharya, S., Mazumdar, A.P., Eds.; SSIC 2023; Smart Innovation, Systems and Technologies; Springer: Singapore, 2024; Volume 392. [Google Scholar] [CrossRef]
- Bhati, R.; Jones, J.; Durand, A. Interpret Your Care: Predicting the Evolution of Symptoms for Cancer Patients. arXiv 2023, arXiv:2302.09659. [Google Scholar] [CrossRef]
- Sannala, G.S.; Rohith, K.V.G.; Vyas, A.G.; Kavitha, C.R. Explainable Artificial Intelligence-Based Disease Prediction with Symptoms Using Machine Learning Models. In IoT Based Control Networks and Intelligent Systems; Joby, P.P., Alencar, M.S., Falkowski-Gilski, P., Eds.; ICICNIS 2023; Lecture Notes in Networks and Systems; Springer: Singapore, 2024; Volume 789. [Google Scholar] [CrossRef]
- Floricel, C.; Nipu, N.; Biggs, M.; Wentzel, A.; Canahuate, G.; Van Dijk, L.; Mohamed, A.; Fuller, C.D.; Marai, G.E. THALIS: Human-Machine Analysis of Longitudinal Symptoms in Cancer Therapy. arXiv 2021, arXiv:2108.02817. [Google Scholar] [CrossRef]
- Mooney, K.H.; Beck, S.L.; Wong, B.; Dunson, W.; Wujcik, D.; Whisenant, M.; Donaldson, G. Automated home monitoring and management of patient-reported symptoms during chemotherapy: Results of the symptom care at home RCT. Cancer Med. 2017, 6, 537–546. [Google Scholar] [CrossRef] [PubMed]
- Smiley, A.; Tsai, T.Y.; Zakashansky, E.; Gabriel, A.; Xhakli, T.; Cui, W.; Huo, X.; Havrylchuk, I.; Cui, H.; Finkelstein, J. Exercise Exertion Levels Prediction Based on Real-Time Wearable Physiological Signal Monitoring. Stud. Health Technol. Inform. 2023, 305, 172–175. [Google Scholar] [CrossRef] [PubMed]
- D’Haese, P.F.; Finomore, V.; Lesnik, D.; Kornhauser, L.; Schaefer, T.; Konrad, P.E.; Hodder, S.; Marsh, C.; Rezai, A.R. Prediction of viral symptoms using wearable technology and artificial intelligence: A pilot study in healthcare workers. PLoS ONE 2021, 16, e0257997. [Google Scholar] [CrossRef] [PubMed] [PubMed Central]
- Cay, G.; Sada, Y.H.; Dehghan Rouzi, M.; Uddin Atique, M.M.; Rodriguez, N.; Azarian, M.; Finco, M.G.; Yellapragada, S.; Najafi, B. Harnessing physical activity monitoring and digital biomarkers of frailty from pendant based wearables to predict chemotherapy resilience in veterans with cancer. Sci. Rep. 2024, 14, 2612. [Google Scholar] [CrossRef] [PubMed] [PubMed Central]
- Bandyopadhyay, A.; Albashayreh, A.; Zeinali, N.; Fan, W.; Gilbertson-White, S. Using real-world electronic health record data to predict the development of 12 cancer-related symptoms in the context of multimorbidity. JAMIA Open 2024, 7, ooae082. [Google Scholar] [CrossRef] [PubMed] [PubMed Central]
- Hickin, M.P.; Shariff, J.A.; Jennette, P.J.; Finkelstein, J.; Papapanou, P.N. Incidence and Determinants of Dental Implant Failure: A Review of Electronic Health Records in a U.S. Dental School. J. Dent. Educ. 2017, 81, 1233–1242. [Google Scholar] [CrossRef] [PubMed]
- Finkelstein, J.; Zhang, F.; Levitin, S.A.; Cappelli, D. Using big data to promote precision oral health in the context of a learning healthcare system. J. Public. Health Dent. 2020, 80 (Suppl. S1), S43–S58. [Google Scholar] [CrossRef] [PubMed] [PubMed Central]
- Paranjpe, I.; Russak, A.J.; De Freitas, J.K.; Lala, A.; Miotto, R.; Vaid, A.; Johnson, K.W.; Danieletto, M.; Golden, E.; Meyer, D.; et al. Retrospective cohort study of clinical characteristics of 2199 hospitalised patients with COVID-19 in New York City. BMJ Open 2020, 10, e040736. [Google Scholar] [CrossRef] [PubMed] [PubMed Central]
- Finkelstein, J.; Gabriel, A.; Schmer, S.; Truong, T.T.; Dunn, A. Identifying Facilitators and Barriers to Implementation of AI-Assisted Clinical Decision Support in an Electronic Health Record System. J. Med. Syst. 2024, 48, 89. [Google Scholar] [CrossRef] [PubMed] [PubMed Central]
- Smiley, A.; Reategui-Rivera, C.M.; Villarreal-Zegarra, D.; Escobar-Agreda, S.; Finkelstein, J. Exploring Artificial Intelligence Biases in Predictive Models for Cancer Diagnosis. Cancers 2025, 17, 407. [Google Scholar] [CrossRef] [PubMed] [PubMed Central]
| Disclaimer/Publisher’s Note: The statements, opinions and data contained in all publications are solely those of the individual author(s) and contributor(s) and not of MDPI and/or the editor(s). MDPI and/or the editor(s) disclaim responsibility for any injury to people or property resulting from any ideas, methods, instructions or products referred to in the content. |
© 2025 by the authors. Licensee MDPI, Basel, Switzerland. This article is an open access article distributed under the terms and conditions of the Creative Commons Attribution (CC BY) license (https://creativecommons.org/licenses/by/4.0/).


