
Serum Maresin-1 and Resolvin-D1 Levels as Non-Invasive Biomarkers for Monitoring Disease Activity in Ulcerative Colitis


Abstract
1. Introduction
2. Materials and Methods
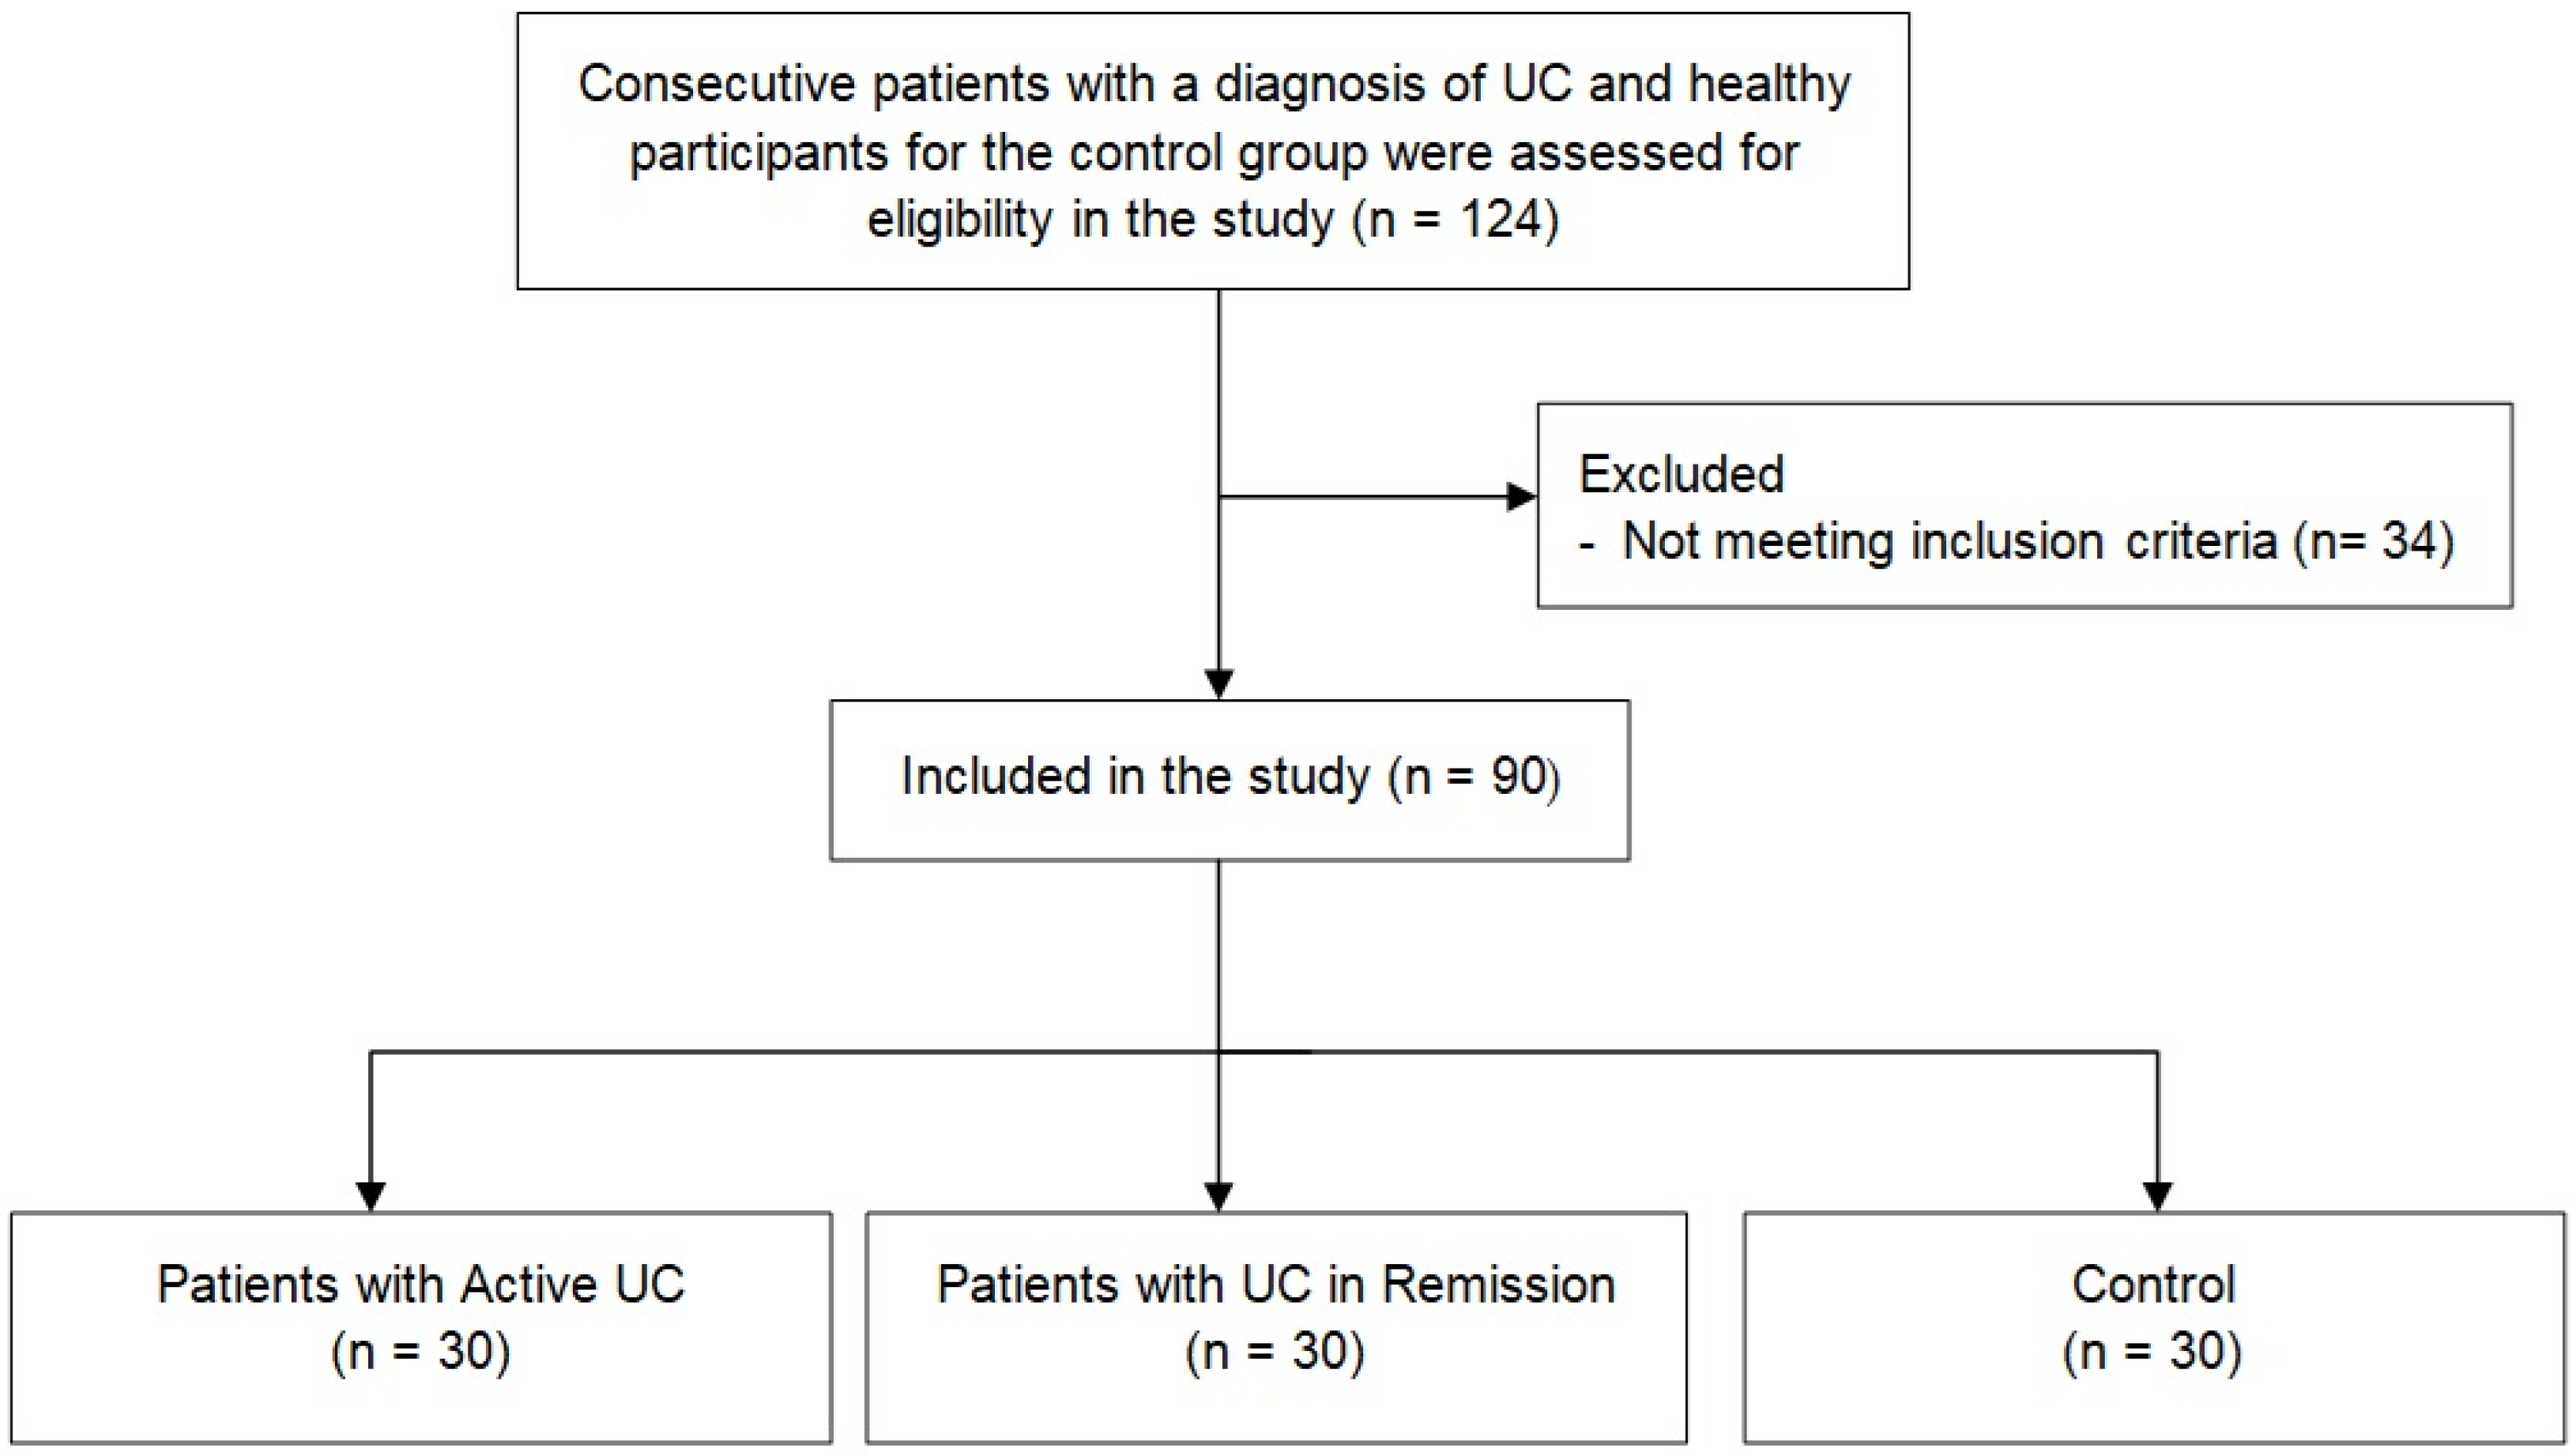
2.1. Study Population
2.2. Data Acquisition and Laboratory Analysis
2.3. Inflammatory Indices
2.4. Statistical Analyses
3. Results
4. Discussion
Limitations
5. Conclusions
Author Contributions
Funding
Institutional Review Board Statement
Informed Consent Statement
Data Availability Statement
Conflicts of Interest
References
- Wang, R.; Li, Z.; Liu, S.; Zhang, D. Global, regional and national burden of inflammatory bowel disease in 204 countries and territories from 1990 to 2019: A systematic analysis based on the Global Burden of Disease Study 2019. BMJ Open 2023, 13, e065186. [Google Scholar] [CrossRef]
- Lee, S.H.; Kwon, J.E.; Cho, M.L. Immunological pathogenesis of inflammatory bowel disease. Intest. Res. 2018, 16, 26–42. [Google Scholar] [CrossRef] [PubMed]
- Berg, D.R.; Colombel, J.F.; Ungaro, R. The Role of Early Biologic Therapy in Inflammatory Bowel Disease. Inflamm. Bowel Dis. 2019, 25, 1896–1905. [Google Scholar] [CrossRef] [PubMed]
- Magro, F.; Gionchetti, P.; Eliakim, R.; Ardizzone, S.; Armuzzi, A.; Barreiro-de Acosta, M.; Burisch, J.; Gecse, K.B.; Hart, A.L.; Hindryckx, P.; et al. Third European Evidence-based Consensus on Diagnosis and Management of Ulcerative Colitis. Part 1: Definitions, Diagnosis, Extra-intestinal Manifestations, Pregnancy, Cancer Surveillance, Surgery, and Ileo-anal Pouch Disorders. J. Crohn’s Colitis 2017, 11, 649–670. [Google Scholar] [CrossRef]
- Barsky, M.; Meserve, J.; Le, H.; Collins, A.; Singh, S.; Boland, B.; Sandborn, W.J.; Dulai, P.S. Understanding Determinants of Patient Preferences Between Stool Tests and Colonoscopy for the Assessment of Disease Activity in Inflammatory Bowel Disease. Dig. Dis. Sci. 2021, 66, 2564–2569. [Google Scholar] [CrossRef] [PubMed]
- Vermeire, S.; Van Assche, G.; Rutgeerts, P. Laboratory markers in IBD: Useful, magic, or unnecessary toys? Gut 2006, 55, 426–431. [Google Scholar] [CrossRef]
- Cui, J.; Li, X.; Zhang, Z.; Gao, H.; Li, J. Common laboratory blood test immune panel markers are useful for grading ulcerative colitis endoscopic severity. BMC Gastroenterol. 2022, 22, 540. [Google Scholar] [CrossRef]
- Yalçın, M.S.; Yalaki, S.; Ölmez, Ş.; Taş, A. Monocyte/High-Density Lipoprotein Ratio Is an Indicator of Activity in Patients with Ulcerative Colitis. Turk. J. Gastroenterol. 2022, 33, 329–335. [Google Scholar] [CrossRef]
- Carrillo-Palau, M.; Vera-Santana, B.; Morant-Domínguez, A.; Hernández-Camba, A.; Ramos, L.; Alonso-Abreu, I.; Hernández Álvarez-Buylla, N.; Arranz, L.; Vela, M.; Hernández-Guerra, M.; et al. Hematological Composite Scores in Patients with Inflammatory Bowel Disease. J. Clin. Med. 2023, 12, 7248. [Google Scholar] [CrossRef]
- Xie, Y.; Zhuang, T.; Ping, Y.; Zhang, Y.; Wang, X.; Yu, P.; Duan, X. Elevated systemic immune inflammation index level is associated with disease activity in ulcerative colitis patients. Clin. Chim. Acta 2021, 517, 122–126. [Google Scholar] [CrossRef]
- Menees, S.B.; Powell, C.; Kurlander, J.; Goel, A.; Chey, W.D. A meta-analysis of the utility of C-reactive protein, erythrocyte sedimentation rate, fecal calprotectin, and fecal lactoferrin to exclude inflammatory bowel disease in adults with IBS. Am. J. Gastroenterol. 2015, 110, 444–454. [Google Scholar] [CrossRef] [PubMed]
- Han, Y.H.; Lee, K.; Saha, A.; Han, J.; Choi, H.; Noh, M.; Lee, Y.H.; Lee, M.O. Specialized Proresolving Mediators for Therapeutic Interventions Targeting Metabolic and Inflammatory Disorders. Biomol. Ther. 2021, 29, 455–464. [Google Scholar] [CrossRef]
- Serhan, C.N.; Levy, B.D. Resolvins in inflammation: Emergence of the pro-resolving superfamily of mediators. J. Clin. Investig. 2018, 128, 2657–2669. [Google Scholar] [CrossRef]
- Jung, T.W.; Park, H.S.; Choi, G.H.; Kim, D.; Ahn, S.H.; Kim, D.S.; Lee, T.; Jeong, J.H. Maresin 1 attenuates pro-inflammatory reactions and ER stress in HUVECs via PPARα-mediated pathway. Mol. Cell. Biochem. 2018, 448, 335–347. [Google Scholar] [CrossRef] [PubMed]
- Chiurchiù, V.; Leuti, A.; Dalli, J.; Jacobsson, A.; Battistini, L.; Maccarrone, M.; Serhan, C.N. Proresolving lipid mediators resolvin D1, resolvin D2, and maresin 1 are critical in modulating T cell responses. Sci. Transl. Med. 2016, 8, 353ra111. [Google Scholar] [CrossRef]
- Levy, B.D.; Serhan, C.N. Resolution of acute inflammation in the lung. Annu. Rev. Physiol. 2014, 76, 467–492. [Google Scholar] [CrossRef]
- Song, J.; Sun, R.; Zhang, Y.; Fu, Y.; Zhao, D. Role of the Specialized Pro-resolving Mediator Resolvin D1 in Hashimoto’s Thyroiditis. Exp. Clin. Endocrinol. Diabetes 2021, 129, 791–797. [Google Scholar] [CrossRef]
- Lv, C.; Jin, Q. Maresin-1 Inhibits Oxidative Stress and Inflammation and Promotes Apoptosis in a Mouse Model of Caerulein-Induced Acute Pancreatitis. Med. Sci. Monit. 2019, 25, 8181–8189. [Google Scholar] [CrossRef] [PubMed]
- Özgül Özdemir, R.B.; Soysal Gündüz, Ö.; Özdemir, A.T.; Akgül, Ö. Low levels of pro-resolving lipid mediators lipoxin-A4, resolvin-D1 and resolvin-E1 in patients with rheumatoid arthritis. Immunol. Lett. 2020, 227, 34–40. [Google Scholar] [CrossRef]
- Fang, X.; Wang, H.; Ye, T.; Fu, X.; Tan, X.; Zeng, Y.; Fan, J.; Xu, Y. Low serum Maresin-1 levels are associated with non-alcoholic fatty liver disease: A cross-sectional study. Lipids Health Dis. 2021, 20, 96. [Google Scholar] [CrossRef]
- Karatay, E.; Utku, Ö.G. Serum resolvin D1 levels as a marker of inflammation in constipation dominant irritable bowel syndrome. Turk. J. Gastroenterol. 2020, 31, 113–119. [Google Scholar] [CrossRef]
- Guan, Q.; Zhang, J. Recent Advances: The Imbalance of Cytokines in the Pathogenesis of Inflammatory Bowel Disease. Mediat. Inflamm. 2017, 2017, 4810258. [Google Scholar] [CrossRef]
- Shahini, A.; Shahini, A. Role of interleukin-6-mediated inflammation in the pathogenesis of inflammatory bowel disease: Focus on the available therapeutic approaches and gut microbiome. J. Cell Commun. Signal. 2023, 17, 55–74. [Google Scholar] [CrossRef] [PubMed]
- Gravina, A.G.; Pellegrino, R.; Durante, T.; Palladino, G.; Imperio, G.; D’Amico, G.; Trotta, M.C.; Dallio, M.; Romeo, M.; D’Amico, M.; et al. The Melanocortin System in Inflammatory Bowel Diseases: Insights into Its Mechanisms and Therapeutic Potentials. Cells 2023, 12, 1889. [Google Scholar] [CrossRef] [PubMed]
- Montero-Melendez, T.; Gobbetti, T.; Cooray, S.N.; Jonassen, T.E.; Perretti, M. Biased agonism as a novel strategy to harness the proresolving properties of melanocortin receptors without eliciting melanogenic effects. J. Immunol. 2015, 194, 3381–3388. [Google Scholar] [CrossRef]
- Gravina, A.G.; Panarese, I.; Trotta, M.C.; D’Amico, M.; Pellegrino, R.; Ferraraccio, F.; Galdiero, M.; Alfano, R.; Grieco, P.; Federico, A. Melanocortin 3,5 receptors immunohistochemical expression in colonic mucosa of inflammatory bowel disease patients: A matter of disease activity? World J. Gastroenterol. 2024, 30, 1132–1142. [Google Scholar] [CrossRef] [PubMed]
- Montero-Melendez, T. ACTH: The forgotten therapy. Semin. Immunol. 2015, 27, 216–226. [Google Scholar] [CrossRef]
- D’Haens, G.; Sandborn, W.J.; Feagan, B.G.; Geboes, K.; Hanauer, S.B.; Irvine, E.J.; Lémann, M.; Marteau, P.; Rutgeerts, P.; Schölmerich, J.; et al. A review of activity indices and efficacy end points for clinical trials of medical therapy in adults with ulcerative colitis. Gastroenterology 2007, 132, 763–786. [Google Scholar] [CrossRef]
- Simopoulos, A.P. The importance of the omega-6/omega-3 fatty acid ratio in cardiovascular disease and other chronic diseases. Exp. Biol. Med. 2008, 233, 674–688. [Google Scholar] [CrossRef]
- Ferreira, C.; Vieira, P.; Sá, H.; Malva, J.; Castelo-Branco, M.; Reis, F.; Viana, S. Polyphenols: Immunonutrients tipping the balance of immunometabolism in chronic diseases. Front. Immunol. 2024, 15, 1360065. [Google Scholar] [CrossRef]
- Spite, M.; Clària, J.; Serhan, C.N. Resolvins, specialized proresolving lipid mediators, and their potential roles in metabolic diseases. Cell Metab. 2014, 19, 21–36. [Google Scholar] [CrossRef] [PubMed]
- Coras, R.; Kavanaugh, A.; Boyd, T.; Huynh, Q.; Pedersen, B.; Armando, A.M.; Dahlberg-Wright, S.; Marsal, S.; Jain, M.; Paravar, T.; et al. Pro- and anti-inflammatory eicosanoids in psoriatic arthritis. Metabolomics 2019, 15, 65. [Google Scholar] [CrossRef]
- Wu, J.; Li, X.Y.; Fang, X.; Teng, F.Y.; Xu, Y. Decreased Serum Maresin 1 Concentration Is Associated with Postmenopausal Osteoporosis: A Cross-Sectional Study. Front. Med. 2021, 8, 759825. [Google Scholar] [CrossRef]
- Yavuz, A.; Ugur, K.; Karagoz, Z.K.; Ayan, D.; Aydin, S. Blood, saliva and urine maresin-1 and malondialdehyde may be useful biomarker in patients with polycystic ovary syndrome: A prospective study. Clin. Exp. Obstet. Gynecol. 2022, 49, 87. [Google Scholar] [CrossRef]
- Tejera, P.; Abdulnour, R.E.; Zhu, Z.; Su, L.; Levy, B.D.; Christiani, D.C. Plasma Levels of Proresolving and Prophlogistic Lipid Mediators: Association with Severity of Respiratory Failure and Mortality in Acute Respiratory Distress Syndrome. Crit. Care Explor. 2020, 2, e0241. [Google Scholar] [CrossRef]
- Sharara, A.I.; Malaeb, M.; Lenfant, M.; Ferrante, M. Assessment of Endoscopic Disease Activity in Ulcerative Colitis: Is Simplicity the Ultimate Sophistication? Inflamm. Intest. Dis. 2022, 7, 7–12. [Google Scholar] [CrossRef] [PubMed]
- Kim, J.E.; Kim, M.; Kim, M.J.; Kim, E.R.; Hong, S.N.; Chang, D.K.; Ha, S.Y.; Kim, Y.H. Histologic improvement predicts endoscopic remission in patients with ulcerative colitis. Sci. Rep. 2024, 14, 19926. [Google Scholar] [CrossRef]
- Gravina, A.G.; Dallio, M.; Romeo, M.; Pellegrino, R.; Stiuso, P.; Lama, S.; Grieco, P.; Merlino, F.; Panarese, I.; Marino, F.Z.; et al. The urotensin-II receptor: A marker for staging and steroid outcome prediction in ulcerative colitis. Eur. J. Clin. Investig. 2023, 53, e13972. [Google Scholar] [CrossRef]

| Patients with Active UC X(n = 30) | Patients with UC in Remission (n = 30) b | Control (n = 30) a | p-Value | |
|---|---|---|---|---|
| Age (years) | 46.93 ± 17.87 | 47.03 ± 10.51 | 42.50 ± 10.85 | 0.337 |
| Sex (male/female) | 15/15 | 19/11 | 18/12 | 0.553 |
| BMI (kg/m2) | 29.79 ± 4.34 | 30.42 ± 3.70 | 30.04 ± 4.66 | 0.849 |
| Smoking, n (%) | 4 (13.3) | 4 (13.3) | 8 (26.7) | 0.296 |
| Duration of disease (months) | 12 (0–63) | 84 (36–120) | - | - |
| Medications (n) | 0.073 | |||
| None | 12 | 6 | ||
| 5-ASA | 13 | 21 | ||
| 5-ASA/Azatiopurine | 5 | 3 | ||
| Mayo endoscopic subscore (n) | ||||
| MES 0 | - | 15 | - | - |
| MES 1 | - | 15 | - | - |
| MES 2 | 16 | - | - | - |
| MES 3 | 14 | - | - | - |
| ESR (mm/h) | 18.50 (10–25.25) ab | 10.50 (8–16) | 10 (8–11) | <0.001 |
| Albumin (g/dL) | 4.12 (3.96–4.72) b | 4.60 (4.33–4.77) | 4.44 (4.23–4.54) | 0.043 |
| Leukocytes (×103/μL) | 7.01 (6.15–9.65) | 6.45 (5.60–7.83) | 6.52 (5.62–8.02) | 0.099 |
| CRP (mg/L) | 12.19 (8.84–17.95) ab | 4.00 (1.86–8.38) | 2.02 (1.15–4.02) | <0.001 |
| Neutrophils (×103/μL) | 4.24 (3.05–6.62) | 3.80 (3.04–4.76) | 3.61 (3.18–4.65) | 0.283 |
| Lymphocyte (×103/μL) | 1.98 ± 0.62 | 2.18 ± 0.69 | 2.24 ± 0.71 | 0.297 |
| Monocyte(×103/μL) | 0.51 ± 0.19 | 0.43 ± 0.15 | 0.45 ± 0.09 | 0.153 |
| Platelets (×103/μL) | 330.50 (282.50–386.25) a | 295 (239.75–359.50) | 280 (233.25–301.25) | 0.012 |
| HDL-C (mg/dL) | 43.07 ± 7.26 ab | 48.37 ± 9.49 | 50.47 ± 10.09 | 0.006 |
| NLR | 2.55 (1.68–3.30) ab | 1.92 (1.42–2.22) | 1.59 (1.26–2.15) | 0.009 |
| PLR | 151.70 (127.28–241.68) a | 142.06 (109.58–172.60) | 127.56 (88.41–156.34) | 0.019 |
| MHR | 10.70 (7.87–15.89) | 8.51 (6.44–12.06) | 9.25 (7.88–11.26) | 0.083 |
| CLR | 6.57 (3.60–12.44) ab | 1.99 (0.80–3.59) | 0.94 (0.69–2.31) | <0.001 |
| CAR | 2.95 (2.00–3.99) ab | 0.83 (0.42–1.74) | 0.46 (0.24–1) | <0.001 |
| SII | 946.33 (495.43–1175.75) ab | 585.51 (367.39–755.82) | 424.86 (321.15–664.93) | 0.004 |
| SIRI | 1.30 (0.69–1.71) ab | 0.77 (0.47–1.07) | 0.72 (0.57–0.98) | 0.010 |
| MaR1 (pg/mL) | 111.18 ± 20.86 ab | 125.38 ± 9.19 a | 141.20 ± 8.23 | <0.001 |
| RvD1 (pg/mL) | 277.57 ± 32.04 ab | 351.24 ± 48.61 | 363.50 ± 60.61 | <0.001 |
| Active | 5-ASA Users (n = 18) | Non-Users (n = 12) | p-Value |
| MaR1 (pg/mL) | 114.37 (97.22–132.44) | 101.08 (91.14–113.99) | 0.146 |
| RvD1 (pg/mL) | 294.19 (253.25–305.91) | 283.33 (248.29–294.59) | 0.267 |
| Remission | 5-ASA Users (n = 24) | Non-Users (n = 6) | p-Value |
| MaR1 (pg/mL) | 123.93 (118.93–132.08) | 123.62 (117.21–132.38) | 0.820 |
| RvD1 (pg/mL) | 359.14 (308.59–391.04) | 332.62 (262.93–381.11) | 0.273 |
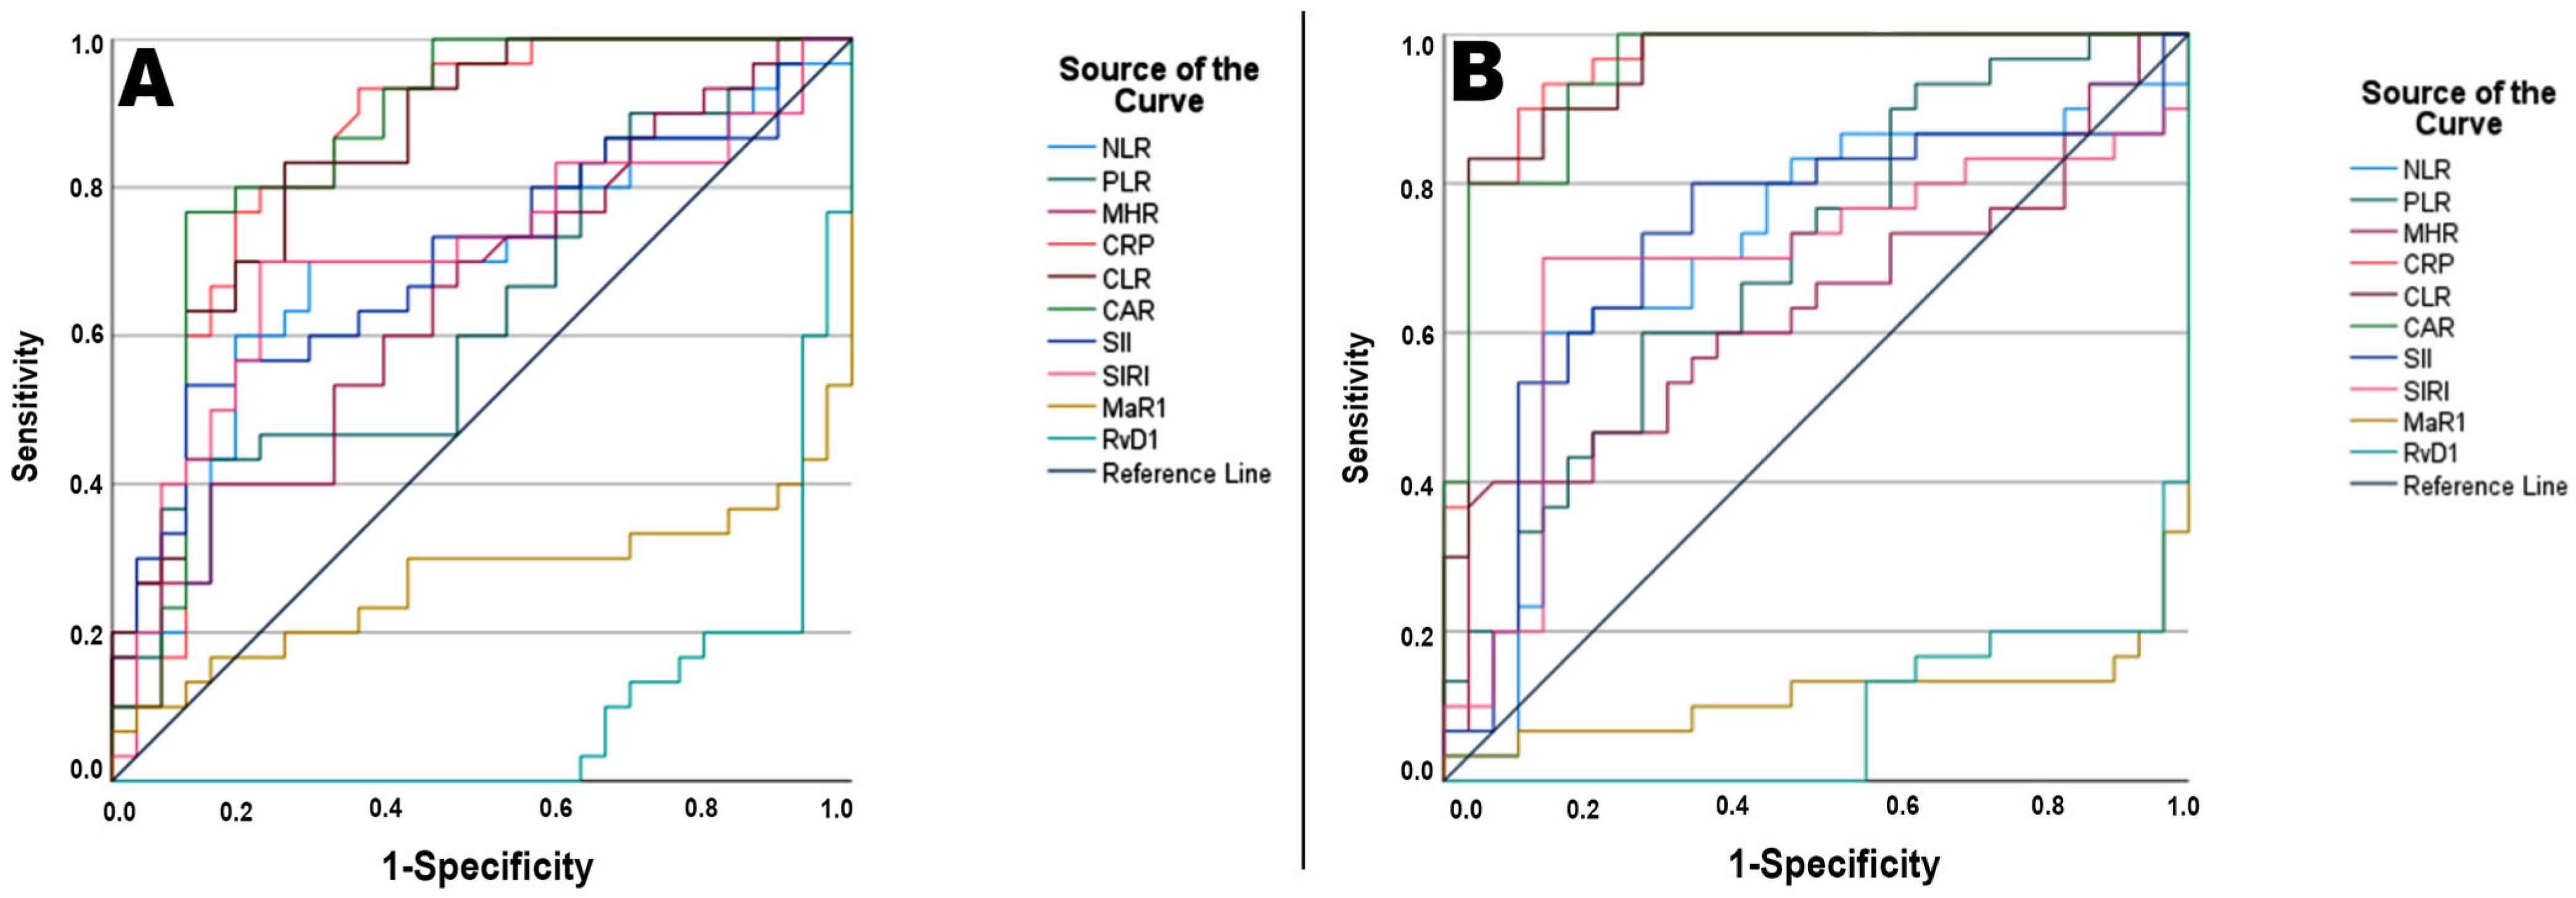
| Parameter | AUC * | SE * | 95% CI * | Cutoff | Sensitivity | Specificity | PPV | NPV | p ** |
|---|---|---|---|---|---|---|---|---|---|
| NLR | 0.672 | 0.060 | 0.566–0.801 | >2.09 | 70.00% | 73.3% | 72.41% | 70.96% | 0.012 |
| PLR | 0.639 | 0.070 | 0.474–0.748 | >194.52 | 43.30% | 90.00% | 80.00% | 60.00% | 0.065 |
| MHR | 0.675 | 0.043 | 0.557–0.726 | >9.76 | 60.00% | 63.3% | 62.00% | 61.29% | 0.043 |
| CRP | 0.858 | 0.016 | 0.835–0.898 | >6.04 | 93.30% | 66.70% | 73.68% | 90.90% | <0.001 |
| CLR | 0.861 | 0.031 | 0.811–0.933 | >3.46 | 83.30% | 76.70% | 80.64% | 82.75% | <0.001 |
| CAR | 0.872 | 0.019 | 0.835–0.909 | >2.03 | 76.70% | 90.00% | 88.46% | 79.41% | <0.001 |
| SII | 0.700 | 0.064 | 0.597–0.848 | >930.88 | 53.30% | 90.00% | 84.21% | 65.85% | 0.009 |
| SIRI | 0.708 | 0.067 | 0.585–0.848 | >1.09 | 70.00% | 80.00% | 72.41% | 71.87% | 0.007 |
| MaR1 | 0.717 | 0.077 | 0.576–0.879 | <112.77 | 96.70% | 60.00% | 94.73% | 70.73% | 0.003 |
| RvD1 | 0.906 | 0.040 | 0.827–0.984 | <303.23 | 93.30% | 80.00% | 92.30% | 82.35% | <0.001 |
| Pairwise comparison *** | Difference AUC | 95% CI | p-Value | ||||||
| CAR vs. CLR | 0.012 | −0.036–0.060 | 0.617 | ||||||
| CAR vs. CRP | 0.014 | −0.006–0.034 | 0.167 | ||||||
| CAR vs. RvD1 | 0.050 | −0.178–0.078 | 0.444 | ||||||
| CLR vs. CRP | 0.002 | −0.050–0.054 | 0.949 | ||||||
| CLR vs. RvD1 | 0.062 | −0.183–0.058 | 0.311 | ||||||
| CRP vs. RvD1 | 0.064 | −0.195–0.067 | 0.339 | ||||||
| Parameter | AUC * | SE * | 95% CI * | Cutoff | Sensitivity | Specificity | PPV | NPV | p ** |
| NLR | 0.661 | 0.060 | 0.544–0.778 | >2.41 | 60.00% | 86.70% | 81.81% | 68.42% | 0.008 |
| PLR | 0.717 | 0.040 | 0.639–0.794 | >144.46 | 60.00% | 73.30% | 69.23% | 64.70% | 0.010 |
| MHR | 0.694 | 0.034 | 0.628–0.761 | >13.17 | 40.00% | 93.30% | 85.71% | 60.86% | 0.081 |
| CRP | 0.944 | 0.043 | 0.860–1.000 | >6.23 | 93.30% | 86.70% | 87.50% | 92.85% | <0.001 |
| CLR | 0.939 | 0.036 | 0.869–1.000 | >3.42 | 83.30% | 96.70% | 96.15% | 85.29% | <0.001 |
| CAR | 0.939 | 0.043 | 0.854–1.000 | >1.28 | 93.30% | 83.30% | 84.84% | 92.59% | <0.001 |
| SII | 0.694 | 0.060 | 0.576–0.812 | >466.63 | 80.00% | 66.70% | 70.58% | 76.92% | 0.003 |
| SIRI | 0.717 | 0.027 | 0.664–0.769 | >1.08 | 70.00% | 86.70% | 84.00% | 74.28% | 0.014 |
| MaR1 | 0.889 | 0.066 | 0.759–1.000 | <129.88 | 96.70% | 80.00% | 96.00% | 82.85% | <0.001 |
| RvD1 | 0.928 | 0.059 | 0.813–1.000 | <303.35 | 96.70% | 80.00% | 96.00% | 82.85% | <0.001 |
| Pairwise comparison *** | Difference AUC | 95% CI | p-Value | ||||||
| CRP vs. CLR | 0.008 | −0.014–0.029 | 0.480 | ||||||
| CRP vs. CAR | 0.007 | −0.008–0.021 | 0.360 | ||||||
| CRP vs. MaR1 | 0.069 | −0.041–0.179 | 0.220 | ||||||
| CRP vs. RvD1 | 0.041 | −0.045–0.128 | 0.351 | ||||||
| CLR vs. CAR | 0.001 | −0.029–0.026 | 0.937 | ||||||
| CLR vs. MaR1 | 0.061 | −0.049–0.171 | 0.276 | ||||||
| CLR vs. RvD1 | 0.033 | −0.056–0.123 | 0.466 | ||||||
| CAR vs. MaR1 | 0.062 | −0.049–0.174 | 0.274 | ||||||
| CAR vs. RvD1 | 0.034 | −0.053–0.122 | 0.439 | ||||||
| MaR1 vs. RvD1 | 0.028 | −0.115–0.059 | 0.532 | ||||||
| Variable | Severity | |
|---|---|---|
| r | p * | |
| NLR | 0.343 | 0.009 |
| PLR | 0.290 | 0.028 |
| MHR | 0.272 | 0.036 |
| CRP | 0.598 | <0.001 |
| CLR | 0.614 | <0.001 |
| CAR | 0.625 | <0.001 |
| SII | 0.361 | 0.007 |
| SIRI | 0.357 | 0.007 |
| MaR1 | −0.407 | 0.002 |
| RvD1 | −0.754 | <0.001 |
Disclaimer/Publisher’s Note: The statements, opinions and data contained in all publications are solely those of the individual author(s) and contributor(s) and not of MDPI and/or the editor(s). MDPI and/or the editor(s) disclaim responsibility for any injury to people or property resulting from any ideas, methods, instructions or products referred to in the content. |
© 2025 by the authors. Licensee MDPI, Basel, Switzerland. This article is an open access article distributed under the terms and conditions of the Creative Commons Attribution (CC BY) license (https://creativecommons.org/licenses/by/4.0/).
Share and Cite
Demirci, S.; Sezer, S. Serum Maresin-1 and Resolvin-D1 Levels as Non-Invasive Biomarkers for Monitoring Disease Activity in Ulcerative Colitis. Diagnostics 2025, 15, 834. https://doi.org/10.3390/diagnostics15070834
Demirci S, Sezer S. Serum Maresin-1 and Resolvin-D1 Levels as Non-Invasive Biomarkers for Monitoring Disease Activity in Ulcerative Colitis. Diagnostics. 2025; 15(7):834. https://doi.org/10.3390/diagnostics15070834
Chicago/Turabian StyleDemirci, Selim, and Semih Sezer. 2025. "Serum Maresin-1 and Resolvin-D1 Levels as Non-Invasive Biomarkers for Monitoring Disease Activity in Ulcerative Colitis" Diagnostics 15, no. 7: 834. https://doi.org/10.3390/diagnostics15070834
APA StyleDemirci, S., & Sezer, S. (2025). Serum Maresin-1 and Resolvin-D1 Levels as Non-Invasive Biomarkers for Monitoring Disease Activity in Ulcerative Colitis. Diagnostics, 15(7), 834. https://doi.org/10.3390/diagnostics15070834