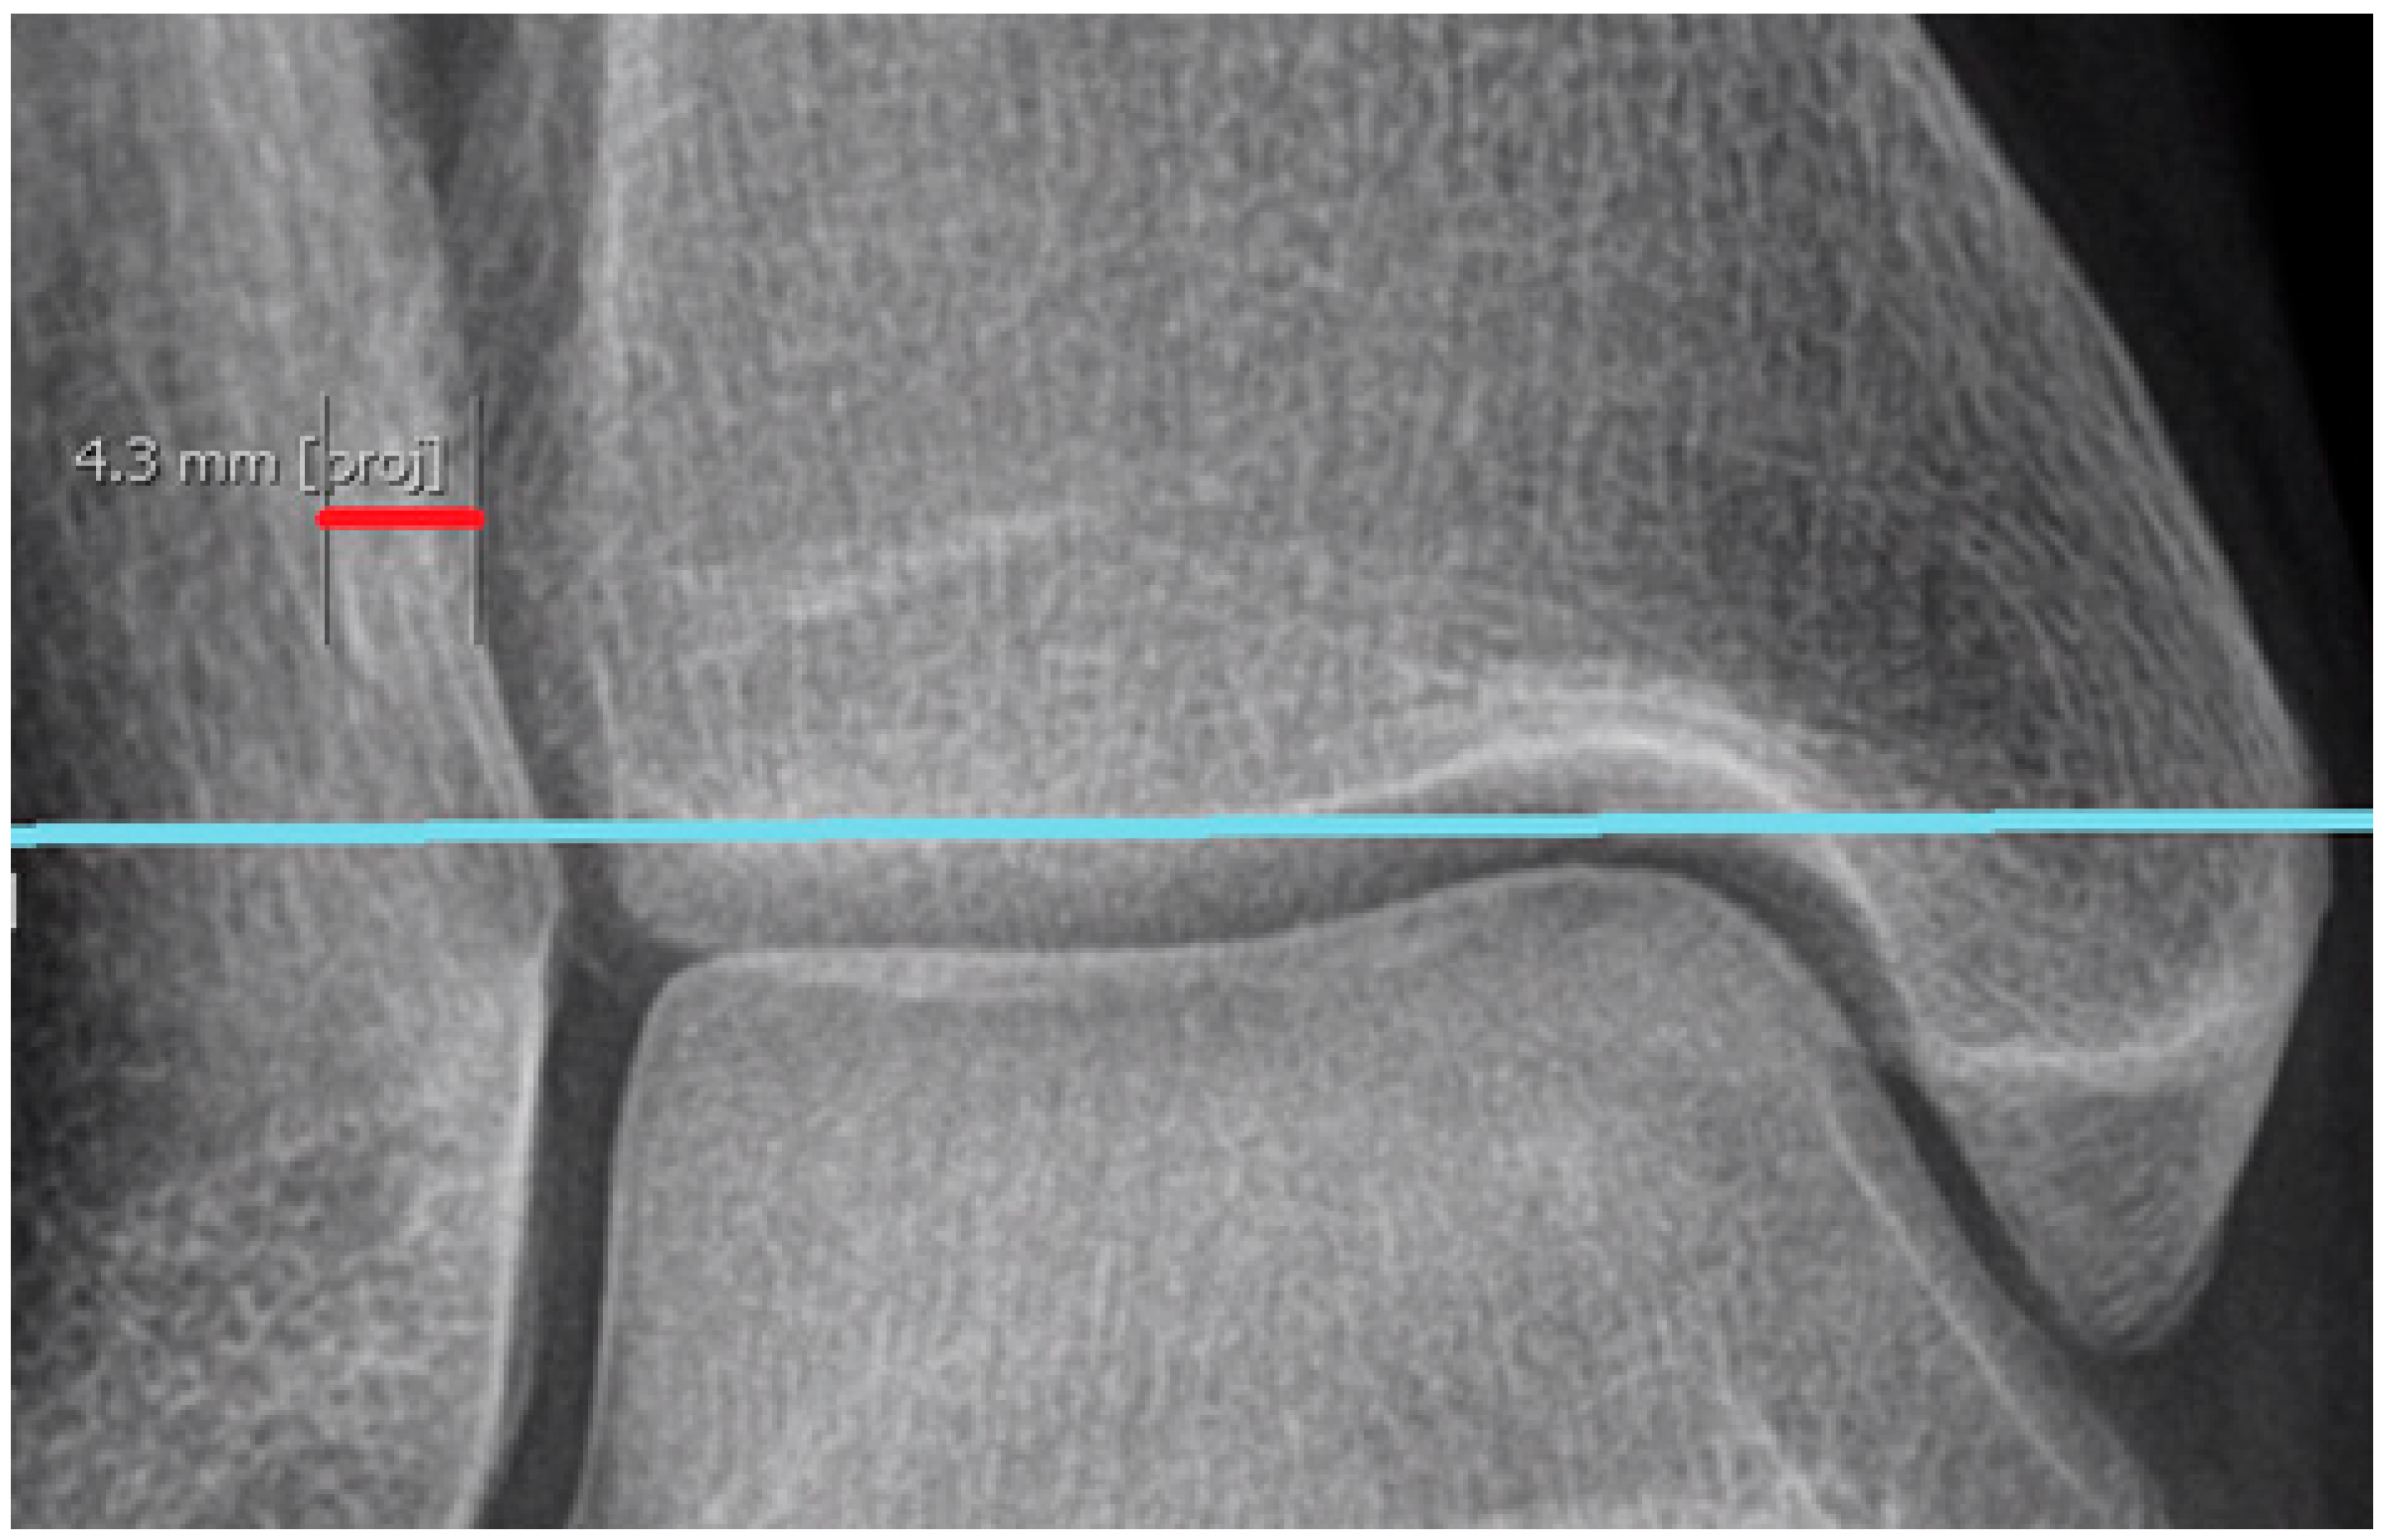
Figure 1.
The transverse line (marked in red) is adjusted to intersect both ankles at equivalent levels, utilizing the lateral margins of the tibial plafonds as references. The green line represents the sagittal plane, which is irrelevant to the adjustment process. The two measurement lines visible in the figure (light-blue and orange lines) extend distally from the transverse line (red), indicating the lowest and highest levels for further measurements: 5 mm for the light-blue line and 7 mm for the orange line. Other levels of measurement are not marked in the figure.
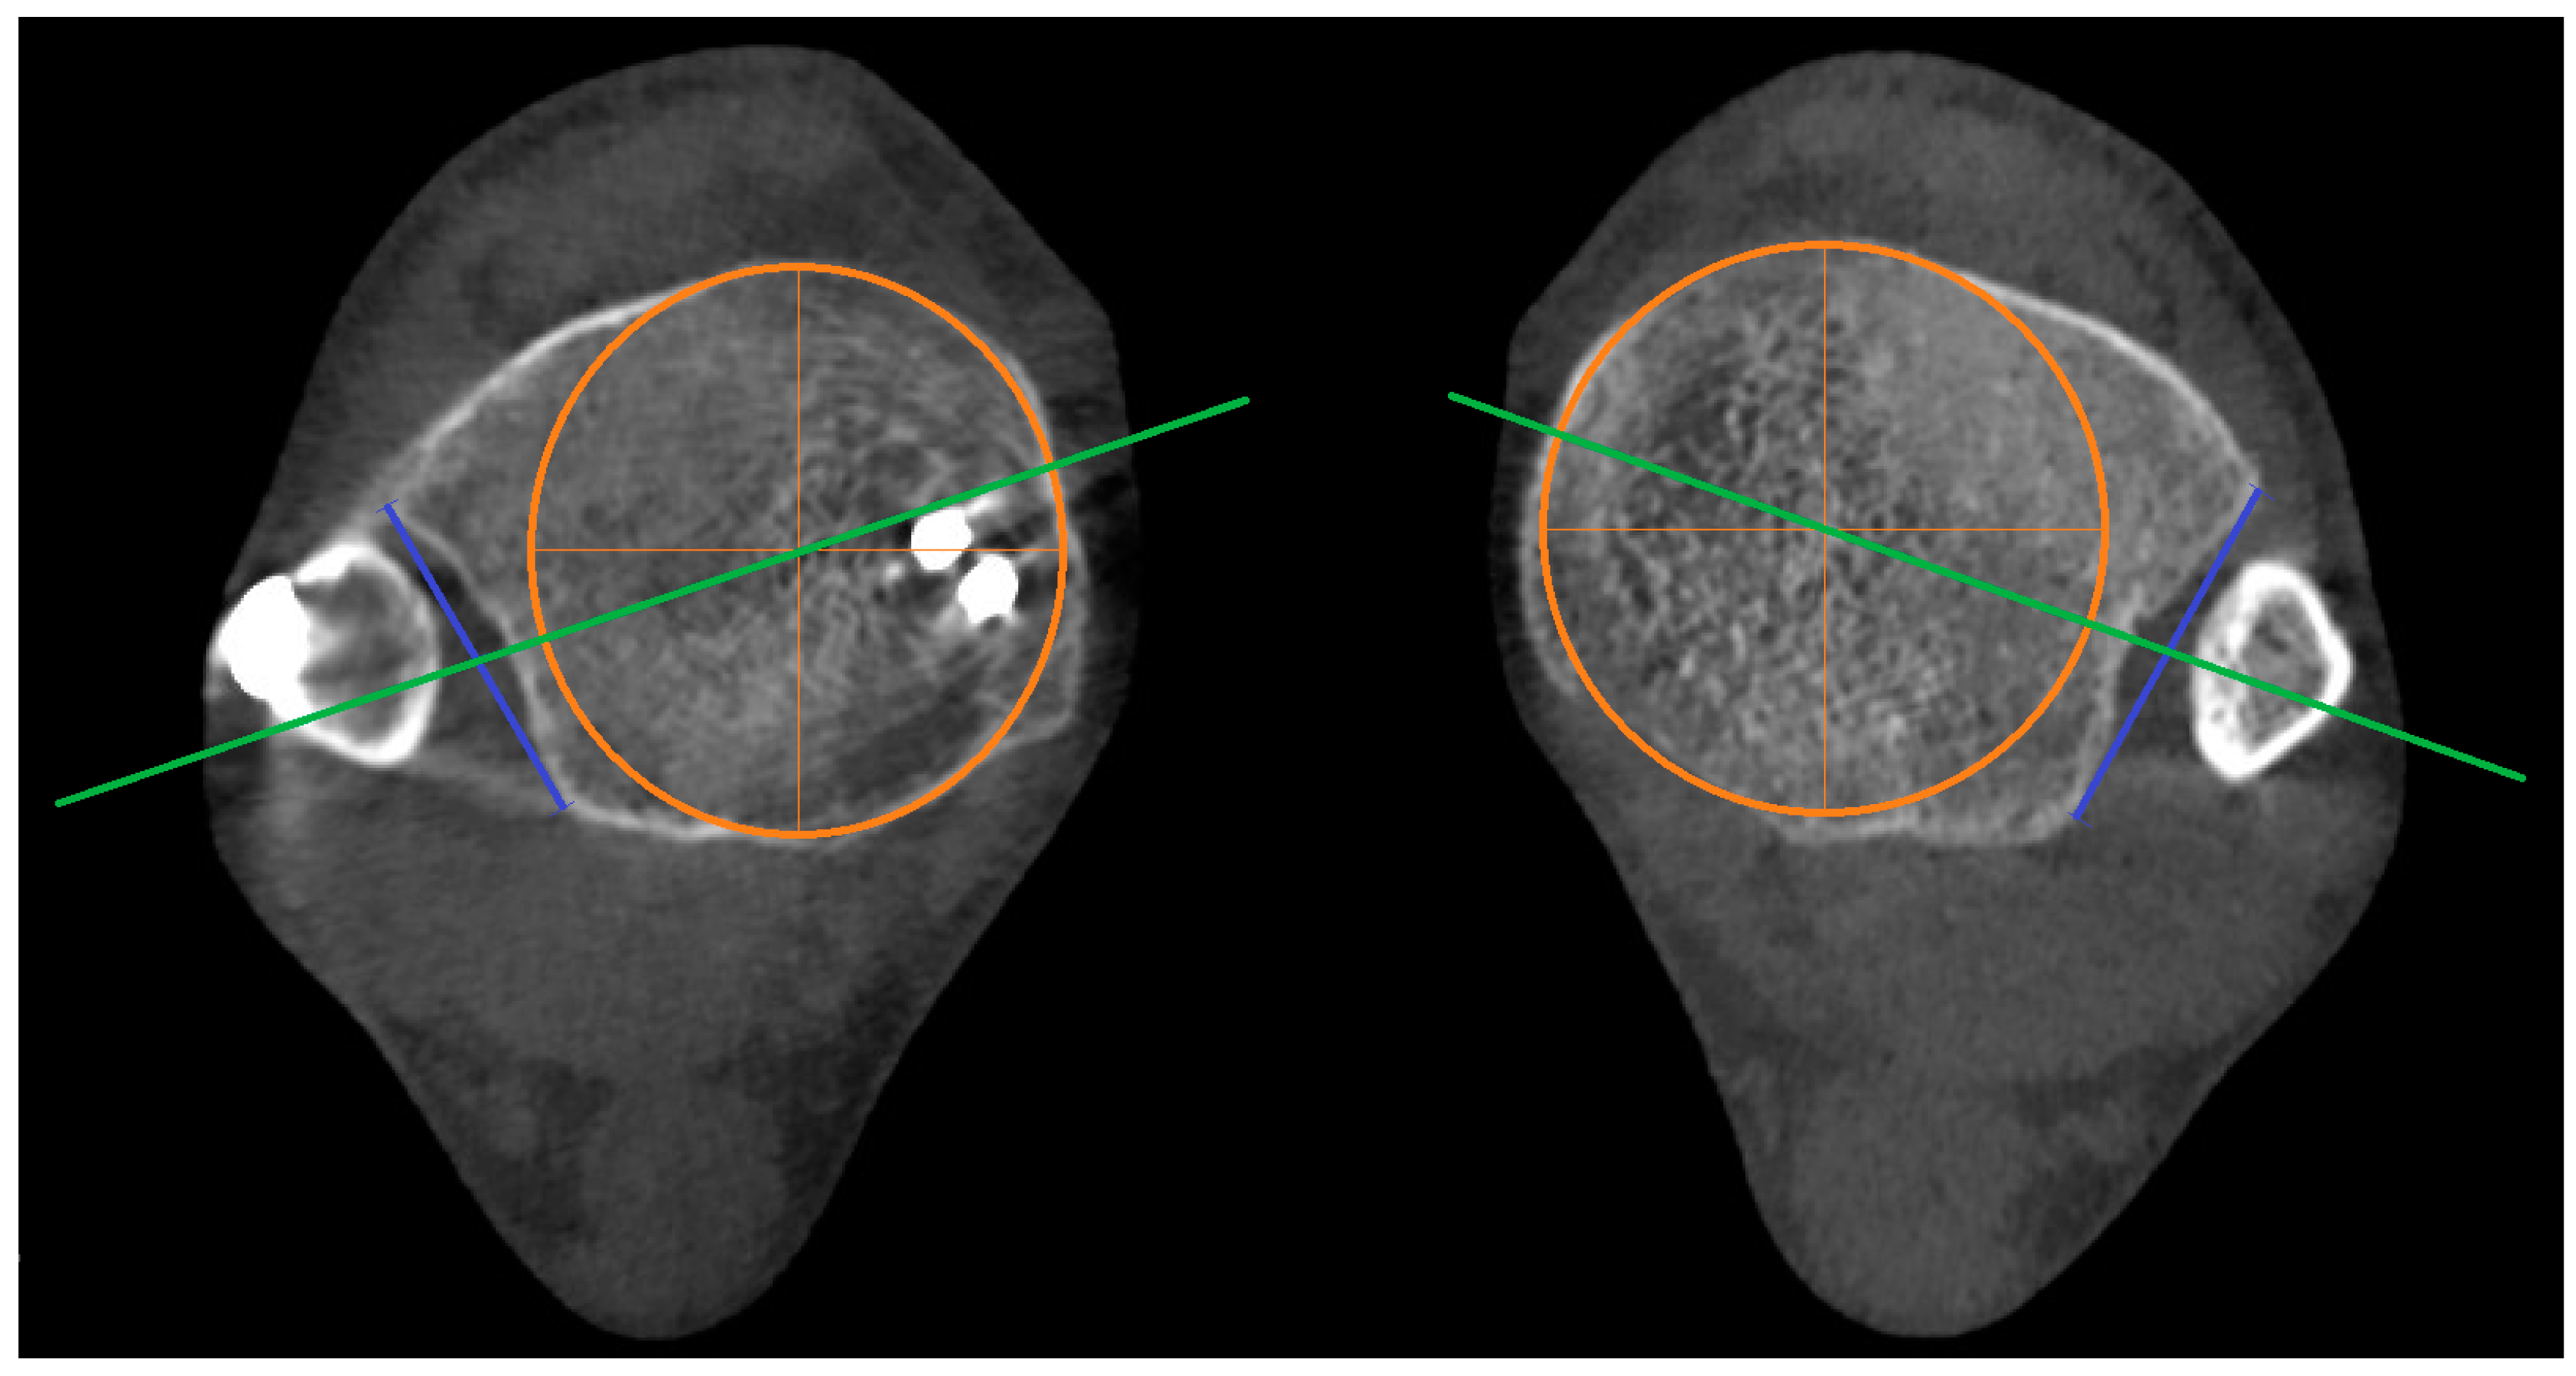
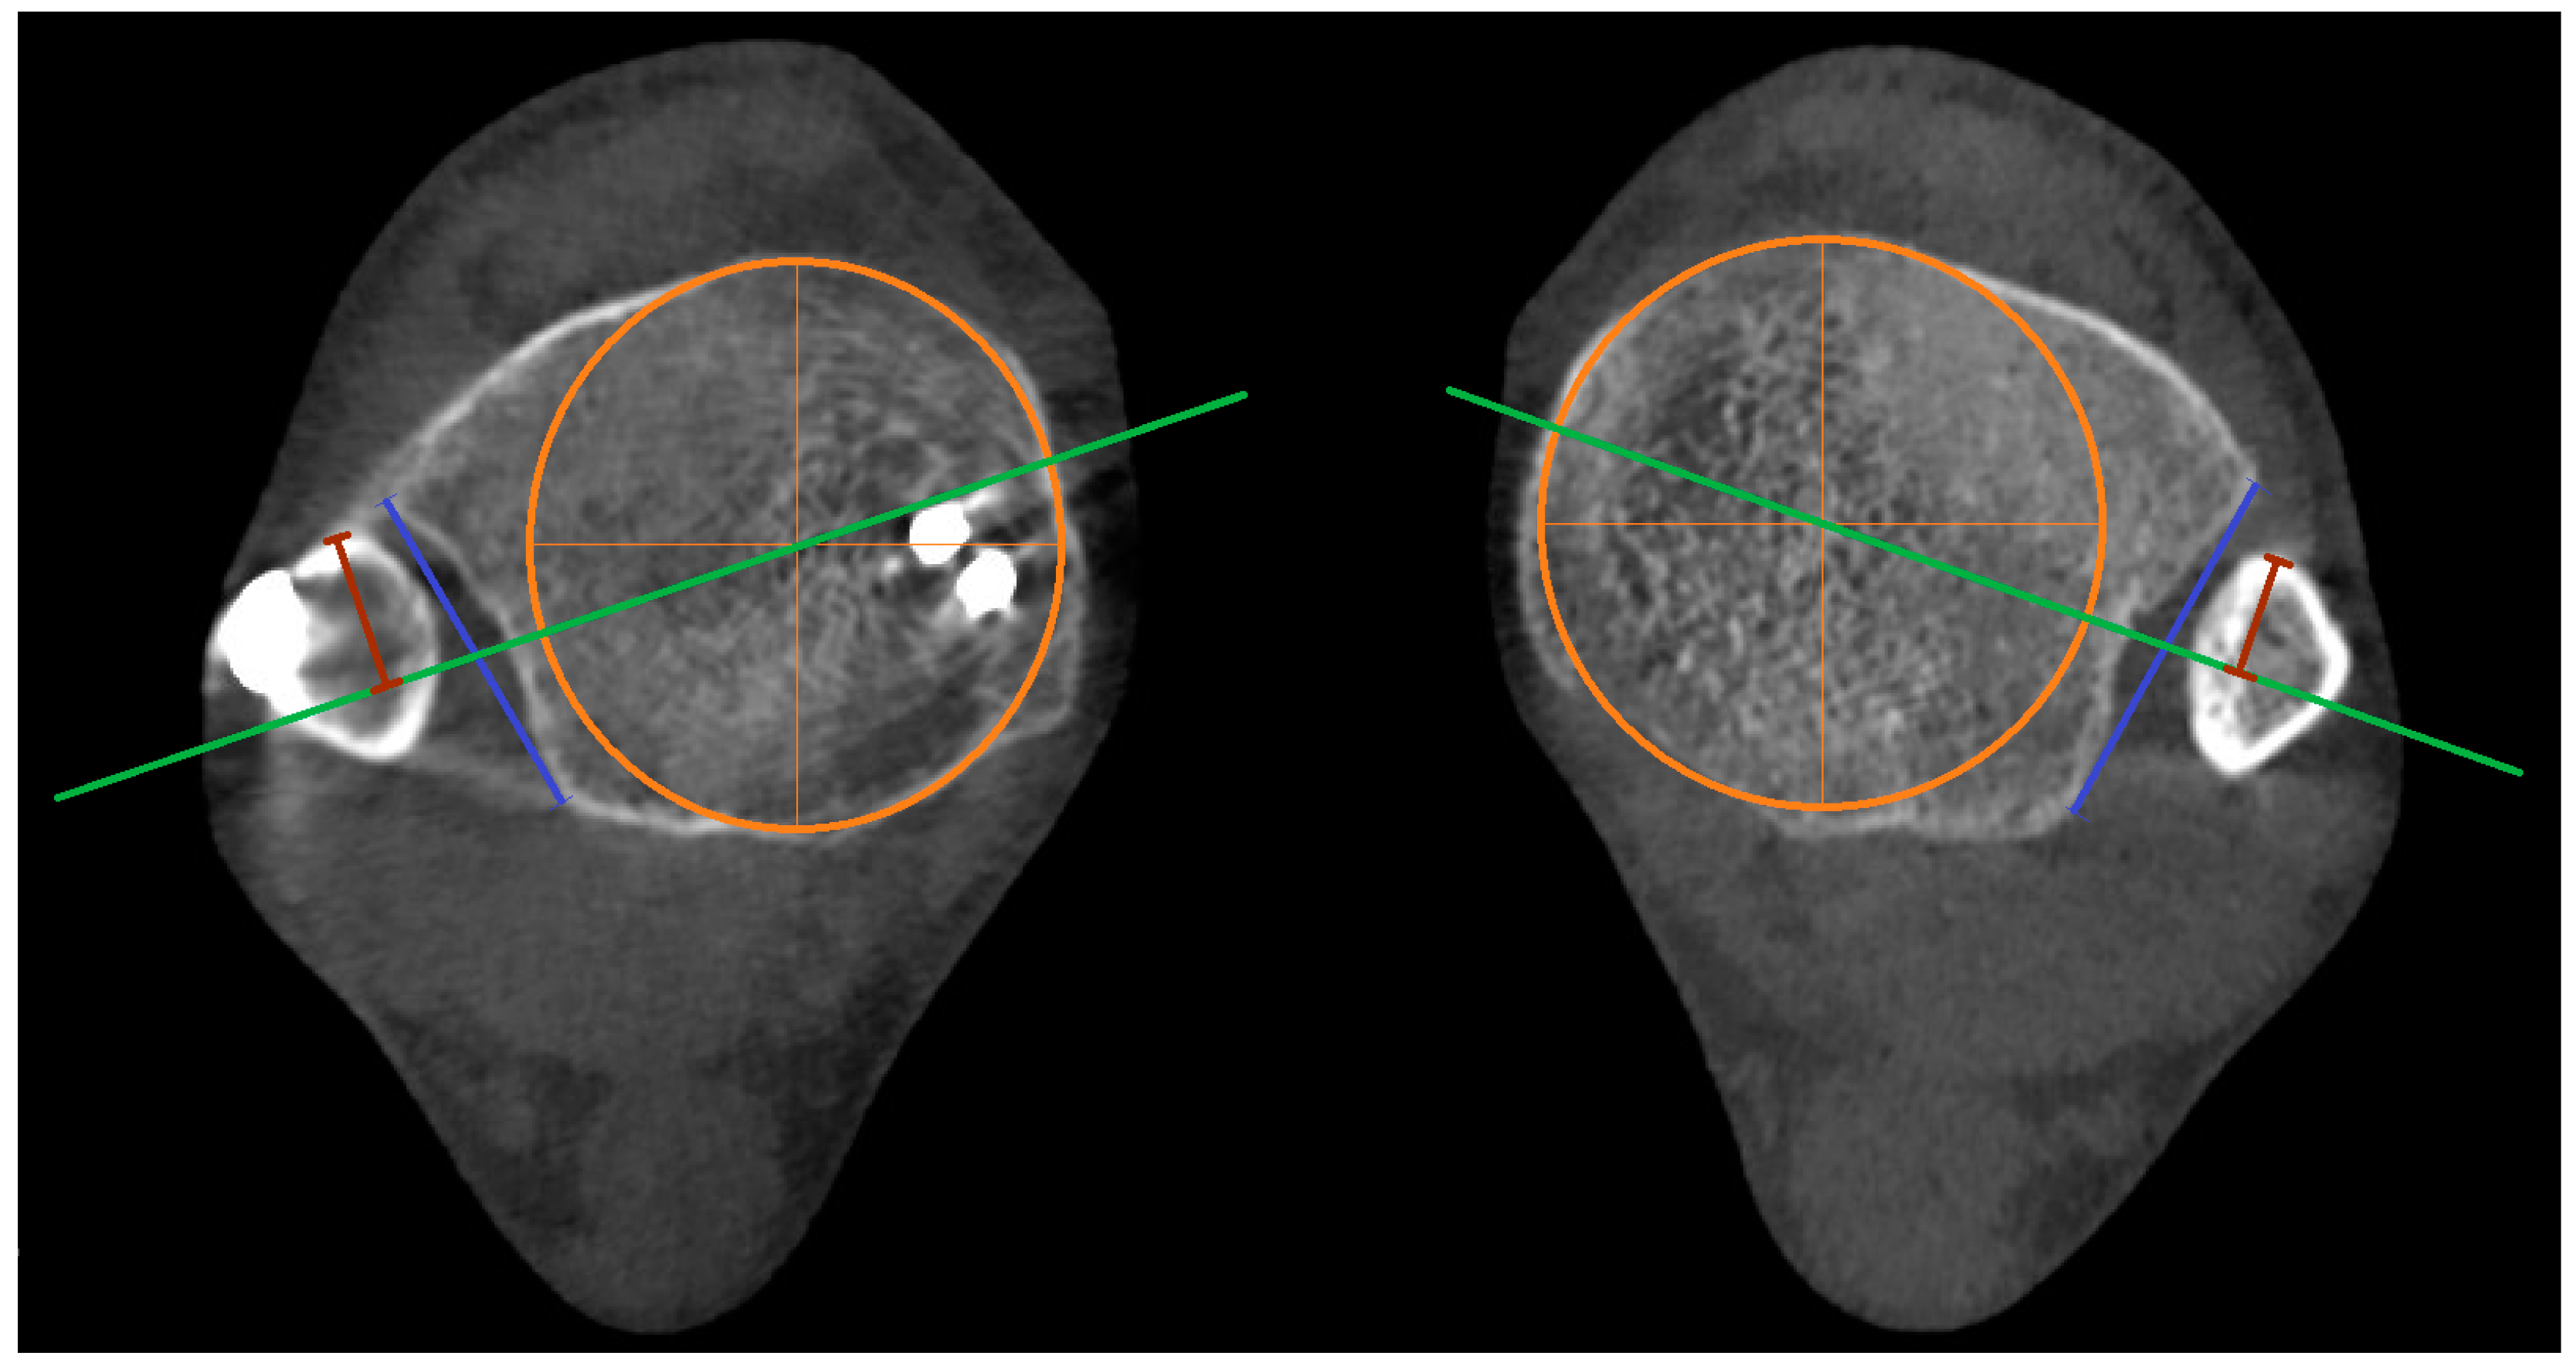
Figure 2.
Reference Line A marked blue and reference Line B marked green, as described in the text. Orange color represents circular incision in the tibia. Line B connects the midpoint of Line A and the center of the circular incision in the tibia.
Figure 2.
Reference Line A marked blue and reference Line B marked green, as described in the text. Orange color represents circular incision in the tibia. Line B connects the midpoint of Line A and the center of the circular incision in the tibia.
Figure 3.
The red line represents the ‘depth’, and the blue line represents the reference Line A.
Figure 3.
The red line represents the ‘depth’, and the blue line represents the reference Line A.
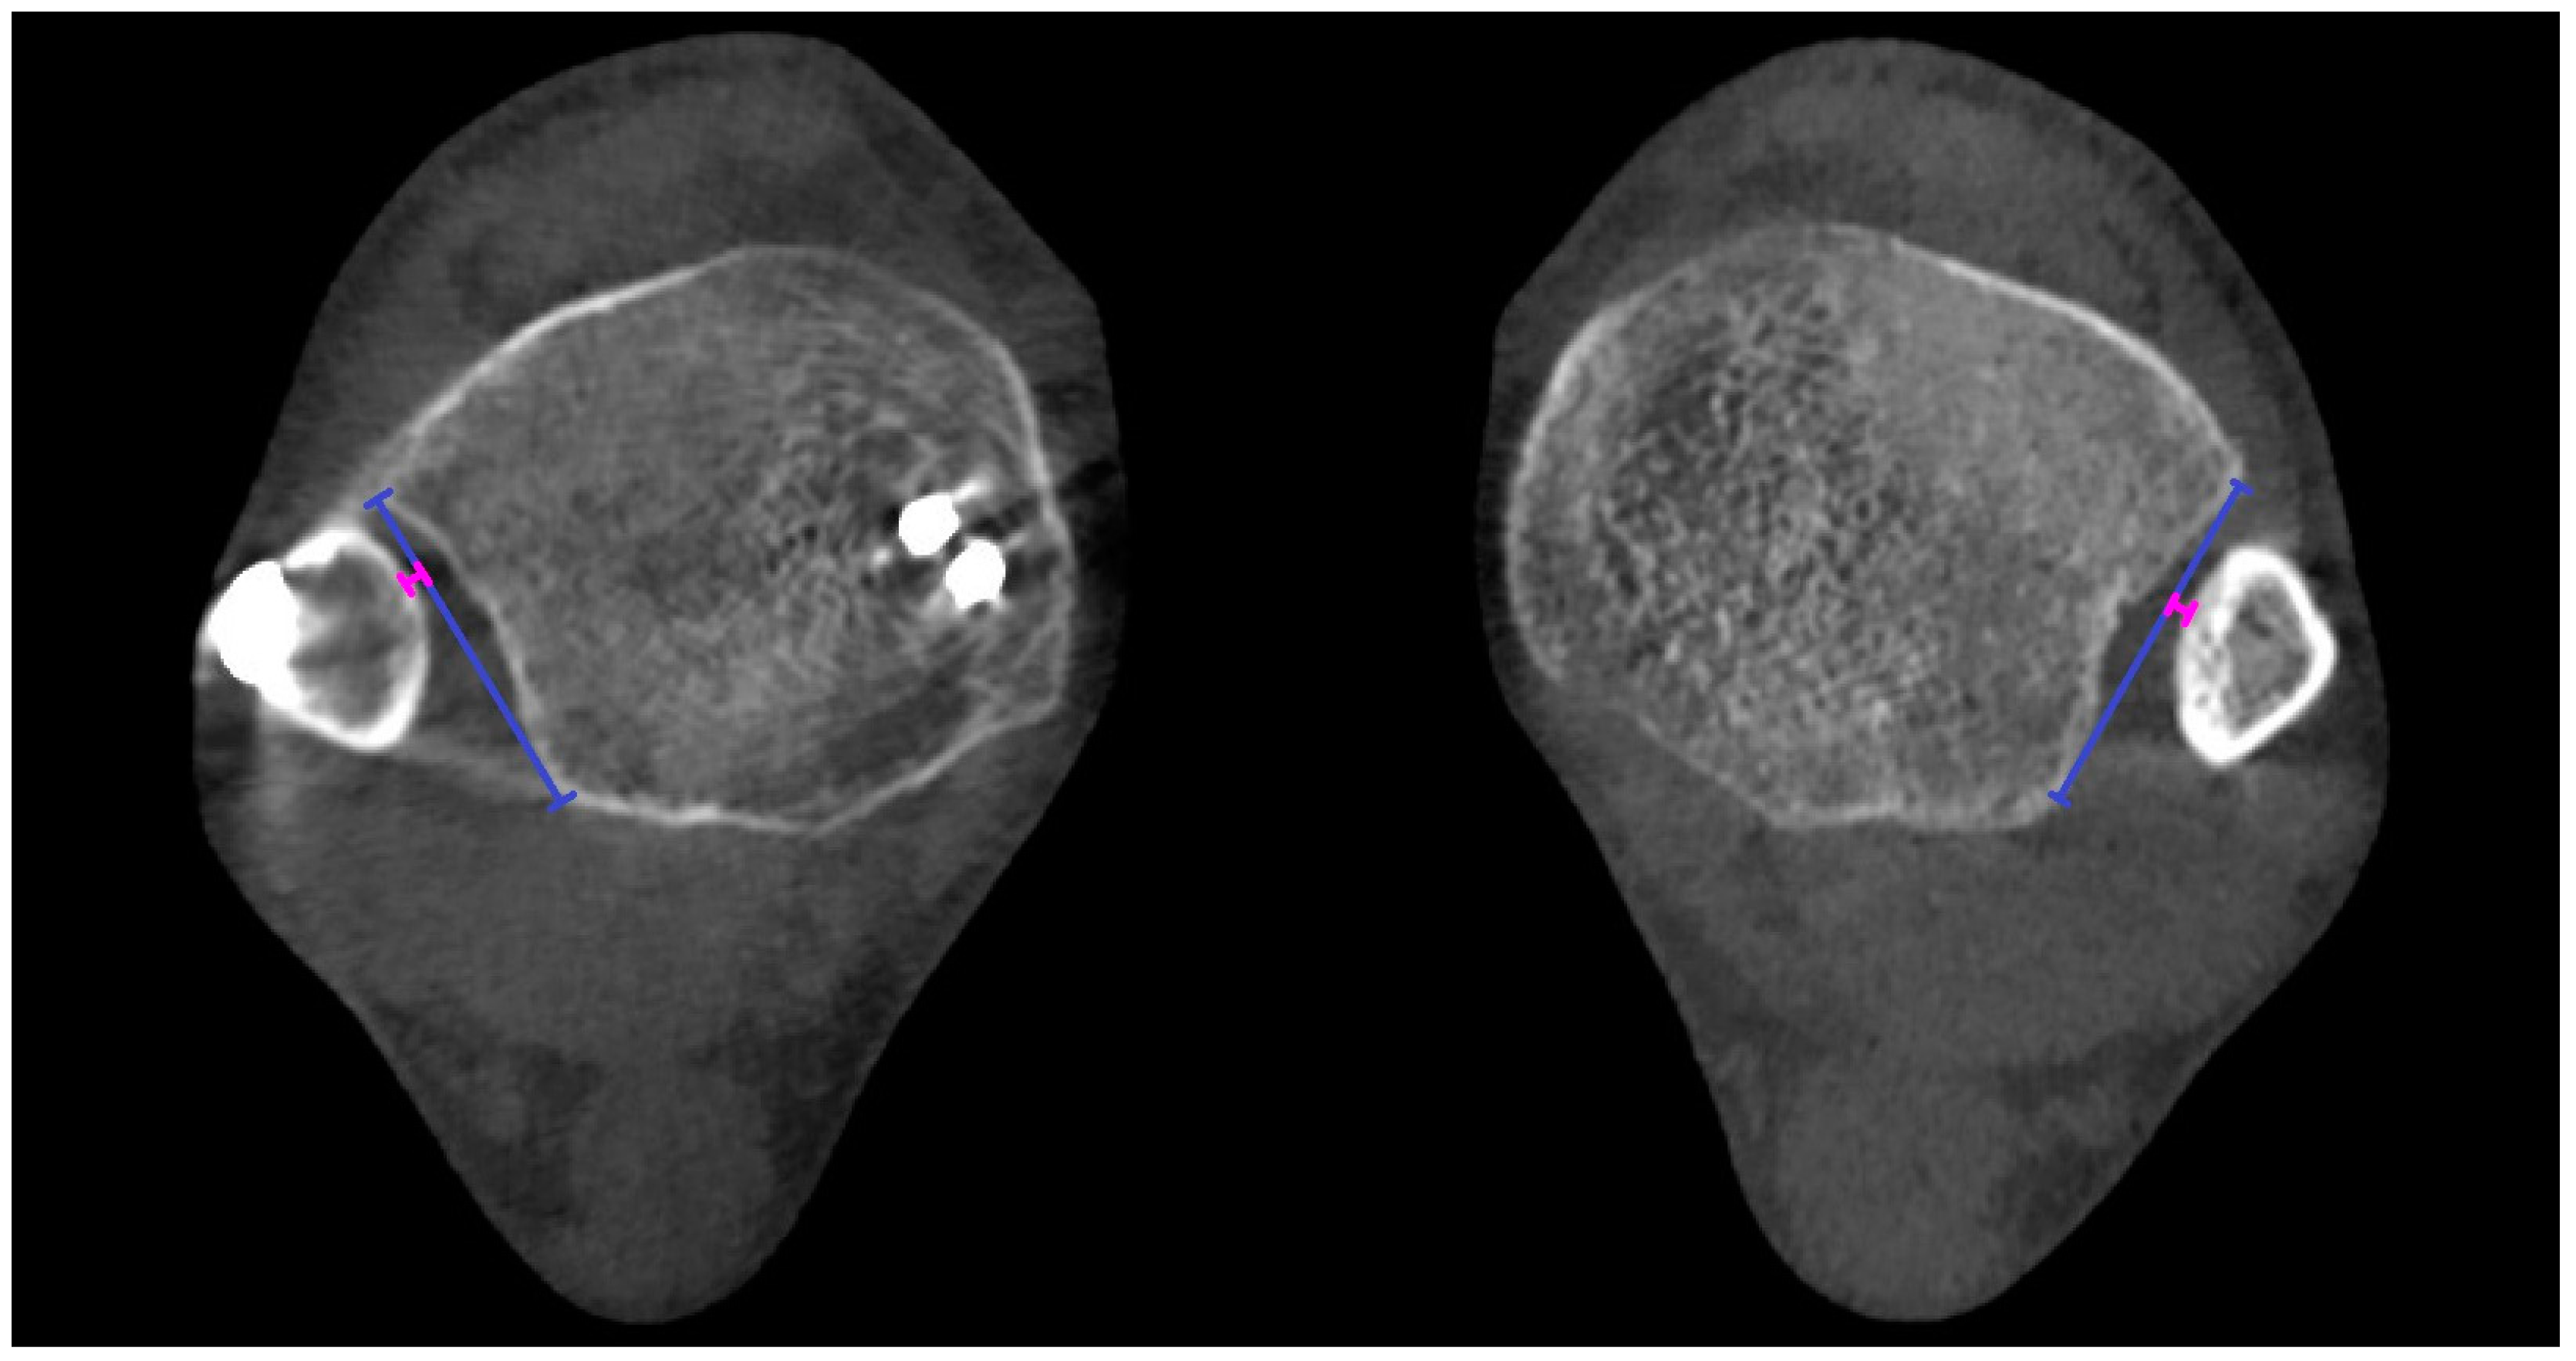
Figure 4.
Bilateral presentation of variant 2a of ‘engagement’ shown on both sides with pink lines—the distance between reference Line A (marked blue) and the shortest distance along a perpendicular line to the cortex of the fibula.
Figure 4.
Bilateral presentation of variant 2a of ‘engagement’ shown on both sides with pink lines—the distance between reference Line A (marked blue) and the shortest distance along a perpendicular line to the cortex of the fibula.
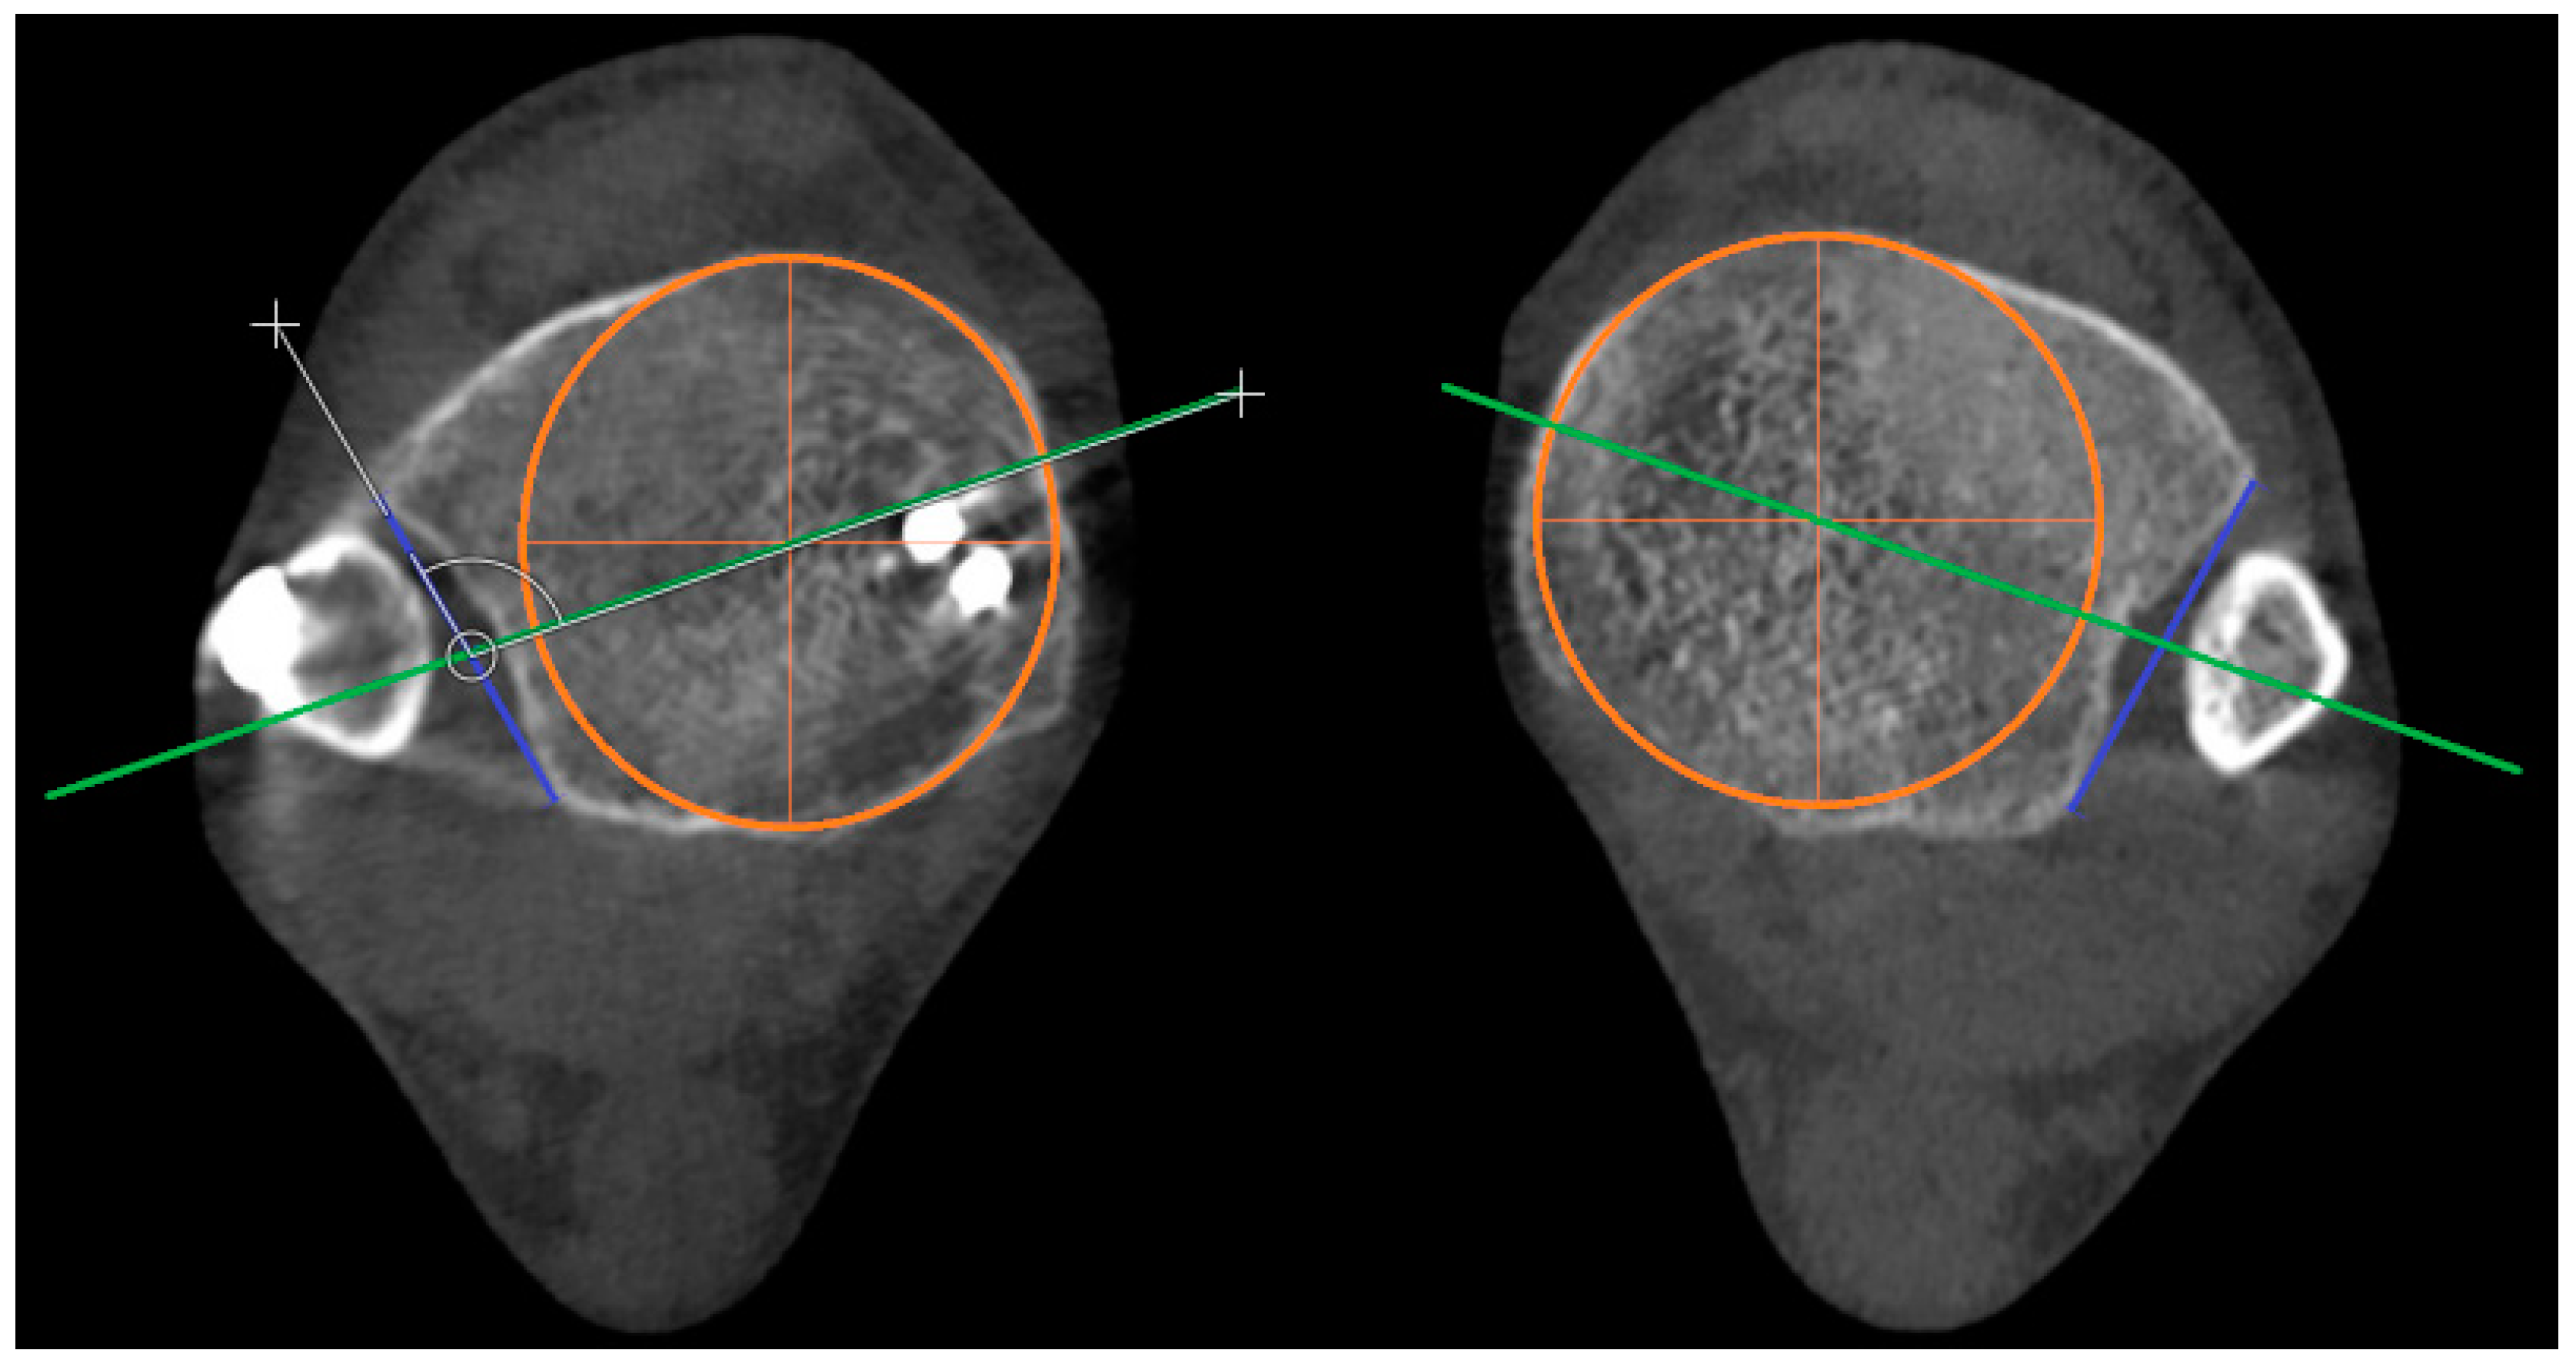
Figure 5.
The angle is measured between reference Line A (marked blue) and reference Line B (marked green). The incisura angle is determined by subtracting 90° from the measured angle value. The circular incision in the tibia is marked in orange.
Figure 5.
The angle is measured between reference Line A (marked blue) and reference Line B (marked green). The incisura angle is determined by subtracting 90° from the measured angle value. The circular incision in the tibia is marked in orange.
Figure 6.
‘Protrusion’ is marked with a brown line. Reference lines are marked blue (Line A) and green (Line B). The circular incision in the tibia is marked in orange.
Figure 6.
‘Protrusion’ is marked with a brown line. Reference lines are marked blue (Line A) and green (Line B). The circular incision in the tibia is marked in orange.
Figure 7.
Torsion of the fibula (torsion) angles measured in both ankles. Measurements were taken in the axial plane, 5, 6, and 7 mm distal to the lateral margin of the tibial plafond. Orange lines represent the articular surfaces of the lateral and medial malleolus of the unaffected ankle, while light-blue lines correspond to the affected ankle. The angle of the unaffected ankle is measured between the orange lines, and the angle of the affected side is measured between the light-blue lines. Dark blue represents transverse line which is not relevant for the measurments.
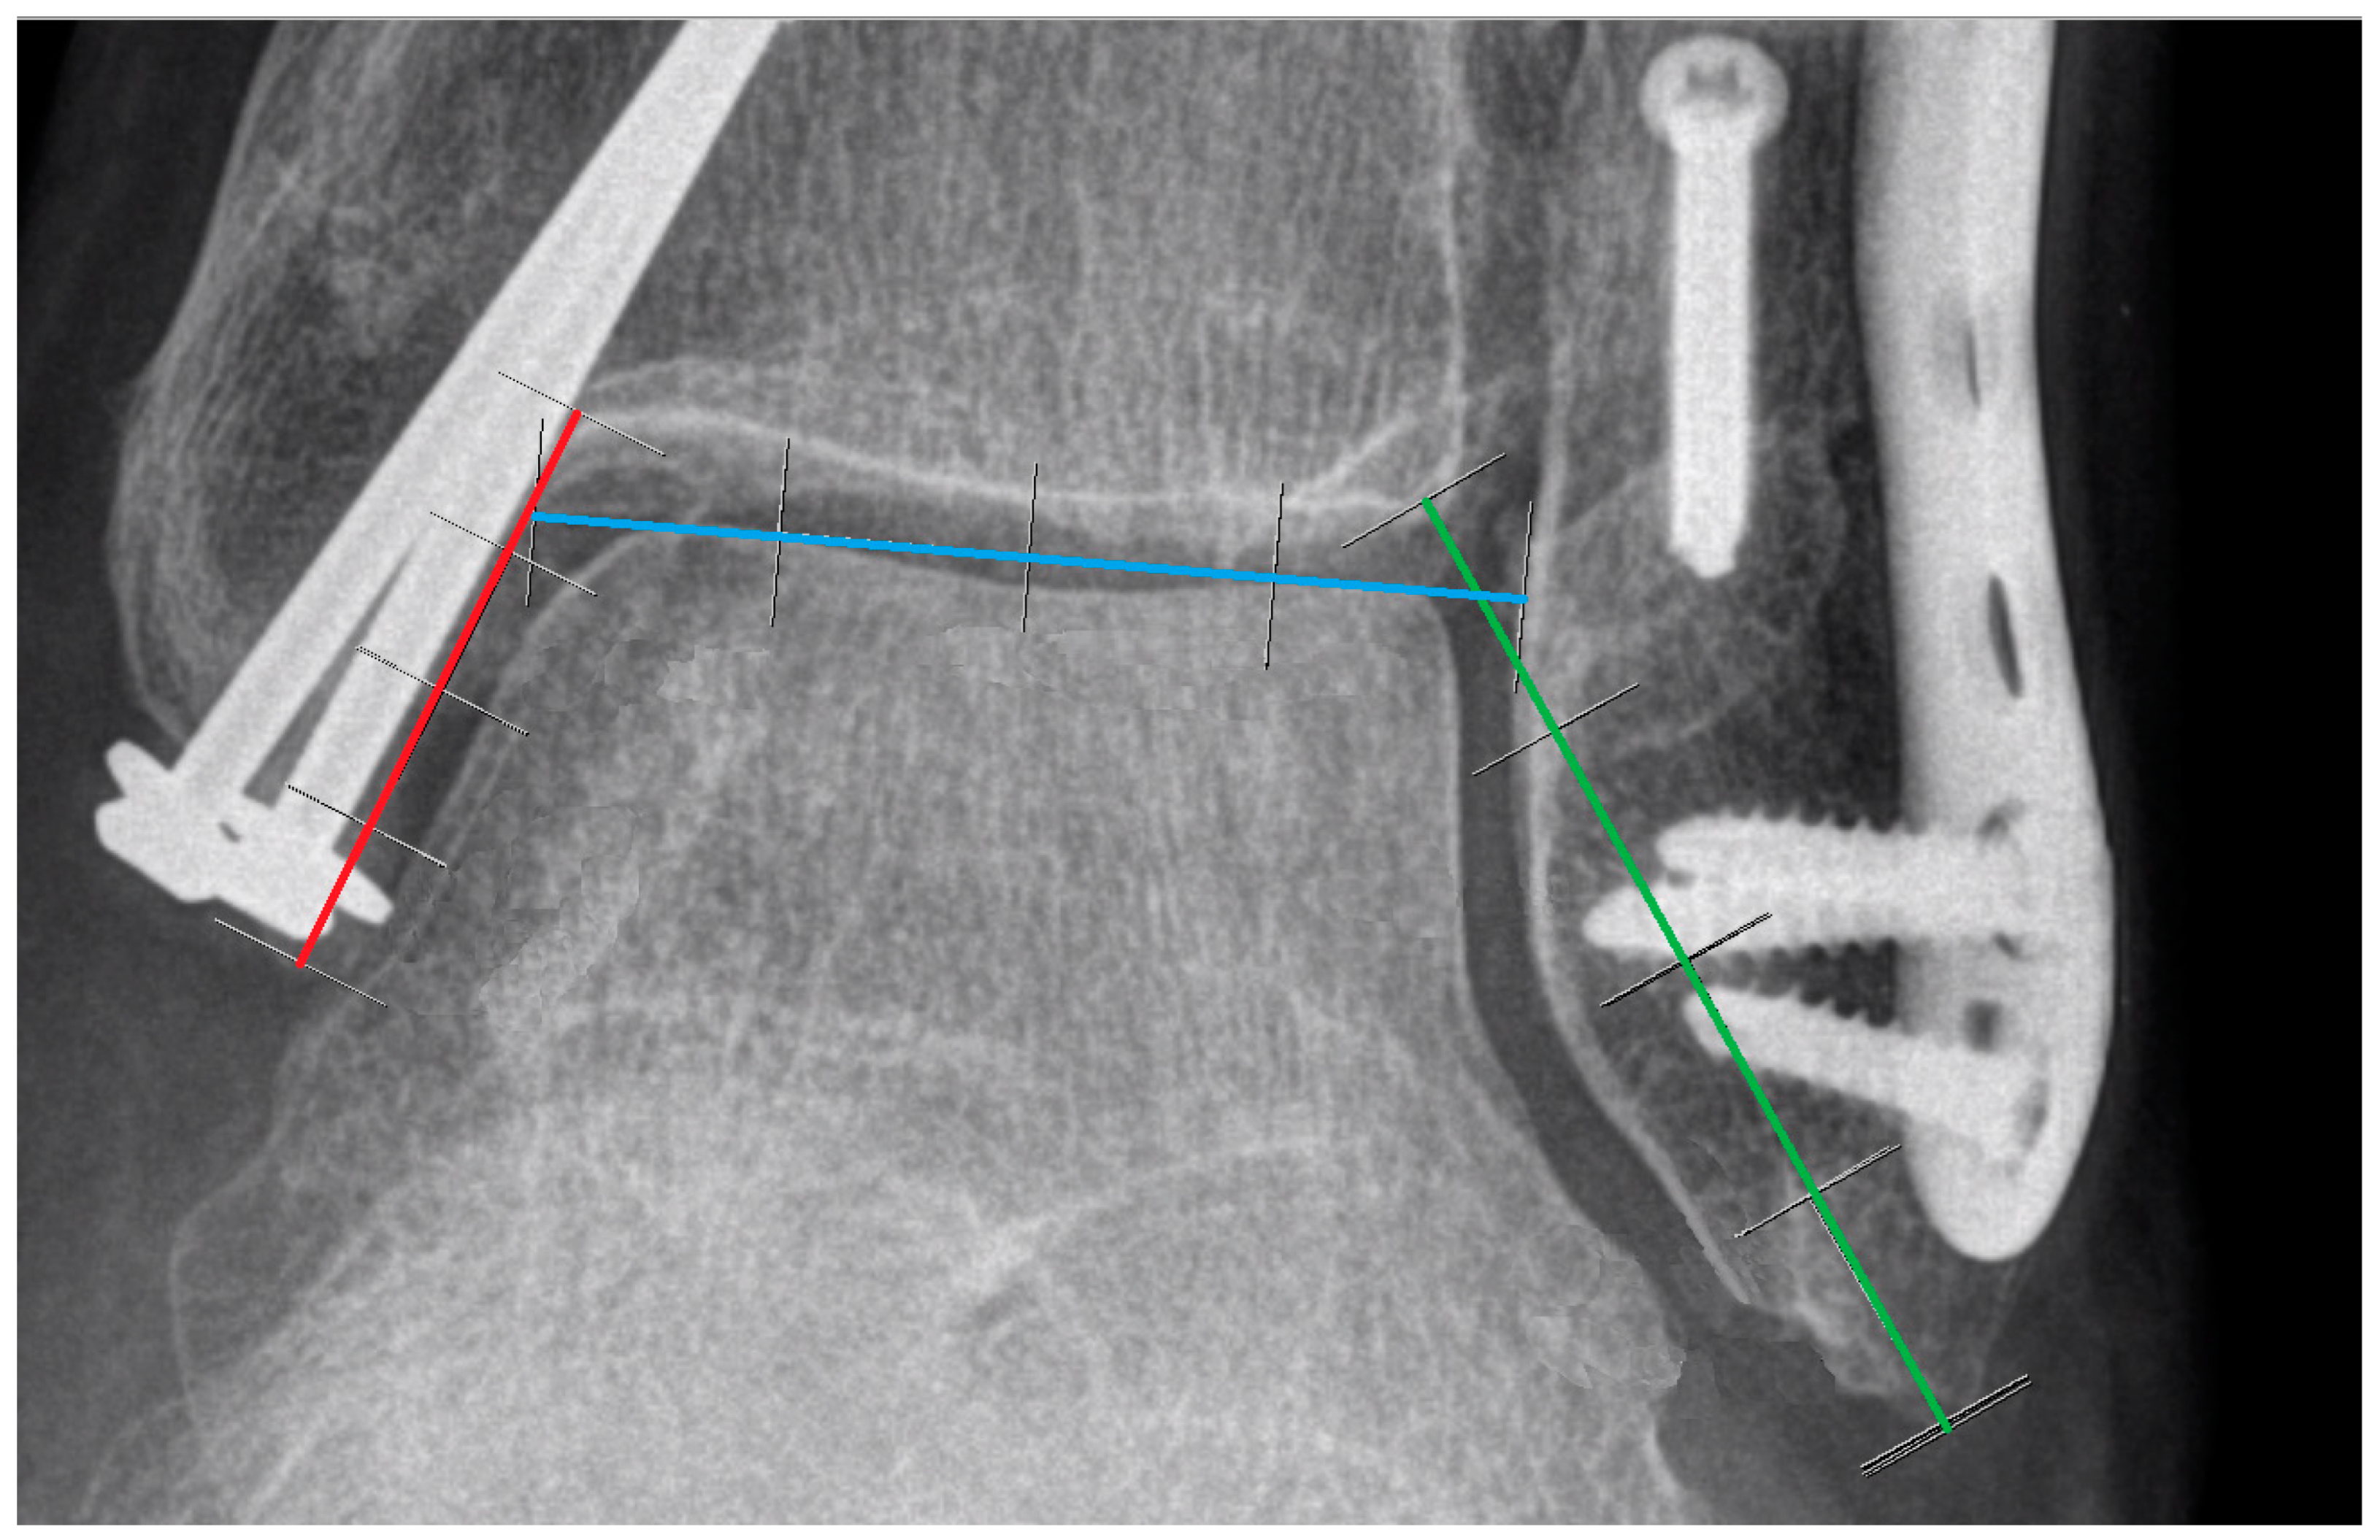
Figure 8.
Three lines of proportion were used to establish reference points for measuring the joint space: Line X (red), Line Y (green), and Line Z (blue). All lines are divided into four equal parts. Line X is defined from the tip of the medial malleolus to the curve connecting the medial malleolus with the tibial plafond. Line Y is defined from the tip of the fibula to the most medial point of the tibial plafond. Line Z is established by connecting the highest points of the talar bone and extending the line to make contact with the fibular and tibial cortex within the joint.
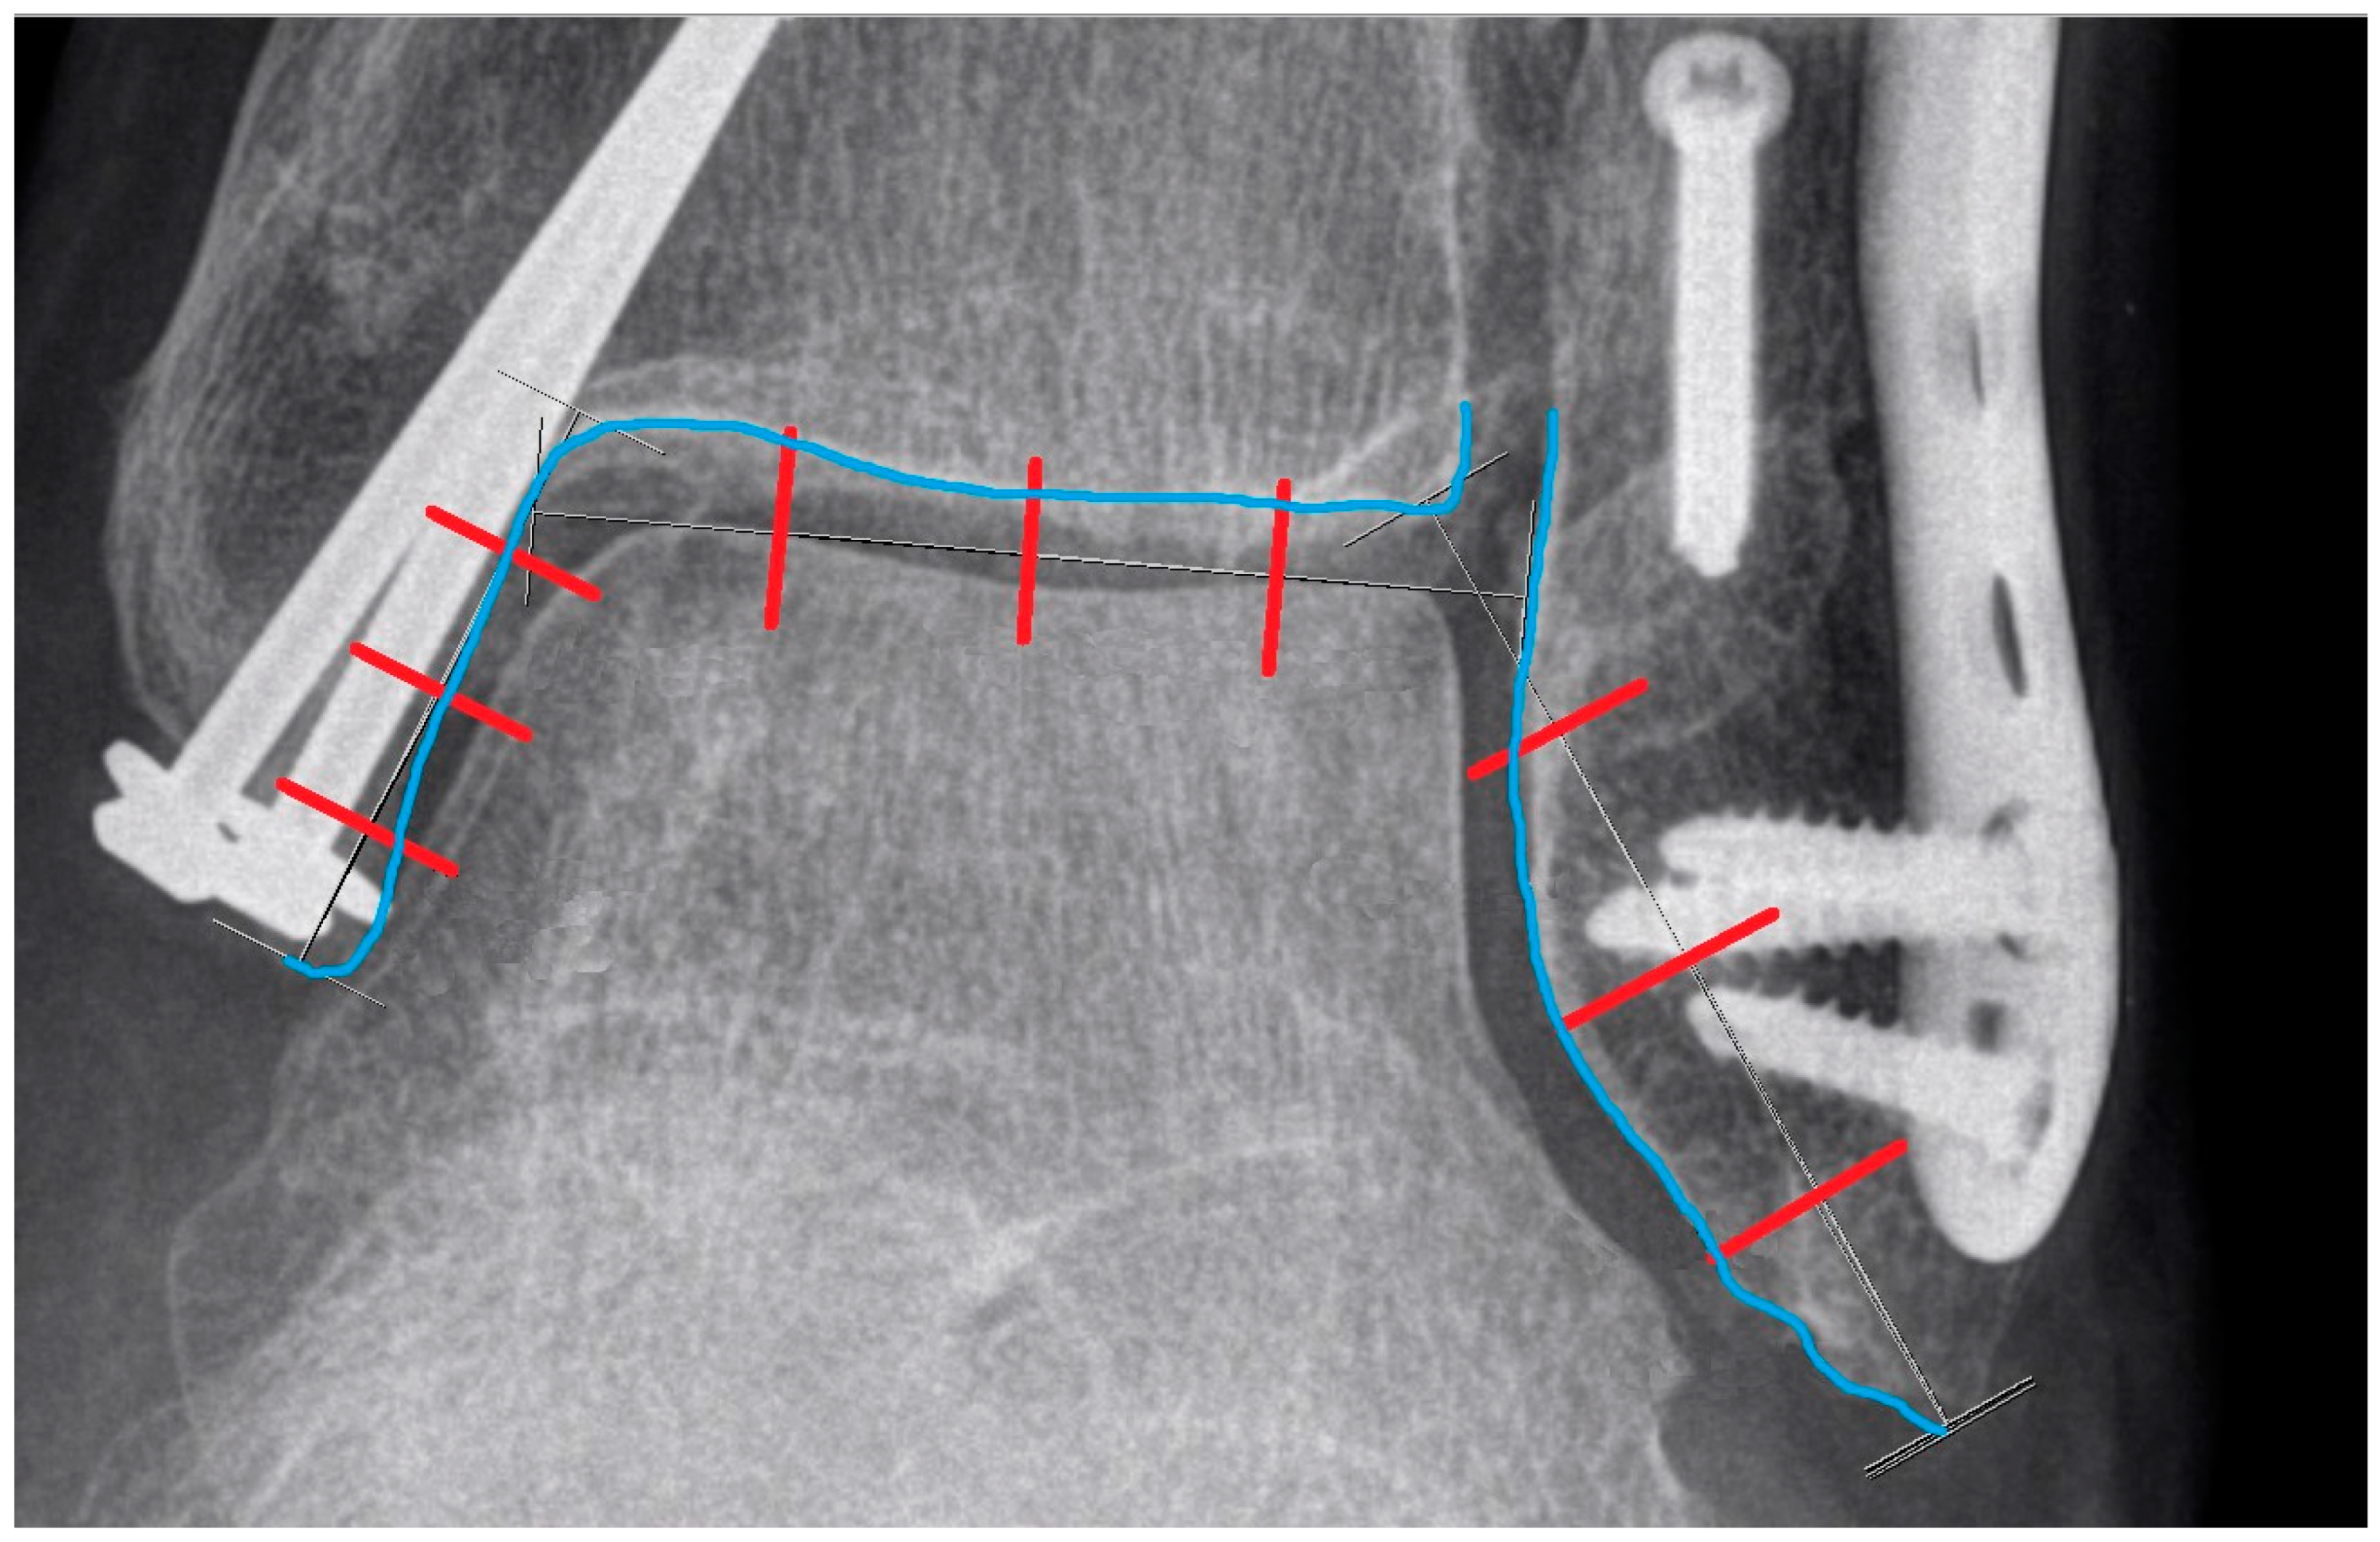
Figure 9.
The blue line represents the cortical contour of the tibia and fibula. The red lines divide the previously shown Lines X, Y, and Z into four equal parts. These red lines are extended perpendicularly and intersect with the blue contour, creating reference points for further measurements.
Figure 9.
The blue line represents the cortical contour of the tibia and fibula. The red lines divide the previously shown Lines X, Y, and Z into four equal parts. These red lines are extended perpendicularly and intersect with the blue contour, creating reference points for further measurements.
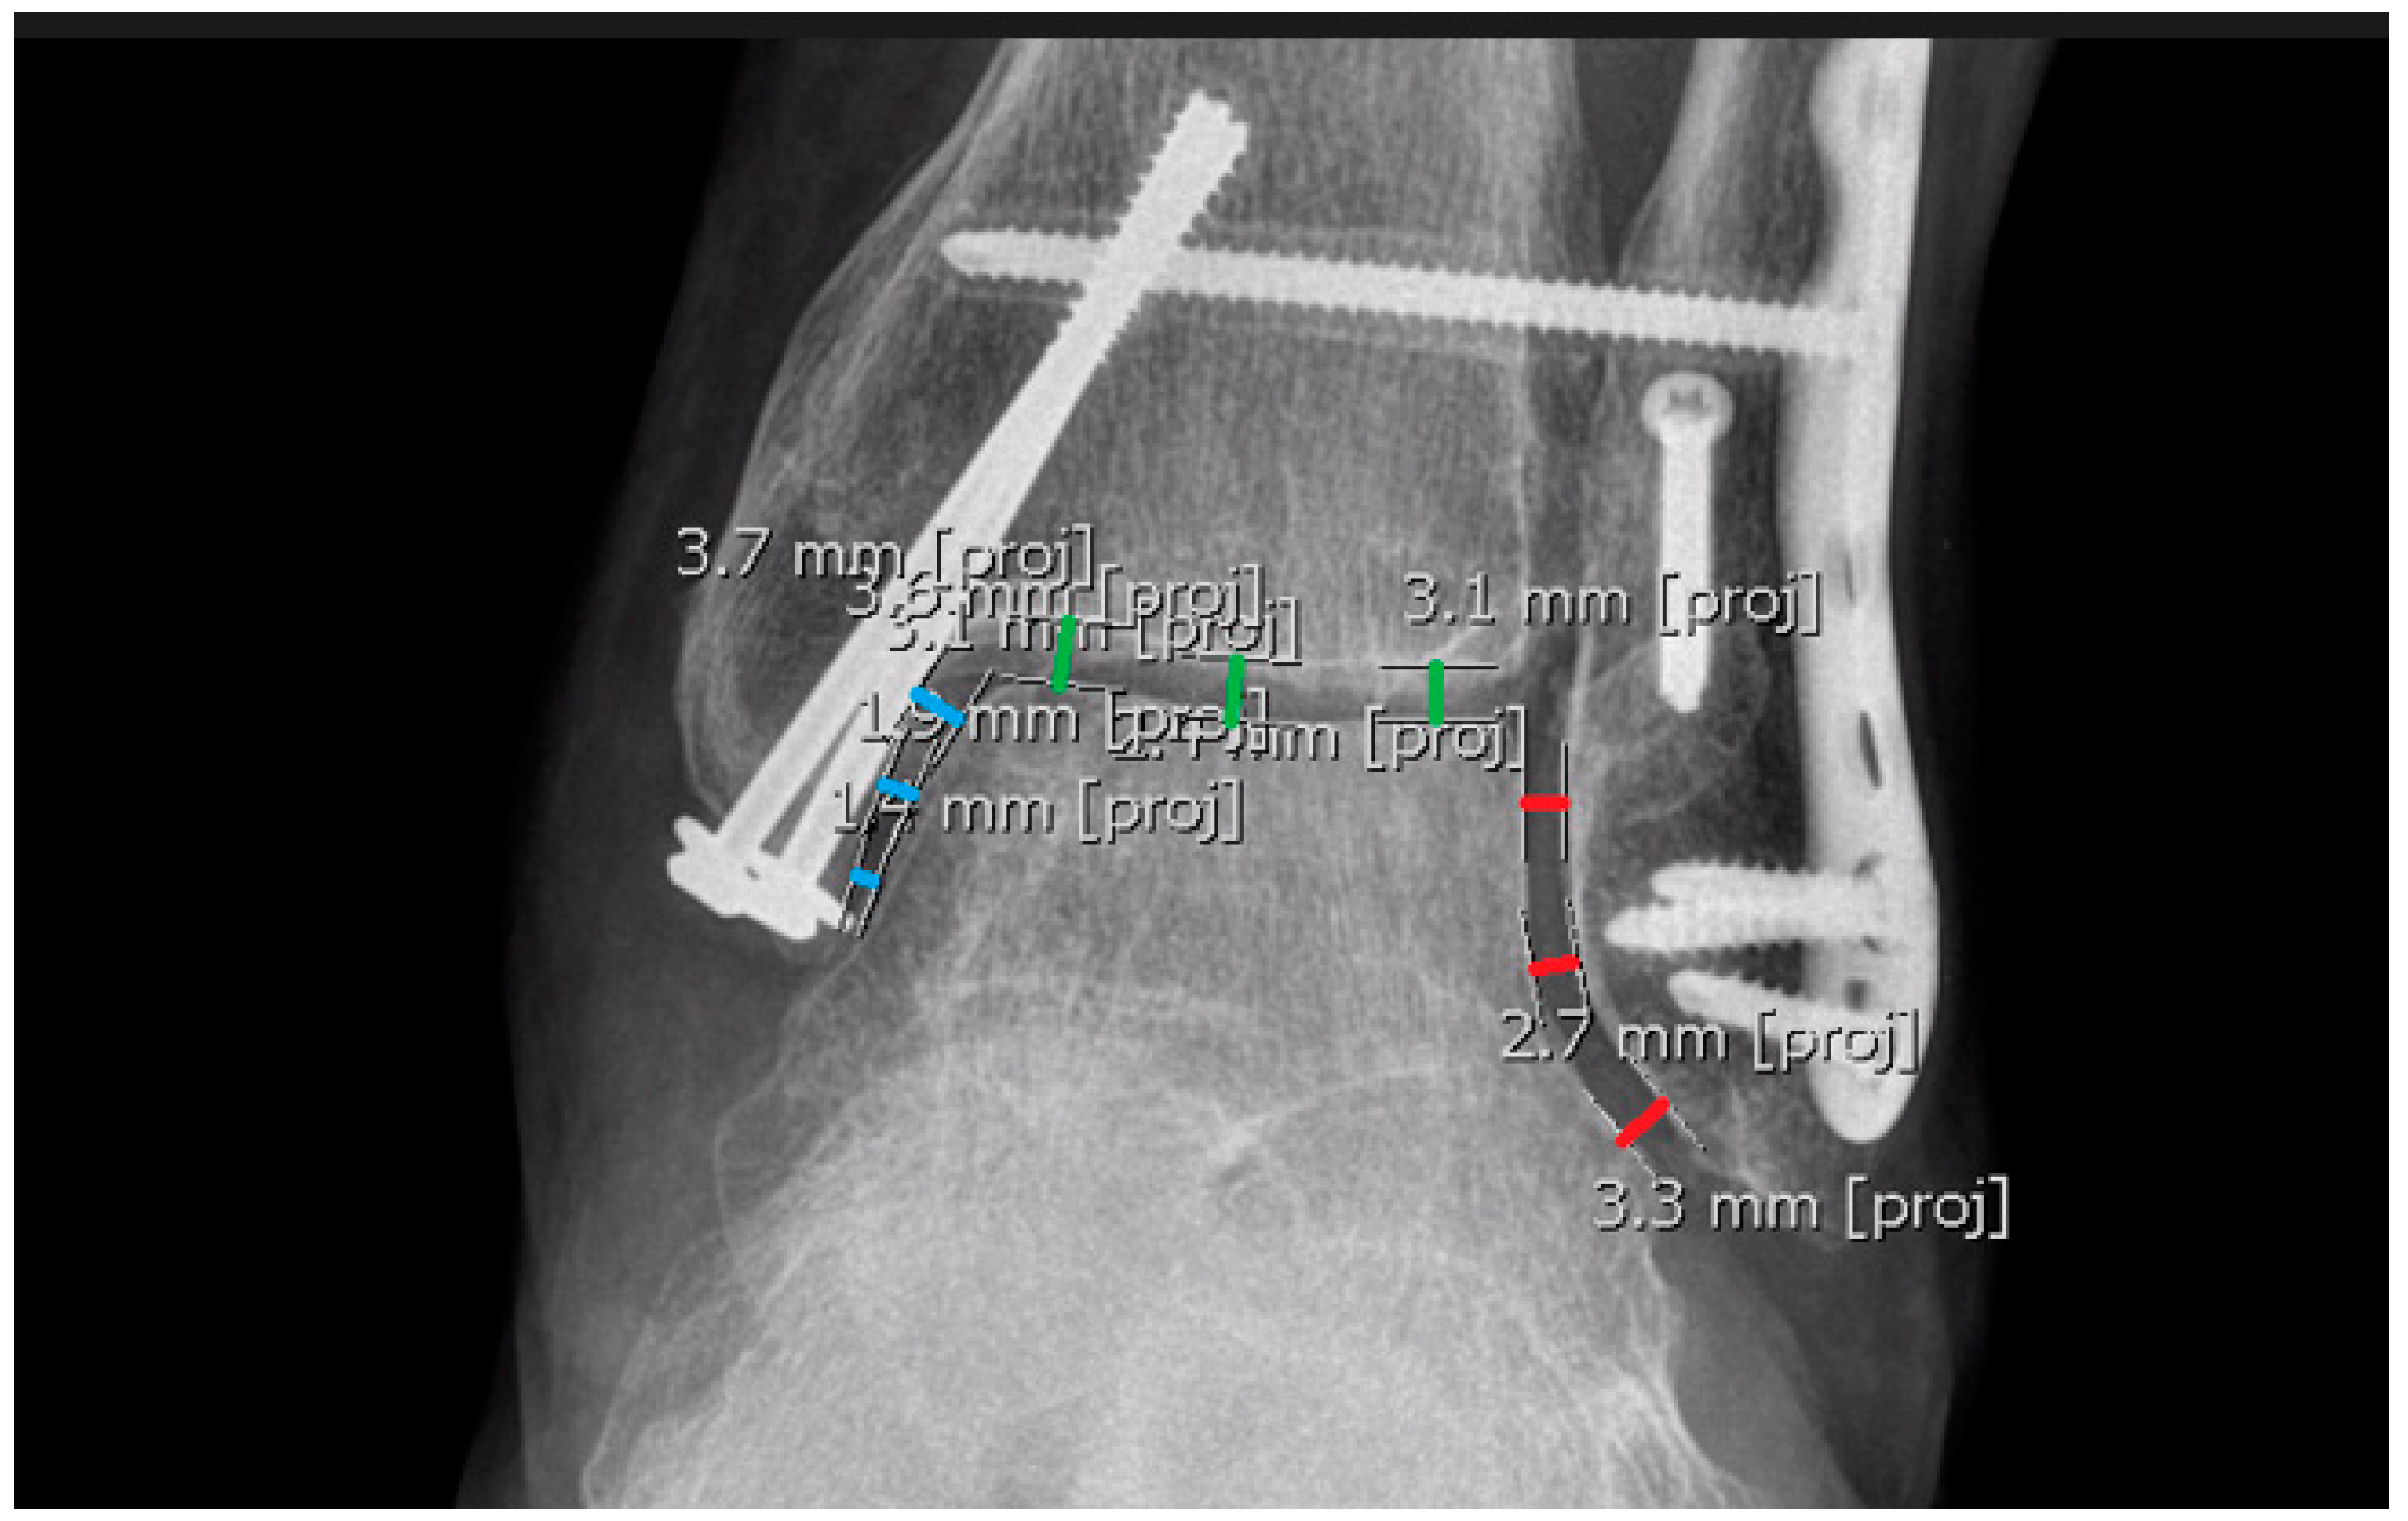
Figure 10.
Measurements without reference lines. The red, green, and blue lines represent measurements for lateral clear space, ankle joint space, and medial clear space, respectively. The exact values displayed in the figure are not essential.
Figure 10.
Measurements without reference lines. The red, green, and blue lines represent measurements for lateral clear space, ankle joint space, and medial clear space, respectively. The exact values displayed in the figure are not essential.
Figure 11.
The red line represents the width of the fibular overlap, while the blue line indicates the plane of the tibial plafond. These lines are parallel.
Figure 11.
The red line represents the width of the fibular overlap, while the blue line indicates the plane of the tibial plafond. These lines are parallel.
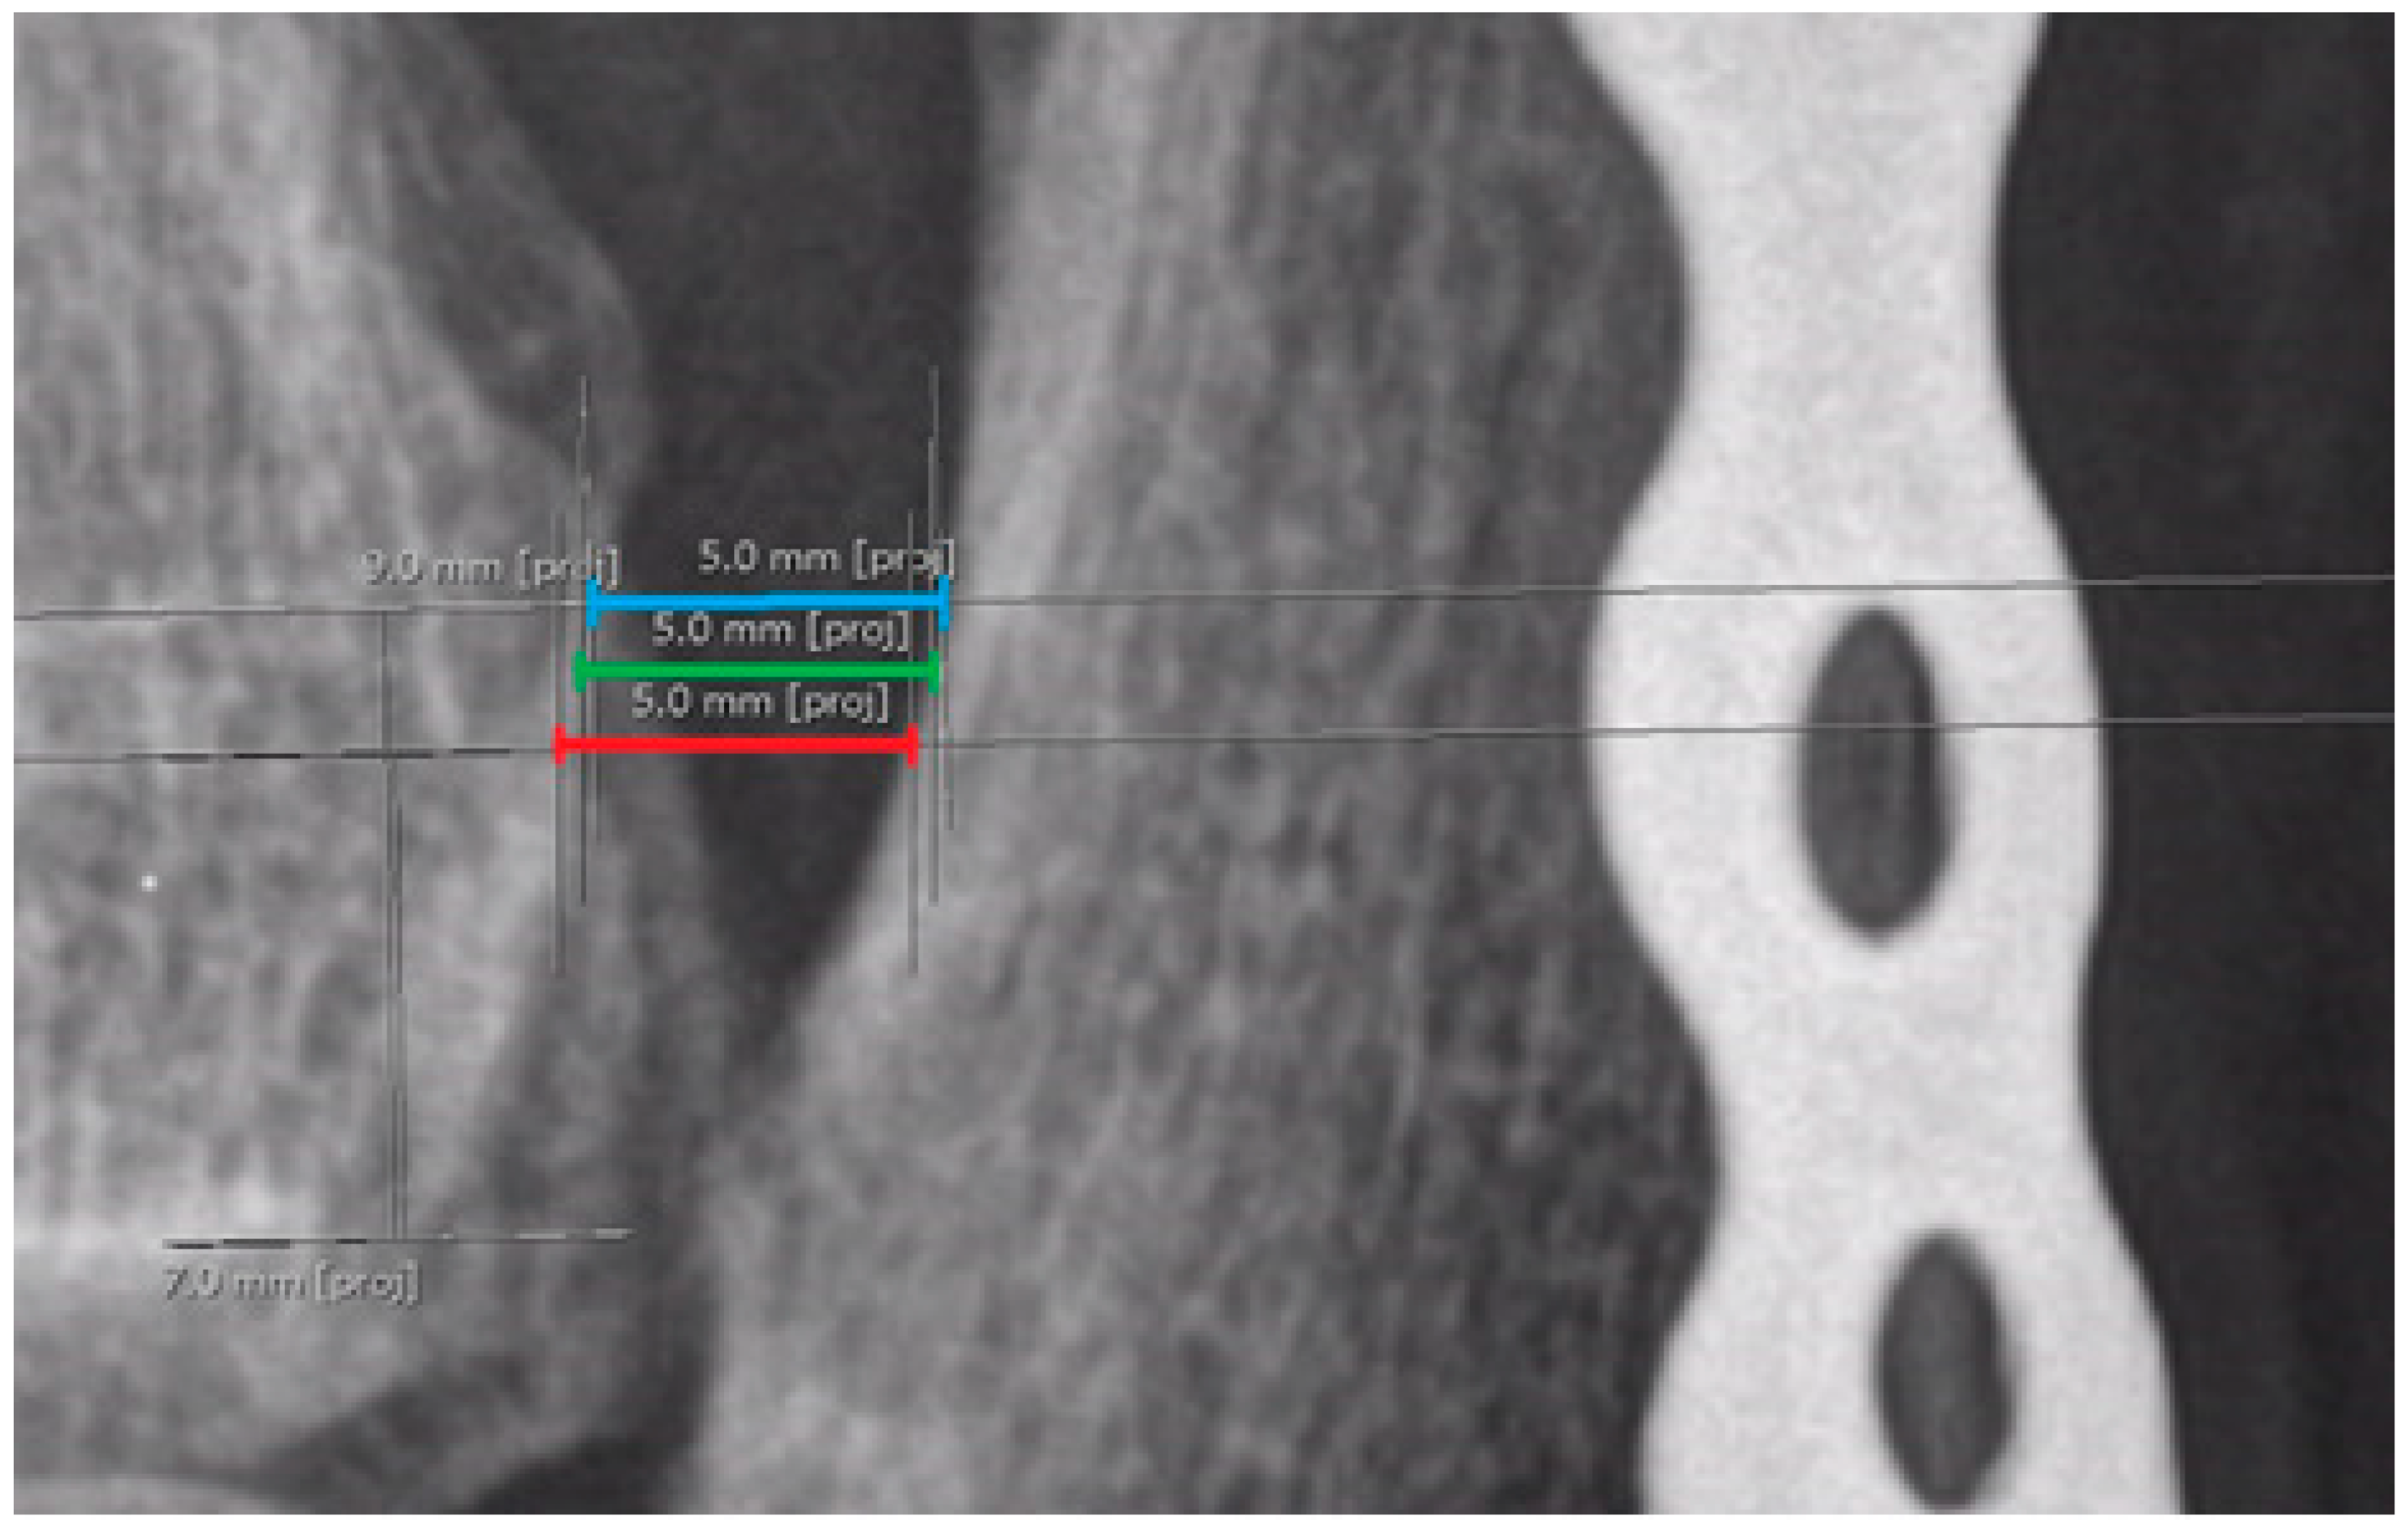
Figure 12.
Three separate measurements of syndesmosis width in the mortise view, taken at three different levels: blue, green, and red lines represent measurements 9 mm, 8 mm, and 7 mm above the lateral margin of the tibial plafond, respectively.
Figure 12.
Three separate measurements of syndesmosis width in the mortise view, taken at three different levels: blue, green, and red lines represent measurements 9 mm, 8 mm, and 7 mm above the lateral margin of the tibial plafond, respectively.
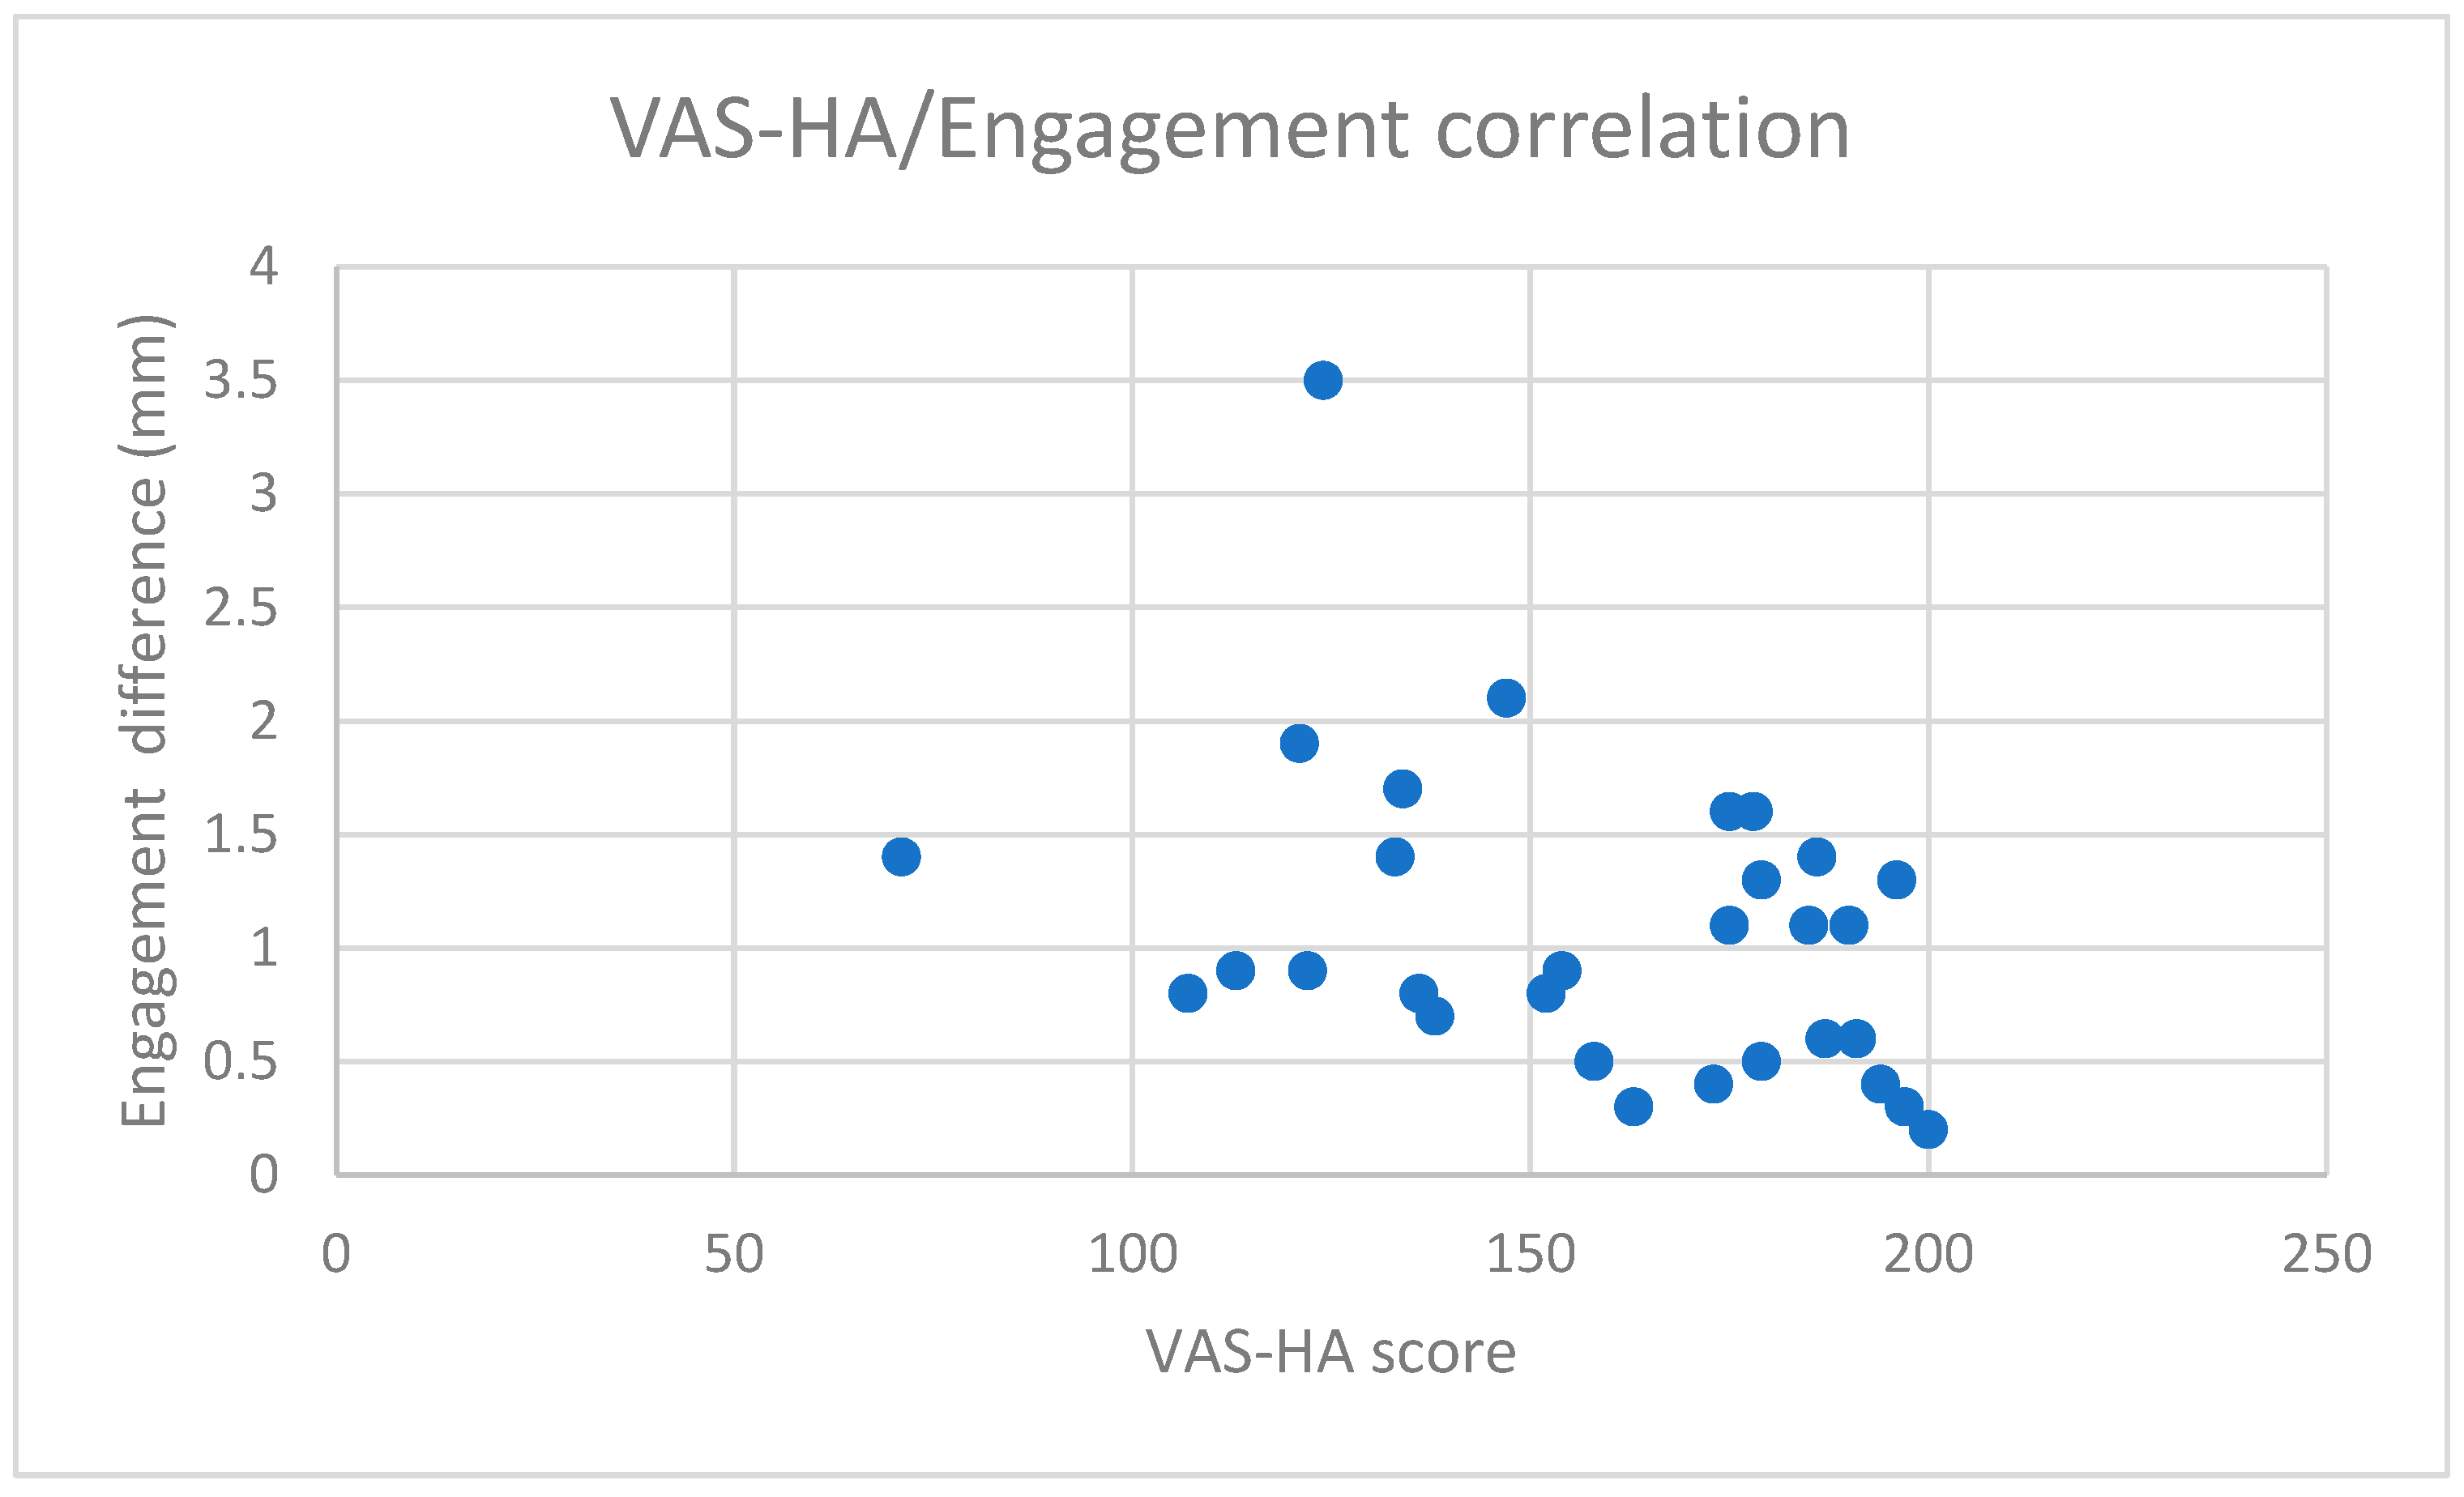
Chart 1.
Correlation between VAS-HA and engagement difference in WBCT. The X-axis represents VAS-HA values (ranging from 0 to 200), while the Y-axis represents the absolute differences in ‘engagement’ between the affected and unaffected ankles (mm). The chart shows a low negative correlation (Pearson’s = −0.364; Spearman’s = −0.401) with high significance, as the p-value is below 0.05 (p = 0.047).
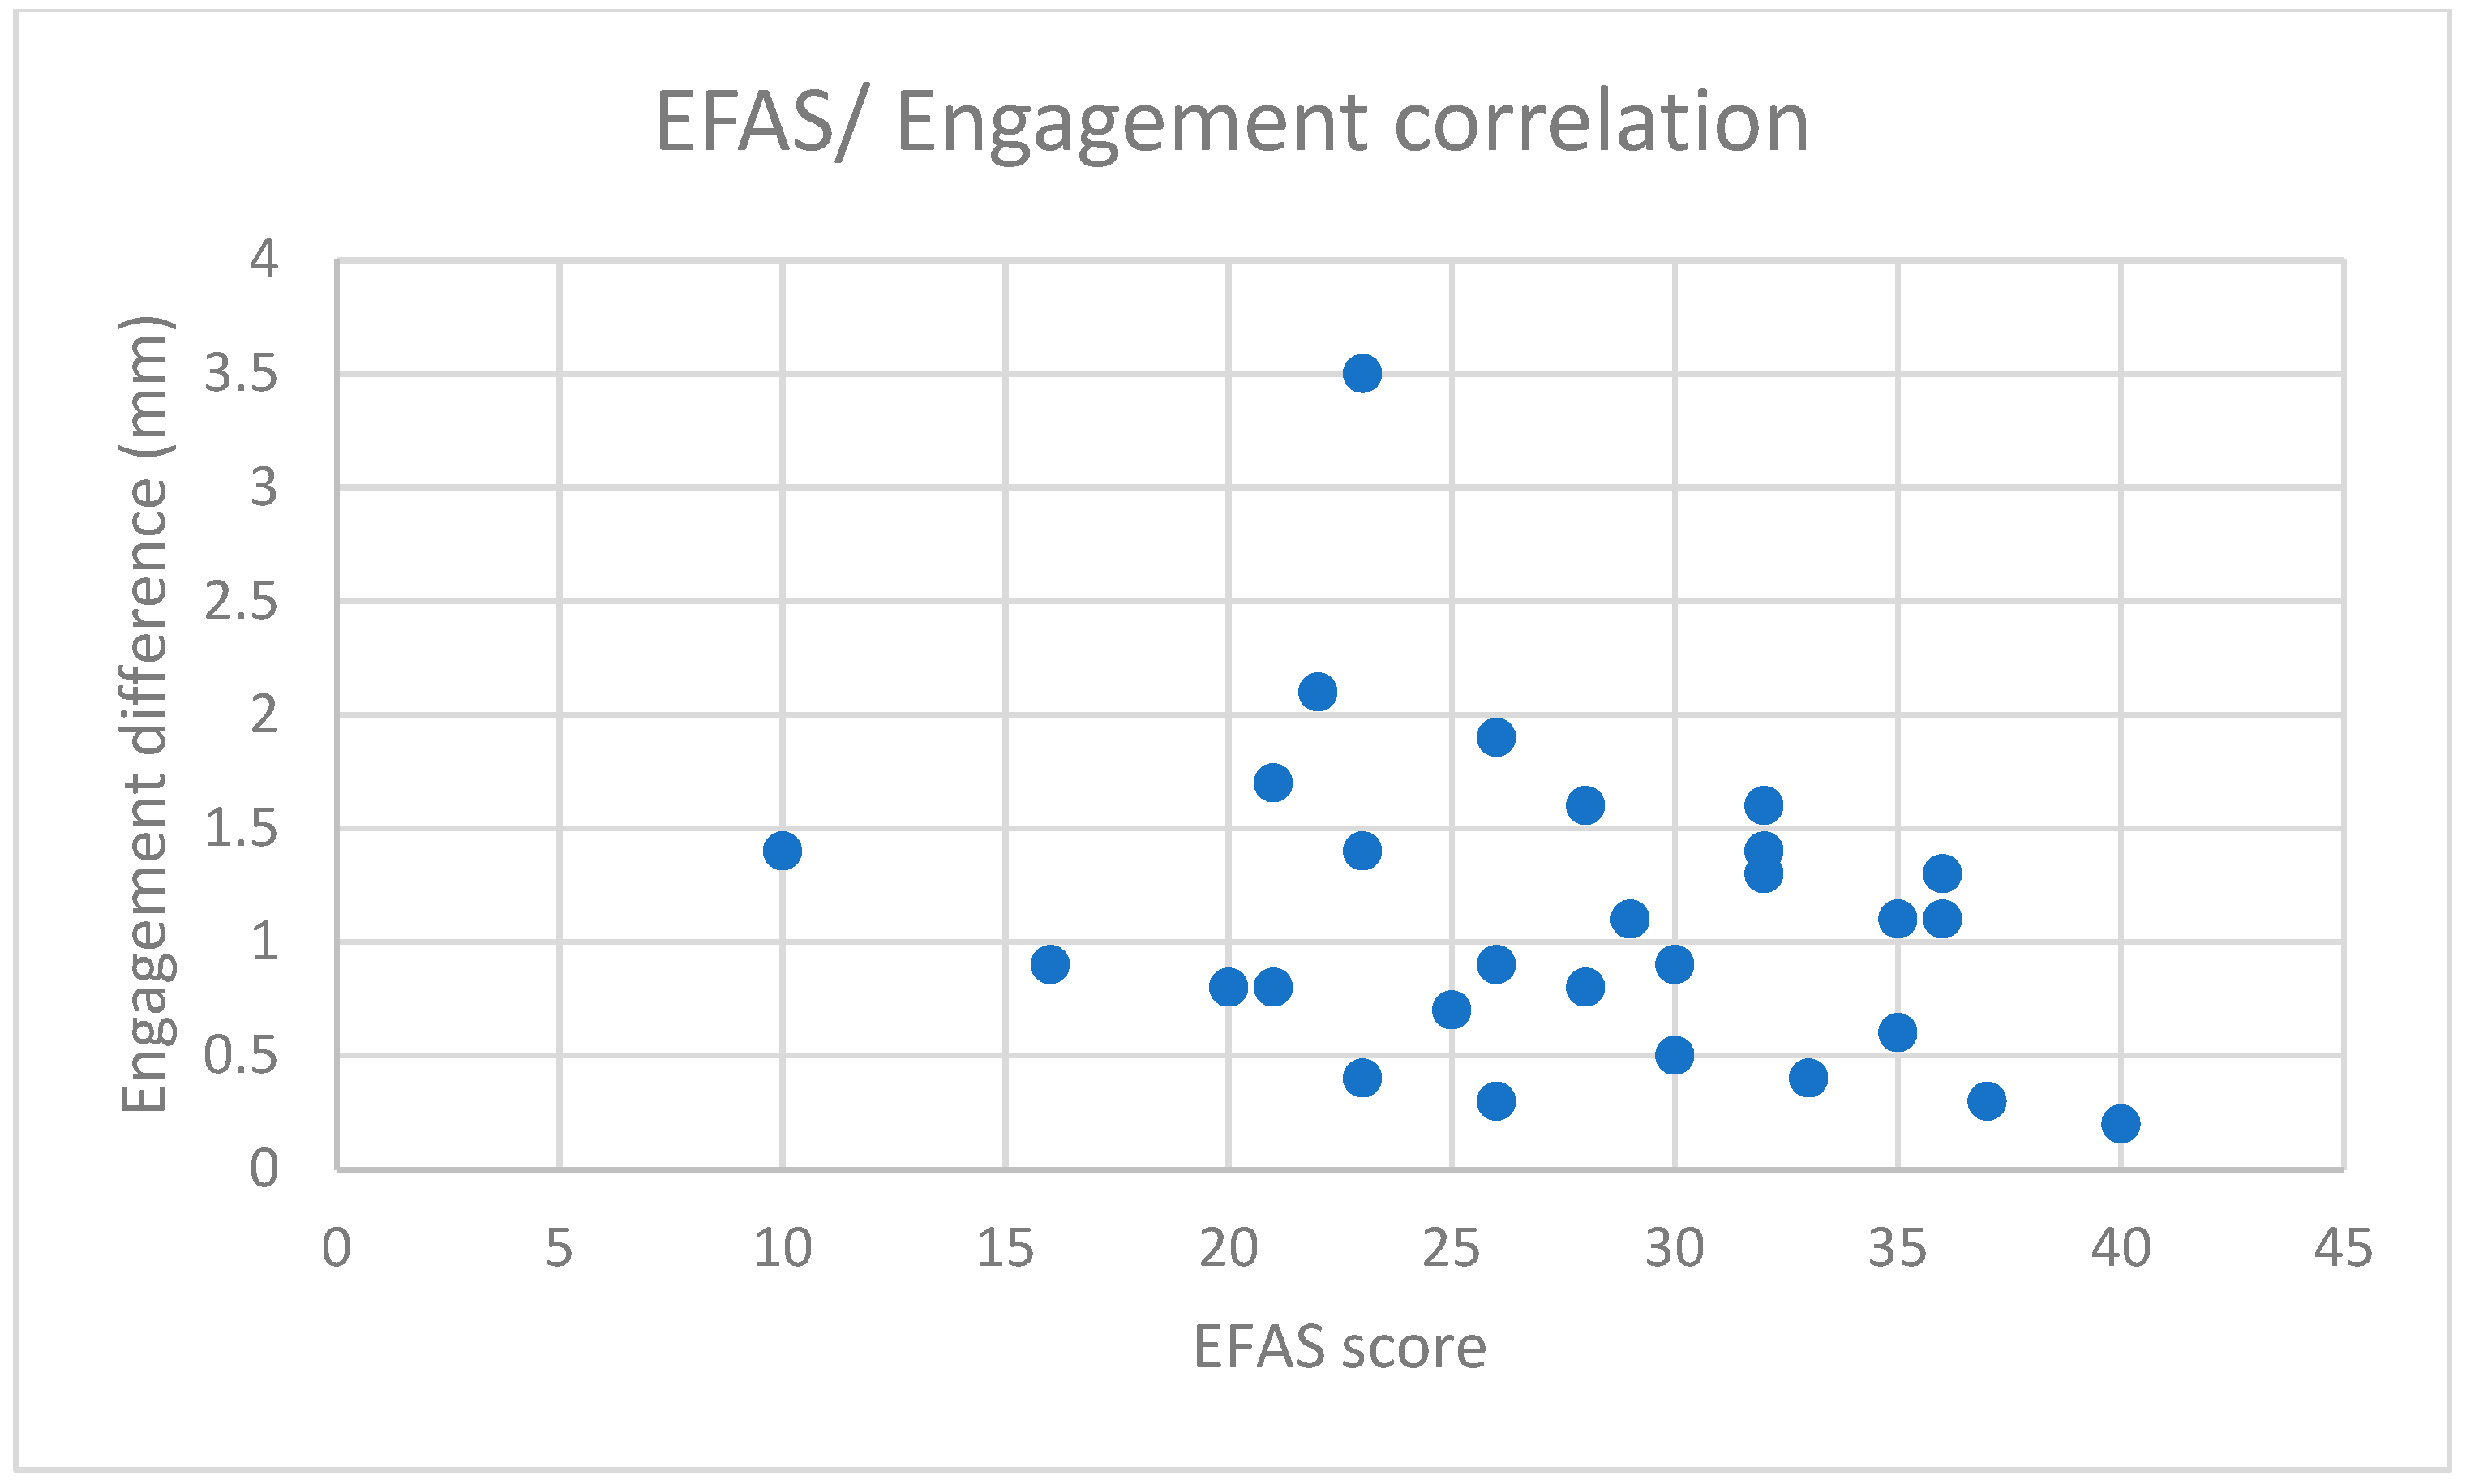
Chart 2.
Correlation between the EFAS scale and engagement difference in WBCT. The X-axis represents EFAS Score results (ranging from 0 to 40), while the Y-axis represents the absolute differences in ‘engagement’ between the affected and unaffected ankles (mm). The chart shows a low negative correlation (Pearson’s = −0.318) with low significance, as the p-value is above 0.05 (p = 0.086).
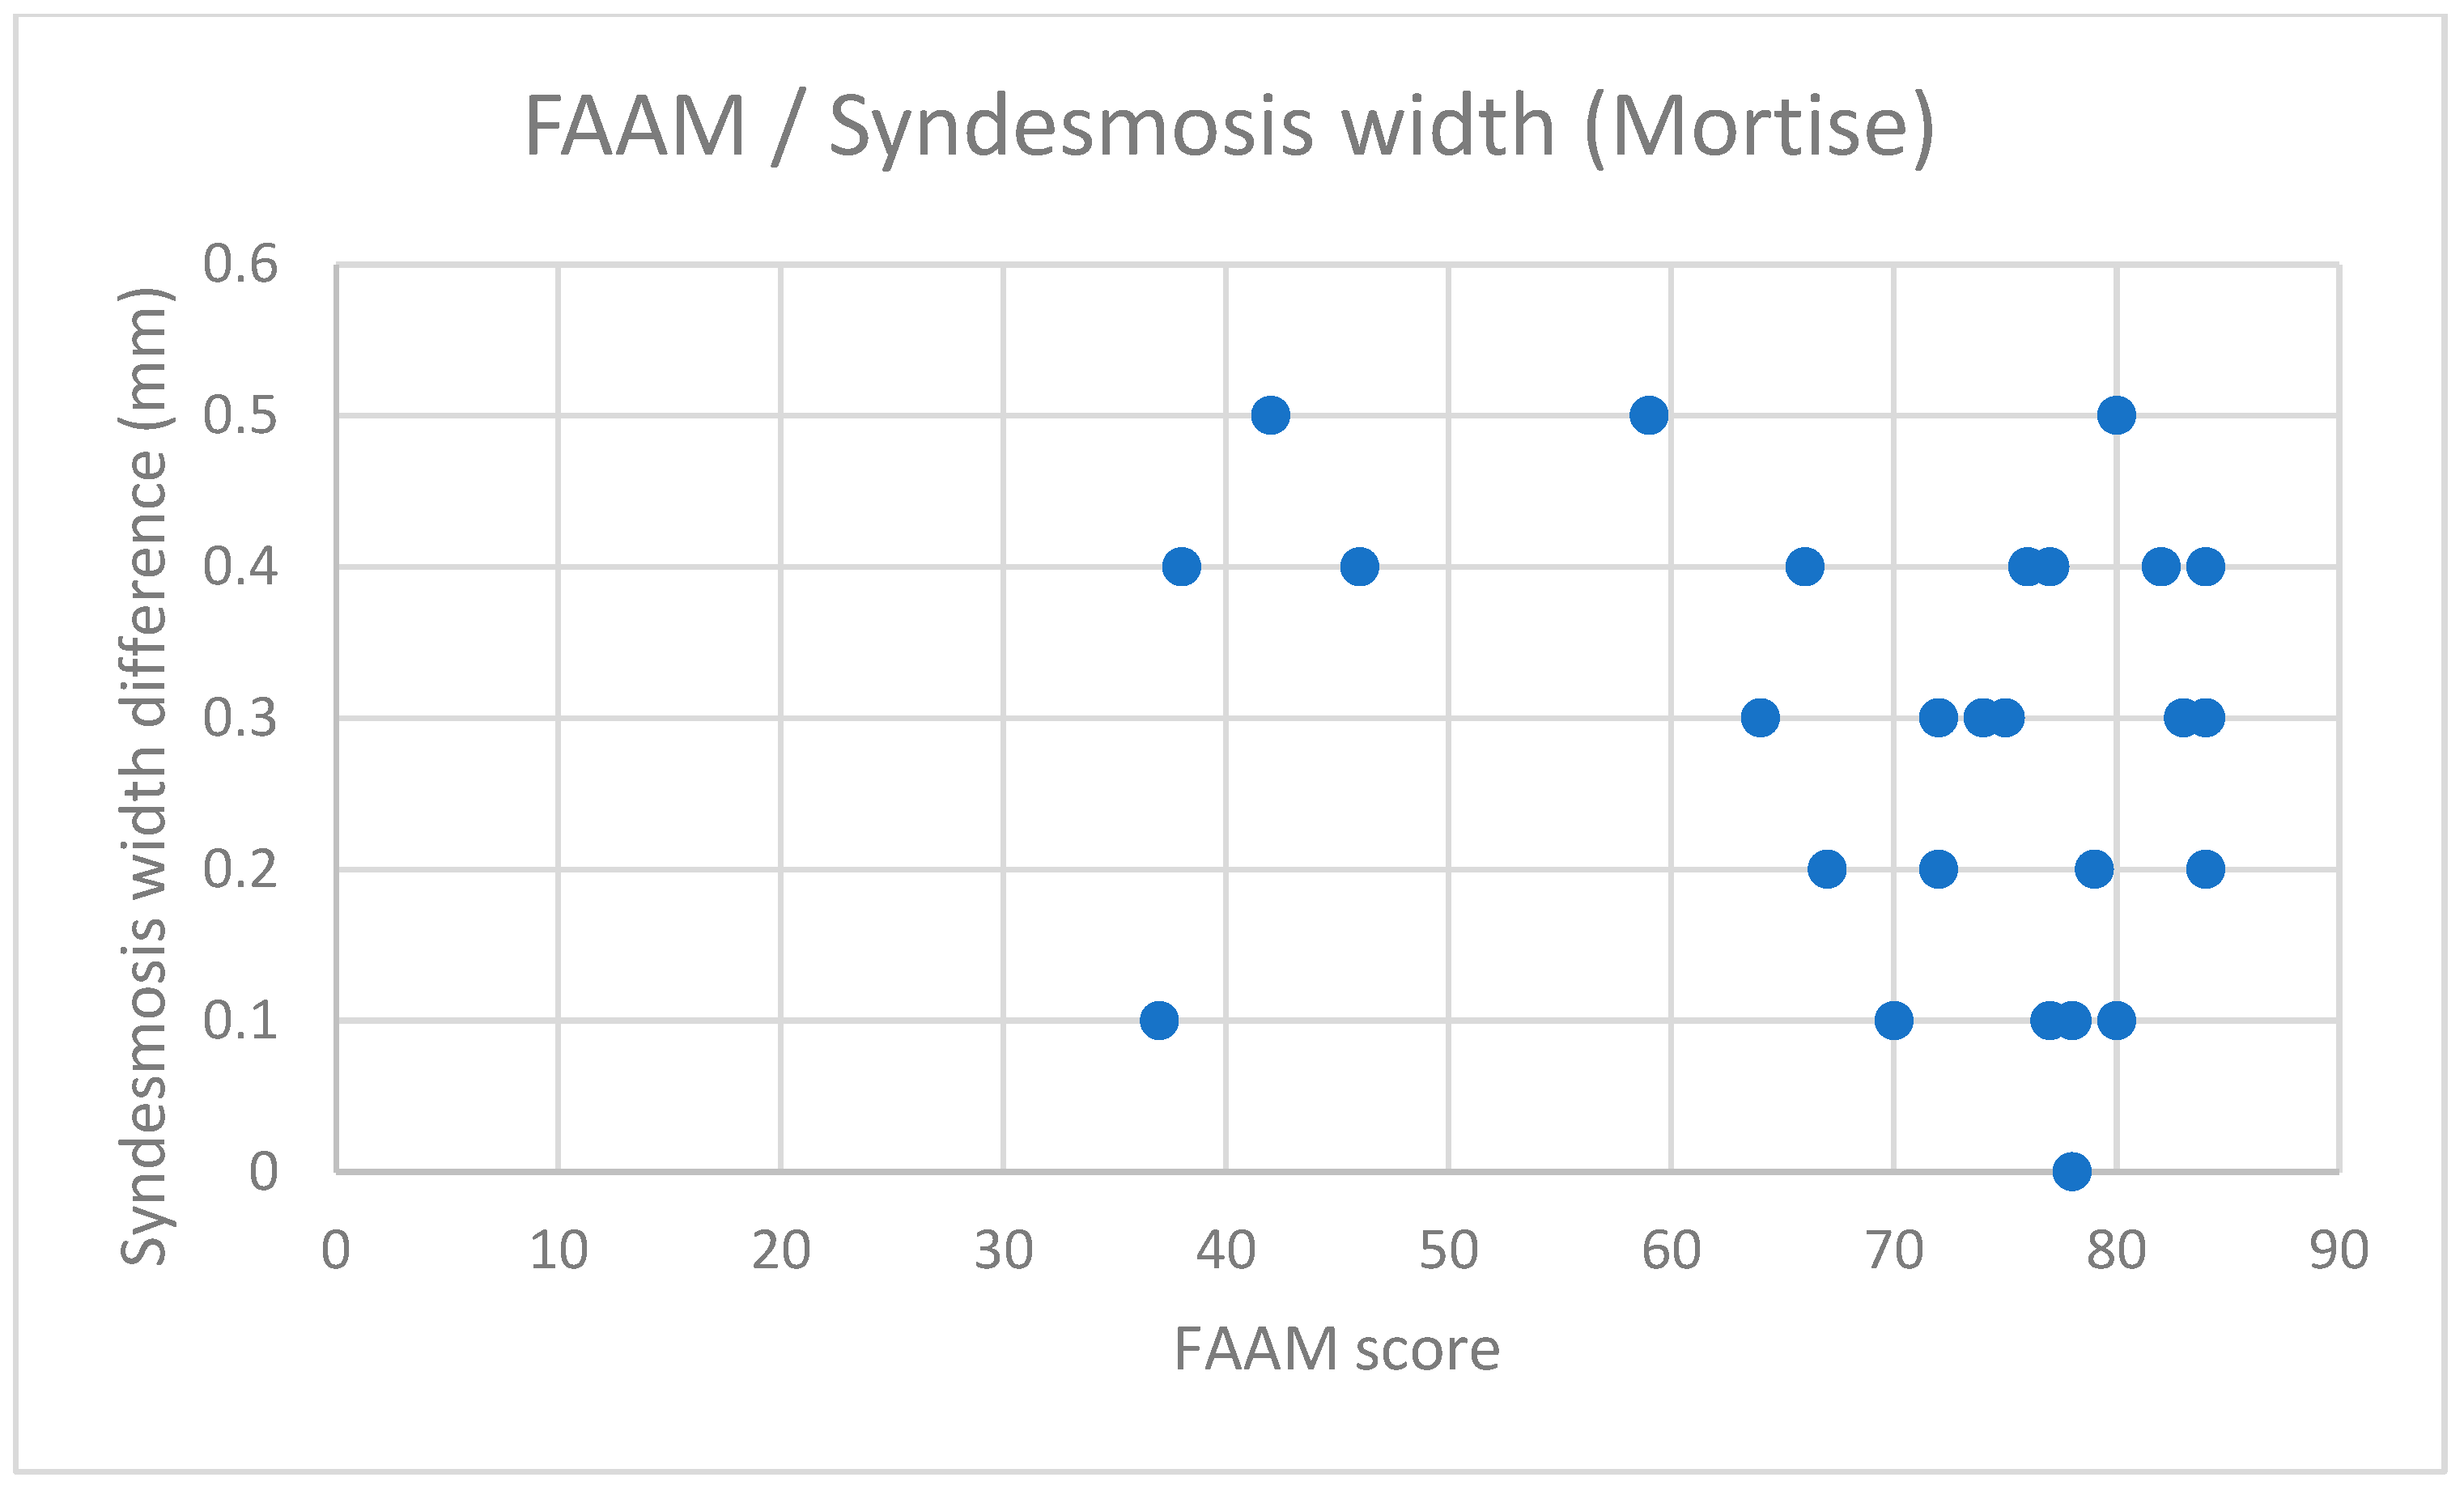
Chart 3.
Correlation between the FAAM scale and syndesmosis width (mortise). The X-axis represents the FAAM Score results (ranging from 0 to 84), while the Y-axis represents the absolute differences in syndesmosis width in the mortise view (mm). This parameter was chosen as a representative radiographic measure that exhibited any correlation with functional scales. A low correlation is observed only in Spearman’s rank correlation coefficient (0.359), while Pearson’s correlation coefficient shows no correlation (−0.181). The correlation is not statistically significant, as the p-value is above 0.05 (p = 0.16). No evident correlation is visible on the chart, as the data points are more randomly distributed.
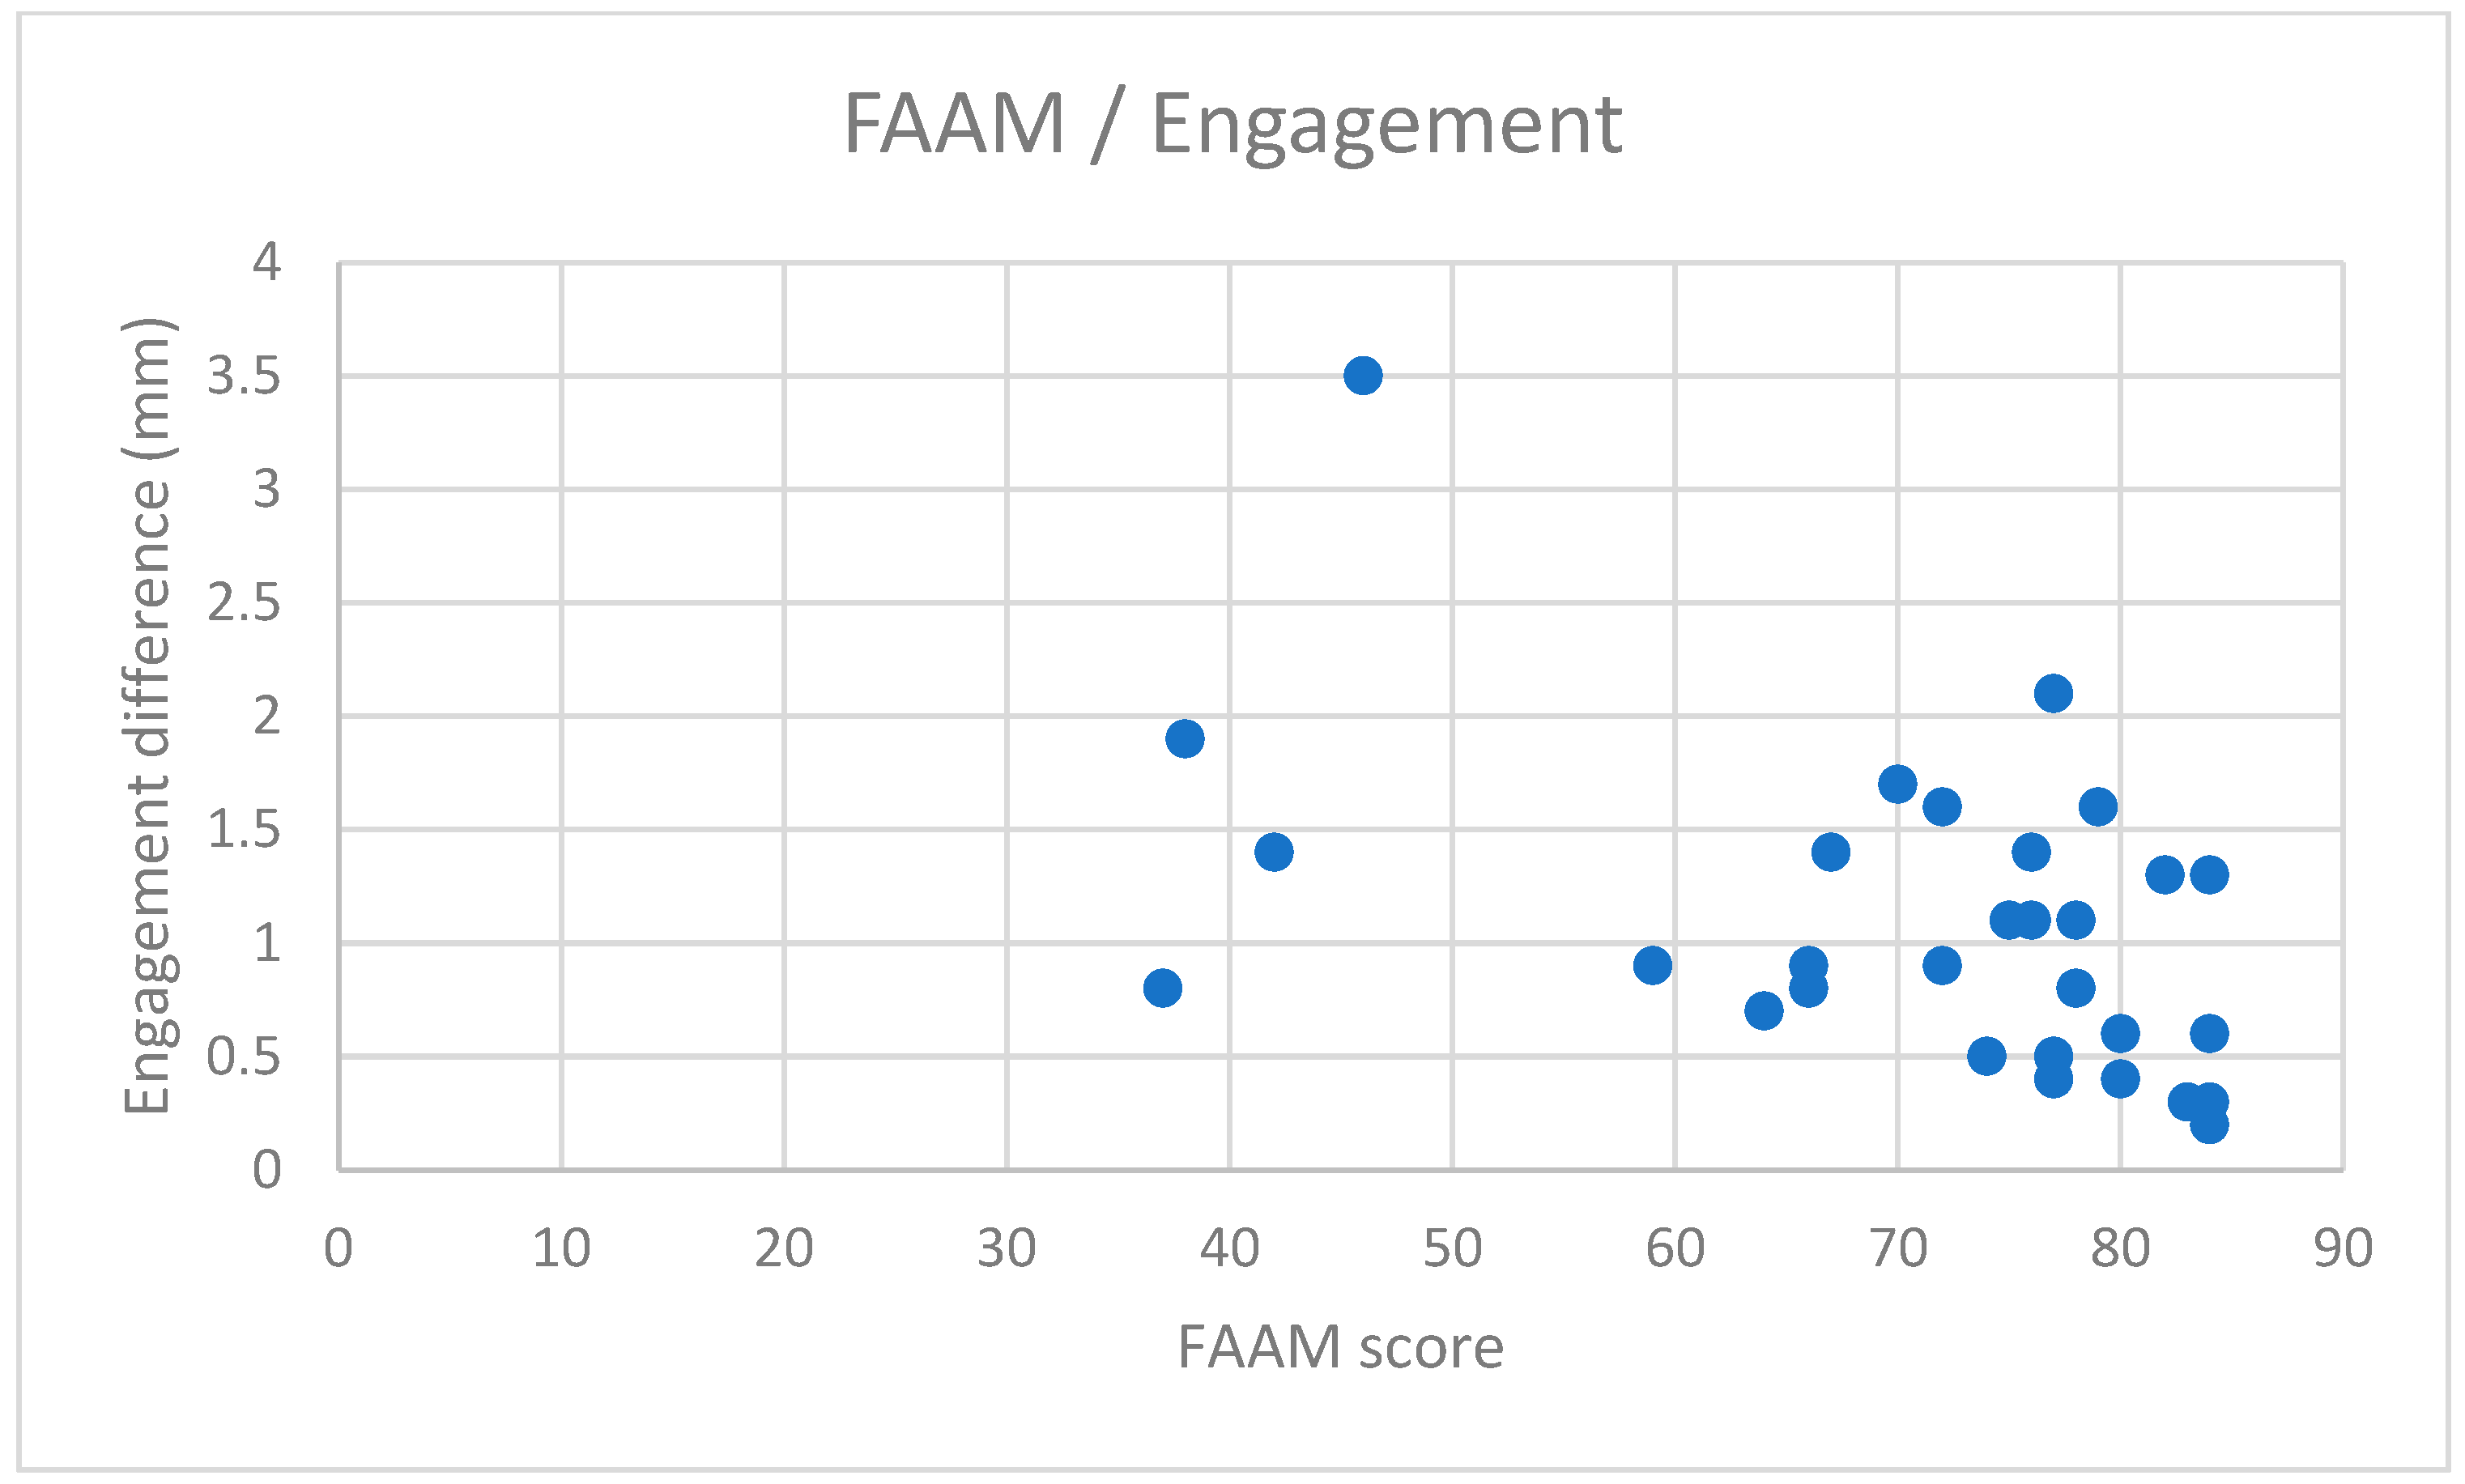
Chart 4.
Correlation between the FAAM scale and engagement difference in WBCT. The X-axis represents the FAAM Score results (ranging from 0 to 84), while the Y-axis represents the absolute differences in ‘engagement’ between the affected and unaffected ankles (mm). The chart shows a low negative correlation (Pearson = −0.375) with high significance, as the p-value is below 0.05 (p = 0.01).
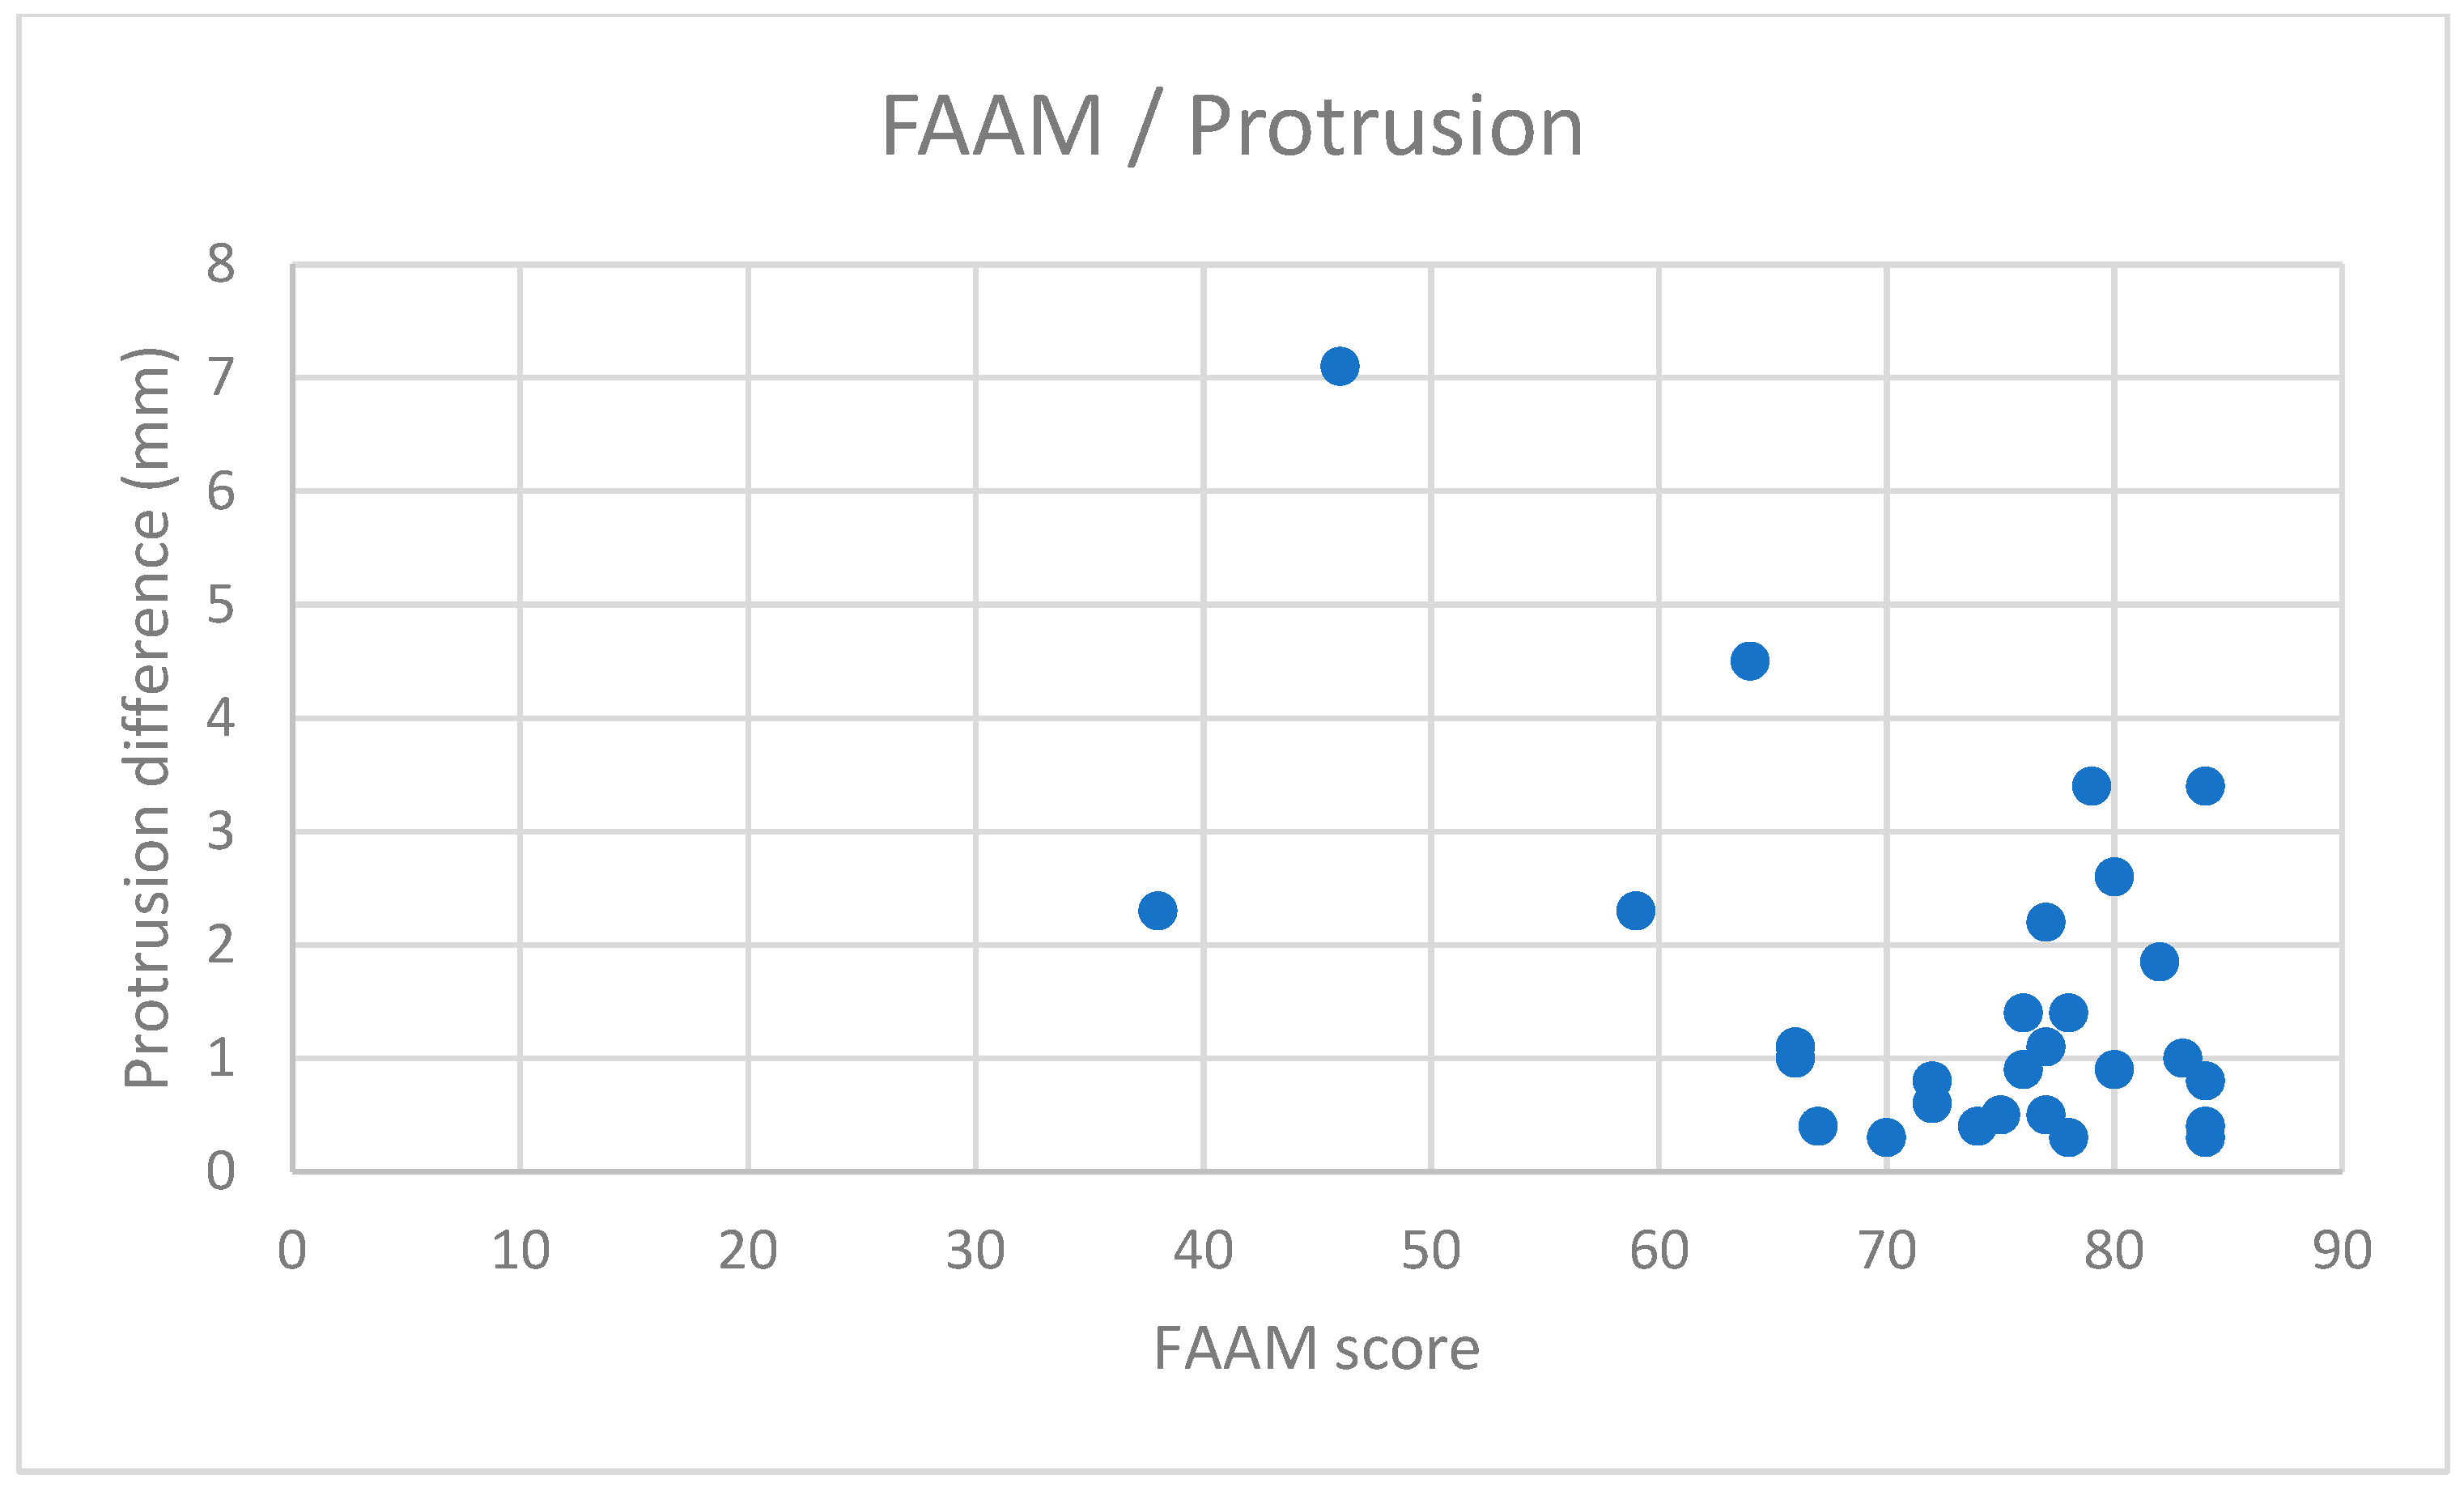
Chart 5.
Correlation between the FAAM scale and protrusion difference in WBCT. The X-axis represents the FAAM Score results (ranging from 0 to 84), while the Y-axis represents the absolute differences in ‘protrusion’ between the affected and unaffected ankles. The chart shows a low negative correlation (Pearson = −0.375) with high significance, as the p-value is below 0.05 (p = 0.04).
Table 1.
Intra-rater reliability measured using intra-class correlation coefficients (ICCs) for three observers. All results are above 0.9, indicating excellent reliability for the parameters measured by each observer.
Table 1.
Intra-rater reliability measured using intra-class correlation coefficients (ICCs) for three observers. All results are above 0.9, indicating excellent reliability for the parameters measured by each observer.
| Parameters—WBCT | ICC (Observer 1) | ICC (Observer 2) | ICC (Observer 3) |
|---|
| Depth | 0.96 | 0.94 | 0.93 |
| Engagement | 0.93 | 0.96 | 0.91 |
| Rotation | 0.91 | 0.92 | 0.91 |
| Protrusion | 0.94 | 0.93 | 0.92 |
| Torsion | 0.92 | 0.92 | 0.91 |
| Parameters—Radiographs | | | |
| Ankle Joint Space | 0.97 | 0.96 | 0.95 |
| Lateral Clear Space | 0.92 | 0.93 | 0.91 |
| Medial Clear Space | 0.94 | 0.93 | 0.93 |
| Fibular Overlap | 0.93 | 0.92 | 0.91 |
| Syndesmosis Width (Mortise) | 0.92 | 0.94 | 0.93 |
Table 2.
Inter-rater reliability measured using intra-class correlation coefficients (ICCs) among the three observers. All results are above 0.9, indicating excellent reliability for the parameters measured between observers.
Table 2.
Inter-rater reliability measured using intra-class correlation coefficients (ICCs) among the three observers. All results are above 0.9, indicating excellent reliability for the parameters measured between observers.
| Parameters—WBCT | ICC |
|---|
| Depth | 0.94 |
| Engagement | 0.92 |
| Rotation | 0.91 |
| Protrusion | 0.93 |
| Torsion | 0.92 |
| Parameters—Radiographs | |
| Ankle Joint Space | 0.96 |
| Lateral Clear Space | 0.91 |
| Medial Clear Space | 0.93 |
| Fibular Overlap | 0.92 |
| Syndesmosis Width (Mortise) | 0.93 |
Table 3.
Correlations between measured parameters and the VAS-HA Score. The first column lists the parameters calculated from patient examinations, the second and third columns show the correlation coefficients (Pearson’s and Spearman’s rank), and the fourth column presents the significance of values calculated for Pearson’s correlation coefficient using a t-test (p-value). The correlation of ‘engagement’ with the VAS-HA Score is highlighted. A low correlation was observed for both Pearson’s correlation coefficient (negative correlation = −0.364) and Spearman’s rank correlation coefficient (positive correlation = 0.401), with p-values below 0.05 (p = 0.047). The remaining values indicate no correlation.
| VAS-HA Correlation |
|---|
| WBCT Parameter | Pearson | Spearman’s | p-Value |
|---|
| Depth | −0.1477102 | −0.0083426 | 0.43556837 |
| Engagement | −0.3644136 | 0.40122358 | 0.04708882 |
| Rotation | 0.09818077 | −0.0804227 | 0.60547187 |
| Protrusion | −0.241647 | 0.27230256 | 0.19756955 |
| Torsion | −0.2158447 | 0.26362625 | 0.2513249 |
| Radiograph Parameter | | | |
| Ankle Joint Space | −0.0830054 | 0.09888765 | 0.66255783 |
| Lateral Clear Space | −0.1838207 | 0.21279199 | 0.3303087 |
| Medial Clear Space | 0.03794588 | 0.02847608 | 0.84210519 |
| Fibular Overlap | −0.0595995 | 0.21212458 | 0.75424124 |
| Syndesmosis Width (Mortise) | −0.1323589 | 0.24276974 | 0.48527109 |
Table 4.
Correlations between measured parameters and the EFAS Score. The first column lists the parameters calculated from patient examinations, the second and third columns show the correlation coefficients (Pearson’s and Spearman’s rank), and the fourth column presents the significance of values calculated for Pearson’s correlation coefficient using a t-test (p-value). Results showing a low correlation (above 0.3 or below −0.3) are highlighted. For ‘engagement’, both correlation coefficients indicate a low correlation but with low significance (p-value > 0.05; p = 0.086). For ‘torsion’, only Spearman’s rank correlation coefficient shows a low correlation, while Pearson’s correlation coefficient is close to the threshold of −0.3 (value = −0.296); significance remains low (p-value > 0.05; p = 0.111). The remaining values indicate no correlation.
| EFAS Correlation |
|---|
| WBCT Parameter | Pearson | Spearman’s | p-Value |
|---|
| Depth | −0.13362 | −0.025584 | 0.4810843 |
| Engagement | −0.31818 | 0.32157953 | 0.0858862 |
| Rotation | 0.237927 | −0.2483871 | 0.2047857 |
| Protrusion | −0.21222 | 0.2189099 | 0.2595677 |
| Torsion | −0.2961 | 0.30945495 | 0.1113696 |
| Radiograph Parameter | | | |
| Ankle Joint Space | −0.03263 | 0.05083426 | 0.8640211 |
| Lateral Clear Space | 0.06437 | −0.0119021 | 0.7352403 |
| Medial Clear Space | 0.12199 | 0.02847608 | 0.5204047 |
| Fibular Overlap | −0.16697 | 0.2185762 | 0.3773262 |
| Syndesmosis Width (Mortise) | −0.22042 | 0.28626251 | 0.2411493 |
Table 5.
Correlations between measured parameters and the FAAM Score. The first column lists the parameters calculated from patient examinations, the second and third columns show the correlation coefficients (Pearson’s and Spearman’s rank), and the fourth column presents the significance of values calculated for Pearson’s correlation coefficient using a t-test (p-value). Values exceeding 0.3 (or below −0.3) and p-values below 0.05 are highlighted. ‘Engagement’ and ‘protrusion’ show low correlation in both correlation coefficients with high significance (p < 0.05; values: 0.010 for ‘engagement’ and 0.040 for ‘protrusion’). ‘Syndesmosis width (mortise)’ exhibited a low correlation level using Spearman’s rank correlation coefficient, while Pearson’s correlation coefficient indicated no correlation (−0.181). The significance was low (p-value > 0.05; p = 0.336).
| FAAM Correlation |
|---|
| WBCT Parameter | Pearson | Spearman’s | p-Value |
|---|
| Depth | −0.18584 | −0.02703 | 0.324913 |
| Engagement | −0.45669 | 0.431146 | 0.010847 |
| Rotation | −0.08174 | −0.00634 | 0.667414 |
| Protrusion | −0.37582 | 0.339822 | 0.040087 |
| Torsion | −0.1369 | 0.174082 | 0.470262 |
| Radiograph Parameter | | | |
| Ankle Joint Space | −0.2398 | 0.261958 | 0.201124 |
| Lateral Clear Space | −0.22272 | 0.107119 | 0.236158 |
| Medial Clear Space | 0.189204 | −0.02781 | 0.316076 |
| Fibular Overlap | 0.006599 | 0.06396 | 0.972376 |
| Syndesmosis Width (Mortise) | −0.18155 | 0.359121 | 0.336428 |
Table 6.
Correlations between measured parameters and the AOFAS Score. The first column lists the parameters calculated from patient examinations, the second and third columns show the correlation coefficients (Pearson’s and Spearman’s rank), and the fourth column presents the significance of values calculated for Pearson’s correlation coefficient using a t-test (p-value). Only ‘lateral clear space’ (highlighted) shows a low correlation using Pearson’s correlation coefficient but with low significance (p-value = 0.064). The values calculated for ‘engagement’ were close to surpassing 0.3 (or dropping below −0.3), with values of −0.285 for Pearson’s and 0.286 for Spearman’s rank.
| AOFAS Correlation |
|---|
| WBCT Parameter | Pearson | Spearman’s | p-Value |
|---|
| Depth | 0.028252 | −0.18754171 | 0.882116 |
| Engagement | −0.28543 | 0.286095662 | 0.125536 |
| Rotation | 0.075188 | −0.12625139 | 0.692729 |
| Protrusion | −0.15533 | 0.129810901 | 0.411958 |
| Torsion | −0.21243 | 0.145272525 | 0.259103 |
| Radiograph Parameter | | | |
| Ankle Joint Space | −0.04738 | 0.098776418 | 0.803521 |
| Lateral Clear Space | −0.34131 | 0.066518354 | 0.064221 |
| Medial Clear Space | 0.224759 | −0.01145717 | 0.231766 |
| Fibular Overlap | −0.00817 | 0.111457175 | 0.965813 |
| Syndesmosis Width (Mortise) | −0.0484 | 0.150723026 | 0.799374 |
Table 7.
Correlations between measured parameters and the Olerud–Molander Score. The first column lists the parameters calculated from patient examinations, the second and third columns show the correlation coefficients (Pearson’s and Spearman’s rank), and the fourth column presents the significance of values calculated for Pearson’s correlation coefficient using a t-test (p-value). Only ‘engagement’ correlated with the Olerud–Molander Score using Pearson’s correlation coefficient (highlighted). Spearman’s correlation coefficient was close to 0.3 (0.298), with a p-value slightly above 0.05 (0.066), indicating low significance (p > 0.05).
| Olerud–Molander Correlation |
|---|
| WBCT Parameter | Pearson | Spearman’s | p-Value |
|---|
| Depth | −0.067861 | −0.1917686 | 0.721431 |
| Engagement | −0.33867 | 0.29833148 | 0.066456 |
| Rotation | 0.0418481 | −0.1649611 | 0.826101 |
| Protrusion | −0.284875 | 0.1676307 | 0.126305 |
| Torsion | −0.1364 | 0.21535039 | 0.471914 |
| Radiograph Parameter | | | |
| Ankle Joint Space | −0.108509 | 0.11946607 | 0.567852 |
| Lateral Clear Space | −0.29254 | 0.20711902 | 0.115958 |
| Medial Clear Space | 0.1494031 | 0.03982202 | 0.430262 |
| Fibular Overlap | −0.039698 | 0.11112347 | 0.834913 |
| Syndesmosis Width (Mortise) | −0.188373 | 0.24621802 | 0.318247 |


 and
and 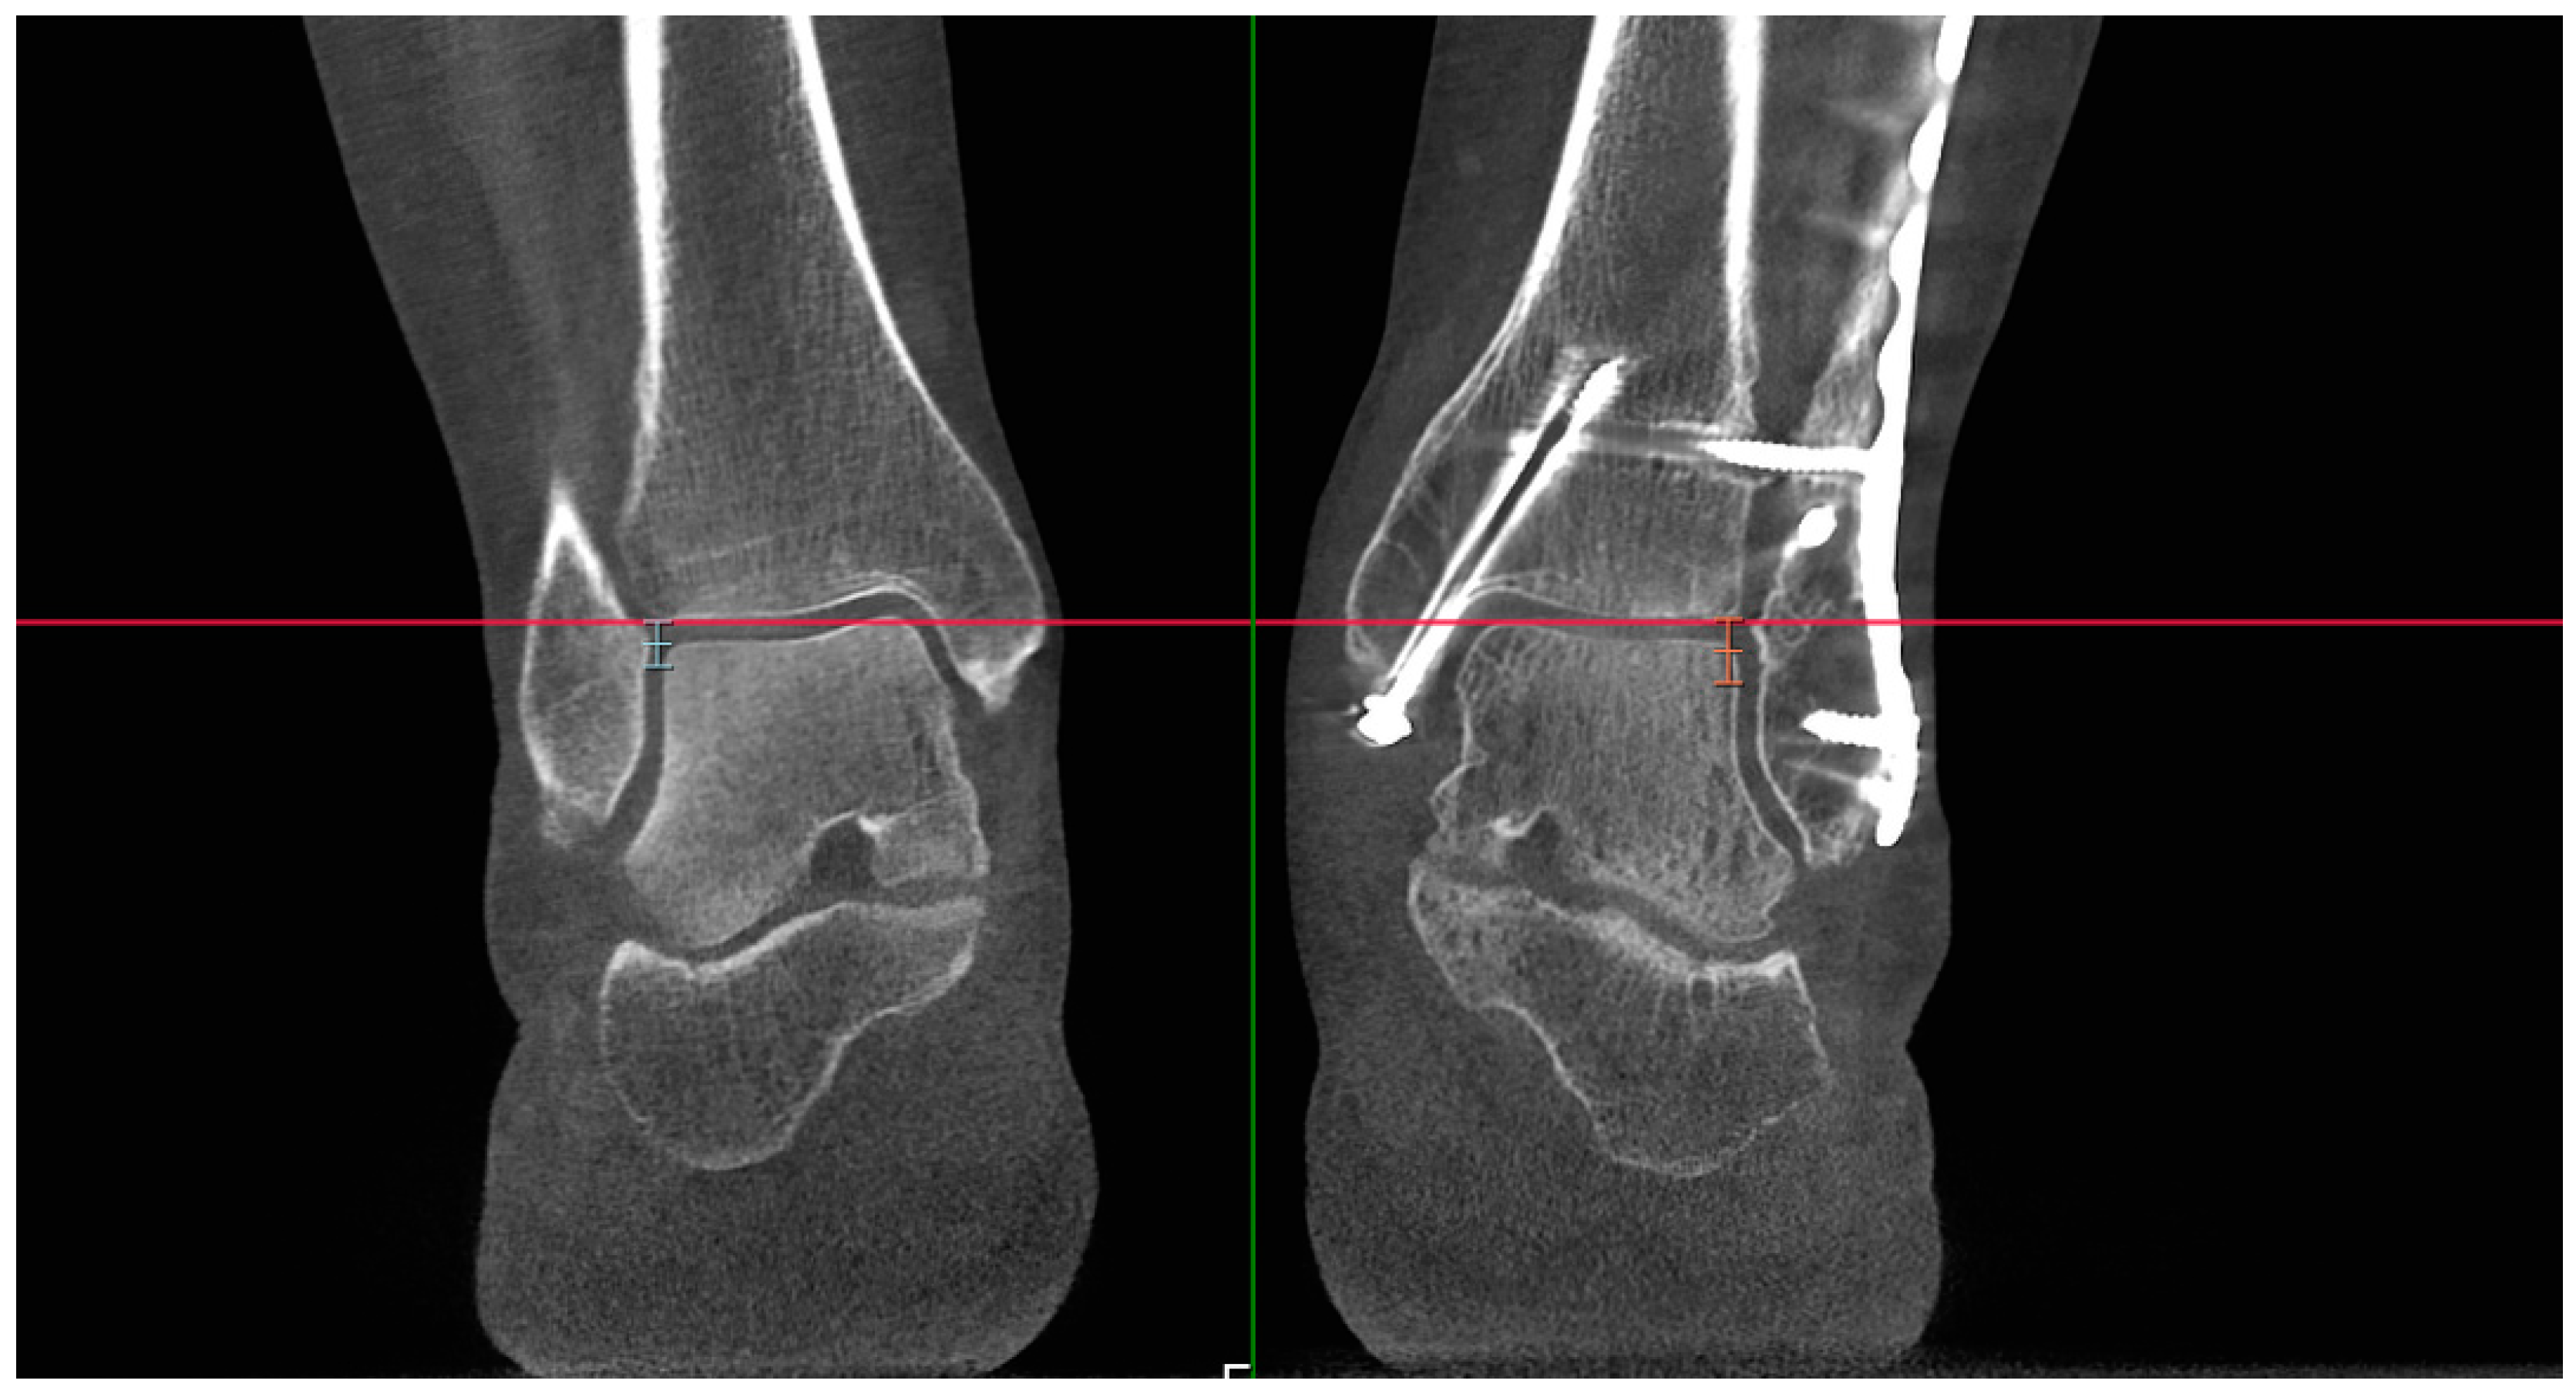


