
Establishing Diagnostic Reference Levels in Digital Mammography from Eight Mammography Units Using over 30,000 Images


Abstract
1. Introduction
2. Materials and Methods
3. Results and Discussion
4. Conclusions
Author Contributions
Funding
Institutional Review Board Statement
Informed Consent Statement
Data Availability Statement
Acknowledgments
Conflicts of Interest
Abbreviations
| MGD | Mean glandular dose |
| DRL | Diagnostic reference level |
| CC | Craniocaudal |
| MLO | Mediolateral oblique |
| CBT | Compressed breast thickness |
| kVp | Peak kilovoltage |
| mAs | Tube current |
| IQR | Interquartile range |
| kVp | Peak kilovoltage |
| mAs | Current |
References
- Jayadevan, R.; Armada, M.J.; Shaheen, R.; Mulcahy, C.; Slanetz, P.J. Optimizing digital mammographic image quality for full-field digital detectors: Artifacts encountered during the QC process. Radiographics 2015, 37, 2080–2089. [Google Scholar] [CrossRef] [PubMed]
- Dance, D.R. Monte-Carlo calculation of conversion factors for the estimation of mean glandular breast dose. Phys. Med. Biol. 1990, 35, 1211–1219. [Google Scholar] [CrossRef] [PubMed]
- ICRP (International Commission on Radiological). Recommendations of the International Commission on Radiological Protection. In Annals of the ICRP, 60th ed.; ICRP Publication 60; International Commission on Radiological Protection (ICRP): Ottawa, ON, Canada, 1991; Volume 21, pp. 1–3. Available online: https://www.icrp.org/ (accessed on 23 January 2022).
- Di Maria, S.; van Nijnatten, T.; Jeukens, C.; Vedantham, S.; Dietzel, M.; Vaz, P. Understanding the risk of ionizing radiation in breast imaging: Concepts and quantities, clinical importance, and future directions. Eur. J. Radiol. 2024, 181, 111784. [Google Scholar] [CrossRef] [PubMed]
- Ma, A.K.W.; Darambara, D.G.; Stewart, A.; Gunn, S.; Bullard, E. Mean glandular dose estimation using MCNPX for a digital breast tomosynthesis system with tungsten/aluminum and tungsten/x-ray anode-filter combinations. Med. Phys. 2008, 35, 5278–5289. [Google Scholar] [CrossRef] [PubMed]
- Klein, R.; Aichinger, H.; Dierker, J.; Jansen, J.T.M.; Joite-Barfuß, S.; Säbel, M.; Schulz-Wendtland, R.; Zoetelief, J. Determination of average glandular dose with modern mammography units for two large groups of patients. Phys. Med. Biol. 1997, 42, 651–671. [Google Scholar] [CrossRef] [PubMed]
- Suleiman, M.E.; Brennan, P.C.; McEntee, M.F. Diagnostic reference levels in digital mammography: A systematic review. Radiat. Prot. Dosim. 2015, 167, 608–619. [Google Scholar] [CrossRef] [PubMed]
- Helvie, M.A.; Chan, H.P.; Adler, D.D.; Boyd, P.G. Breast thickness in routine mammograms: Effect on image quality and radiation dose. Am. J. Roentgenol. 1994, 163, 1371–1374. [Google Scholar] [CrossRef] [PubMed]
- E Suleiman, M.; McEntee, M.F.; Cartwright, L.; Diffey, J.; Brennan, P.C. Diagnostic reference levels for digital mammography in New South Wales. J. Med. Imaging Radiat. Oncol. 2017, 61, 48–57. [Google Scholar] [CrossRef] [PubMed]
- ICRP Publication 73 (International Commission on Radiological). Radiological Protection and Safety in Medicine, 2nd ed.; ICRP. 2, 1996, ICRP Publication 73; International Commission on Radiological Protection (ICRP): Ottawa, ON, Canada, 1996; Volume 26, pp. 1–47. Available online: https://www.icrp.org/publication.asp?id=ICRP%20Publication%2073 (accessed on 12 April 2022).
- Smans, K.; Bosmans, H.; Xiao, M.; Carton, A.K.; Marchal, G. Towards a proposition of a diagnostic (dose) reference level for mammographic acquisitions in breast screening measurements in Belgium. Radiat. Prot. Dosim. 2005, 117, 321–326. [Google Scholar] [CrossRef] [PubMed]
- Vaño, E.; Miller, D.L.; Martin, C.J.; Rehani, M.M.; Kang, K.; Rosenstein, M.; Ortiz-Lopez, P.; Mattsson, S.; Padovani, R.; Rogers, A. Diagnostic Reference Levels in Medical Imaging, 1st ed.; ICRP Publication 135; International Commission on Radiological Protection (ICRP): Ottawa, ON, Canada, 2017; Volume 46, pp. 1–144. Available online: https://www.icrp.org/publication.asp?id=icrp%20publication%20135 (accessed on 4 August 2023).
- IAEA. Quality Assurance Programme for Digital Mammography. International Atomic Energy Agency, Text. 2011. Available online: https://www.iaea.org/publications/8560/quality-assurance-programme-for-digital-mammography (accessed on 3 January 2025).
- Suleiman, M.E.; Brennan, P.C.; McEntee, M.F. Mean glandular dose in digital mammography: A dose calculation method comparison. J. Med. Imaging 2017, 4, 013502. [Google Scholar] [CrossRef] [PubMed]
- Dosanjh, M.; Ristova, M.; Gershan, V.; Georgieva, P.; Kovacevic, M.B.; Bregu, L.; Coralic, I.; Djurovic, T.; Dosieva, D.; Foka, Y.; et al. Availability of technology for managing cancer patients in the Southeast European (SEE) region. Clin. Transl. Radiat. Oncol. 2022, 34, 57–66. [Google Scholar] [CrossRef] [PubMed]
- Perry, N.; Broeders, M.; de Wolf, C.; Törnberg, S.; Holland, R.; von Karsa, L. European guidelines for quality assurance in breast cancer screening and diagnosis. Fourth edition—Summary document. Ann. Oncol. Off. J. Eur. Soc. Med. Oncol. 2008, 19, 614–622. [Google Scholar] [CrossRef] [PubMed]
- Fitzgerald, M.; Leitz, W.; Zoetelief, J.; European Commission: Directorate-General for Research and Innovation. European Protocol on Dosimetry in Mammography; Publications Office: Luxembourg, 1996. [Google Scholar]
- von Karsa, L.; Holland, R.; Broeders, M.; de Wolf, C.; Perry, N.; Törnberg, S.; Directorate-General for Health and Consumers. European Guidelines For Quality Assurance in Breast Cancer Screening and Diagnosis, 4th ed.; Supplements; Publications Office of the European Union: Luxembourg, 2013; Available online: https://data.europa.eu/doi/10.2772/13196 (accessed on 3 January 2025).
- van Engen, R.; van Woudenberg, S.; Bosmans, H.; Young, K.; Thijssen, M. European Protocol for the Quality Control of the Physical and Technical Aspects of mammography Screening, 4th ed.; EUREF Office: Nijmegen, The Netherlands, 2003. [Google Scholar]
- Dance, D.R.; Skinner, C.L.; Young, K.C.; Beckett, J.R.; Kotre, C.J. Additional factors for the estimation of mean glandular breast dose using the UK mammography dosimetry protocol. Phys. Med. Biol. 2000, 45, 3225–3240. [Google Scholar] [CrossRef] [PubMed]
- Dzidzornu, E.; Angmorterh, S.; Ofori-Manteaw, B.; Aboagye, S.; Dzefi-Tettey, K.; Ofori, E. Mammography Diagnostic Reference Levels (DRLs) in Ghana. Radiogr. Lond. Engl. 1995, 27, 611–616. [Google Scholar] [CrossRef] [PubMed]
- Norsuddin, N.M.; Segar, S.; Ravintaran, R.; Zain, N.M.; Karim, M.K.A. Local Diagnostic Reference Levels for Full-Field Digital Mammography and Digital Breast Tomosynthesis in a Tertiary Hospital in Malaysia. Healthcare 2022, 10, 1917. [Google Scholar] [CrossRef] [PubMed]
- Suliman, I.I.; Mohamed, S.; Mahadi, A.; Bashier, E.; Farah, A.; Hassan, N.; Ahmed, N.; Eisa, M.; El-Khayatt, A.; Sassi, S. Analysis of Average Glandular Dose (AGD) and Associated Parameters for Conventional and Digital X-Ray Mammography. Appl. Sci. 2023, 13, 11901. [Google Scholar] [CrossRef]
- Karsh, R. Baseline Assessment of Diagnostic Reference Level for Full Digital Mammography in Al Remal Martyrs Clinic; Al-Azhar University: Gaza, Palestine, 2020. [Google Scholar]
- Talbi, M.; El Mansouri, M.; Nhila, O.; Tahiri, Z.; Eddaoui, K.; Khalis, M. Local diagnostic reference levels (LDRLs) for full-field digital mammography (FFDM) and digital breast tomosynthesis (DBT) procedures in Morocco. J. Med. Imaging Radiat. Sci. 2022, 53, 242–247. [Google Scholar] [CrossRef] [PubMed]
- Dalah, E.Z.; Alkaabi, M.K.; Al-Awadhi, H.M.; Antony, N.A. Screening Mammography Diagnostic Reference Level System According to Compressed Breast Thickness: Dubai Health. J. Imaging 2024, 10, 188. [Google Scholar] [CrossRef] [PubMed]
- Noor, K.A.; Norsuddin, N.M.; Karim, M.K.A.; Isa, I.N.C.; Alshamsi, W. Estimating local diagnostic reference levels for mammography in Dubai. Diagnostics 2023, 14, 8. [Google Scholar] [CrossRef] [PubMed]

| Unit | Manufacturer | Technology | Anode/Filter | Projections | Cases |
|---|---|---|---|---|---|
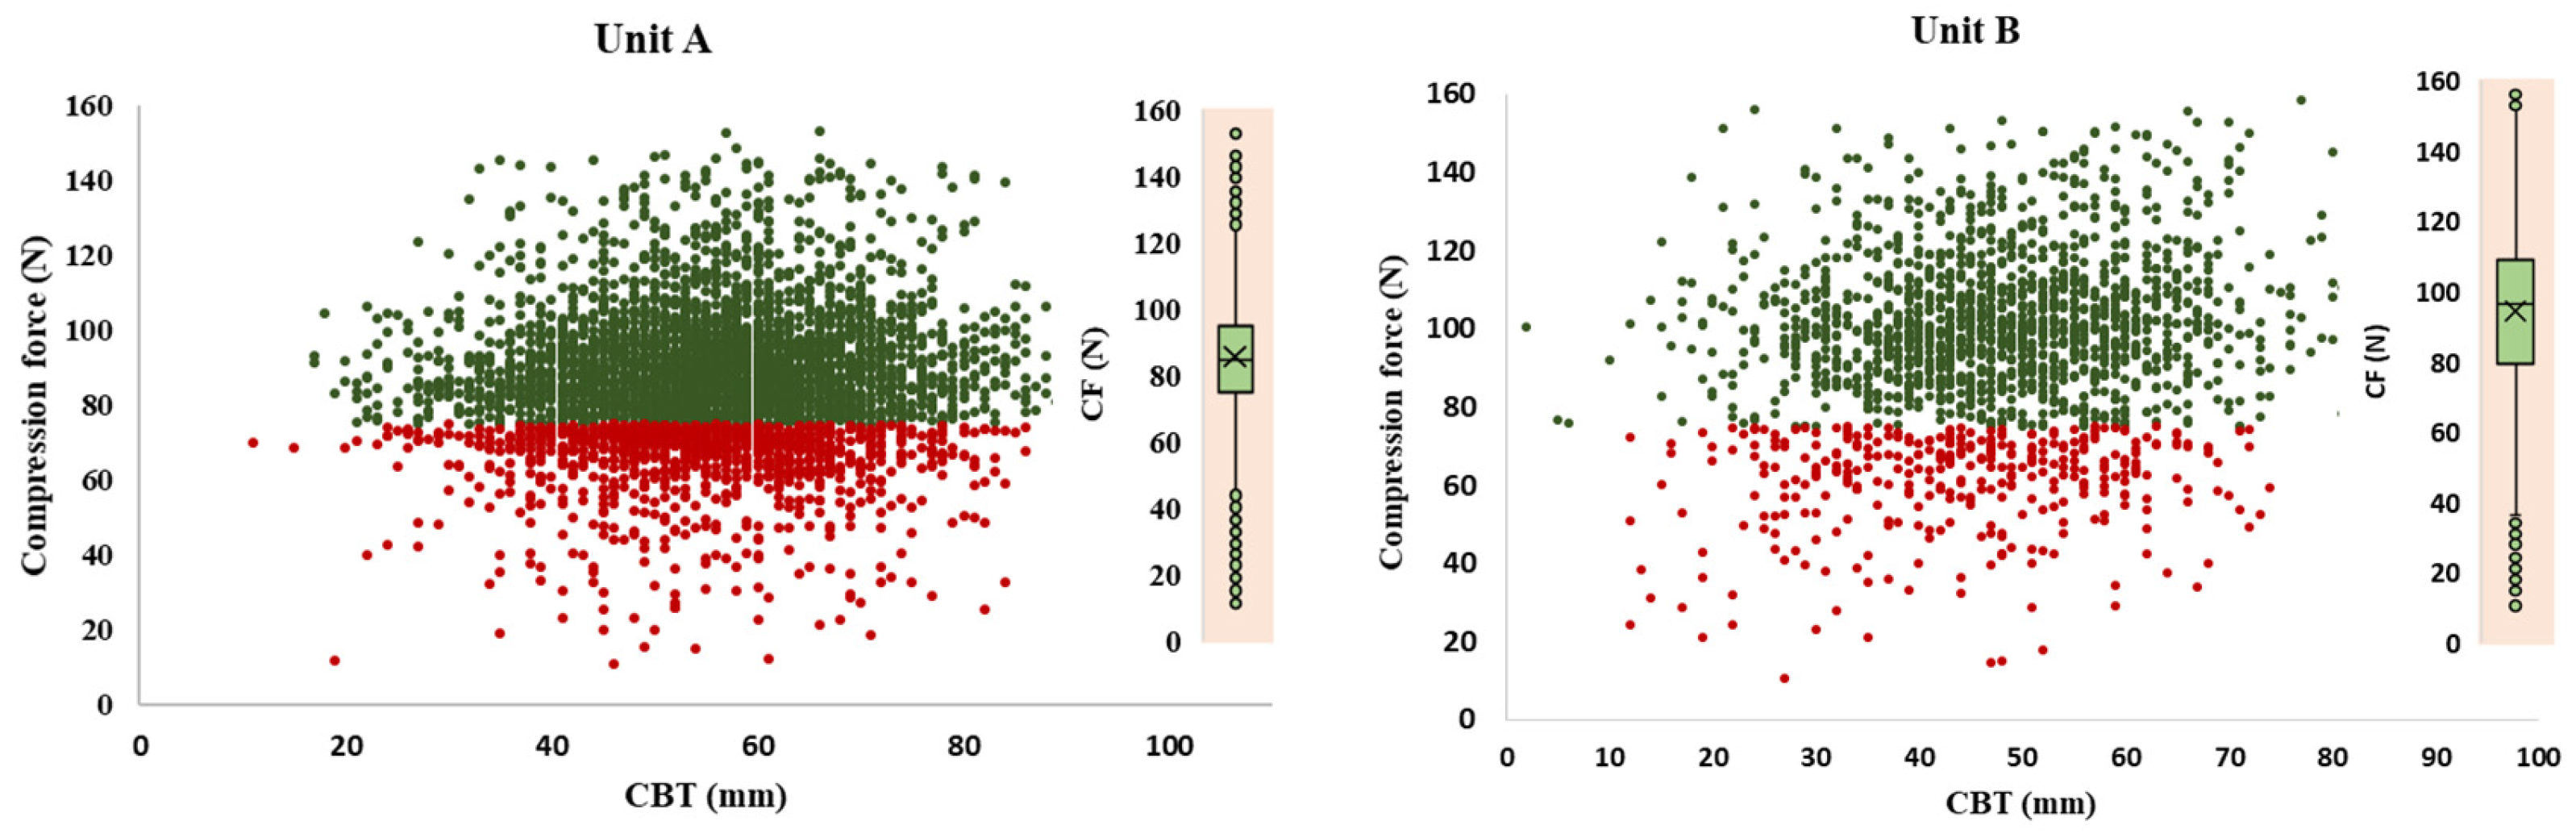
| A | Fuji Innovality | DR | W/Rh | 4520 | 1130 |
| B | Fuji Amulet s | DR | W/Rh | 1772 | 443 |
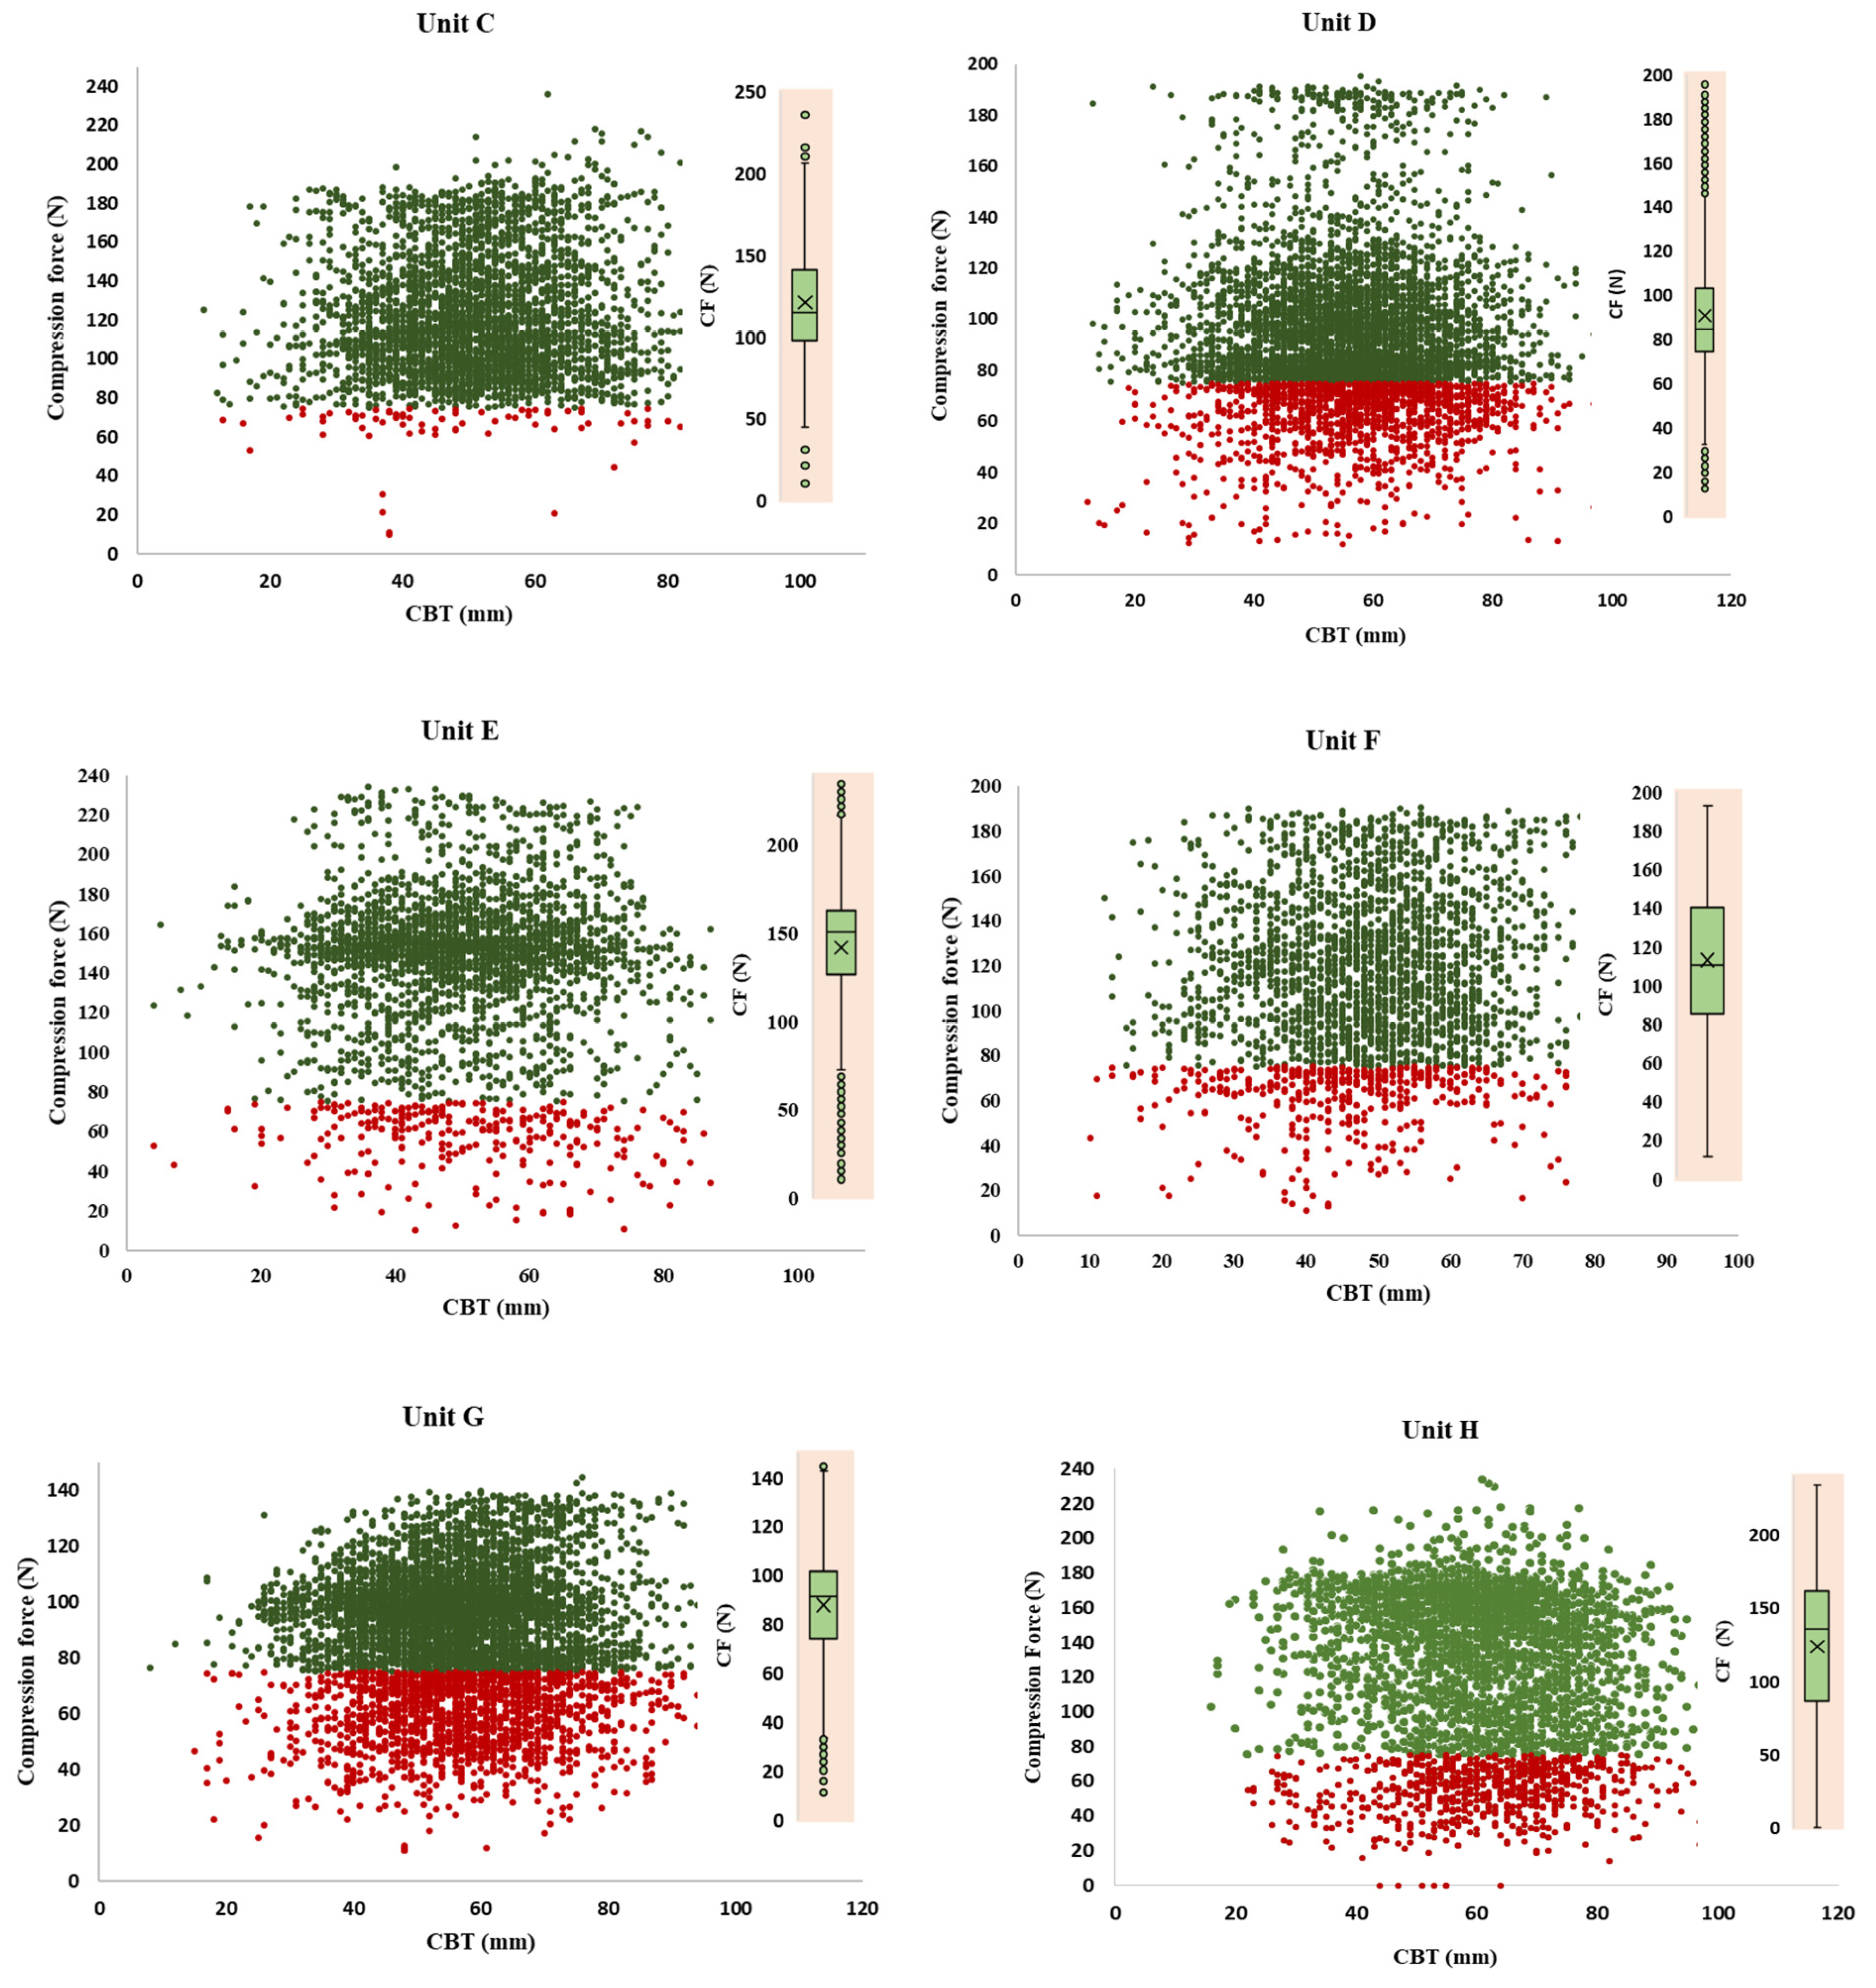
| C | Fuji Amulet s | DR | W/Rh | 3436 | 859 |
| D | Fuji Amulet s | DR | W/Rh | 5672 | 1418 |
| E | Fuji Amulet s | DR | W/Rh | 2832 | 708 |
| F | Fuji Amulet s | DR | W/Rh | 2608 | 652 |
| G | Fuji Innovality | DR | W/Rh | 6380 | 1595 |
| H | Hologic Selenia | DR | W/Ag, W/Rh | 3820 | 955 |
| Mammography Unit | A | B | C | D | E | F | G | H | All | ||
|---|---|---|---|---|---|---|---|---|---|---|---|
| No. of cases | 1130 | 443 | 859 | 1418 | 708 | 652 | 1595 | 955 | 7760 | ||
| No. of images | 4520 | 1772 | 3436 | 5672 | 2832 | 2608 | 6380 | 3820 | 31040 | ||
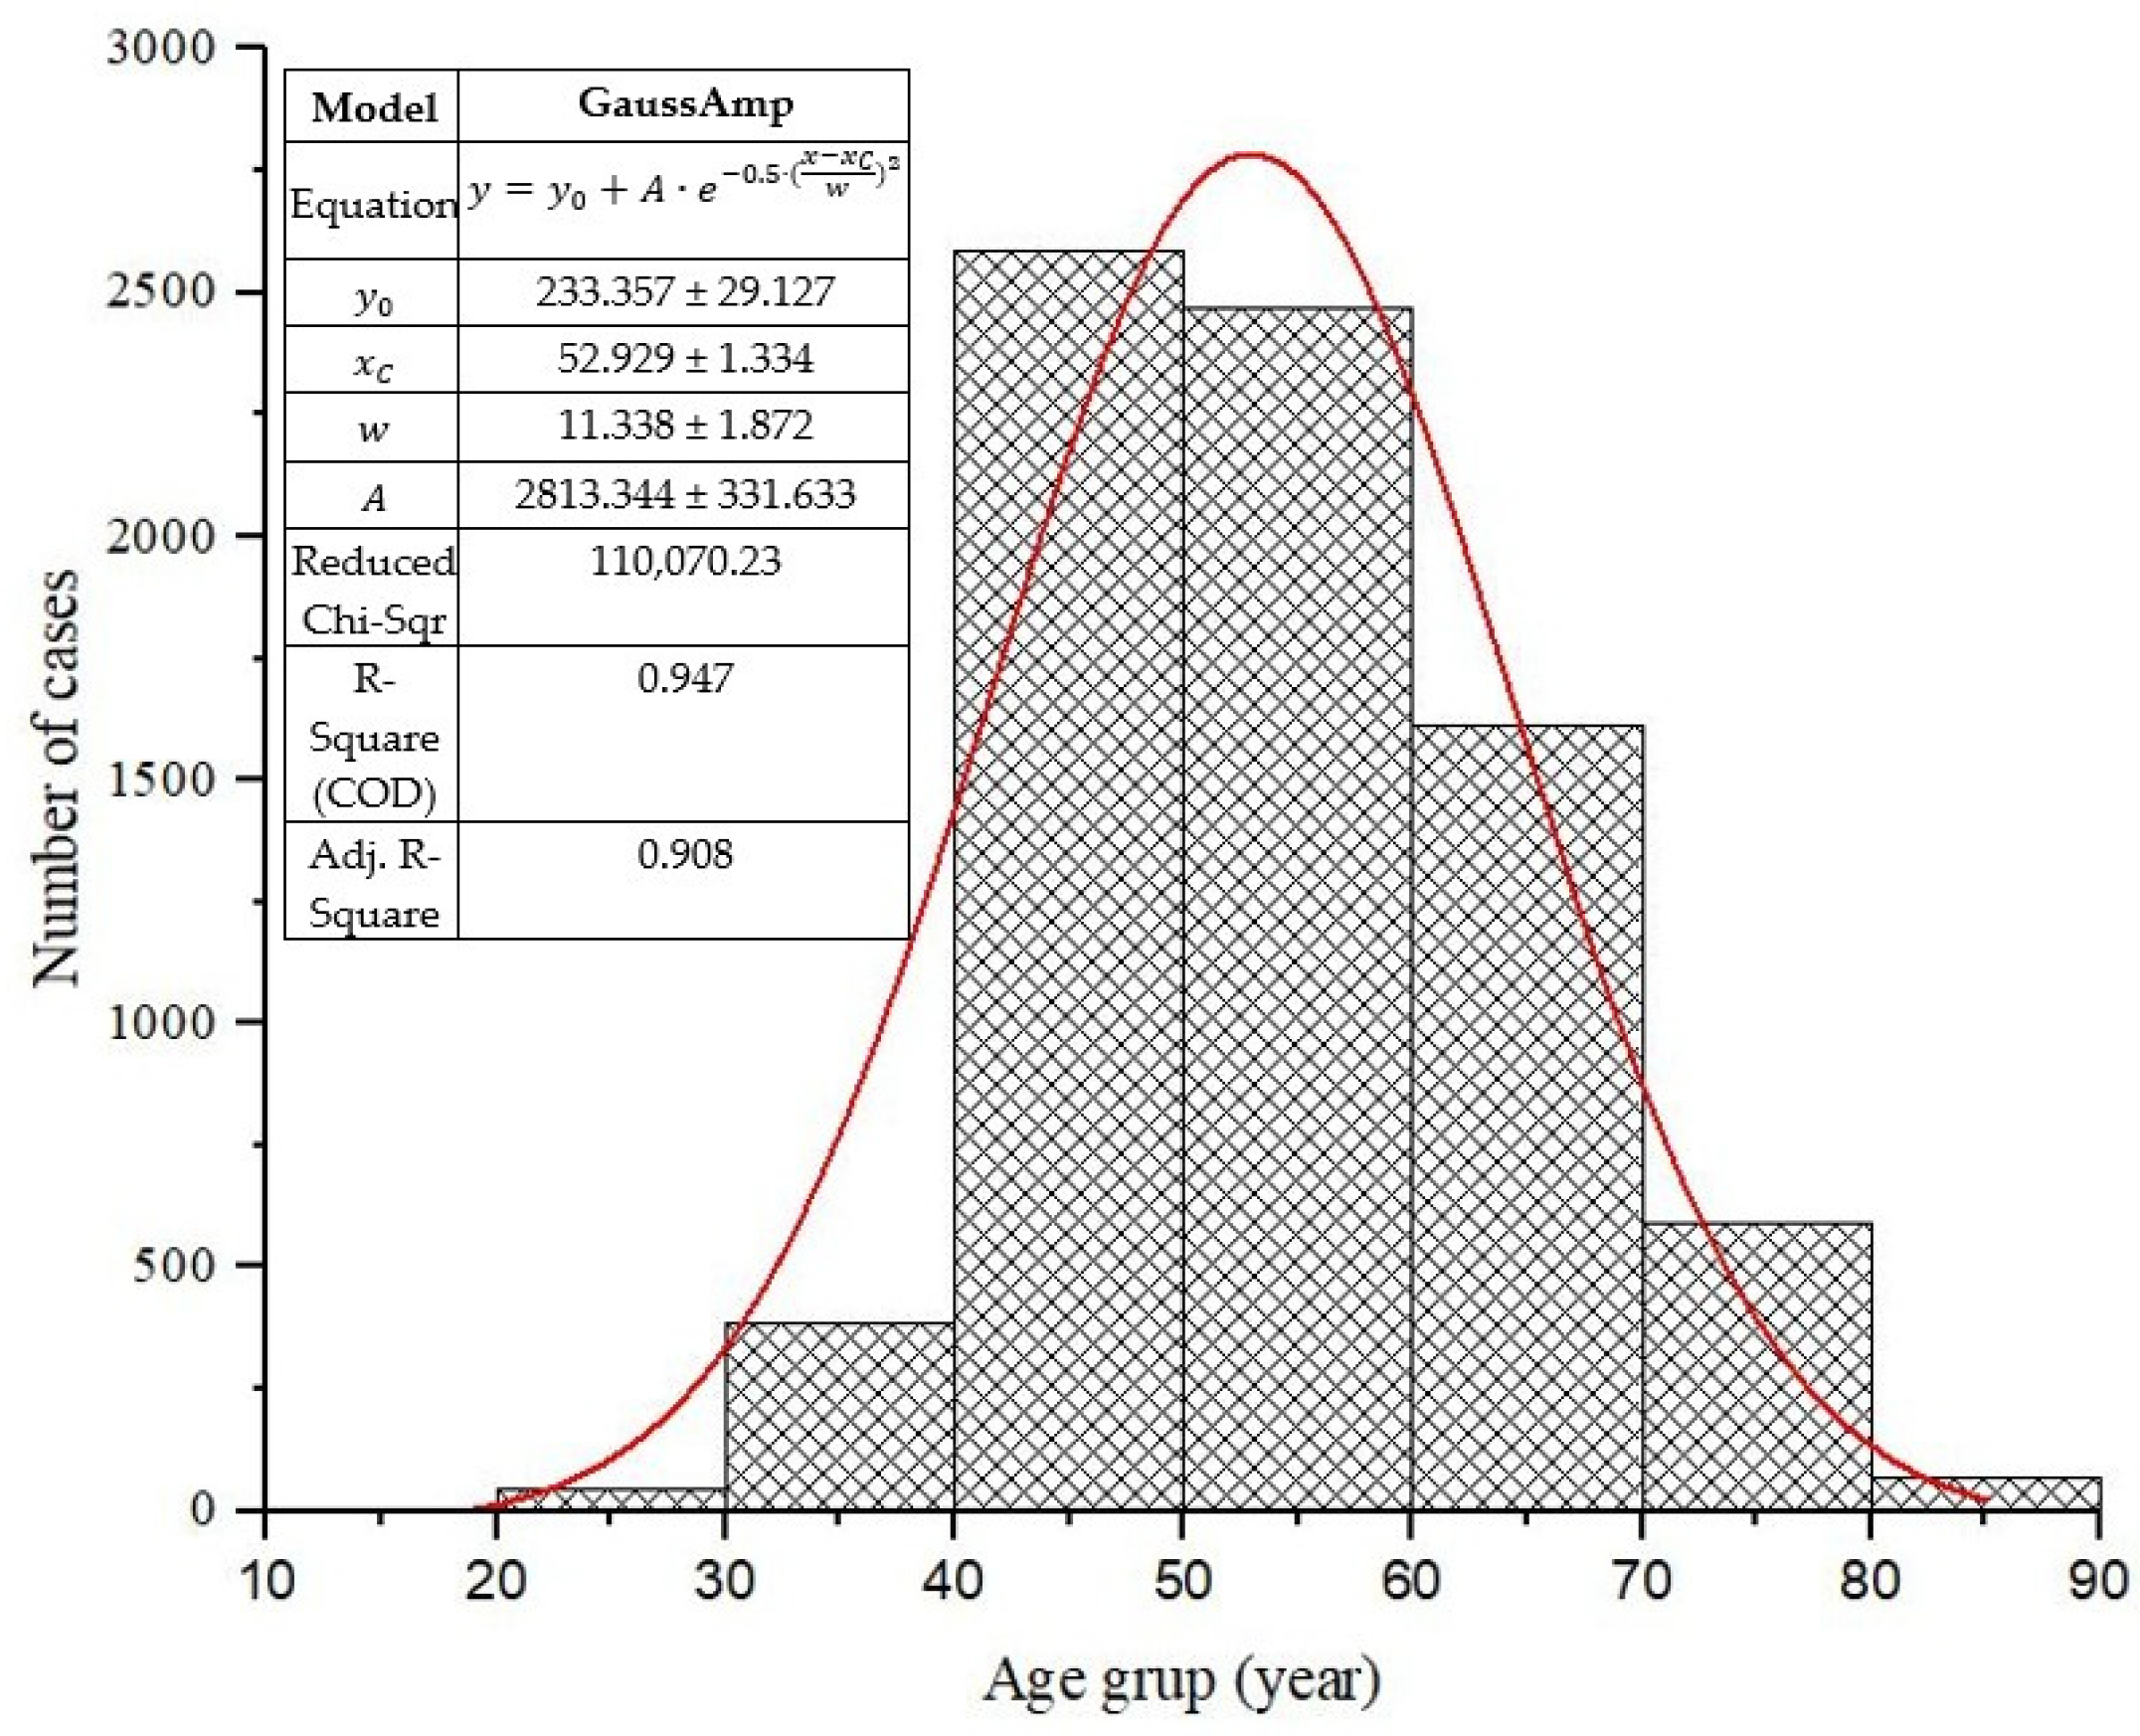
| Mean Age (years) (StDev) | 51.30 (11.50) | 55.24 (10.51) | 54.80 (10.29) | 54.85 (13.24) | 55.00 (12.75) | 54.89 (12.60) | 55.32 (12.67) | 51.63 (8.56) | 54.12 (11.51) | ||
| Mean Thickness (mm) (StDev) | 56 (13) | 47 (13) | 51 (12) | 56 (13) | 50 (12) | 48 (13) | 57 (13) | 60 (13) | 54 (13) | ||
| Mean kVp (StDev) | 29.34 (1.67) | 28.45 (1.35) | 28.82 (1.25) | 29.41 (1.48) | 28.69 (1.37) | 28.55 (1.43) | 29.53 (1.42) | 30.15 (1.84) | 29.11 (1.47) | ||
| Mean mAs (StDev) | 67.74 (30.56) | 108.89 (49.33) | 95.81 (40.97) | 54.24 (17.10) | 129.70 (68.66) | 102.92 (38.64) | 70.60 (22.41) | 250.41 (93.11) | 110.03 (45.09) | ||
| Mean ESAK (mGy) (IQR) | 3.54 (1.79) | 5.73 (2.78) | 5.44 (3.26) | 3.28 (1.71) | 6.21 (4.2) | 5.23 (2.85) | 3.56 (1.82) | 11.42 (7.98) | 3.9 (3.14) | ||
| Mean MGD/View (mGy) | CC | R | 0.92 | 1.58 | 1.47 | 0.86 | 1.59 | 0.93 | 0.93 | 2.61 | 1.36 |
| L | 0.92 | 1.57 | 1.40 | 0.85 | 1.59 | 0.92 | 0.92 | 2.48 | 1.33 | ||
| R + L | 0.92 | 1.57 | 1.43 | 0.85 | 1.59 | 0.92 | 0.92 | 2.54 | 1.34 | ||
| MLO | R | 1.04 | 1.98 | 1.79 | 0.99 | 2.07 | 1.06 | 1.06 | 2.95 | 1.61 | |
| L | 1.05 | 1.96 | 1.80 | 0.96 | 2.09 | 1.06 | 1.06 | 2.88 | 1.60 | ||
| R + L | 1.04 | 1.97 | 1.80 | 0.97 | 2.08 | 1.06 | 1.06 | 2.92 | 1.61 | ||
| Median MGD (mGy) (IQR) | 0.91 (0.39) | 1.63 (0.76) | 1.47 (0.79) | 0.86 (0.36) | 1.63 (1.02) | 1.50 (0.69) | 0.94 (0.38) | 2.61 (1.46) | 1.15 (0.84) | ||
| View | CBT (mm) | N | Thickness (mm) | Age (years) | Compression Force (N) | Voltage (kV) | Tube Current (mAs) | Entrance Dose (mGy) |
|---|---|---|---|---|---|---|---|---|
| Mean ± Std (Range) | ||||||||
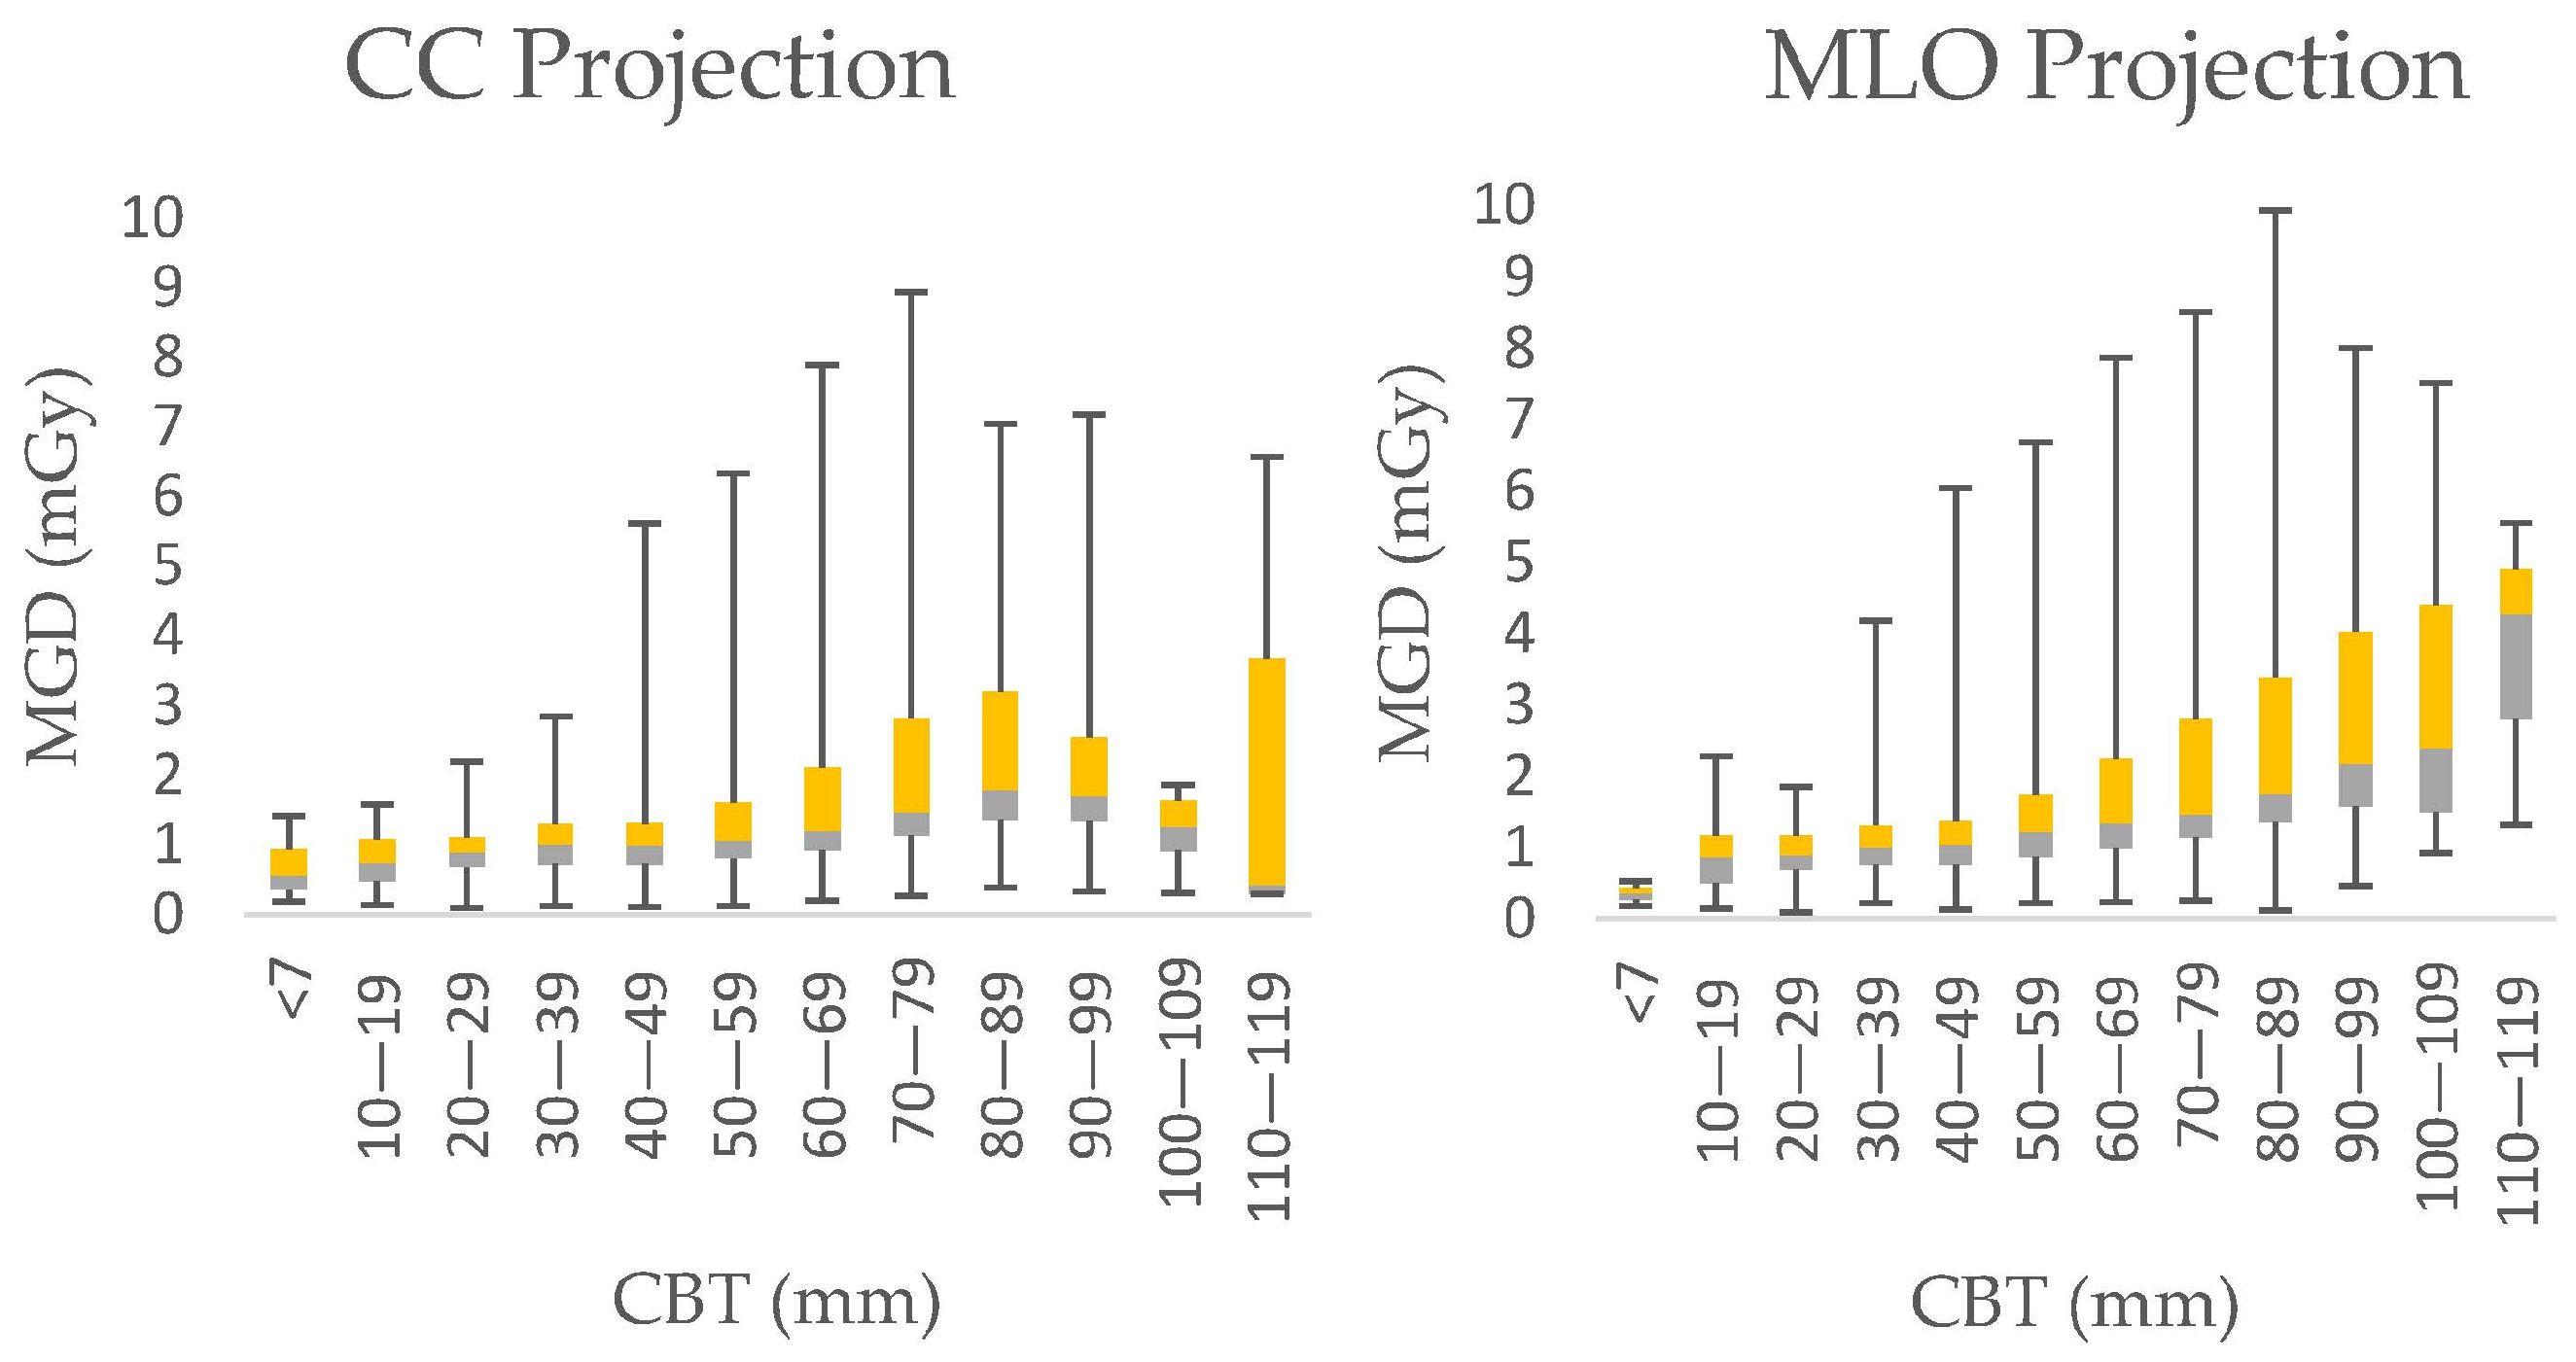
| MLO | <7 | 2 | 4.5 ± 0.7 | 88.0 ± 0.0 (88–88) | 143.9 ± 28.6 (123.6 –164.1) | 23.0 ± 0.0 (23–23) | 29.5 ± 19.0 (16–43) | 0.5 ± 0.4 (0.3–0.8) |
| 10–19 | 59 | 16.5 ± 2.3 | 57.3 ± 15.3 (31–86) | 96.3 ± 39.5 (17.4–178.4) | 25.6 ± 0.9 (22–28) | 49.2 ± 24.9 (10–126) | 1.6 ± 0.8 (0.3–3.7) | |
| 20–29 | 318 | 26.0 ± 2.6 | 54.2 ± 12.7 (25–91) | 104.9 ± 37.2 (0.0–193.1) | 26.2 ± 0.6 (24–28) | 63.4 ± 29.1 (10–164) | 2.1 ± 0.8 (0.3–4.3) | |
| 30–39 | 1156 | 35.4 ± 2.8 | 54.7 ± 12.1 (28–88) | 111.2 ± 37.6 (0.0–229.0) | 27.6 ± 0.8 (26–30) | 75.2 ± 44.4 (13–368) | 2.9 ± 1.3 (0.6–11.4) | |
| 40–49 | 2661 | 45.0 ± 2.9 | 54.7 ± 11.4 (25–87) | 109.2 ± 36.5 (15.9–233.2) | 28.1 ± 0.4 (26–33) | 83.6 ± 52.4 (10–454) | 3.6 ± 1.8 (0.4–18.8) | |
| 50–59 | 4226 | 54.7 ± 2.8 | 55.1 ± 10.5 (25–90) | 108.1 ± 36.0 (0.0–227.8) | 29.5 ± 0.9 (26–34) | 98.1 ± 63.1 (0–507) | 4.8 ± 2.5 (0–24.5) | |
| 60–69 | 4063 | 64.2 ± 2.9 | 53.9 ± 9.6 (27–83) | 107.3 ± 36.6 (0.0–235.9) | 30.3 ± 0.7 (28–38) | 127.1 ± 93.0 (17–574) | 6.7 ± 4.2 (0.9–30.4) | |
| 70–79 | 2093 | 73.8 ± 2.8 | 52.8 ± 8.9 (27–86) | 104.3 ± 37.2 (10.9–224.1) | 31.0 ± 1.0 (28–34) | 139.3 ± 89.4 (2–574) | 8.7 ± 5.2 (0–35.1) | |
| 80–89 | 708 | 83.6 ± 2.9 | 51.9 ± 8.8 (32–82) | 96.4 ± 37.6 (14.0–200.8) | 31.9 ± 1.6 (29–34) | 160.7 ± 98.3 (0–555) | 11.2 ± 7.0 (0–51.6) | |
| 90–99 | 138 | 93.3 ± 2.9 | 51.6 ± 8.0 (29–76) | 93.5 ± 34.7 (23.4–192.9) | 33.2 ± 1.2 (28–35) | 181.1 ± 103.2 (45–509) | 14.4 ± 8.1 (2.4–41.2) | |
| 100–109 | 25 | 102.6 ± 2.1 | 52.4 ± 8.7 (43–79) | 81.7 ± 36.0 (27.6–156.8) | 33.9 ± 2.3 (30–37) | 174.5 ± 111.4 (53–428) | 15.2 ± 9.7 (3.5–36.4) | |
| 110–119 | 2 | 111.5 ± 0.7 | 61 ± 4.2 (58–64) | 126.4 ± 21.1 (111.4–141.3) | 34.5 ± 3.5 (32–37) | 119.5 ± 44.5 (88–151) | 13.7± 11.5 (5.621.8) | |
| Pearson correlation One-way ANOVA | r = 0.0789 p < 0.001 | r = 0.068 p < 0.001 | r = 0.857 p < 0.001 | r = 0.331 p < 0.001 | r = 0.535 p < 0.001 | |||
| CC | <7 | 9.0 | 5.9 ± 2.3 | 67.6 ± 17.0 (51–88) | 75.0 ± 40.2 (0–131.6) | 23.4 ± 0.7 (22–24) | 42.9 ± 26.1 (15–98) | 1.0 ± 0.6 (0.3–2.2) |
| 10–19 | 104.0 | 16.1 ± 2.4 | 57.9 ± 14.6 (31–91) | 94.0 ± 42.5 (11.9–184.6) | 25.8 ± 0.7 (24–28) | 44.5 ± 23.1 (10–109) | 1.4 ± 0.7 (0.3–2.8) | |
| 20–29 | 585.0 | 25.7 ± 2.7 | 55.7 ± 12.9 (19–91) | 101.1 ± 38.4 (0–222.7) | 26.2 ± 0.5 (24–28) | 60.5 ± 26.6 (12–184) | 2.0 ± 0.8 (0.3–4.7) | |
| 30–39 | 1949.0 | 35.4 ± 2.8 | 55.2 ± 12.5 (19–88) | 104.0 ± 39.6 (0–234.2) | 27.5 ± 0.7 (25–30) | 72.0 ± 38.1 (10–327) | 2.9 ± 1.2 (0.4–8.6) | |
| 40–49 | 4143.0 | 44.9 ± 2.8 | 54.3 ± 11.9 (19–87) | 99.0 ± 37.3 (0–228.6) | 28.1 ± 0.7 (25–33) | 78.9 ± 49.0 (8–442) | 3.4 ± 1.7 (0.3–18.3) | |
| 50–59 | 4882.0 | 54.4 ± 2.8 | 53.8 ± 10.1 (19–90) | 99.0 ± 34.9 (0–229.8) | 29.4 ± 0.7 (26–34) | 93.0 ± 63.6 (8–470) | 4.5 ± 2.4 (0.4–22.5) | |
| 60–69 | 2837.0 | 63.8 ± 2.8 | 52.5 ± 9.0 (19–86) | 97.1 ± 35.4 (0–231.2) | 30.3 ± 1.0 (26–38) | 124.8 ± 97.6 (8–574) | 6.4 ± 4.2 (0.3–30.4) | |
| 70–79 | 865.0 | 73.3 ± 2.6 | 51.3 ± 8.4 (20–83) | 90.4 ± 36.2 (0–217.0) | 30.8 ± 1.3 (26–34) | 146.9 ± 99.1 (8–574) | 8.9 ± 5.8 (0.3–35.5) | |
| 80–89 | 178.0 | 83.2 ± 2.6 | 51.0 ± 7.2 (35–78) | 82.4 ± 36.7 (0–177.5) | 32.2 ± 0.9 (27–34) | 159.6 ± 88.9 (45–441) | 11.1 ± 6.2 (1.9–31.6) | |
| 90–99 | 25.0 | 92.0 ± 2.1 | 42.9 ± 11.3 (19–58) | 59.2 ± 46.2 (0–139.0) | 32.0 ± 2.4 (27–34) | 144.7 ± 106.5 (45–509) | 10.6 ± 8.1 (2.0–34.4) | |
| 100–109 | 8.0 | 102.6 ± 2.6 | 51.1 ± 10.1 (37–64) | 57.1 ± 47.9 (0–123.9) | 31.4 ± 3.1 (26–34) | 84.5 ± 26.7 (50–127) | 6.1 ± 3.0 (2.0–9.9) | |
| 110–119 | 4.0 | 112.0 ± 2.0 | 42.5 ± 26.0 (20–66) | 44.1 ± 52.7 (0–104.9) | 31.8 ± 6.7 (26–38) | 149.8 ± 156.4 (50–379) | 14.8± 16.4 (2.1–36.6) | |
| Pearson correlation One-way ANOVA | r = 0.116 p < 0.001 | r = 0.0801 p < 0.001 | r = 0.847 p < 0.001 | r = 0.329 p < 0.001 | r = 0.515 p < 0.001 | |||
| CBT (mm) | Present Work | References | |||
|---|---|---|---|---|---|
| MGD DRL (mGy) | MGD DRL (mGy)/View | ||||
| CC | MLO | CC | MLO | All View | |
| <7 | 0.94 | 0.44 | |||
| 10–19 | 1.08 | 1.17 | |||
| 20–29 | 1.11 | 1.17 | 0.97 (CBT:20–29 mm) [9] | ||
| 30–39 | 1.3 | 1.32 | 1.6 (CBT:36 mm) [21]; 3.48 (CBT:36 mm) [23]; | 1.12 (CBT:30–39 mm) [9] | |
| 40–49 | 1.31 | 1.38 | 2.4 (CBT: 45 mm) [21] 2.03 (CBT: 44 mm) [23] | 1.31 (CBT:40–49 mm) [9] | |
| 50–59 | 1.61 | 1.75 | 1.68 (CBT: 50.9 mm) [22] 2.5 (CBT: 50–60 mm) [24] 1.6 (CBT: 50 mm) [25] | 2.25 (CBT: 58.9 mm) [22] 1.8 (CBT: 50 mm) [25] | 1.65 (CBT:50–59 mm) [9] 1.7 (CBT:50 mm) [25] |
| 60–69 | 2.11 | 2.25 | 1.23 (CBT: 60–69 mm) [26] | 1.32 (CBT: 60–69 mm) [26] | 2.35 (CBT: 60–69 mm) [9] |
| 70–79 | 2.81 | 2.80 | 2.08 (CBT: 70–79 mm) [9] | ||
| 80–89 | 3.2 | 3.38 | 2.34 (CBT: 80–89 mm) [9] | ||
| 90–99 | 2.54 | 4.02 | 2.63 (CBT: 90–99 mm) [9] | ||
| 100–109 | 1.63 | 4.40 | 3.31 (CBT:100–110 mm) [9] | ||
| CBT Range (mm) | MGD Typical Value (mGy) | MGD European DLR (mGy) | ||
|---|---|---|---|---|
| CC | MLO | Acceptable | Achievable | |
| 20–29 | 0.92 | 0.94 | <1.0 | <0.6 |
| 30–39 | 1.07 | 1.09 | <1.5 | <1.0 |
| 40–49 | 1.09 | 1.15 | <2.0 | <1.6 |
| 50–59 | 1.30 | 1.40 | <2.5 | <2.0 |
| 60–69 | 1.63 | 1.74 | <3.0 | <2.4 |
| 70–79 | 2.05 | 2.04 | <4.5 | <3.6 |
| 80–89 | 2.34 | 2.40 | / | / |
| 90–99 | 2.15 | 2.87 | <6.5 | <5.1 |
Disclaimer/Publisher’s Note: The statements, opinions and data contained in all publications are solely those of the individual author(s) and contributor(s) and not of MDPI and/or the editor(s). MDPI and/or the editor(s) disclaim responsibility for any injury to people or property resulting from any ideas, methods, instructions or products referred to in the content. |
© 2025 by the authors. Licensee MDPI, Basel, Switzerland. This article is an open access article distributed under the terms and conditions of the Creative Commons Attribution (CC BY) license (https://creativecommons.org/licenses/by/4.0/).
Share and Cite
Mediji-Arifi, M.; Ristova, M. Establishing Diagnostic Reference Levels in Digital Mammography from Eight Mammography Units Using over 30,000 Images. Diagnostics 2025, 15, 682. https://doi.org/10.3390/diagnostics15060682
Mediji-Arifi M, Ristova M. Establishing Diagnostic Reference Levels in Digital Mammography from Eight Mammography Units Using over 30,000 Images. Diagnostics. 2025; 15(6):682. https://doi.org/10.3390/diagnostics15060682
Chicago/Turabian StyleMediji-Arifi, Mirjeta, and Mimoza Ristova. 2025. "Establishing Diagnostic Reference Levels in Digital Mammography from Eight Mammography Units Using over 30,000 Images" Diagnostics 15, no. 6: 682. https://doi.org/10.3390/diagnostics15060682
APA StyleMediji-Arifi, M., & Ristova, M. (2025). Establishing Diagnostic Reference Levels in Digital Mammography from Eight Mammography Units Using over 30,000 Images. Diagnostics, 15(6), 682. https://doi.org/10.3390/diagnostics15060682