
AΚtransU-Net: Transformer-Equipped U-Net Model for Improved Actinic Keratosis Detection in Clinical Photography

 , , , , and
Abstract
1. Introduction
- We explore architectural U-based enhancements that integrate Transformers to enable more coherent and contextually informed AK segmentations.
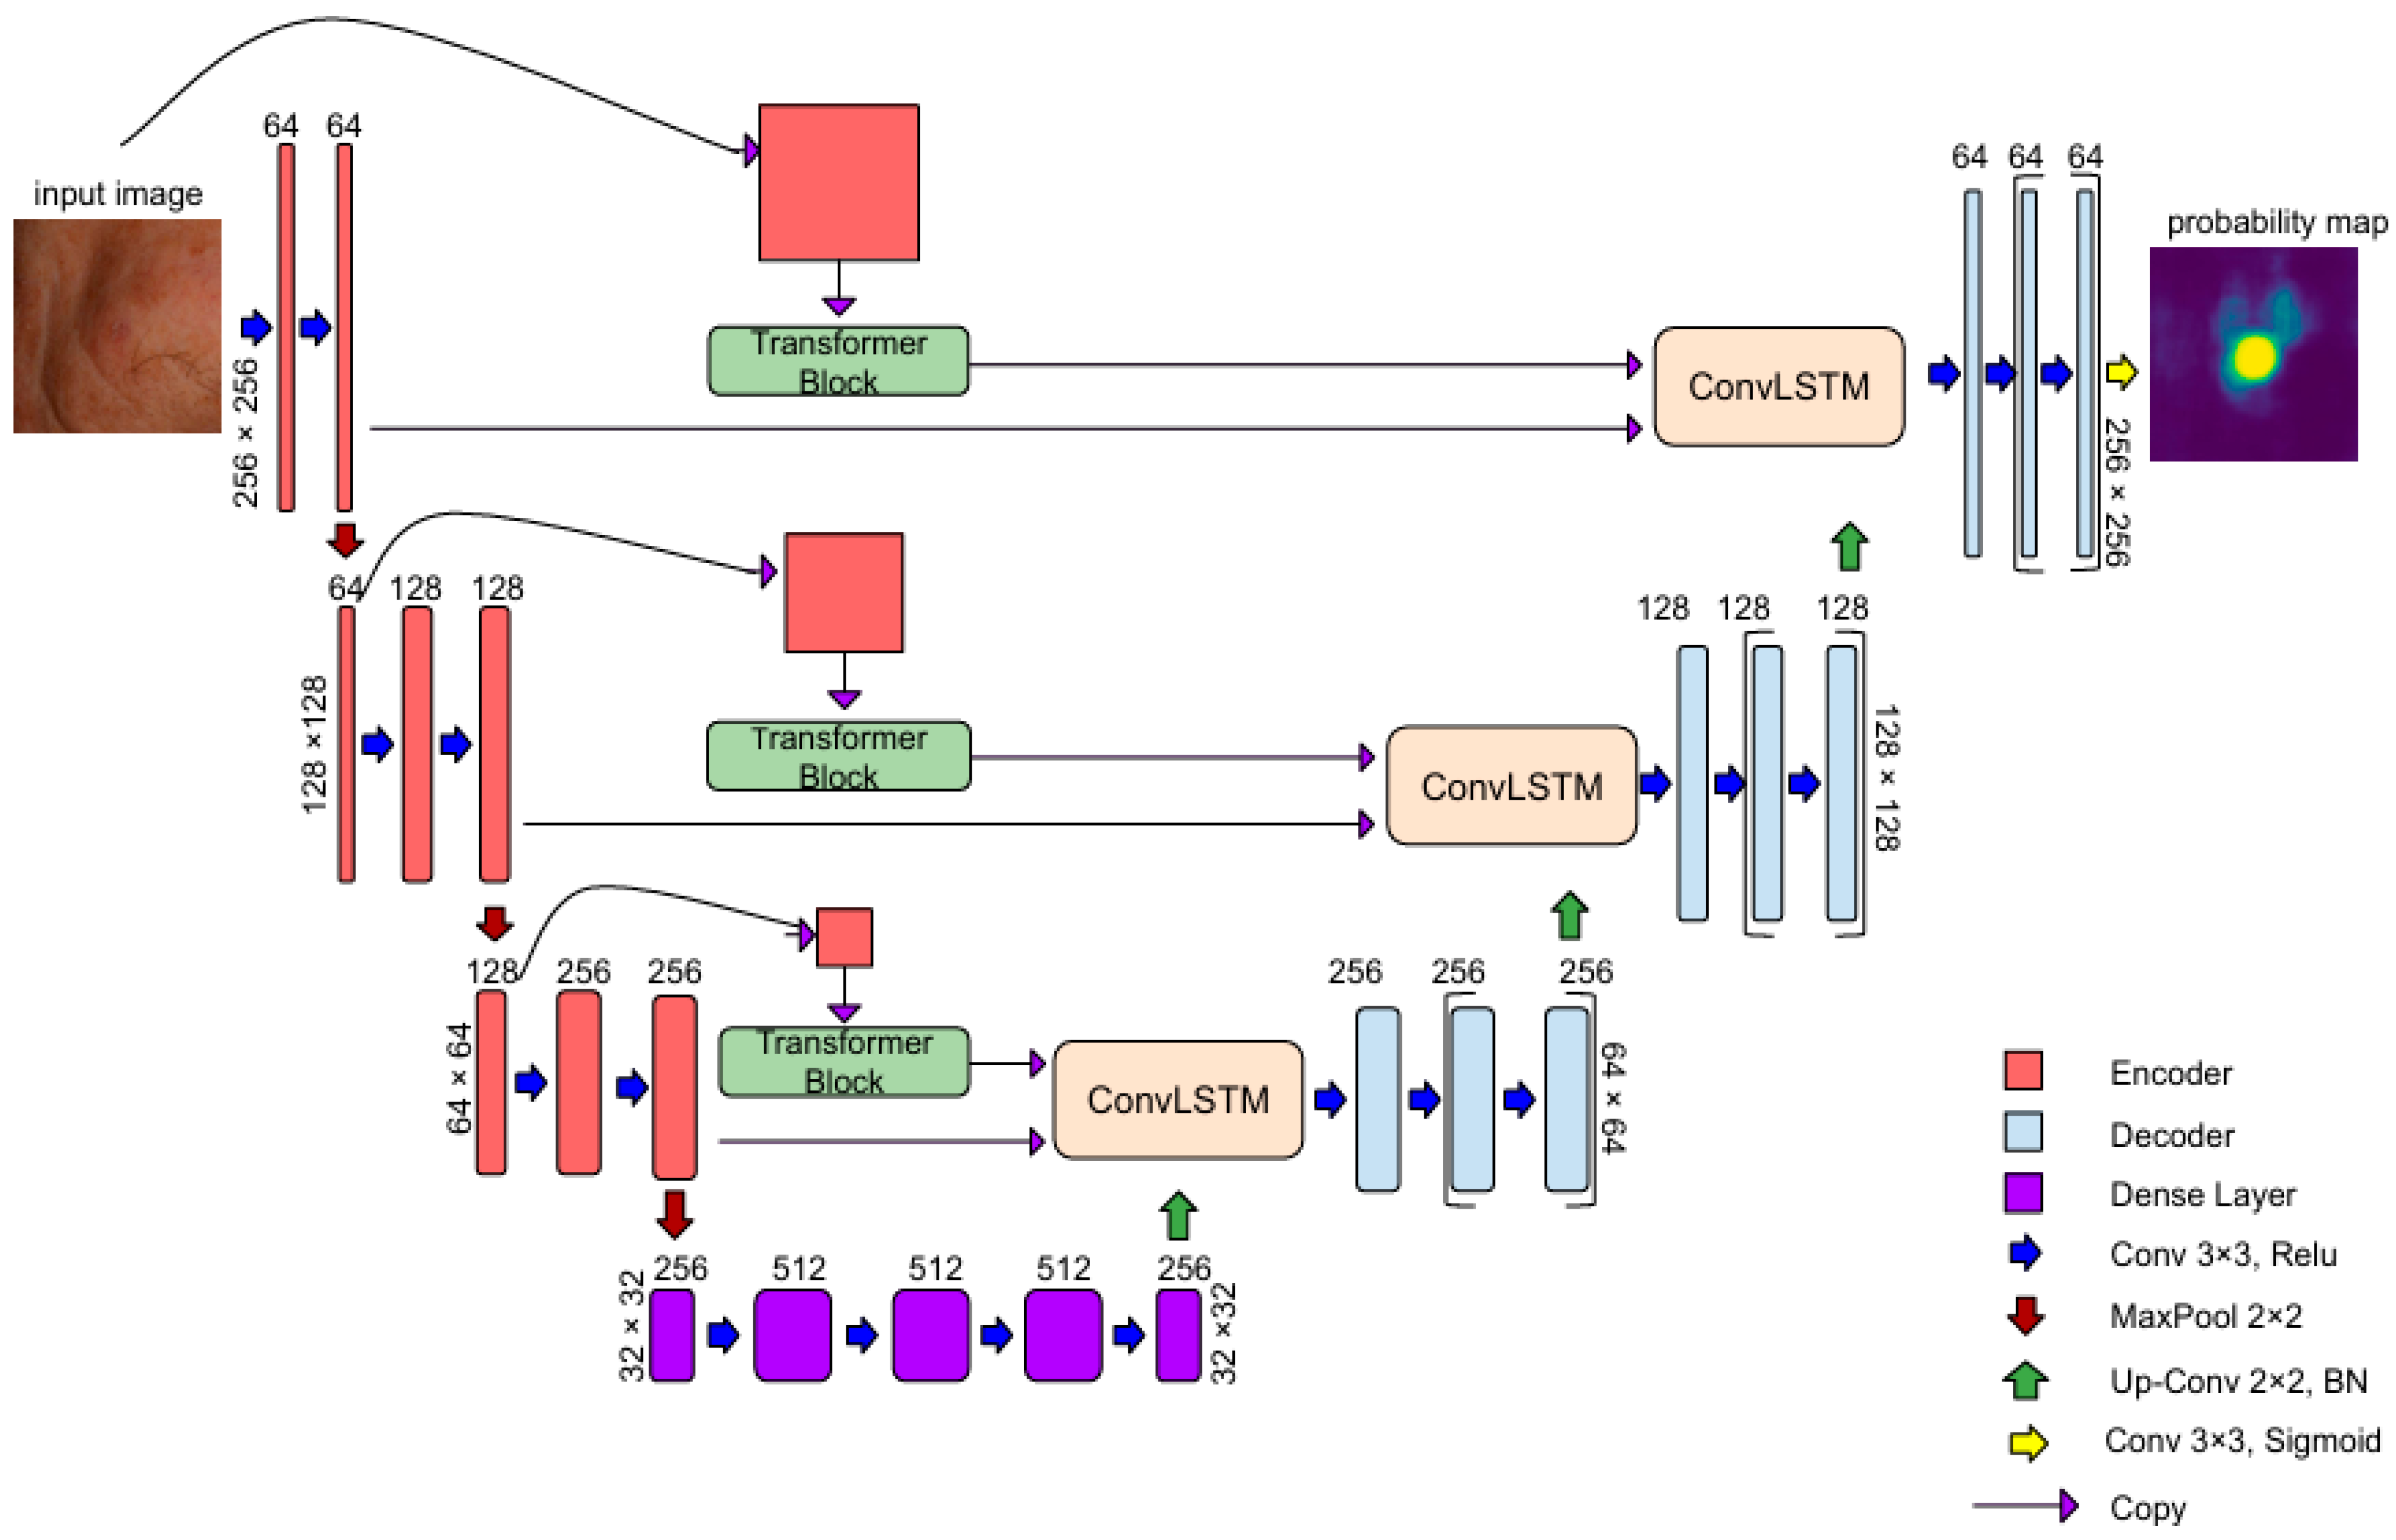
- We introduce AKTransU-net, a hybrid U-net-based architecture that incorporates Transformer blocks to enrich feature representations. These are further refined through ConvLSTM modules embedded within the skip connections. Improvements in AK segmentation accuracy—at both crop and full-image levels—are demonstrated through comparisons with state-of-the-art semantic segmentation models.
- We significantly improve the whole-image segmentation performance by employing a Gaussian weighting technique to mitigate boundary effects during prediction merging.
- We underscore the crucial role of scanning methodology in real-world segmentation applications, suggesting that evaluations conducted solely under ideal conditions may fail to capture a model’s variability and robustness during deployment.
2. Related Work
2.1. The Evolution of Transformer Architectures in Medical Image Segmentation
2.2. Skip Connections in Hybrid U-Net Architectures
3. Materials and Methods
3.1. AKtransU-Net: Skip Connection Enforcement with Global Dependencies
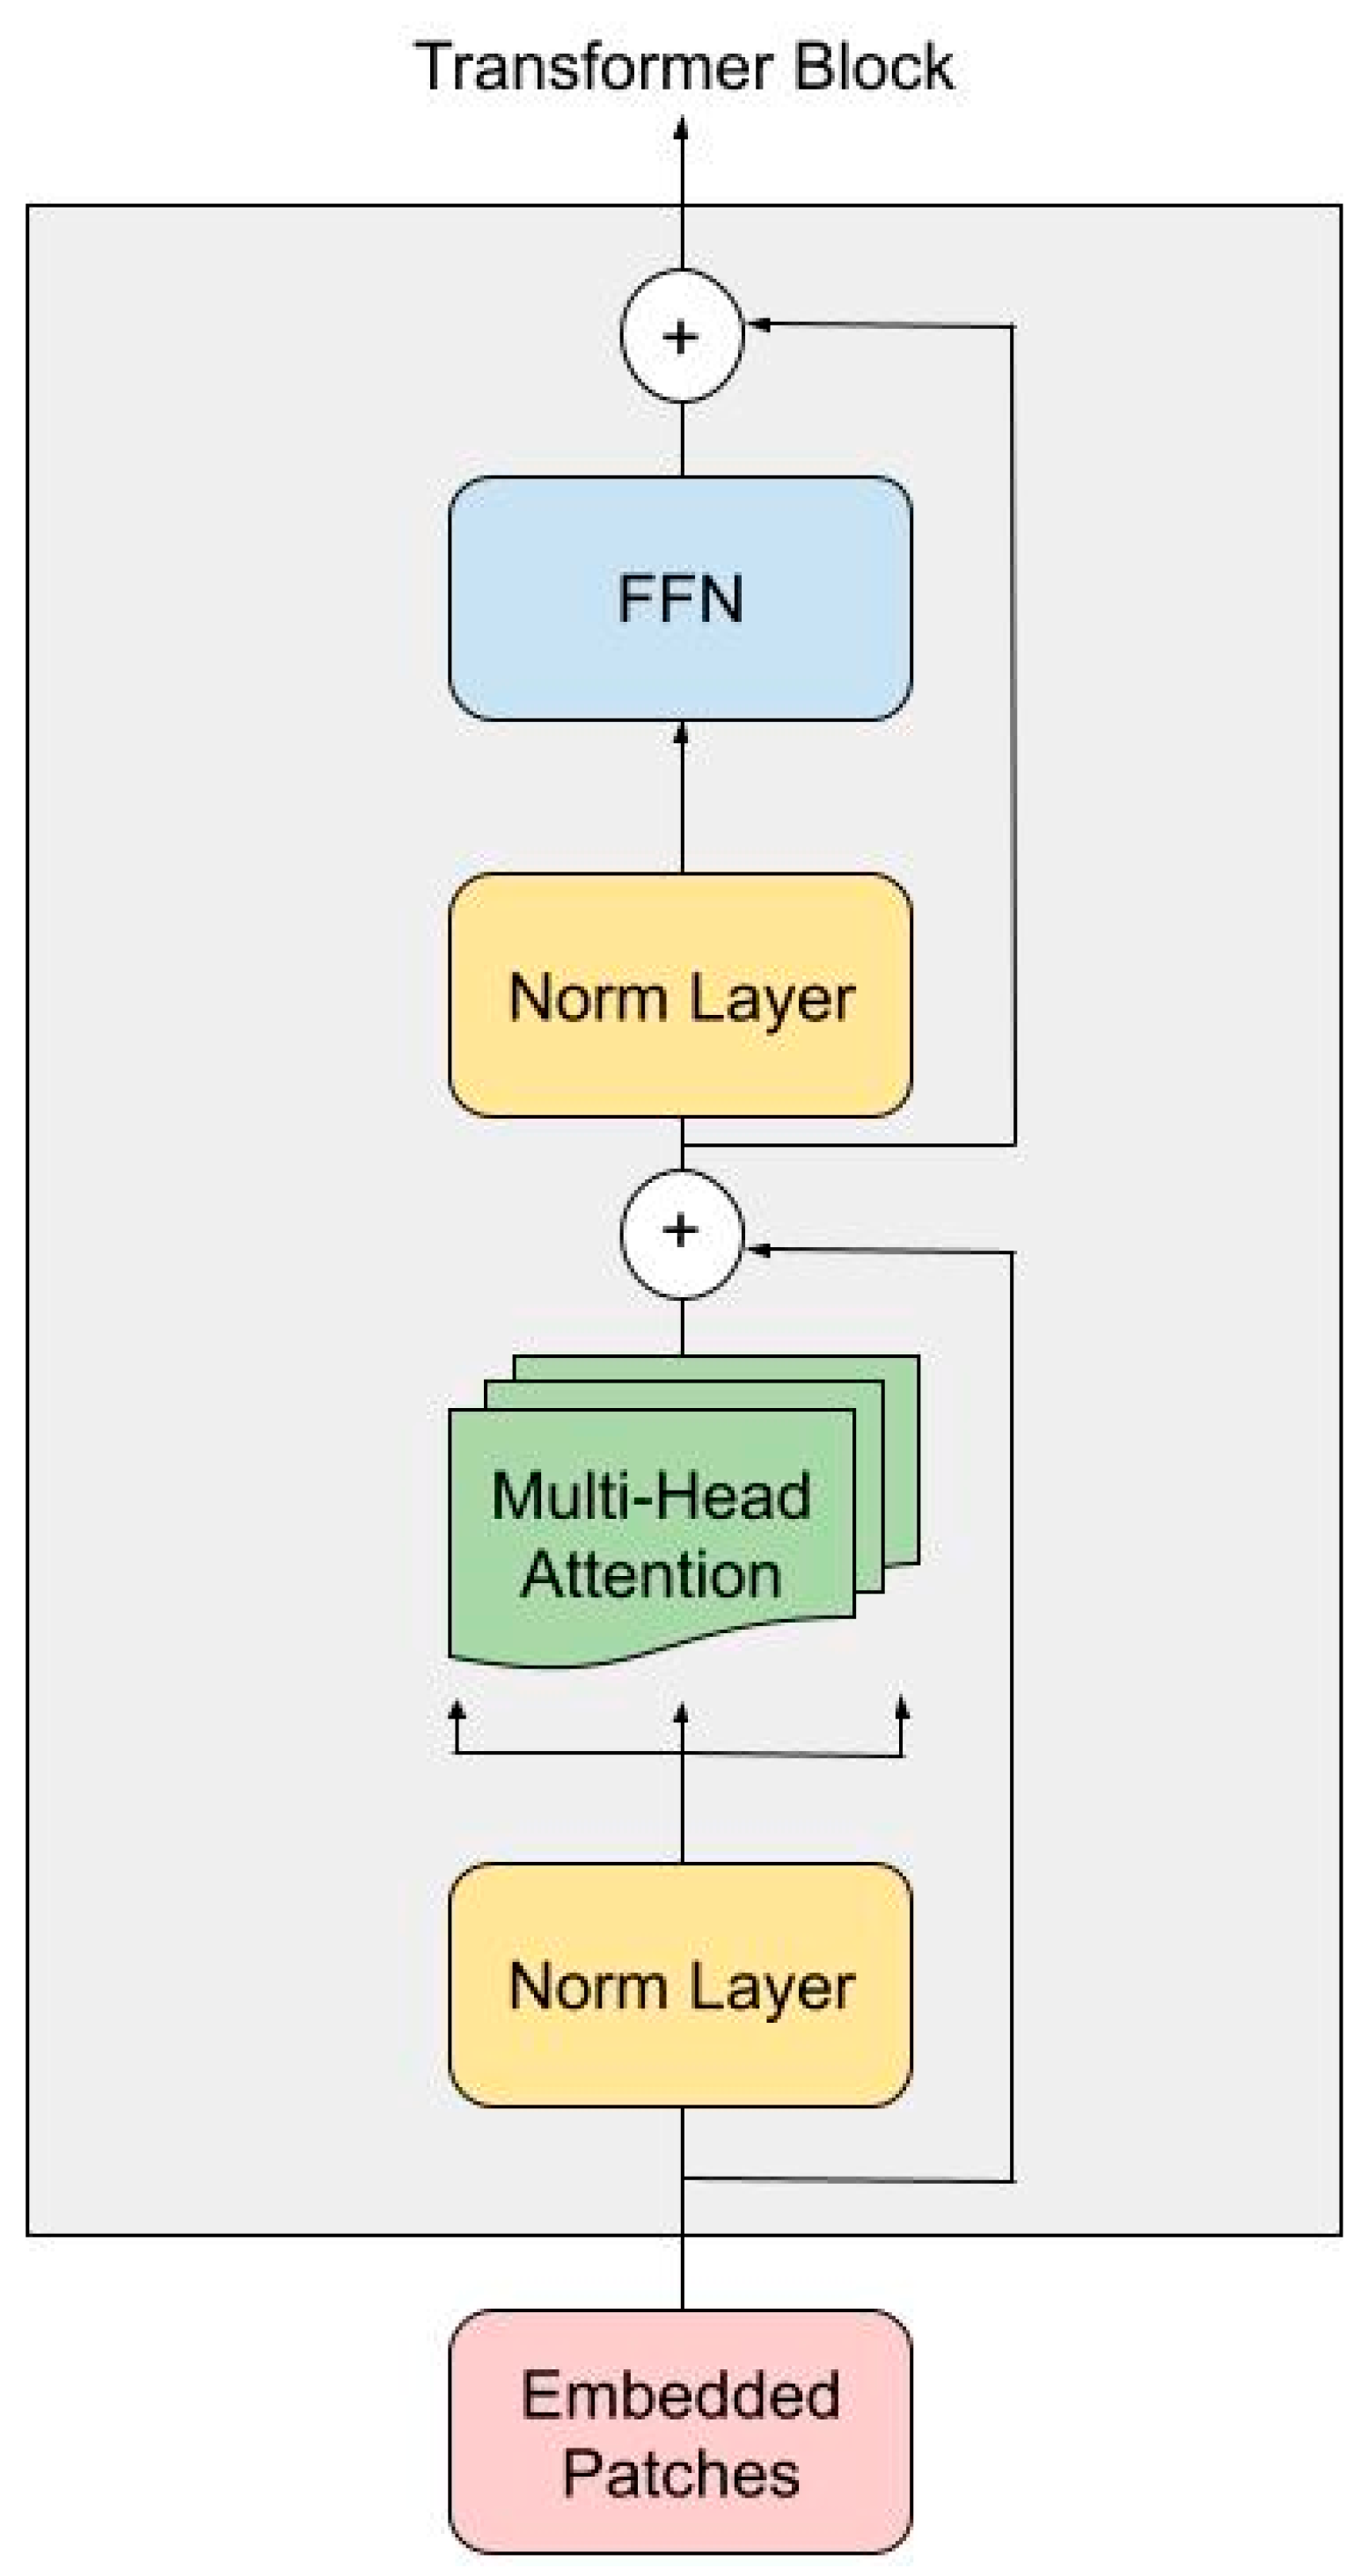
3.1.1. Transformer Encoder
3.1.2. ConvLSTM in Skip Connections for Spatial Refinement
3.2. Material
Data Augmentation and Dataset Preparation
3.3. Evaluation
3.4. Implementation Details
4. Results
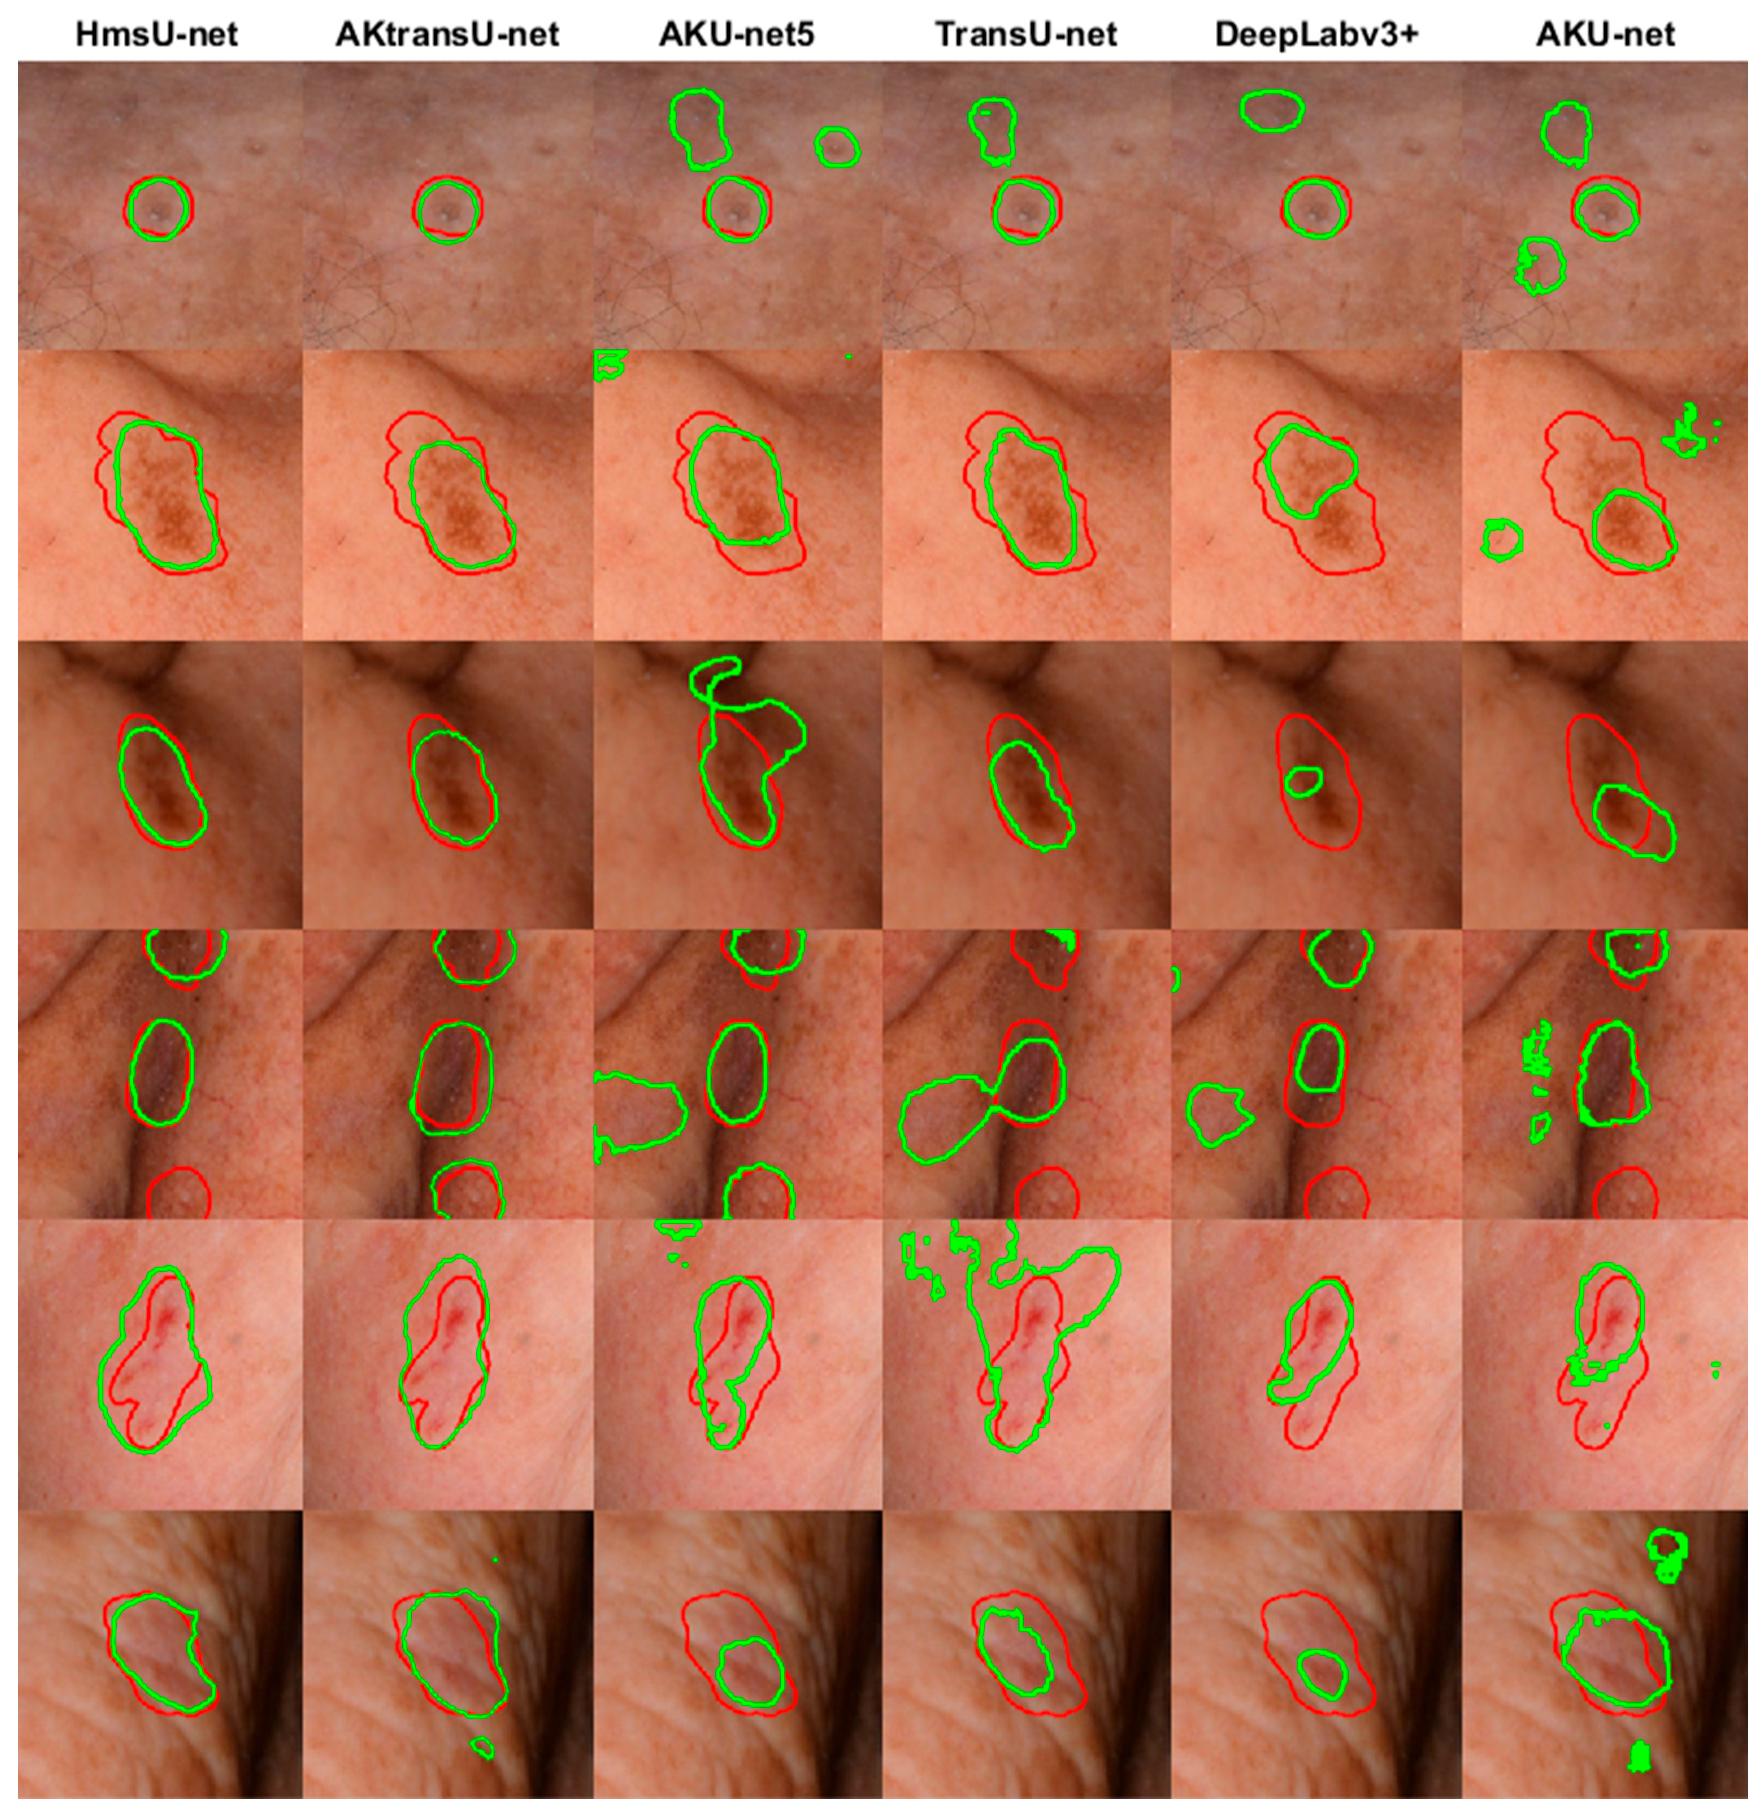
4.1. AK Detection in Localized Image Regions (256 × 256 Crops)
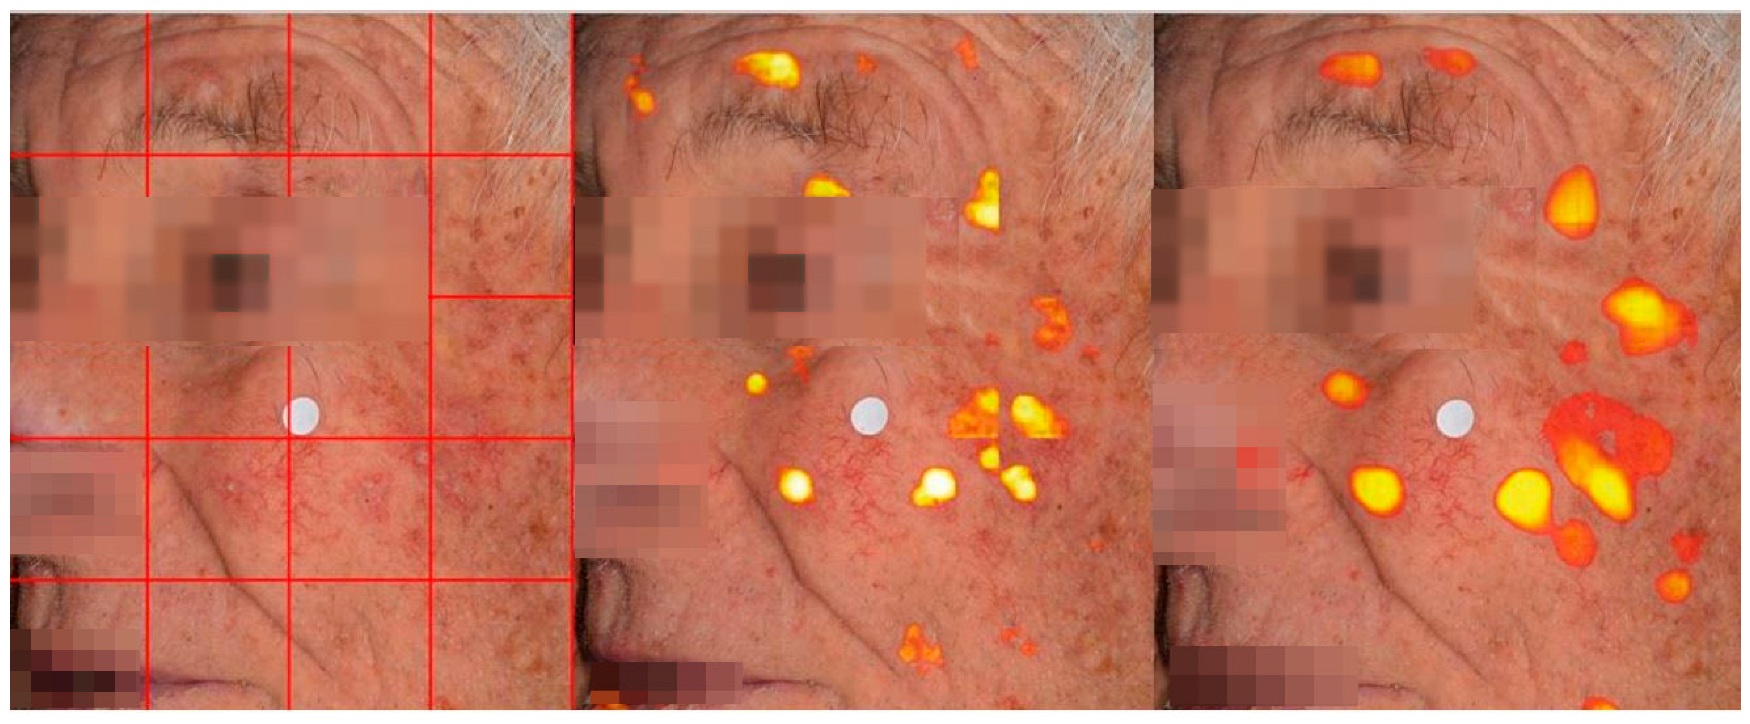
4.2. Lesion Detection in Full Clinical Photographs—Whole-Image Inference
5. Discussion
6. Conclusions
Author Contributions
Funding
Institutional Review Board Statement
Informed Consent Statement
Data Availability Statement
Conflicts of Interest
Abbreviations
| AK | Actinic Keratosis |
| CNN | Convolutional Neural Network |
| ViT | Vision Transformer |
| ConvLSTM | Convolutional Long Short-Term Memory |
| TransU-net | Transformer U-Net |
| HmsU-net | Hybrid Multi-Scale U-Net |
| YOLO | You Only Look Once |
| BConvLSTM | Bidirectional Convolutional Long Short-Term Memory |
References
- Willenbrink, T.J.; Ruiz, E.S.; Cornejo, C.M.; Schmults, C.D.; Arron, S.T. Jambusaria-Pahlajani, Field cancerization: Definition, epidemiology, risk factors, and outcomes. J. Am. Acad. Dermatol. 2020, 83, 709–717. [Google Scholar] [CrossRef]
- Nart, I.F.; Cerio, R.; Dirschka, T.; Dréno, B.; Lear, J.T.; Pellacani, G.; Peris, K.; de Casas, A.R. Defining the actinic keratosis field: A literature review and discussion. J. Eur. Acad. Dermatol. Venereol. 2018, 32, 544–563. [Google Scholar] [CrossRef]
- Schmitz, L.; Broganelli, P.; Boada, A. Classifying Actinic Keratosis: What the Reality of Everyday Clinical Practice Shows Us. J. Drugs Dermatol. 2022, 21, 845–849. [Google Scholar] [CrossRef]
- Malvehy, J.; Stratigos, A.J.; Bagot, M.; Stockfleth, E.; Ezzedine, K.; Delarue, A. Actinic keratosis: Current challenges and unanswered questions. J. Eur. Acad. Dermatol. Venereol. 2024, 38 (Suppl. S5), 3–11. [Google Scholar] [CrossRef]
- Ezzedine, K.; Painchault, C.; Brignone, M. Systematic Literature Review and Network Meta-analysis of the Efficacy and Acceptability of Interventions in Actinic Keratoses. Acta Derm. Venereol. 2021, 101, adv00358. [Google Scholar] [CrossRef]
- Epstein, E. Quantifying actinic keratosis: Assessing the evidence. Am. J. Clin. Dermatol. 2004, 5, 141–144. [Google Scholar] [CrossRef]
- Baker, C.; James, A.; Supranowicz, M.; Spelman, L.; Shumack, S.; Cole, J.; Weightman, W.; Sinclair, R.; Foley, P. Method of Assessing Skin Cancerization and KeratosesTM (MASCKTM): Development and photographic validation in multiple anatomical sites of a novel assessment tool intended for clinical evaluation of patients with extensive skin field cancerization. Clin. Exp. Dermatol. 2022, 47, 1144–1153. [Google Scholar] [CrossRef]
- Pasquali, P. Photography in Clinical Medicine, 1st ed.; Springer: Cham, Switzerland, 2020. [Google Scholar]
- Hames, S.C.; Sinnya, S.; Tan, J.M.; Morze, C.; Sahebian, A.; Soyer, H.P.; Prow, T.W. Automated detection of actinic keratoses in clinical photographs. PLoS ONE 2015, 10, e0112447. [Google Scholar] [CrossRef]
- Spyridonos, P.; Gaitanis, G.; Likas, A.; Bassukas, I.D. Automatic discrimination of actinic keratoses from clinical photographs. Comput. Biol. Med. 2017, 88, 50–59. [Google Scholar] [CrossRef]
- Nanni, L.; Paci, M.; Maguolo, G.; Ghidoni, S. Deep learning for actinic keratosis classification. AIMS Electron. Electr. Eng. 2020, 4, 47–56. [Google Scholar] [CrossRef]
- Spyridonos, P.; Gaitanis, G.; Likas, A.; Bassukas, I.D. Late fusion of deep and shallow features to improve discrimination of actinic keratosis from normal skin using clinical photography. Skin. Res. Technol. 2019, 25, 538–543. [Google Scholar] [CrossRef] [PubMed]
- Spyridonos, P.; Gaitanis, G.; Likas, A.; Bassukas, I.D. A convolutional neural network based system for detection of actinic keratosis in clinical images of cutaneous field cancerization. Biomed. Signal Process Control. 2023, 79, 104059. [Google Scholar] [CrossRef]
- Derekas, P.; Spyridonos, P.; Likas, A.; Zampeta, A.; Gaitanis, G.; Bassukas, I. The Promise of Semantic Segmentation in Detecting Actinic Keratosis Using Clinical Photography in the Wild. Cancers 2023, 15, 4861. [Google Scholar] [CrossRef]
- Dosovitskiy, A.; Beyer, L.; Kolesnikov, A.; Weissenborn, D.; Zhai, X.; Unterthiner, T.; Dehghani, M.; Minderer, M.; Heigold, G.; Gelly, S.; et al. An Image is Worth 16x16 Words: Transformers for Image Recognition at Scale. arXiv 2020, arXiv:2010.11929. [Google Scholar]
- Liu, Z.; Lin, Y.; Cao, Y.; Hu, H.; Wei, Y.; Zhang, Z.; Lin, S.; Guo, B. Swin Transformer: Hierarchical Vision Transformer using Shifted Windows. In Proceedings of the 2021 IEEE/CVF International Conference on Computer Vision (ICCV), Montreal, BC, Canada, 11–17 October 2021; pp. 9992–10002. [Google Scholar] [CrossRef]
- Wang, W.; Xie, E.; Li, X.; Fan, D.-P.; Song, K.; Liang, D.; Lu, T.; Luo, P.; Shao, L. Pyramid Vision Transformer: A Versatile Backbone for Dense Prediction without Convolutions. In Proceedings of the 2021 IEEE/CVF International Conference on Computer Vision (ICCV), Montreal, BC, Canada, 11–17 October 2021; pp. 548–558. [Google Scholar] [CrossRef]
- Graham, B.; El-Nouby, A.; Touvron, H.; Stock, P.; Joulin, A.; Jégou, H.; Douze, M. LeViT: A Vision Transformer in ConvNet’s Clothing for Faster Inference. In Proceedings of the 2021 IEEE/CVF International Conference on Computer Vision (ICCV), Montreal, BC, Canada, 11–17 October 2021; pp. 12239–12249. [Google Scholar] [CrossRef]
- Siddique, N.; Paheding, S.; Elkin, C.P.; Devabhaktuni, V. U-net and its variants for medical image segmentation: A review of theory and applications. IEEE Access 2021, 9, 82031–82057. [Google Scholar] [CrossRef]
- Azad, R.; Aghdam, E.K.; Rauland, A.; Jia, Y.; Avval, A.H.; Bozorgpour, A.; Karimijafarbigloo, S.; Cohen, J.P.; Adeli, E.; Merhof, D. Medical Image Segmentation Review: The Success of U-Net. IEEE Trans. Pattern Anal. Mach. Intell. 2024, 46, 10076–10095. [Google Scholar] [CrossRef] [PubMed]
- Pu, Q.; Xi, Z.; Yin, S.; Zhao, Z.; Zhao, L. Advantages of transformer and its application for medical image segmentation: A survey. Biomed. Eng. Online 2024, 23, 14. [Google Scholar] [CrossRef]
- Khan, R.F.; Lee, B.D.; Lee, M.S. Transformers in medical image segmentation: A narrative review. Quant. Imaging Med. Surg. 2023, 13, 8747–8767. [Google Scholar] [CrossRef]
- Xiao, H.; Li, L.; Liu, Q.; Zhu, X.; Zhang, Q. Transformers in medical image segmentation: A review. Biomed. Signal Process Control. 2023, 84, 104791. [Google Scholar] [CrossRef]
- Chen, J.; Lu, Y.; Yu, Q.; Luo, X.; Adeli, E.; Wang, Y.; Lu, L.; Yuille, A.L.; Zhou, Y. TransUNet: Transformers Make Strong Encoders for Medical Image Segmentation. arXiv 2021, arXiv:2102.04306. [Google Scholar]
- Chen, J.; Mei, J.; Li, X.; Lu, Y.; Yu, Q.; Wei, Q.; Luo, X.; Xie, Y.; Adeli, E.; Wang, Y.; et al. TransUNet: Rethinking the U-Net architecture design for medical image segmentation through the lens of transformers. Med. Image Anal. 2024, 97, 103280. [Google Scholar] [CrossRef] [PubMed]
- Atek, S.; Mehidi, I.; Jabri, D.; Belkhiat, D.E.C. SwinT-Unet: Hybrid architecture for Medical Image Segmentation Based on Swin transformer block and Dual-Scale Information. In Proceedings of the 2022 7th International Conference on Image and Signal Processing and Their Applications (ISPA), Mostaganem, Algeria, 8–9 May 2022; pp. 1–6. [Google Scholar] [CrossRef]
- Lin, A.; Chen, B.; Xu, J.; Zhang, Z.; Lu, G.; Zhang, D. DS-TransUNet: Dual Swin Transformer U-Net for Medical Image Segmentation. IEEE Trans. Instrum. Meas. 2022, 71, 4005615. [Google Scholar] [CrossRef]
- Wang, H.; Cao, P.; Wang, J.; Zaïane, O. UCTransNet: Rethinking the Skip Connections in U-Net from a Channel-Wise Perspective with Transformer. Proc. AAAI Conf. Artif. Intell. 2022, 36, 2441–2449. [Google Scholar] [CrossRef]
- Fu, B.; Peng, Y.; He, J.; Tian, C.; Sun, X.; Wang, R. HmsU-Net: A hybrid multi-scale U-net based on a CNN and transformer for medical image segmentation. Comput. Biol. Med. 2024, 170, 108013. [Google Scholar] [CrossRef]
- Ronneberger, O.; Fischer, P.; Brox, T. U-net: Convolutional networks for biomedical image segmentation. In Lecture Notes in Computer Science (Including Subseries Lecture Notes in Artificial Intelligence and Lecture Notes in Bioinformatics); Springer: Berlin/Heidelberg, Germany, 2015; Volume 9351, pp. 234–241. [Google Scholar] [CrossRef]
- Ibtehaz, N.; Rahman, M.S. MultiResUNet: Rethinking the U-Net architecture for multimodal biomedical image segmentation. Neural Netw. 2020, 121, 74–87. [Google Scholar] [CrossRef]
- Chen, S.; Zou, Y.; Liu, P.X. IBA-U-Net: Attentive BConvLSTM U-Net with Redesigned Inception for medical image segmentation. Comput. Biol. Med. 2021, 135, 104551. [Google Scholar] [CrossRef]
- Zhang, X.; Yang, S.; Jiang, Y.; Chen, Y.; Sun, F. FAFS-UNet: Redesigning skip connections in UNet with feature aggregation and feature selection. Comput. Biol. Med. 2024, 170, 108009. [Google Scholar] [CrossRef] [PubMed]
- Byeon, W.; Breuel, T.M.; Raue, F.; Liwicki, M. Scene labeling with LSTM recurrent neural networks. In Proceedings of the 2015 IEEE Conference on Computer Vision and Pattern Recognition (CVPR), Boston, MA, USA, 7–12 June 2015; pp. 3547–3555. [Google Scholar] [CrossRef]
- Shi, X.; Chen, Z.; Wang, H.; Yeung, D.Y.; Wong, W.K.; Woo, W.C. Convolutional LSTM Network: A Machine Learning Approach for Precipitation Nowcasting. Adv. Neural Inf. Process. Syst. 2015, 28, 802–810. Available online: https://arxiv.org/abs/1506.04214v2 (accessed on 4 July 2023).
- Azad, R.; Asadi-Aghbolaghi, M.; Fathy, M.; Escalera, S. Bi-Directional ConvLSTM U-Net with Densley Connected Convolutions. Int. Conf. Comput. Vis. Workshop 2019, 2019, 406–415. [Google Scholar] [CrossRef]
- Jiang, X.; Jiang, J.; Wang, B.; Yu, J.; Wang, J. SEACU-Net: Attentive ConvLSTM U-Net with squeeze-and-excitation layer for skin lesion segmentation. Comput. Methods Programs Biomed. 2022, 225, 107076. [Google Scholar] [CrossRef]
- Muccini, J.A.; Kollias, N.; Phillips, S.B.; Anderson, R.R.; Sober, A.J.; Stiller, M.J.; Drake, L.A. Polarized light photography in the evaluation of photoaging. J. Am. Acad. Dermatol. 1995, 33, 765–769. [Google Scholar] [CrossRef] [PubMed]
- ISO 12232:2019; Photography—Digital Still Cameras—Determination of Exposure Index, ISO Speed Ratings, Standard Output Sensitivity, and Recommended Exposure Index. ISO: Geneva, Switzerland, 2019.
- Chen, L.C.; Zhu, Y.; Papandreou, G.; Schroff, F.; Adam, H. Encoder-Decoder with Atrous Separable Convolution for Semantic Image Segmentation. Lecture Notes in Computer Science (Including Subseries Lecture Notes in Artificial Intelligence and Lecture Notes in Bioinformatics; ECCV: Munich, Germany, 2018; Volume 11211, pp. 833–851. [Google Scholar] [CrossRef]
- Prokopiou, I.; Spyridonos, P. Highlighting the Advanced Capabilities and the Computational Efficiency of DeepLabV3+ in Medical Image Segmentation: An Ablation Study. BioMedInformatics 2025, 5, 10. [Google Scholar] [CrossRef]
- Varghese, R.; Sambath, M. YOLOv8: A Novel Object Detection Algorithm with Enhanced Performance and Robustness. In Proceedings of the 2024 International Conference on Advances in Data Engineering and Intelligent Computing Systems (ADICS), Chennai, India, 18–19 April 2024. [Google Scholar] [CrossRef]
- Zhang, Z.; Zou, Y.; Tan, Y.; Zhou, C. YOLOv8-seg-CP: A lightweight instance segmentation algorithm for chip pad based on improved YOLOv8-seg model. Sci. Rep. 2024, 14, 27716. [Google Scholar] [CrossRef] [PubMed]
- Explore Ultralytics YOLOv8. Ultralytics YOLO Docs (n.d.). Available online: https://docs.ultralytics.com/models/yolov8/ (accessed on 29 May 2025).


| Patients | Images | Image Crops | Augmentation Technique | |
|---|---|---|---|---|
| Train | 83 | 410 | 13,190 | Translation |
| Validation | 15 | 100 | 3298 | Translation |
| Test | 17 | 59 | 403 | None |
| Total | 115 | 569 | 16,891 |
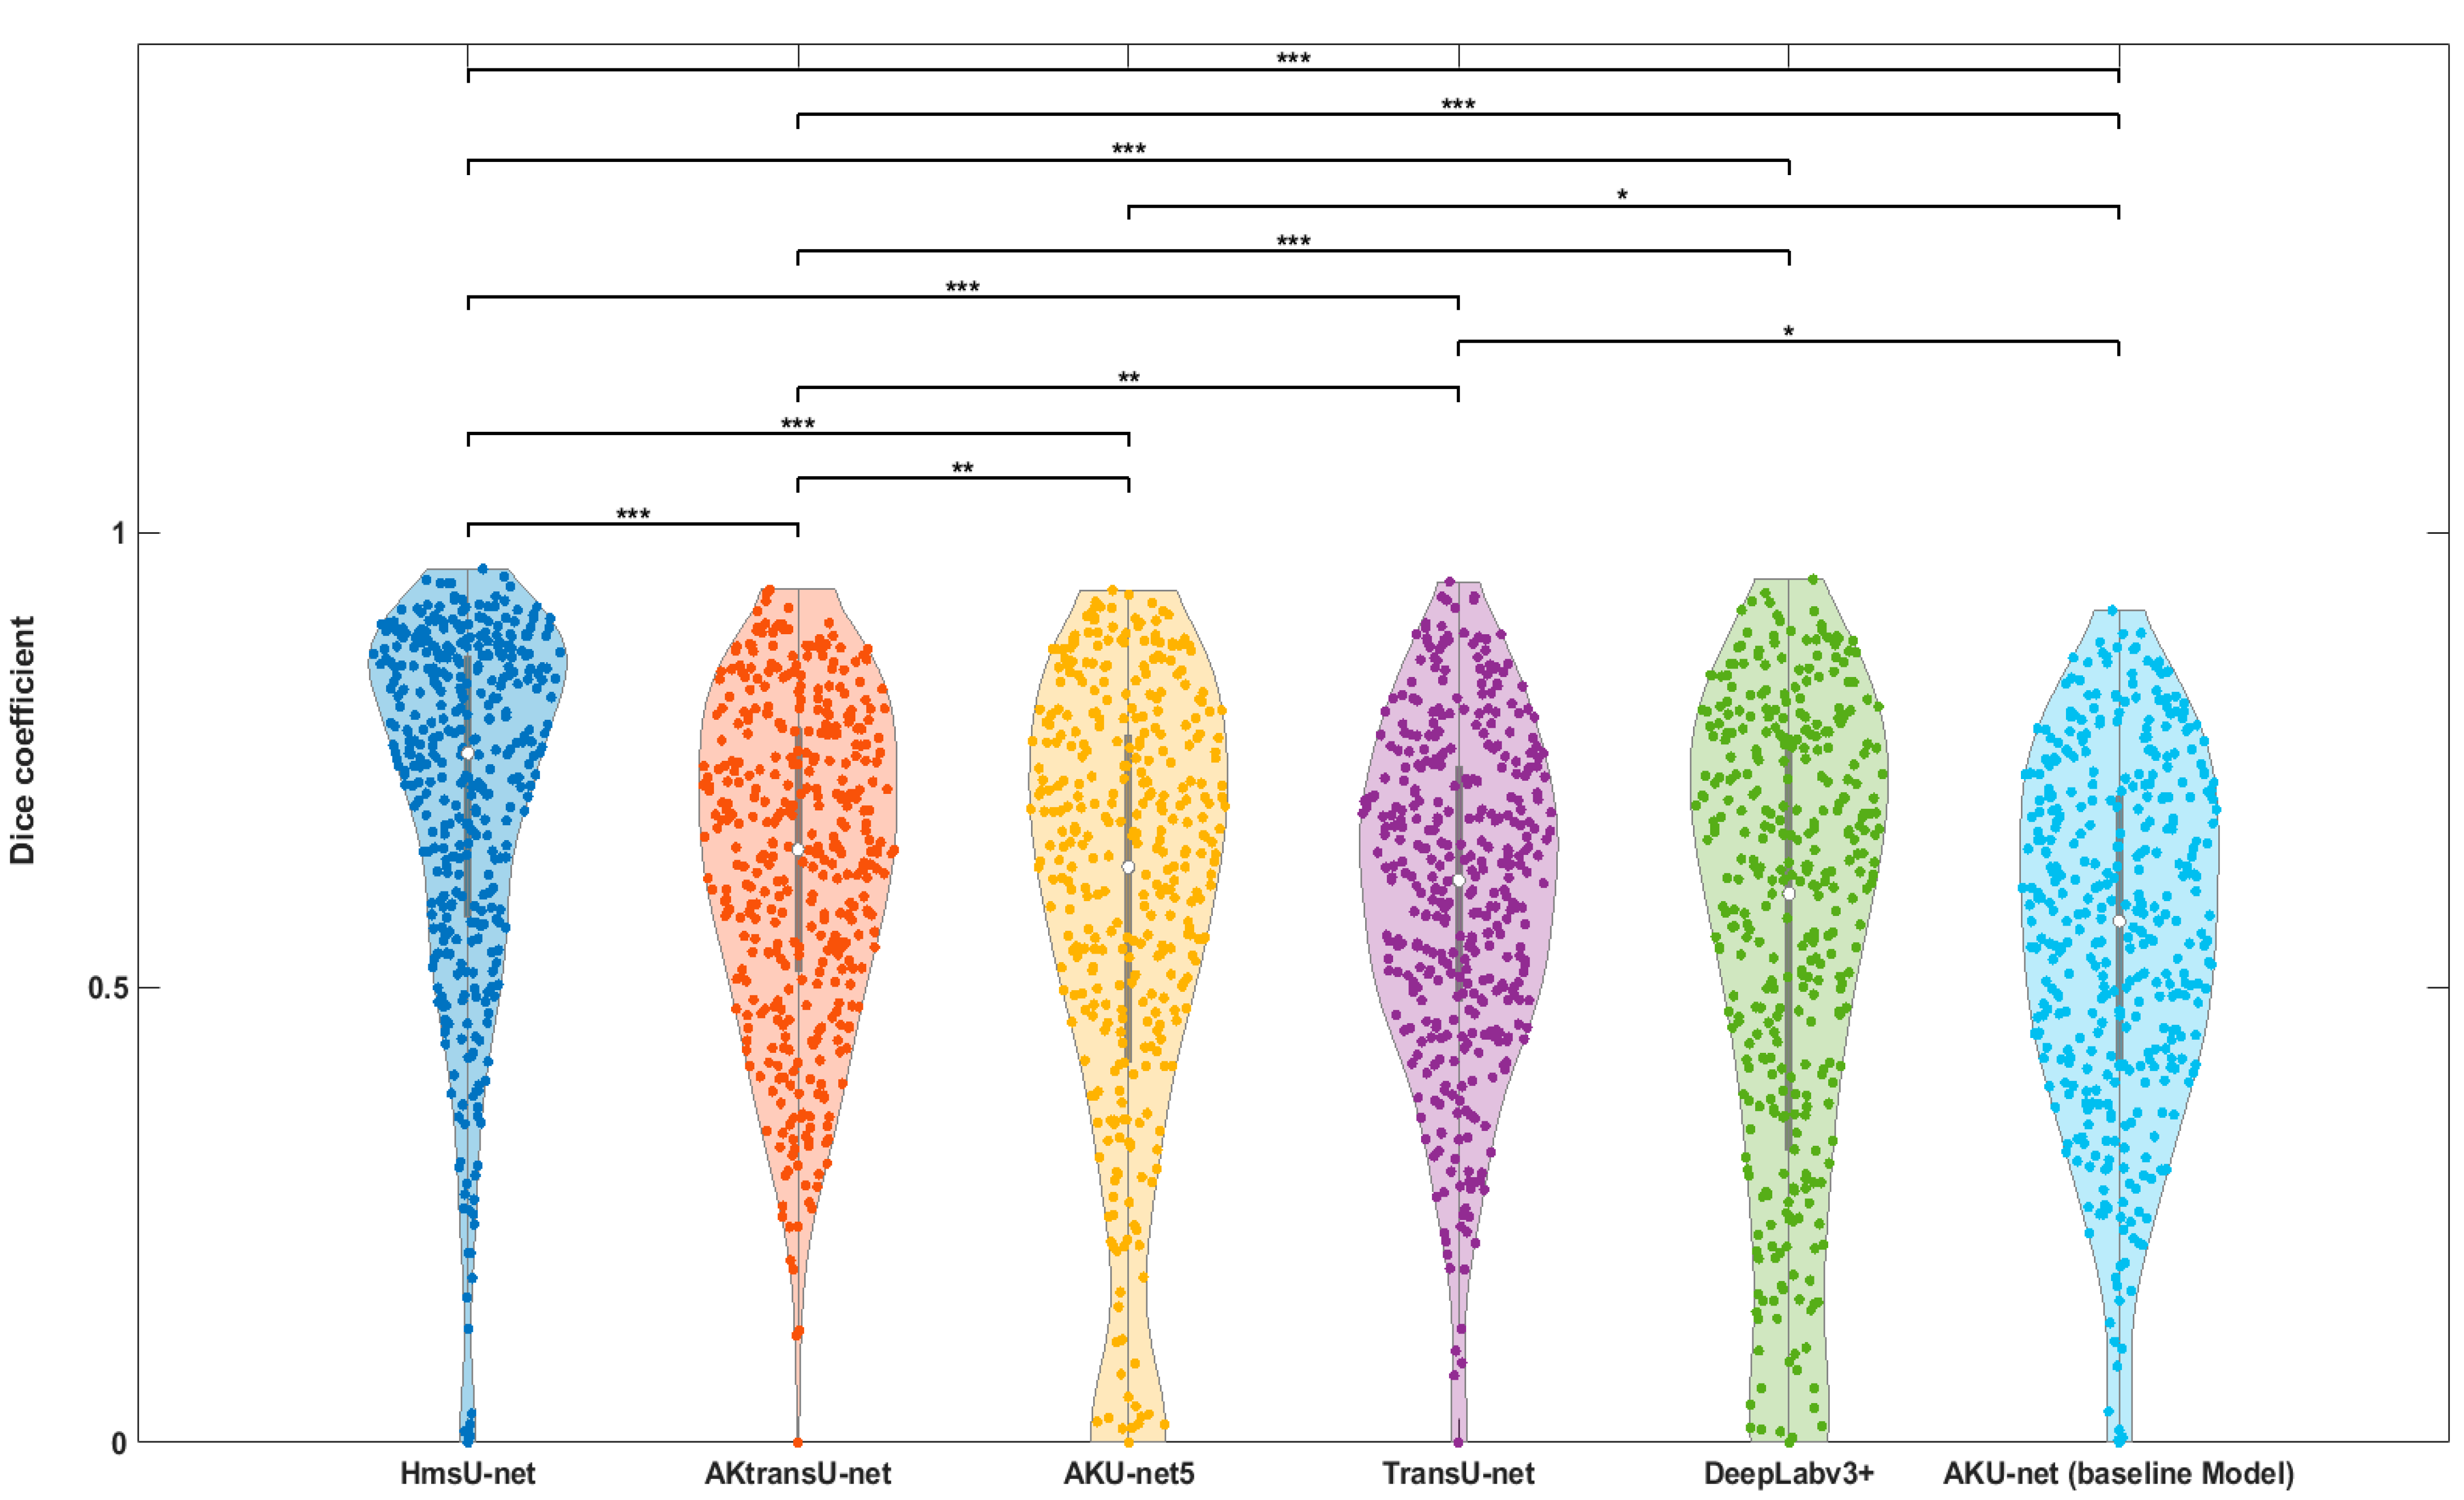
| Model | Median Dice (%) | p-Value (vs. Baseline Model) |
|---|---|---|
| AKU-net (baseline model) | 57.21 | |
| AKU-net5 | 63.16 | * |
| DeepLabv3+ | 60.24 | - |
| TransU-net | 61.70 | * |
| HmsU-net | 75.68 | *** |
| AKtransU-net | 65.10 | *** |
| Scanning Method | Median Dice (%) | p-Value (vs. Baseline Method) |
|---|---|---|
| Gaussian-weighted stride (256 × 256) baseline | 65.13 | — |
| Gaussian-weighted stride (128 × 128) | 64.70 | p > 0.05 |
| Average overlapping stride (256 × 256) | 48.11 | p < 0.01 |
| Non-overlapping block processing | 45.74 | p < 0.01 |
| Model | Median Dice (%) | p-Value (vs. Baseline Model) |
|---|---|---|
| AKtransU-net stride (256 × 256) baseline | 65.13 | — |
| HmsU-net (256 × 256) | 52.39 | p < 0.05 |
| HmsU-net (128 × 128) | 61.21 | p > 0.05 |
| YOLOSegV8 | 61.44 | p > 0.05 |
| Model | Median Dice (%) |
|---|---|
| AKU-net (base model) | 59.21 |
| AKU-net5 | 61.35 |
| DeepLabv3+ | 60.70 |
| TransU-net | 67.51 |
| AKtransU-net | 73.34 |
| HmsU-net | 74.02 |
Disclaimer/Publisher’s Note: The statements, opinions and data contained in all publications are solely those of the individual author(s) and contributor(s) and not of MDPI and/or the editor(s). MDPI and/or the editor(s) disclaim responsibility for any injury to people or property resulting from any ideas, methods, instructions or products referred to in the content. |
© 2025 by the authors. Licensee MDPI, Basel, Switzerland. This article is an open access article distributed under the terms and conditions of the Creative Commons Attribution (CC BY) license (https://creativecommons.org/licenses/by/4.0/).
Share and Cite
Derekas, P.; Theodoridis, C.; Likas, A.; Bassukas, I.; Gaitanis, G.; Zampeta, A.; Exadaktylou, D.; Spyridonos, P. AΚtransU-Net: Transformer-Equipped U-Net Model for Improved Actinic Keratosis Detection in Clinical Photography. Diagnostics 2025, 15, 1752. https://doi.org/10.3390/diagnostics15141752
Derekas P, Theodoridis C, Likas A, Bassukas I, Gaitanis G, Zampeta A, Exadaktylou D, Spyridonos P. AΚtransU-Net: Transformer-Equipped U-Net Model for Improved Actinic Keratosis Detection in Clinical Photography. Diagnostics. 2025; 15(14):1752. https://doi.org/10.3390/diagnostics15141752
Chicago/Turabian StyleDerekas, Panagiotis, Charalampos Theodoridis, Aristidis Likas, Ioannis Bassukas, Georgios Gaitanis, Athanasia Zampeta, Despina Exadaktylou, and Panagiota Spyridonos. 2025. "AΚtransU-Net: Transformer-Equipped U-Net Model for Improved Actinic Keratosis Detection in Clinical Photography" Diagnostics 15, no. 14: 1752. https://doi.org/10.3390/diagnostics15141752
APA StyleDerekas, P., Theodoridis, C., Likas, A., Bassukas, I., Gaitanis, G., Zampeta, A., Exadaktylou, D., & Spyridonos, P. (2025). AΚtransU-Net: Transformer-Equipped U-Net Model for Improved Actinic Keratosis Detection in Clinical Photography. Diagnostics, 15(14), 1752. https://doi.org/10.3390/diagnostics15141752