
An Information-Extreme Algorithm for Universal Nuclear Feature-Driven Automated Classification of Breast Cancer Cells

 , ,
, ,  and
and
Abstract
1. Introduction
2. Materials and Methods
2.1. Tissue Sample Preparation and Ethics
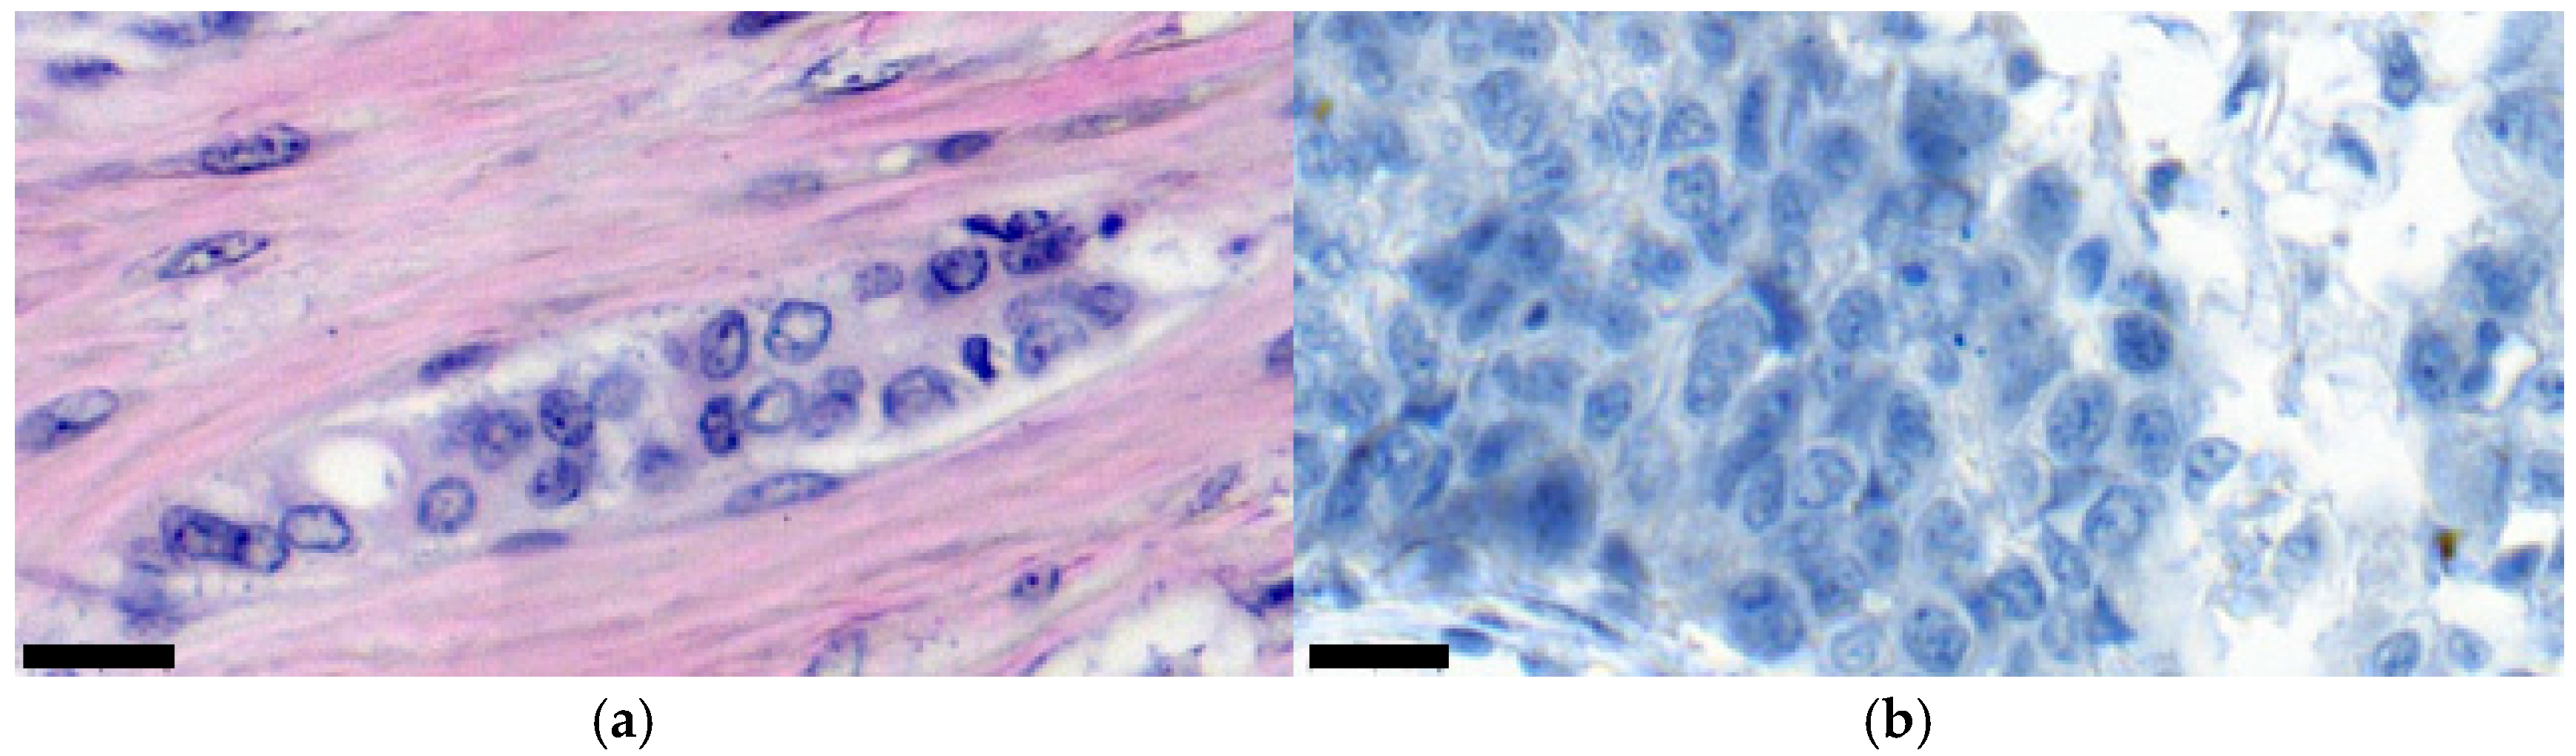
2.2. Histology
2.3. Statistics
3. Results
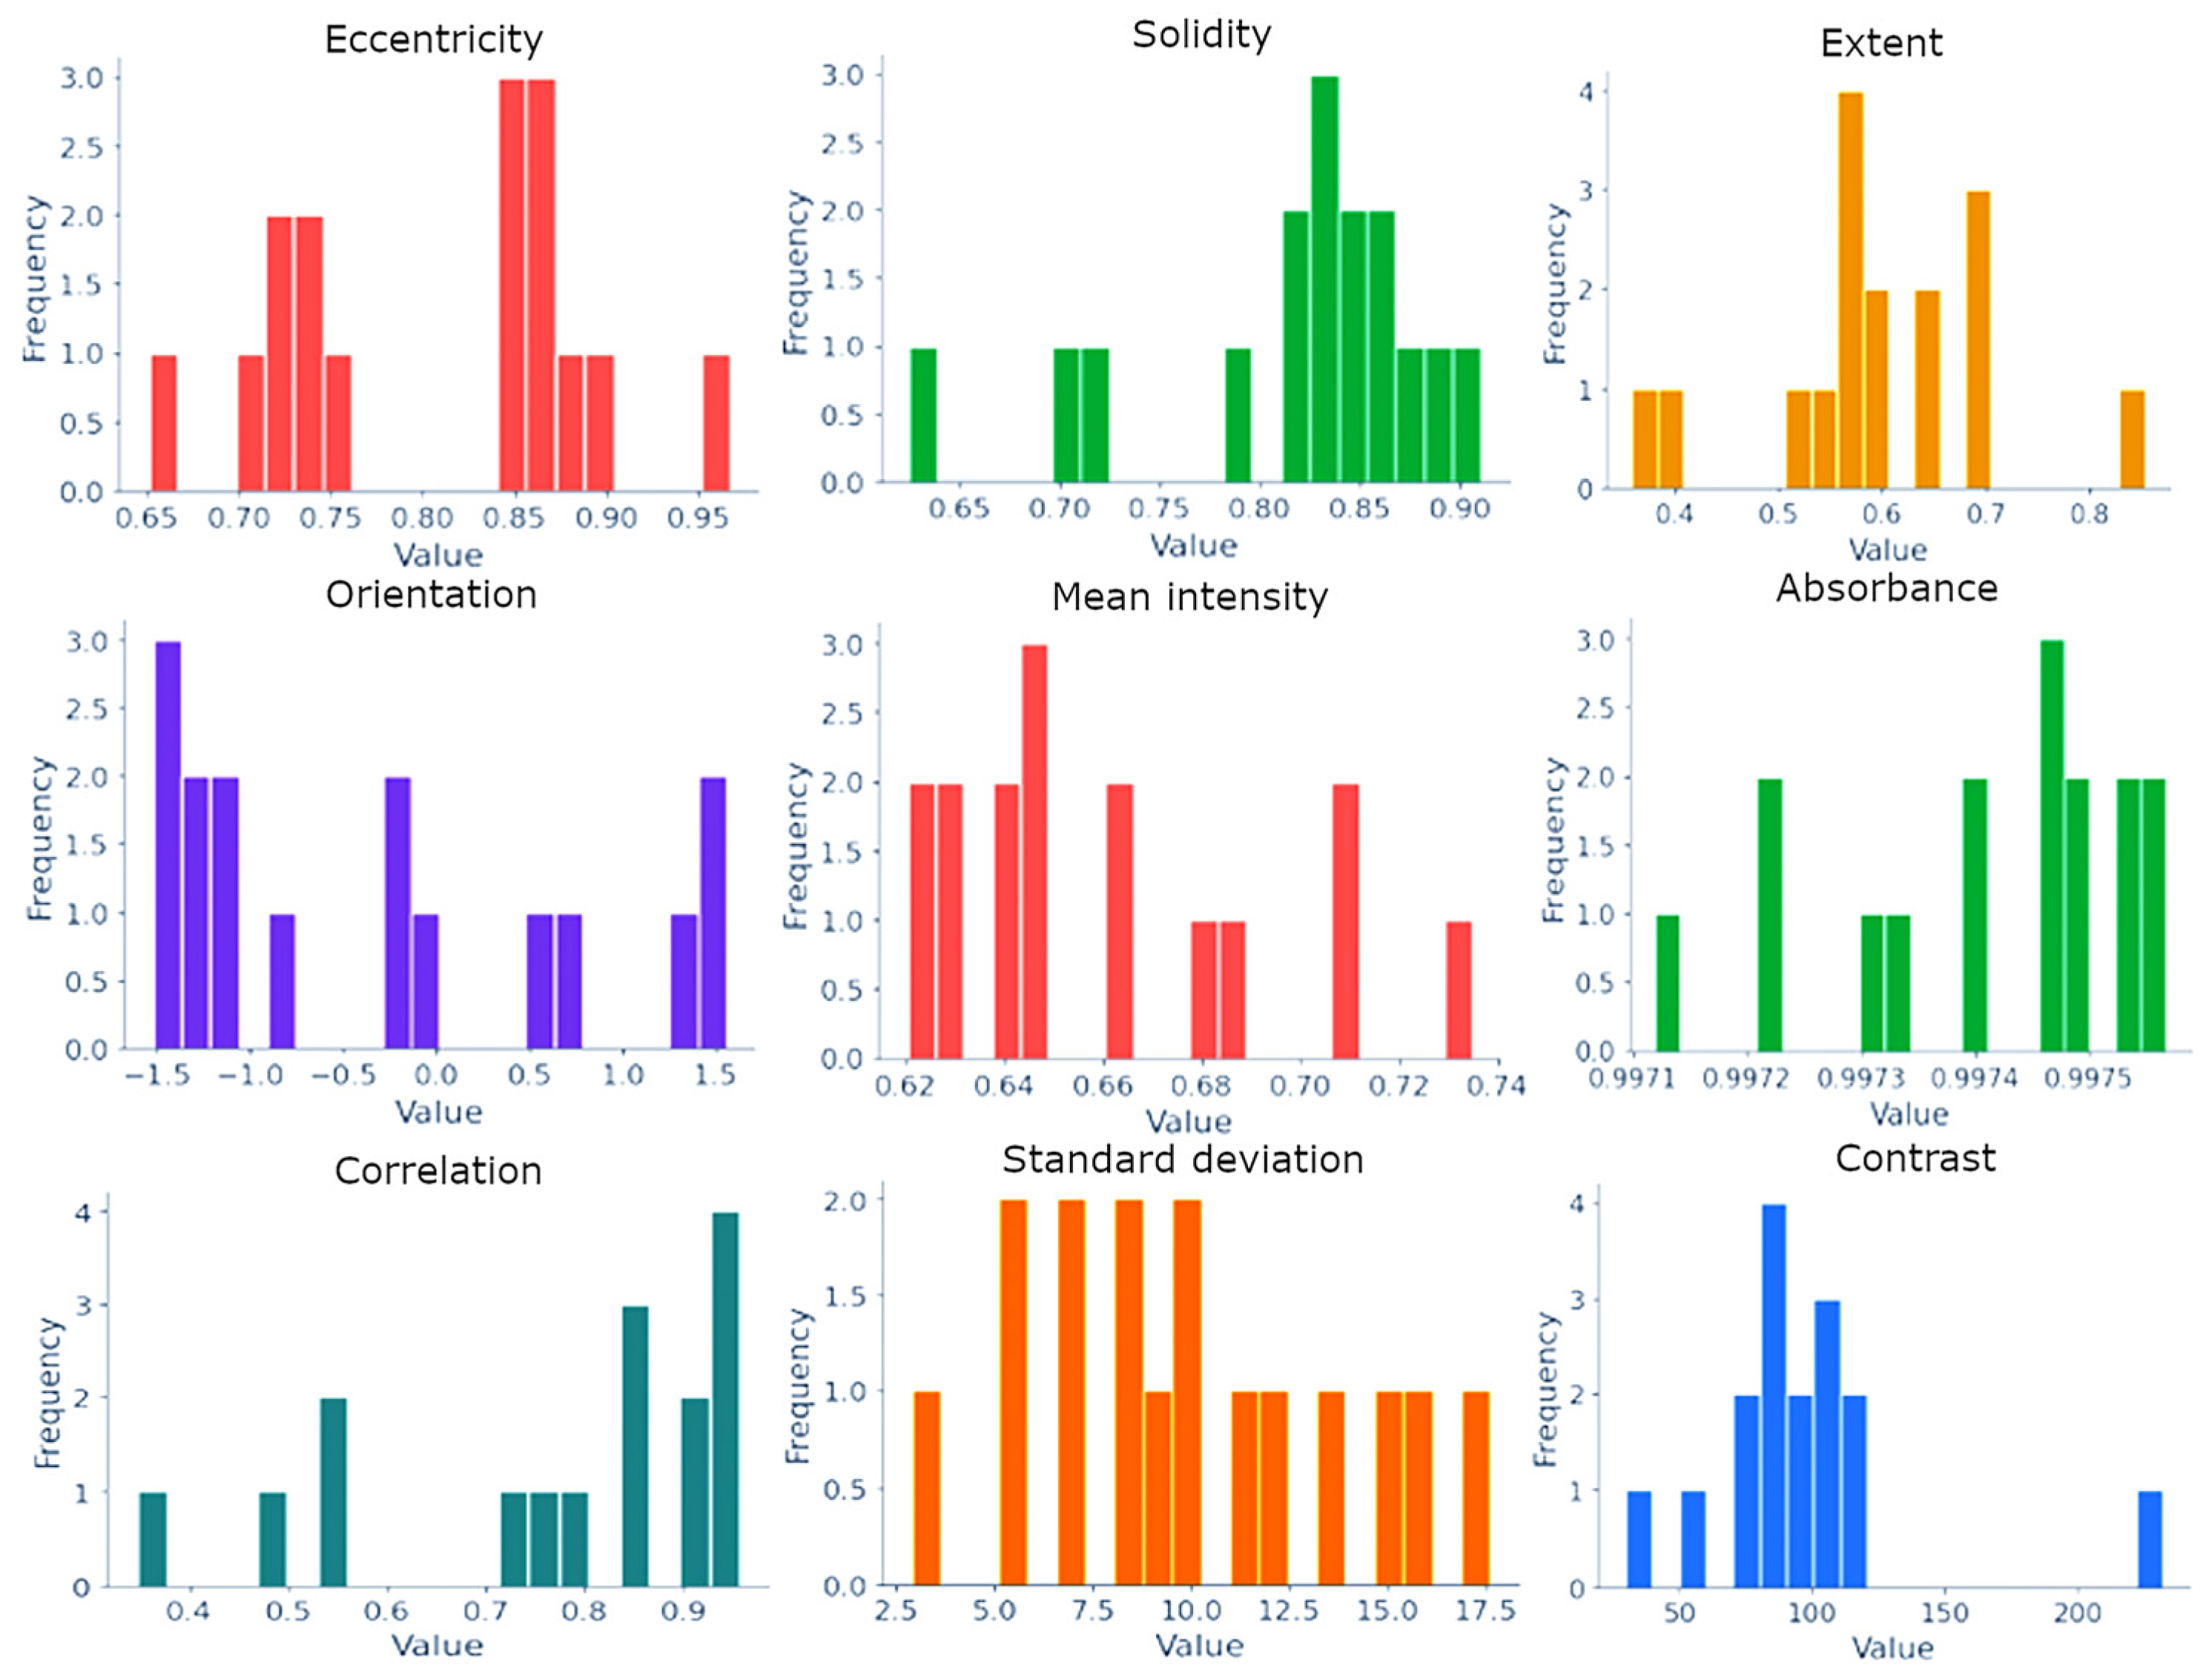
3.1. Analysis of the Subject Area and Data Collection
- Absence of affected cells. This is observed in cases where an image shows only healthy tissue.
- Pronounced mitotic growth process. This means that most of the tissue in an image, at 400× magnification, is filled with a malignant neoplasm (>70%). From the point of view of diagnosis, this system can inform a doctor about the active development of oncology, where cell mitosis turns into active invasion. From images that fall into this class, it is possible to programmatically isolate the contours of affected cells since it is assumed that there are many of them in these images. In turn, this provides more information for further cytological analysis.
- The beginning of the mitotic process/invasive growth. In general, these are situations where tumor cells and complexes are present in an image, but not many of them. At least at a magnification of 400×, healthy tissue should be visible. Also, these cases require additional analysis to detail tumorigenesis. Is this the initial stage of creating a cancer focus or the invasion of individual cells into the connective tissue?
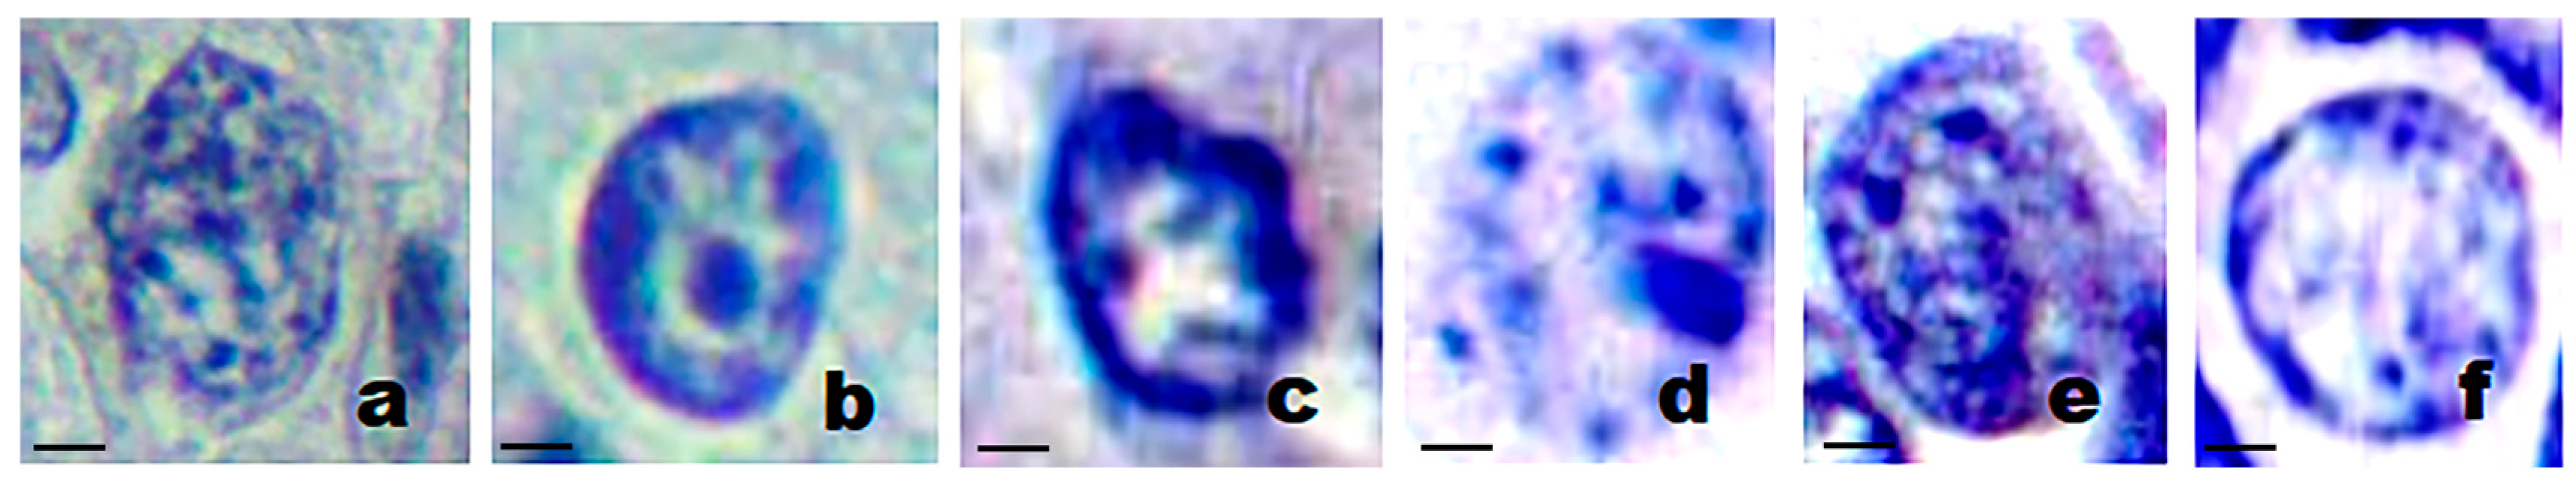
3.2. Nuclear Features of Breast Cancer
3.3. Analysis of Oncological Image Recognition Methods
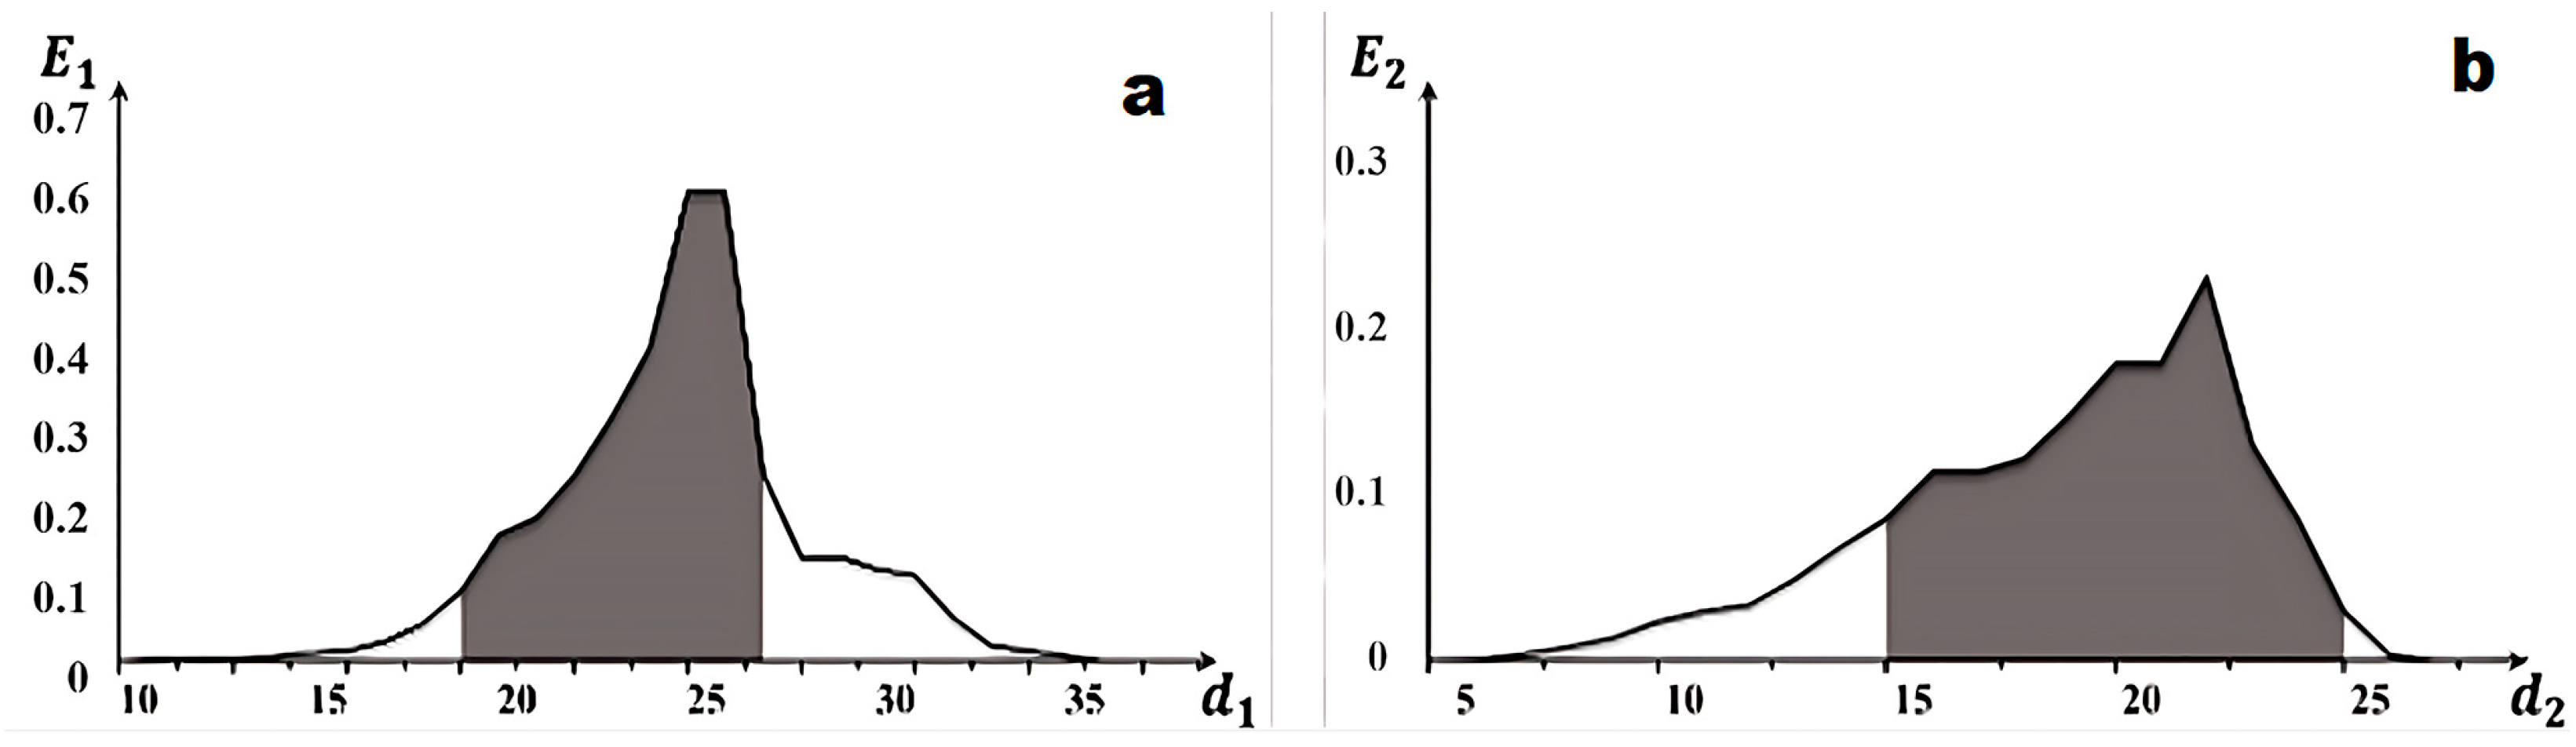
3.4. Recognition Method
3.5. The Workflow of the Image Recognition Algorithm
4. Discussion
5. Conclusions
Author Contributions
Funding
Institutional Review Board Statement
Informed Consent Statement
Data Availability Statement
Conflicts of Interest
References
- Ferlay, J.; Ervik, M.; Lam, F.; Laversanne, M.; Colombet, M.; Mery, L.; Piñeros, M.; Znaor, A.; Soerjomataram, I.; Bray, F. Global Cancer Observatory: Cancer Today. Lyon, France: International Agency for Research on Cancer, 2024. Available online: https://gco.iarc.who.int/today (accessed on 11 December 2024).
- Bray, F.; Ferlay, J.; Soerjomataram, I.; Siegel, R.L.; Torre, L.A.; Jemal, A. Global Cancer Statistics 2018: GLOBOCAN Estimates of Incidence and Mortality Worldwide for 36 Cancers in 185 Countries. CA Cancer J. Clin. 2018, 68, 394–424. [Google Scholar] [CrossRef] [PubMed]
- Bray, F.; Laversanne, M.; Sung, H.; Ferlay, J.; Siegel, R.L.; Soerjomataram, I.; Jemal, A. Global Cancer Statistics 2022: GLOBOCAN Estimates of Incidence and Mortality Worldwide for 36 Cancers in 185 Countries. CA Cancer J. Clin. 2024, 74, 229–263. [Google Scholar] [CrossRef]
- Bodewes, F.T.H.; van Asselt, A.A.; Dorrius, M.D.; Greuter, M.J.W.; de Bock, G.H. Mammographic Breast Density and the Risk of Breast Cancer: A Systematic Review and Meta-Analysis. Breast 2022, 66, 62–68. [Google Scholar] [CrossRef]
- Katsura, C.; Ogunmwonyi, I.; Kankam, H.K.; Saha, S. Breast Cancer: Presentation, Investigation and Management. Br. J. Hosp. Med. 2022, 83, 1–7. [Google Scholar] [CrossRef]
- Piddubnyi, A.; Kolomiiets, O.; Danilchenko, S.; Stepanenko, A.; Moskalenko, Y.; Moskalenko, R. The Prospects of Using Structural Phase Analysis of Microcalcifications in Breast Cancer Diagnostics. Diagnostics 2023, 13, 737. [Google Scholar] [CrossRef] [PubMed]
- Dimitriou, N.; Arandjelović, O.; Caie, P.D. Deep Learning for Whole Slide Image Analysis: An Overview. Front. Med. 2019, 6, 264. [Google Scholar] [CrossRef]
- Acs, B.; Rantalainen, M.; Hartman, J. Artificial Intelligence as the Next Step Towards Precision Pathology. J. Intern. Med. 2020, 288, 62–81. [Google Scholar] [CrossRef] [PubMed]
- Madabhushi, A.; Lee, G. Image Analysis and Machine Learning in Digital Pathology: Challenges and Opportunities. Med. Image Anal. 2016, 33, 170–175. [Google Scholar] [CrossRef]
- Ibrahim, A.; Gamble, P.; Jaroensri, R.; Abdelsamea, M.M.; Mermel, C.H.; Chen, P.C.; Rakha, E.A. Artificial Intelligence in Digital Breast Pathology: Techniques and Applications. Breast 2020, 49, 267–273. [Google Scholar] [CrossRef]
- Levine, A.B.; Schlosser, C.; Grewal, J.; Coope, R.; Jones, S.J.M.; Yip, S. Rise of the Machines: Advances in Deep Learning for Cancer Diagnosis. Trends Cancer 2019, 5, 157–169. [Google Scholar] [CrossRef]
- World Health Organization. Breast Tumours: WHO Classification of Tumours, 5th ed.; WHO Classification of Tumours Editorial Board: Geneva, Switzerland, 2019; Volume 2.
- Mathew, T.E. Breast Cancer Classification Using an Extreme Gradient Boosting Model with F-Score Feature Selection Technique. J. Adv. Inf. Technol. 2023, 14, 363–372. [Google Scholar] [CrossRef]
- Islam, T.; Hoque, E.; Ullah, M.; Islam, T.; Nishu, N.A.; Islam, R. CNN-based deep learning approach for classification of invasive ductal and metastasis types of breast carcinoma. Cancer Med. 2024, 13, e70069. [Google Scholar] [CrossRef] [PubMed]
- Han, L.; Yin, Z. A hybrid breast cancer classification algorithm based on meta-learning and artificial neural networks. Front. Oncol. 2022, 12, 1042964. [Google Scholar] [CrossRef]
- Uhler, C.; Shivashankar, G.V. Nuclear Mechanopathology and Cancer Diagnosis. Trends Cancer 2018, 4, 320–331. [Google Scholar] [CrossRef] [PubMed]
- Fuchs, T.J.; Buhmann, J.M.; Rohrbein, F. Preclinical evaluation of nuclear morphometry and tissue topology for breast carcinoma detection and margin assessment. PLoS ONE 2010, 5, e13653. [Google Scholar] [CrossRef]
- Lee, H.K.; Kim, C.H.; Bhattacharjee, S.; Park, H.G.; Prakash, D.; Choi, H.K. A Paradigm Shift in Nuclear Chromatin Interpretation: From Qualitative Intuitive Recognition to Quantitative Texture Analysis of Breast Cancer Cell Nuclei. Cytom. A 2021, 99, 698–706. [Google Scholar] [CrossRef]
- Tellez, D.; Annuscheit, J.; Benkert, P.; Van der Laak, J.; Litjens, G. Learning domain-invariant representations of histological images. Front. Med. 2019, 6, 162. [Google Scholar] [CrossRef]
- Atkinson, J.A.; Lobet, G.; Noll, M.; Meyer, P.E.; Griffiths, M.; Wells, D.M. Combining semi-automated image analysis techniques with machine learning algorithms to accelerate large-scale genetic studies. GigaScience 2017, 6, gix084. [Google Scholar] [CrossRef]
- Ucan, M.; Kaya, B.; Kaya, M.; Alhajj, R. Medical report generation from medical images using Vision Transformer and BART deep learning architectures. In Lecture Notes in Computer Science, Proceedings of the International Conference on Advances in Social Networks Analysis and Mining, Rende, Italy, 2–5 September 2024; Aiello, L.M., Chakraborty, T., Gaito, S., Eds.; Springer: Cham, Switzerland, 2025. [Google Scholar] [CrossRef]
- Yan, Y.; Lu, R.; Sun, J.; Zhang, J.; Zhang, Q. Breast cancer histopathology image classification using transformer with discrete wavelet transform. Med. Eng. Phys. 2025, 138, 104317. [Google Scholar] [CrossRef]
- Alwateer, M.; Bamaqa, A.; Farsi, M.; Aljohani, M.; Shehata, M.; Elhosseini, M.A. Transformative Approaches in Breast Cancer Detection: Integrating Transformers into Computer-Aided Diagnosis for Histopathological Classification. Bioengineering 2025, 12, 212. [Google Scholar] [CrossRef]
- Ucan, S.; Ucan, M.; Kaya, M. Deep Learning Based Approach with EfficientNet and SE Block Attention Mechanism for Multiclass Alzheimer’s Disease Detection. In Proceedings of the 2023 4th International Conference on Data Analytics for Business and Industry (ICDABI), Riffa, Bahrain, 25–26 October 2023; pp. 285–289. [Google Scholar] [CrossRef]
- Veta, M.; Pluim, J.P.; van Diest, P.J.; Viergever, M.A. Breast Cancer Histopathology Image Analysis: A Review. IEEE Trans. Biomed. Eng. 2014, 61, 1400–1411. [Google Scholar] [CrossRef] [PubMed]
- Singh, A.; Kumar, M.; Rani, A.; Yadav, S.K. A comparative assessment of machine learning algorithms with the Least Absolute Shrinkage and Selection Operator for breast cancer detection and prediction. Decis. Anal. J. 2023, 7, 100245. [Google Scholar] [CrossRef]
- Das, A.; Nair, M.S.; Peter, S.D. Computer-Aided Histopathological Image Analysis Techniques for Automated Nuclear Atypia Scoring of Breast Cancer: A Review. J. Digit. Imaging 2020, 33, 1091–1121. [Google Scholar] [CrossRef] [PubMed]
- Zhou, S.; Hu, C.; Wei, S.; Yan, X. Breast Cancer Prediction Based on Multiple Machine Learning Algorithms. Technol. Cancer Res. Treat. 2024, 23, 15330338241234791. [Google Scholar] [CrossRef]


| Type | Name | Description |
|---|---|---|
| Shape | Area | It may indicate the stage of cancer development and malignant cell growth. In most cases, a large area is characteristic of tumorous or hyperactive cells. |
| Eccentricity | Measures the ratio of the distance between the foci of a cell to the length of its major axis. The closer this indicator is to one, the more elliptical the cell shape, which approaches a straight line. | |
| Solidity | The ratio of the area of a cell to its perimeter. A low value may indicate an abnormal morphology or damage to the cell membrane. | |
| Extent | The ratio of the area of a cell to the area of its minimum describing rectangle. Indicates how compact an object is, and a low value indicates an abnormal cell shape. | |
| Orientation | The angle at which an object is directed. Can help understand the alignment and, possibly, the dynamics of cellular structures. | |
| Major and Minor Axis Lengths | Measurements of the major and minor axis lengths. Their ratio can help identify anomalies in the shape of an object. | |
| Elongation | Quantifies how elongated the shape of an object is and is calculated as the ratio of the length of the major axis to the length of the minor axis. | |
| Perimeter | The length of a cell’s outline. In some cases, it may indicate non-uniformity. | |
| Convex area | The ratio of a cell’s area to its convex area, which indicates the degree of contour protrusion. | |
| Circularity | Measures how close a cell’s shape is to a perfect circle. | |
| Texture | Mean intensity | The average pixel intensity in a cell region can help determine the structural and chemical properties of a tissue. |
| Absorbance | Measures the amount of light absorbed by a sample. In microscopy or medical imaging, absorbance can sometimes be measured by how much light is blocked or absorbed by an image region, which is often related to the density or thickness of the sample. | |
| Contrast | A measure of the differences in intensity between adjacent pixels. High contrast in a histological image may indicate significant structural changes in a tissue, such as fibrosis or proliferation. | |
| Dissimilarity | Reflects the differences between pixel values in a texture matrix. High values may indicate significant tissue heterogeneity, which is often found in tumor processes. | |
| Homogeneity | Indicates how close the pixel values in a texture matrix are to each other. Higher uniformity may indicate less aggressive or less altered tissues. | |
| Angular Second Moment (ASM) | A measure of texture uniformity that measures the squares of the values in a texture matrix. Higher ASM values indicate greater regularity and less textural complexity. | |
| Energy | The square root of ASM also reflects texture uniformity. A high energy score indicates greater regularity and texture uniformity. | |
| Correlation | Determines how linearly dependent pixels are on each other in a texture matrix. High correlation may indicate structural integration and orderliness in a tissue. | |
| Standard Deviation | Assesses the diversity of pixel intensity values in an area of interest. A high Standard Deviation may indicate tissue heterogeneity, which is typical of many pathologies. | |
| Histogram Peaks | Peaks in an intensity histogram may indicate the dominant intensity levels in a sample, which helps identify specific cellular components or structures. | |
| Histogram Valleys | Low points between peaks in a histogram may indicate the presence of different cell types or structures in a tissue. |
| Class | Nucleus Area (px2) | N/C Ratio | Circularity | Chromatin Entropy |
|---|---|---|---|---|
| Pathological | 3737.5 | 0.7075 | 0.6750 | 4.3875 |
| Normal | 2093.3 | 0.4833 | 0.8933 | 2.8567 |
Disclaimer/Publisher’s Note: The statements, opinions and data contained in all publications are solely those of the individual author(s) and contributor(s) and not of MDPI and/or the editor(s). MDPI and/or the editor(s) disclaim responsibility for any injury to people or property resulting from any ideas, methods, instructions or products referred to in the content. |
© 2025 by the authors. Licensee MDPI, Basel, Switzerland. This article is an open access article distributed under the terms and conditions of the Creative Commons Attribution (CC BY) license (https://creativecommons.org/licenses/by/4.0/).
Share and Cite
Savchenko, T.; Lakhtaryna, R.; Denysenko, A.; Dovbysh, A.; Coupland, S.E.; Moskalenko, R. An Information-Extreme Algorithm for Universal Nuclear Feature-Driven Automated Classification of Breast Cancer Cells. Diagnostics 2025, 15, 1389. https://doi.org/10.3390/diagnostics15111389
Savchenko T, Lakhtaryna R, Denysenko A, Dovbysh A, Coupland SE, Moskalenko R. An Information-Extreme Algorithm for Universal Nuclear Feature-Driven Automated Classification of Breast Cancer Cells. Diagnostics. 2025; 15(11):1389. https://doi.org/10.3390/diagnostics15111389
Chicago/Turabian StyleSavchenko, Taras, Ruslana Lakhtaryna, Anastasiia Denysenko, Anatoliy Dovbysh, Sarah E. Coupland, and Roman Moskalenko. 2025. "An Information-Extreme Algorithm for Universal Nuclear Feature-Driven Automated Classification of Breast Cancer Cells" Diagnostics 15, no. 11: 1389. https://doi.org/10.3390/diagnostics15111389
APA StyleSavchenko, T., Lakhtaryna, R., Denysenko, A., Dovbysh, A., Coupland, S. E., & Moskalenko, R. (2025). An Information-Extreme Algorithm for Universal Nuclear Feature-Driven Automated Classification of Breast Cancer Cells. Diagnostics, 15(11), 1389. https://doi.org/10.3390/diagnostics15111389