
Effect of Thyroxine Replacement Therapy on Serum Maresin 1 and NF-kB Levels in Patients with Hashimoto Thyroiditis


Abstract
1. Introduction
2. Materials and Methods
2.1. Measurement of Serum NF-kB and Maresin 1 with ELISA
2.2. Statistical Analysis
3. Results
4. Discussion
5. Conclusions
Author Contributions
Funding
Institutional Review Board Statement
Informed Consent Statement
Data Availability Statement
Conflicts of Interest
References
- Zheng, T.; Xu, C.; Mao, C.; Mou, X.; Wu, F.; Wang, X.; Bu, L.; Zhou, Y.; Luo, X.; Lu, Q.; et al. Increased Interleukin-23 in Hashimoto’s Thyroiditis Disease Induces Autophagy Suppression and Reactive Oxygen Species Accumulation. Front. Immunol. 2018, 9, 96. [Google Scholar] [CrossRef] [PubMed]
- Antonelli, A.; Ferrari, S.M.; Corrado, A.; Di Domenicantonio, A.; Fallahi, P. Autoimmune thyroid disorders. Autoimmun. Rev. 2015, 14, 174–180. [Google Scholar] [CrossRef] [PubMed]
- Zhou, R.; Yazdi, A.S.; Menu, P.; Tschopp, J. A role for mitochondria in NLRP3 inflammasome activation. Nature 2011, 469, 221–225. [Google Scholar] [CrossRef] [PubMed]
- Fortunato, R.S.; Ferreira, A.C.; Hecht, F.; Dupuy, C.; Carvalho, D.P. Sexual dimorphism and thyroid dysfunction: A matter of oxidative stress? J. Endocrinol. 2014, 221, R31-40. [Google Scholar] [CrossRef]
- Nakahira, K.; Haspel, J.A.; Rathinam, V.A.; Lee, S.J.; Dolinay, T.; Lam, H.C.; Englert, J.A.; Rabinovitch, M.; Cernadas, M.; Kim, H.P.; et al. Autophagy proteins regulate innate immune responses by inhibiting the release of mitochondrial DNA mediated by the NALP3 inflammasome. Nat. Immunol. 2011, 12, 222–230. [Google Scholar] [CrossRef]
- Celik, O.; Celik, E.; Turkcuoglu, I.; Yilmaz, E.; Ulas, M.; Simsek, Y.; Karaer, A.; Celik, N.; Aydin, N.E.; Ozerol, I.; et al. Surgical removal of endometrioma decreases the NF-kB1 (p50/105) and NF-kB p65 (Rel A) expression in the eutopic endometrium during the implantation window. Reprod. Sci. 2013, 20, 762–770. [Google Scholar] [CrossRef]
- Das, U.N. Infection, Inflammation, and Immunity in Sepsis. Biomolecules 2023, 13, 1332. [Google Scholar] [CrossRef]
- Li, X.; Abdel-Mageed, A.B.; Mondal, D.; Kandil, E. The nuclear factor kappa-B signaling pathway as a therapeutic target against thyroid cancers. Thyroid 2013, 23, 209–218. [Google Scholar] [CrossRef]
- Liu, Z.; Li, Z.; Yan, G.; Lin, C.; Luo, Y.; Ye, Y.; Zeng, X.; Yao, J. MIF promotes Th17 cell differentiation in Hashimoto’s thyroiditis by binding HVEM and activating NF-κB signaling pathway. Int. Immunopharmacol. 2023, 121, 110494. [Google Scholar] [CrossRef]
- Zheng, H.; Xu, J.; Chu, Y.; Jiang, W.; Yao, W.; Mo, S.; Song, X.; Zhou, J. A Global Regulatory Network for Dysregulated Gene Expression and Abnormal Metabolic Signaling in Immune Cells in the Microenvironment of Graves’ Disease and Hashimoto’s Thyroiditis. Front. Immunol. 2022, 13, 879824. [Google Scholar] [CrossRef]
- Saito-Sasaki, N.; Sawada, Y.; Nakamura, M. Maresin-1 and Inflammatory Disease. Int. J. Mol. Sci. 2022, 23, 1367. [Google Scholar] [CrossRef] [PubMed]
- Abdulnour, R.E.; Dalli, J.; Colby, J.K.; Krishnamoorthy, N.; Timmons, J.Y.; Tan, S.H.; Colas, R.A.; Petasis, N.A.; Serhan, C.N.; Levy, B.D. Maresin 1 biosynthesis during platelet-neutrophil interactions is organ-protective. Proc. Natl. Acad. Sci. USA 2014, 111, 16526–16531. [Google Scholar] [CrossRef] [PubMed]
- Chiurchiù, V.; Leuti, A.; Dalli, J.; Jacobsson, A.; Battistini, L.; Maccarrone, M.; Serhan, C.N. Proresolving lipid mediators resolvin D1, resolvin D2, and maresin 1 are critical in modulating T cell responses. Sci. Transl. Med. 2016, 8, 353ra111. [Google Scholar] [CrossRef]
- Bi, Y.; Chen, J.; Hu, F.; Liu, J.; Li, M.; Zhao, L. M2 Macrophages as a Potential Target for Antiatherosclerosis Treatment. Neural Plast. 2019, 2019, 6724903. [Google Scholar] [CrossRef]
- Yang, W.; Tao, K.; Zhang, P.; Chen, X.; Sun, X.; Li, R. Maresin 1 protects against lipopolysaccharide/d-galactosamine-induced acute liver injury by inhibiting macrophage pyroptosis and inflammatory response. Biochem. Pharmacol. 2022, 195, 114863. [Google Scholar] [CrossRef] [PubMed]
- Gu, Z.; Lamont, G.J.; Lamont, R.J.; Uriarte, S.M.; Wang, H.; Scott, D.A. Resolvin D1, resolvin D2 and maresin 1 activate the GSK3β anti-inflammatory axis in TLR4-engaged human monocytes. Innate Immun. 2016, 22, 186–195. [Google Scholar] [CrossRef]
- Ralli, M.; Angeletti, D.; Fiore, M.; D’Aguanno, V.; Lambiase, A.; Artico, M.; de Vincentiis, M.; Greco, A. Hashimoto’s thyroiditis: An update on pathogenic mechanisms, diagnostic protocols, therapeutic strategies, and potential malignant transformation. Autoimmun. Rev. 2020, 19, 102649. [Google Scholar] [CrossRef]
- Wu, J.; Li, X.Y.; Fang, X.; Teng, F.Y.; Xu, Y. Decreased Serum Maresin 1 Concentration Is Associated with Postmenopausal Osteoporosis: A Cross-Sectional Study. Front. Med. 2021, 8, 759825. [Google Scholar] [CrossRef]
- Friedewald, W.T.; Levy, R.I.; Fredrickson, D.S. Estimation of the concentration of low-density lipoprotein cholesterol in plasma, without use of the preparative ultracentrifuge. Clin. Chem. 1972, 18, 499–502. [Google Scholar] [CrossRef]
- Wei, T.; Simko, V. “Corrplot”: Visualization of a Correlation Matrix 0.95. [R Package]. Available online: https://cran.r-project.org/web/packages/corrplot/corrplot.pdf (accessed on 8 February 2025).
- Rose, N.R.; Witebsky, E. Studies on organ specificity. V. Changes in the thyroid glands of rabbits following active immunization with rabbit thyroid extracts. J. Immunol. 1956, 76, 417–427. [Google Scholar] [CrossRef]
- Doniach, D. How autoimmunity was discovered; reminiscences of an autoimmunologist. In Autoimmunity and the Thyroid; Walfsh, P., Wall, J.R., Volpé, R., Eds.; Academic Press: New York, NY, USA, 1985; pp. 1–8. [Google Scholar]
- Massolt, E.T.; Meima, M.E.; Swagemakers, S.M.A.; Leeuwenburgh, S.; van den Hout-van Vroonhoven, M.C.G.M.; Brigante, G.; Kam, B.L.R.; van der Spek, P.J.; van IJcken, W.F.J.; Visser, T.J.; et al. Thyroid State Regulates Gene Expression in Human Whole Blood. J. Clin. Endocrinol. Metab. 2018, 103, 169–178. [Google Scholar] [CrossRef] [PubMed]
- Jonklaas, J.; Bianco, A.C.; Bauer, A.J.; Burman, K.D.; Cappola, A.R.; Celi, F.S.; Cooper, D.S.; Kim, B.W.; Peeters, R.P.; Rosenthal, M.S.; et al. Guidelines for the treatment of hypothyroidism: Prepared by the american thyroid association task force on thyroid hormone replacement. Thyroid 2014, 24, 1670–1751. [Google Scholar] [CrossRef] [PubMed]
- Klubo-Gwiezdzinska, J.; Wartofsky, L. Hashimoto thyroiditis: An evidence-based guide to etiology, diagnosis and treatment. Pol. Arch. Intern. Med. 2022, 132, 16222. [Google Scholar] [CrossRef] [PubMed]
- Ragusa, F.; Fallahi, P.; Elia, G.; Gonnella, D.; Paparo, S.R.; Giusti, C.; Churilov, L.P.; Ferrari, S.M.; Antonelli, A. Hashimotos’ thyroiditis: Epidemiology, pathogenesis, clinic and therapy. Best. Pract. Res. Clin. Endocrinol. Metab. 2019, 33, 101367. [Google Scholar] [CrossRef]
- Szczuko, M.; Syrenicz, A.; Szymkowiak, K.; Przybylska, A.; Szczuko, U.; Pobłocki, J.; Kulpa, D. Doubtful Justification of the Gluten-Free Diet in the Course of Hashimoto’s Disease. Nutrients 2022, 14, 1727. [Google Scholar] [CrossRef]
- Ke, W.; Sun, T.; Zhang, Y.; He, L.; Wu, Q.; Liu, J.; Zha, B. 25-Hydroxyvitamin D serum level in Hashimoto’s thyroiditis, but not Graves’ disease is relatively deficient. Endocr. J. 2017, 64, 581–587. [Google Scholar] [CrossRef]
- Song, J.; Sun, R.; Zhang, Y.; Ke, J.; Zhao, D. Serum resolvin E1 levels and its relationship with thyroid autoimmunity in Hashimoto’s thyroiditis: A preliminary study. BMC Endocr. Disord. 2021, 21, 66. [Google Scholar] [CrossRef]
- Szczuko, M.; Kacprzak, J.; Przybylska, A.; Szczuko, U.; Pobłocki, J.; Syrenicz, A.; Drozd, A. The Influence of an Anti-Inflammatory Gluten-Free Diet with EPA and DHA on the Involvement of Maresin and Resolvins in Hashimoto’s Disease. Int. J. Mol. Sci. 2024, 25, 11692. [Google Scholar] [CrossRef]

| Parameter. | HT Plus TRT (Group 1; n = 30) | HT Without TRT (Group 2; n = 30) | Control Group (n = 30) | p-Value |
|---|---|---|---|---|
| Age (years) | 31.6 ± 4.00 | 29.3 ± 3.96 | 30.7 ± 4.92 | 0.114 ‡ |
| Gender (male/female) | 5 (16.7%) 25 (83.3%) | 4 (13.3%) 26 (86.7%) | 6 (20.0%) 24 (80.0%) | 0.787 ‡‡‡ |
| Body Mass Index (kg/m2) | 24.9 (24.0–25.8) | 24.9 (23.6–26.1) | 24.3 (23.0–25.3) | 0.380 ‡‡ |
| NF-κB (ng/mL) | 9.31 (8.27–9.88) **, ## | 4.48 (2.78–8.05) * | 2.77 (2.29–3.70) | <0.001 ‡‡ |
| Maresin 1 (pg/mL) | 210 (168–263) **, ## | 302 (248–416) ** | 462 (415–577) | <0.001 ‡‡ |
| 25(OH)D (ng/mL) | 13.6 ± 3.51 ** | 15.9 ± 5.54 * | 20.6 ± 6.63 | <0.001 ‡ |
| TPOAb (U/mL) | 700 (440–845) ** | 706 (250–805) ** | 5.54 (3.96–10.7) | <0.001 ‡‡ |
| TSH (µIU/mL) | 3.46 (2.53–5.80) * | 5.95 (2.51–8.30) ** | 2.54 (1.66–2.89) | <0.001 ‡‡ |
| FT4 (ng/dL) | 1.11 ± 0.14 | 0.96 ± 0.31 * | 1.16 ± 0.17 | 0.002 ‡ |
| FT3 (pg/mL) | 2.95 ± 0.41 | 2.67 ± 0.55 * | 3.06 ± 0.34 | 0.004 ‡ |
| Glucose (mg/dL) | 95.0 (90.0–100) | 92.0 (87.0–99.0) | 91.5 (86.0–98.0) | 0.201 ‡‡ |
| Urea (mg/dL) | 26.2 ± 6.78 | 26.0 ± 8.21 | 24.1 ± 7.40 | 0.500 ‡ |
| Creatinine (mg/dL) | 0.70 (0.60–0.80) | 0.65 (0.60–0.70) | 0.61 (0.60–0.70) | 0.182 ‡‡ |
| ALT (IU/L) | 15.0 (13.0–23.0) | 14.5 (12.0–19.0) | 17.0 (15.0–20.0) | 0.175 ‡‡ |
| AST (IU/L) | 20.0 (18.0–24.0) | 21.5 (17.0–24.0) | 19.0 (17.0–24.0) | 0.935 ‡‡ |
| TC (mg/dL) | 178 (148–205) | 174 (158–195) | 179 (161–207) | 0.999 ‡‡ |
| HDL-C (mg/dL) | 52.3 ± 16.1 | 55.7 ± 14.6 | 58.1 ± 15.4 | 0.350 ‡ |
| LDL-C (mg/dL) | 99.5 (88.0–127) | 97.5 (82.0–114) | 101 (80.0–127) | 0.806 ‡‡ |
| Triglycerides (mg/dL) | 108 (81.0–152) | 101 (65.0–135) | 93.5 (71.0–137) | 0.694 ‡‡ |
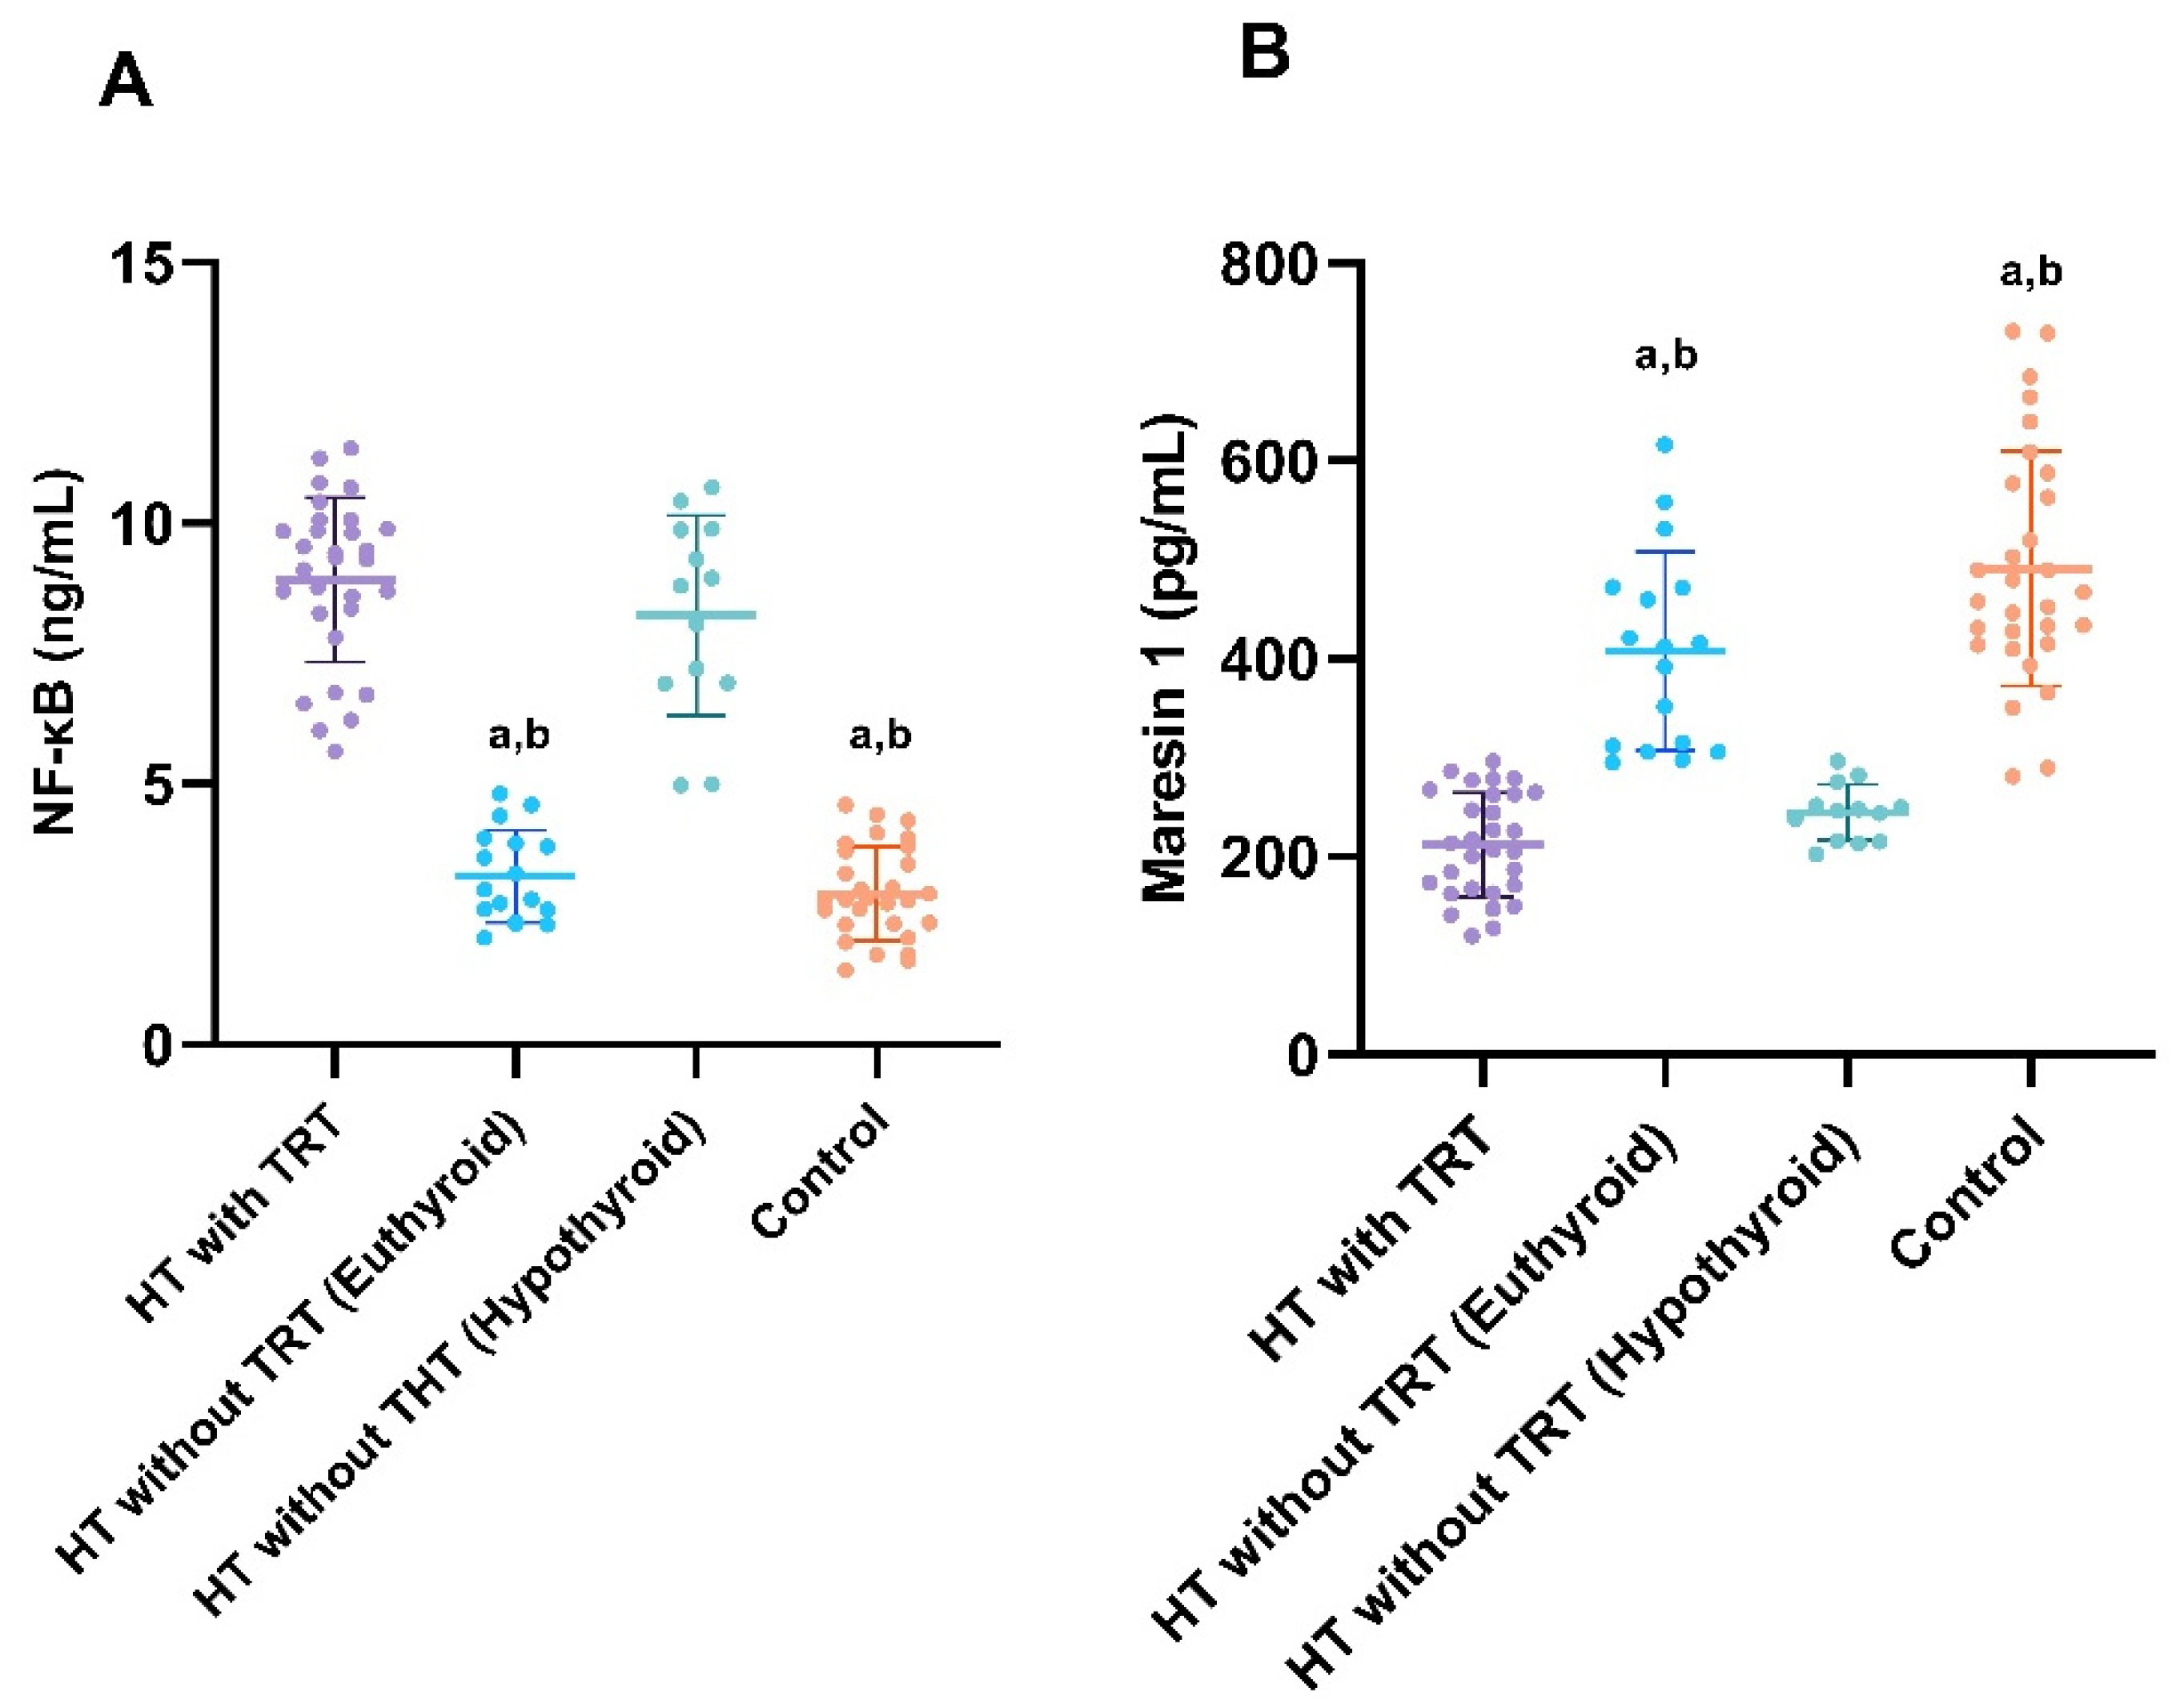
| HT with TRT (Group 1; n = 30) | HT Without TRT (Group 2; n = 30) | Control (n = 30) | p-Value | ||
|---|---|---|---|---|---|
| Euthyroid HT (n = 17) | Hypothyroid HT (n = 13) | ||||
| TSH (µIU/mL) | 3.46 (2.53–5.80) d | 2.57 (2.11–3.93) a | 8.34 (7.84–8.85) | 2.54 (1.66–2.89) a,e | p < 0.001 ‡‡ |
| FT4 (ng/dL) | 1.11 (1.02–1.19) a | 1.21 (1.03–1.35) a | 0.68 (0.60–0.78) | 1.14 (1.05–1.24) a | p < 0.001 ‡‡ |
| FT3 (pg/mL) | 3.04 (2.81–3.25) a | 3.18 (2.90–3.30) a | 2.15 (2.04–2.29) | 3.10 (2.89–3.34) a | p < 0.001 ‡‡ |
| TPOAb (U/mL) | 700 (440–845) | 279 (230–363) a,e | 819 (775–961) | 5.54 (3.96–10.7) a,b,c | p < 0.001 ‡‡ |
| NF-κB (ng/mL) | 8.91 ± 1.57 | 3.23 ± 0.88 a,b | 8.23 ± 1.91 | 2.88 ± 0.90 a,b | p < 0.001 ‡ |
| Maresin 1 (pg/mL) | 212 ± 52.5 | 408 ± 99.8 a,b | 245 ± 28.4 | 491 ± 119 a,b | p < 0.001 ‡ |
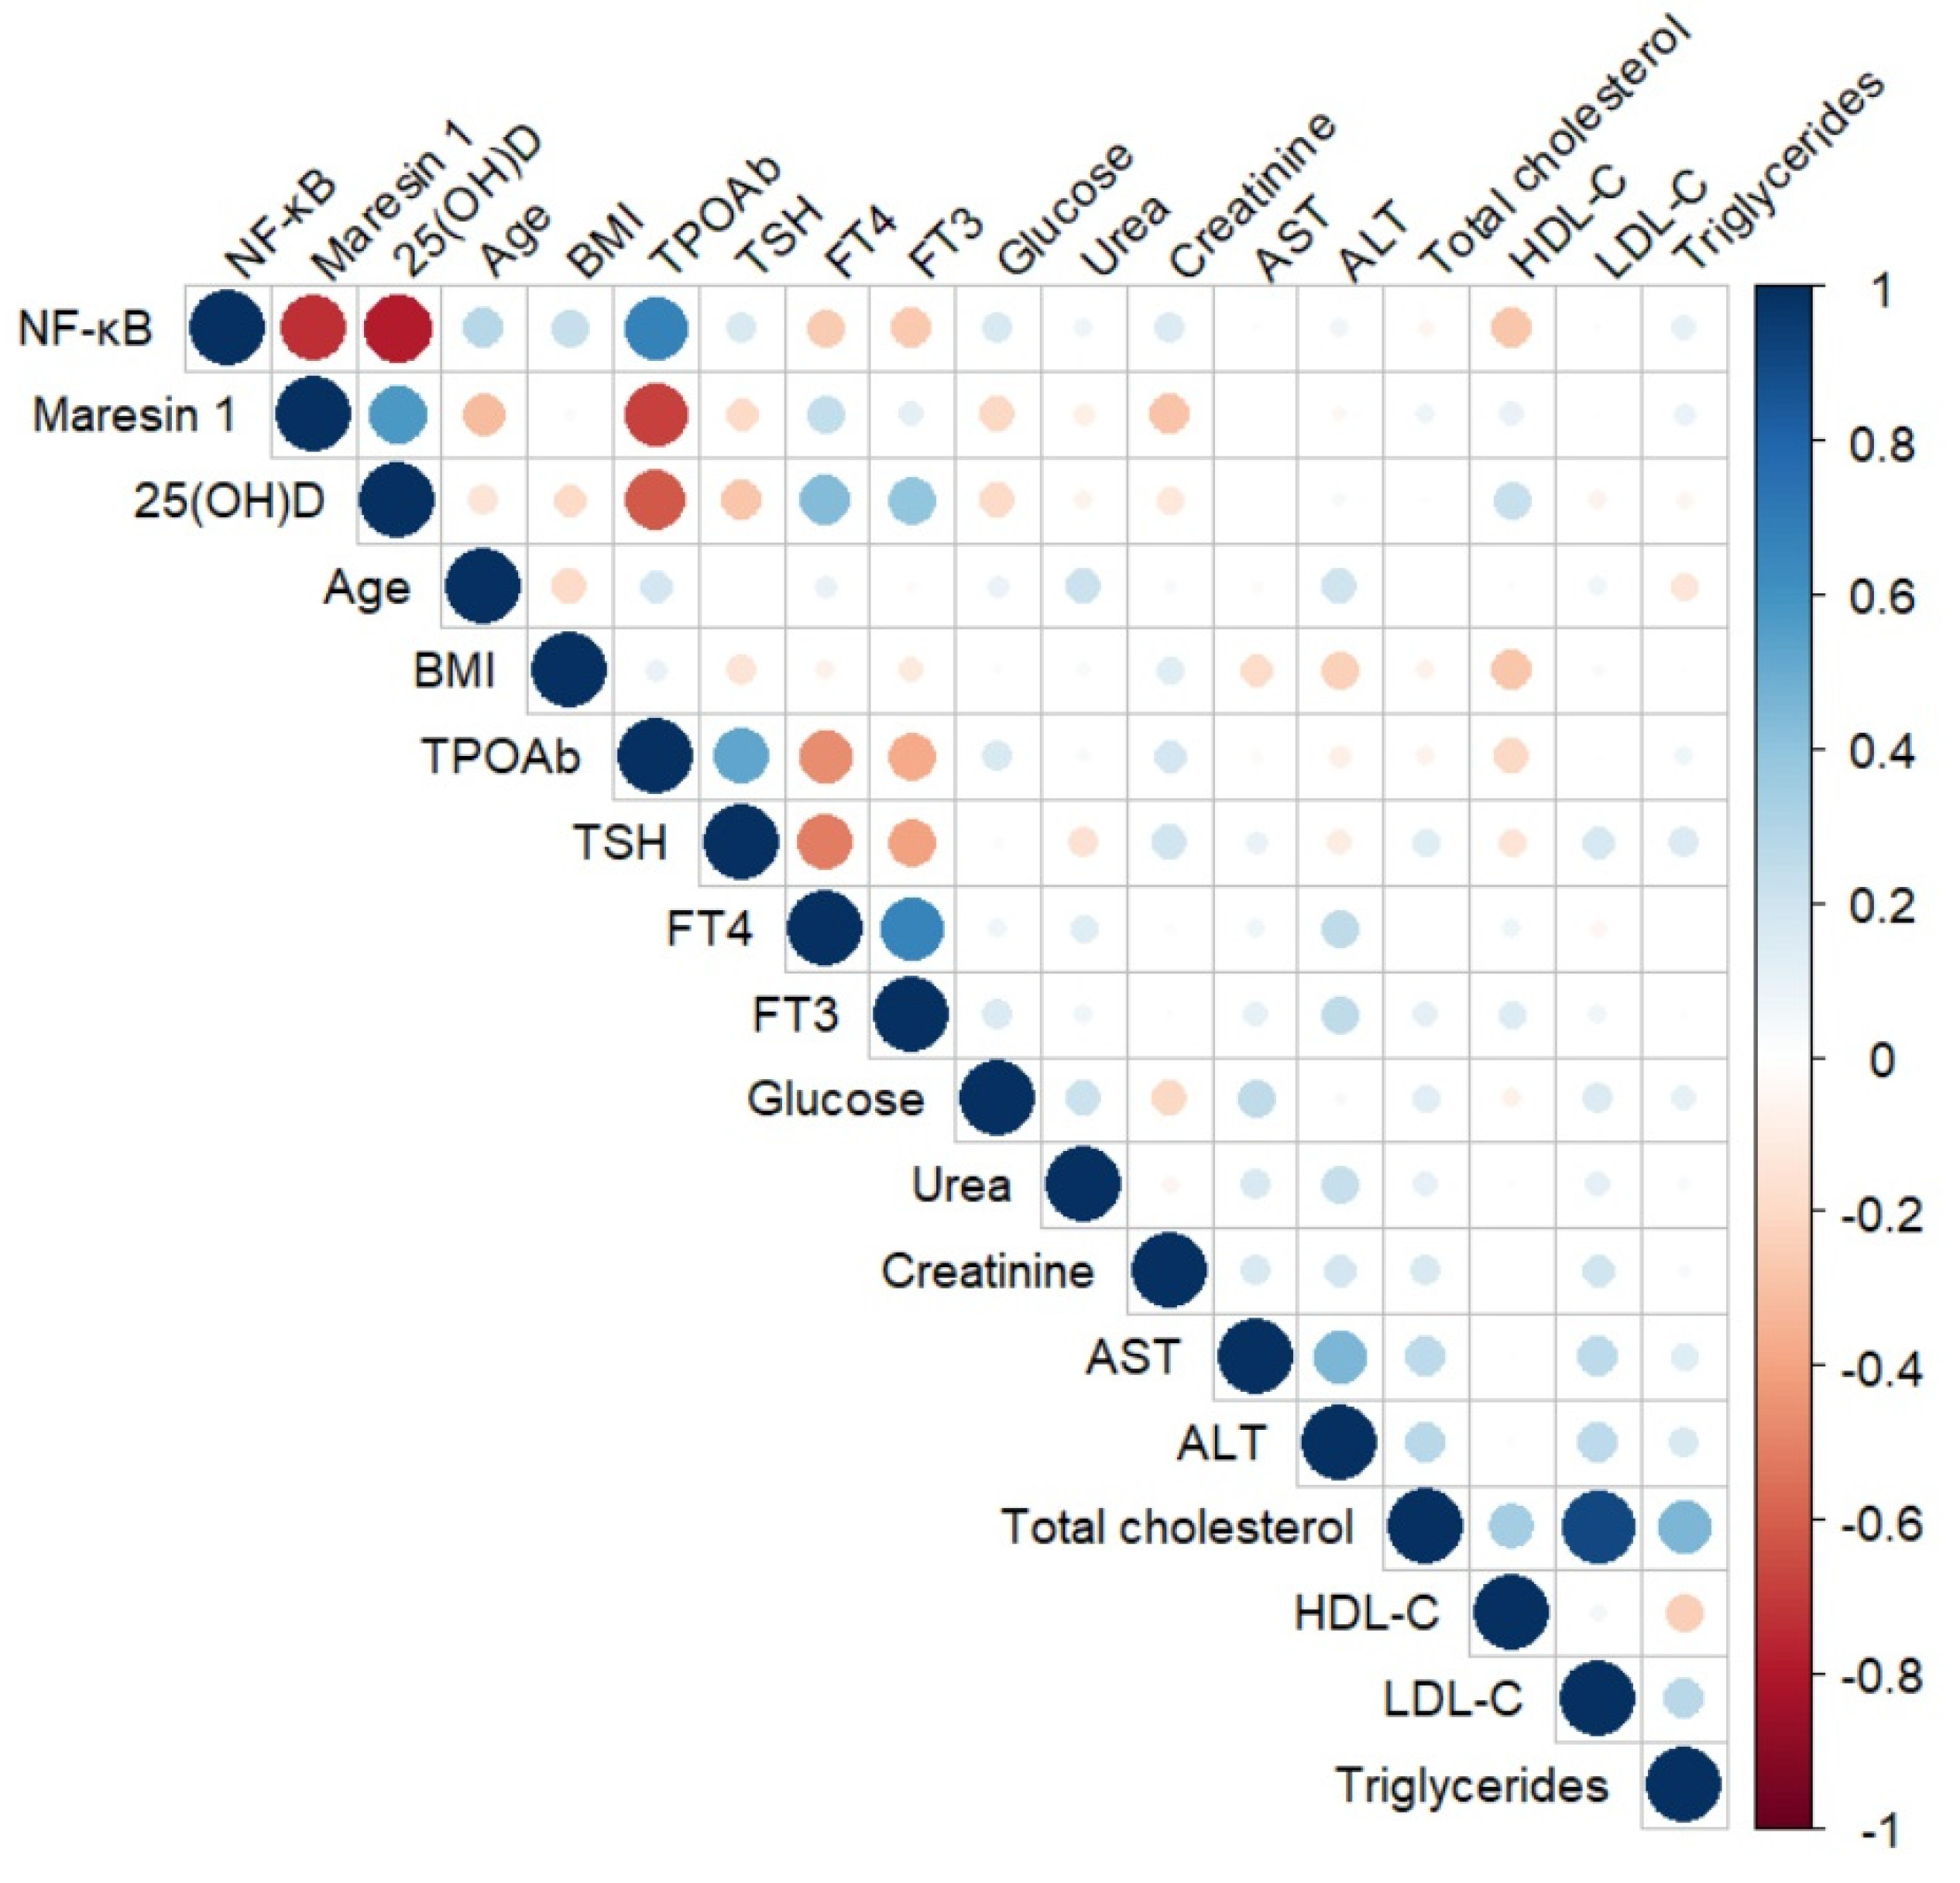
| Parameters | NF-κB | Maresin 1 | |
|---|---|---|---|
| NF-κB (ng/mL) | r | - | −0.729 |
| p | - | <0.001 | |
| 25(OH)D (ng/mL) | r | −0.795 | 0.530 |
| p | <0.001 | <0.001 | |
| Age (years) | r | 0.283 | −0.296 |
| p | 0.028 | 0.022 | |
| Body Mass Index (kg/m2) | r | 0.199 | −0.030 |
| p | 0.127 | 0.819 | |
| TPOAb (U/mL) | r | 0.677 | −0.634 |
| p | <0.001 | <0.001 | |
| TSH (µIU/mL) | r | 0.174 | −0.144 |
| p | 0.184 | 0.272 | |
| FT4 (ng/dL) | r | −0.265 | 0.217 |
| p | 0.041 | 0.096 | |
| FT3 (pg/mL) | r | −0.319 | 0.178 |
| p | 0.013 | 0.173 | |
| Glucose (mg/dL) | r | 0.139 | −0.273 |
| p | 0.288 | 0.035 | |
| Urea (mg/dL) | r | 0.115 | −0.138 |
| p | 0.383 | 0.291 | |
| Creatinine (mg/dL) | r | 0.160 | −0.330 |
| p | 0.221 | 0.010 | |
| AST (IU/L) | r | 0.003 | −0.129 |
| p | 0.979 | 0.326 | |
| ALT (IU/L) | r | 0.038 | −0.111 |
| p | 0.773 | 0.397 | |
| TC (mg/dL) | r | −0.034 | 0.078 |
| p | 0.795 | 0.556 | |
| HDL-C (mg/dL) | r | −0.315 | 0.126 |
| p | 0.014 | 0.339 | |
| LDL-C (mg/dL) | r | 0.060 | −0.023 |
| p | 0.649 | 0.862 | |
| Triglycerides (mg/dL) | r | 0.124 | 0.046 |
| p | 0.345 | 0.725 |
Disclaimer/Publisher’s Note: The statements, opinions and data contained in all publications are solely those of the individual author(s) and contributor(s) and not of MDPI and/or the editor(s). MDPI and/or the editor(s) disclaim responsibility for any injury to people or property resulting from any ideas, methods, instructions or products referred to in the content. |
© 2025 by the authors. Licensee MDPI, Basel, Switzerland. This article is an open access article distributed under the terms and conditions of the Creative Commons Attribution (CC BY) license (https://creativecommons.org/licenses/by/4.0/).
Share and Cite
Yardim, M.; Deniz, L.; Saltabas, M.A.; Celik, N. Effect of Thyroxine Replacement Therapy on Serum Maresin 1 and NF-kB Levels in Patients with Hashimoto Thyroiditis. Diagnostics 2025, 15, 1248. https://doi.org/10.3390/diagnostics15101248
Yardim M, Deniz L, Saltabas MA, Celik N. Effect of Thyroxine Replacement Therapy on Serum Maresin 1 and NF-kB Levels in Patients with Hashimoto Thyroiditis. Diagnostics. 2025; 15(10):1248. https://doi.org/10.3390/diagnostics15101248
Chicago/Turabian StyleYardim, Meltem, Levent Deniz, Mehmet Akif Saltabas, and Nilufer Celik. 2025. "Effect of Thyroxine Replacement Therapy on Serum Maresin 1 and NF-kB Levels in Patients with Hashimoto Thyroiditis" Diagnostics 15, no. 10: 1248. https://doi.org/10.3390/diagnostics15101248
APA StyleYardim, M., Deniz, L., Saltabas, M. A., & Celik, N. (2025). Effect of Thyroxine Replacement Therapy on Serum Maresin 1 and NF-kB Levels in Patients with Hashimoto Thyroiditis. Diagnostics, 15(10), 1248. https://doi.org/10.3390/diagnostics15101248