

Benefits of Liver Volume and Serum Zinc Level Assessment for the Screening of Covert Hepatic Encephalopathy in Patients with Child–Pugh Class A Cirrhosis

 , and
, and
Abstract
1. Introduction
2. Materials and Methods
2.1. Study Design
2.2. Assessment of Liver Volume
2.3. CHE Diagnosis
2.4. Statistical Analyses
3. Results
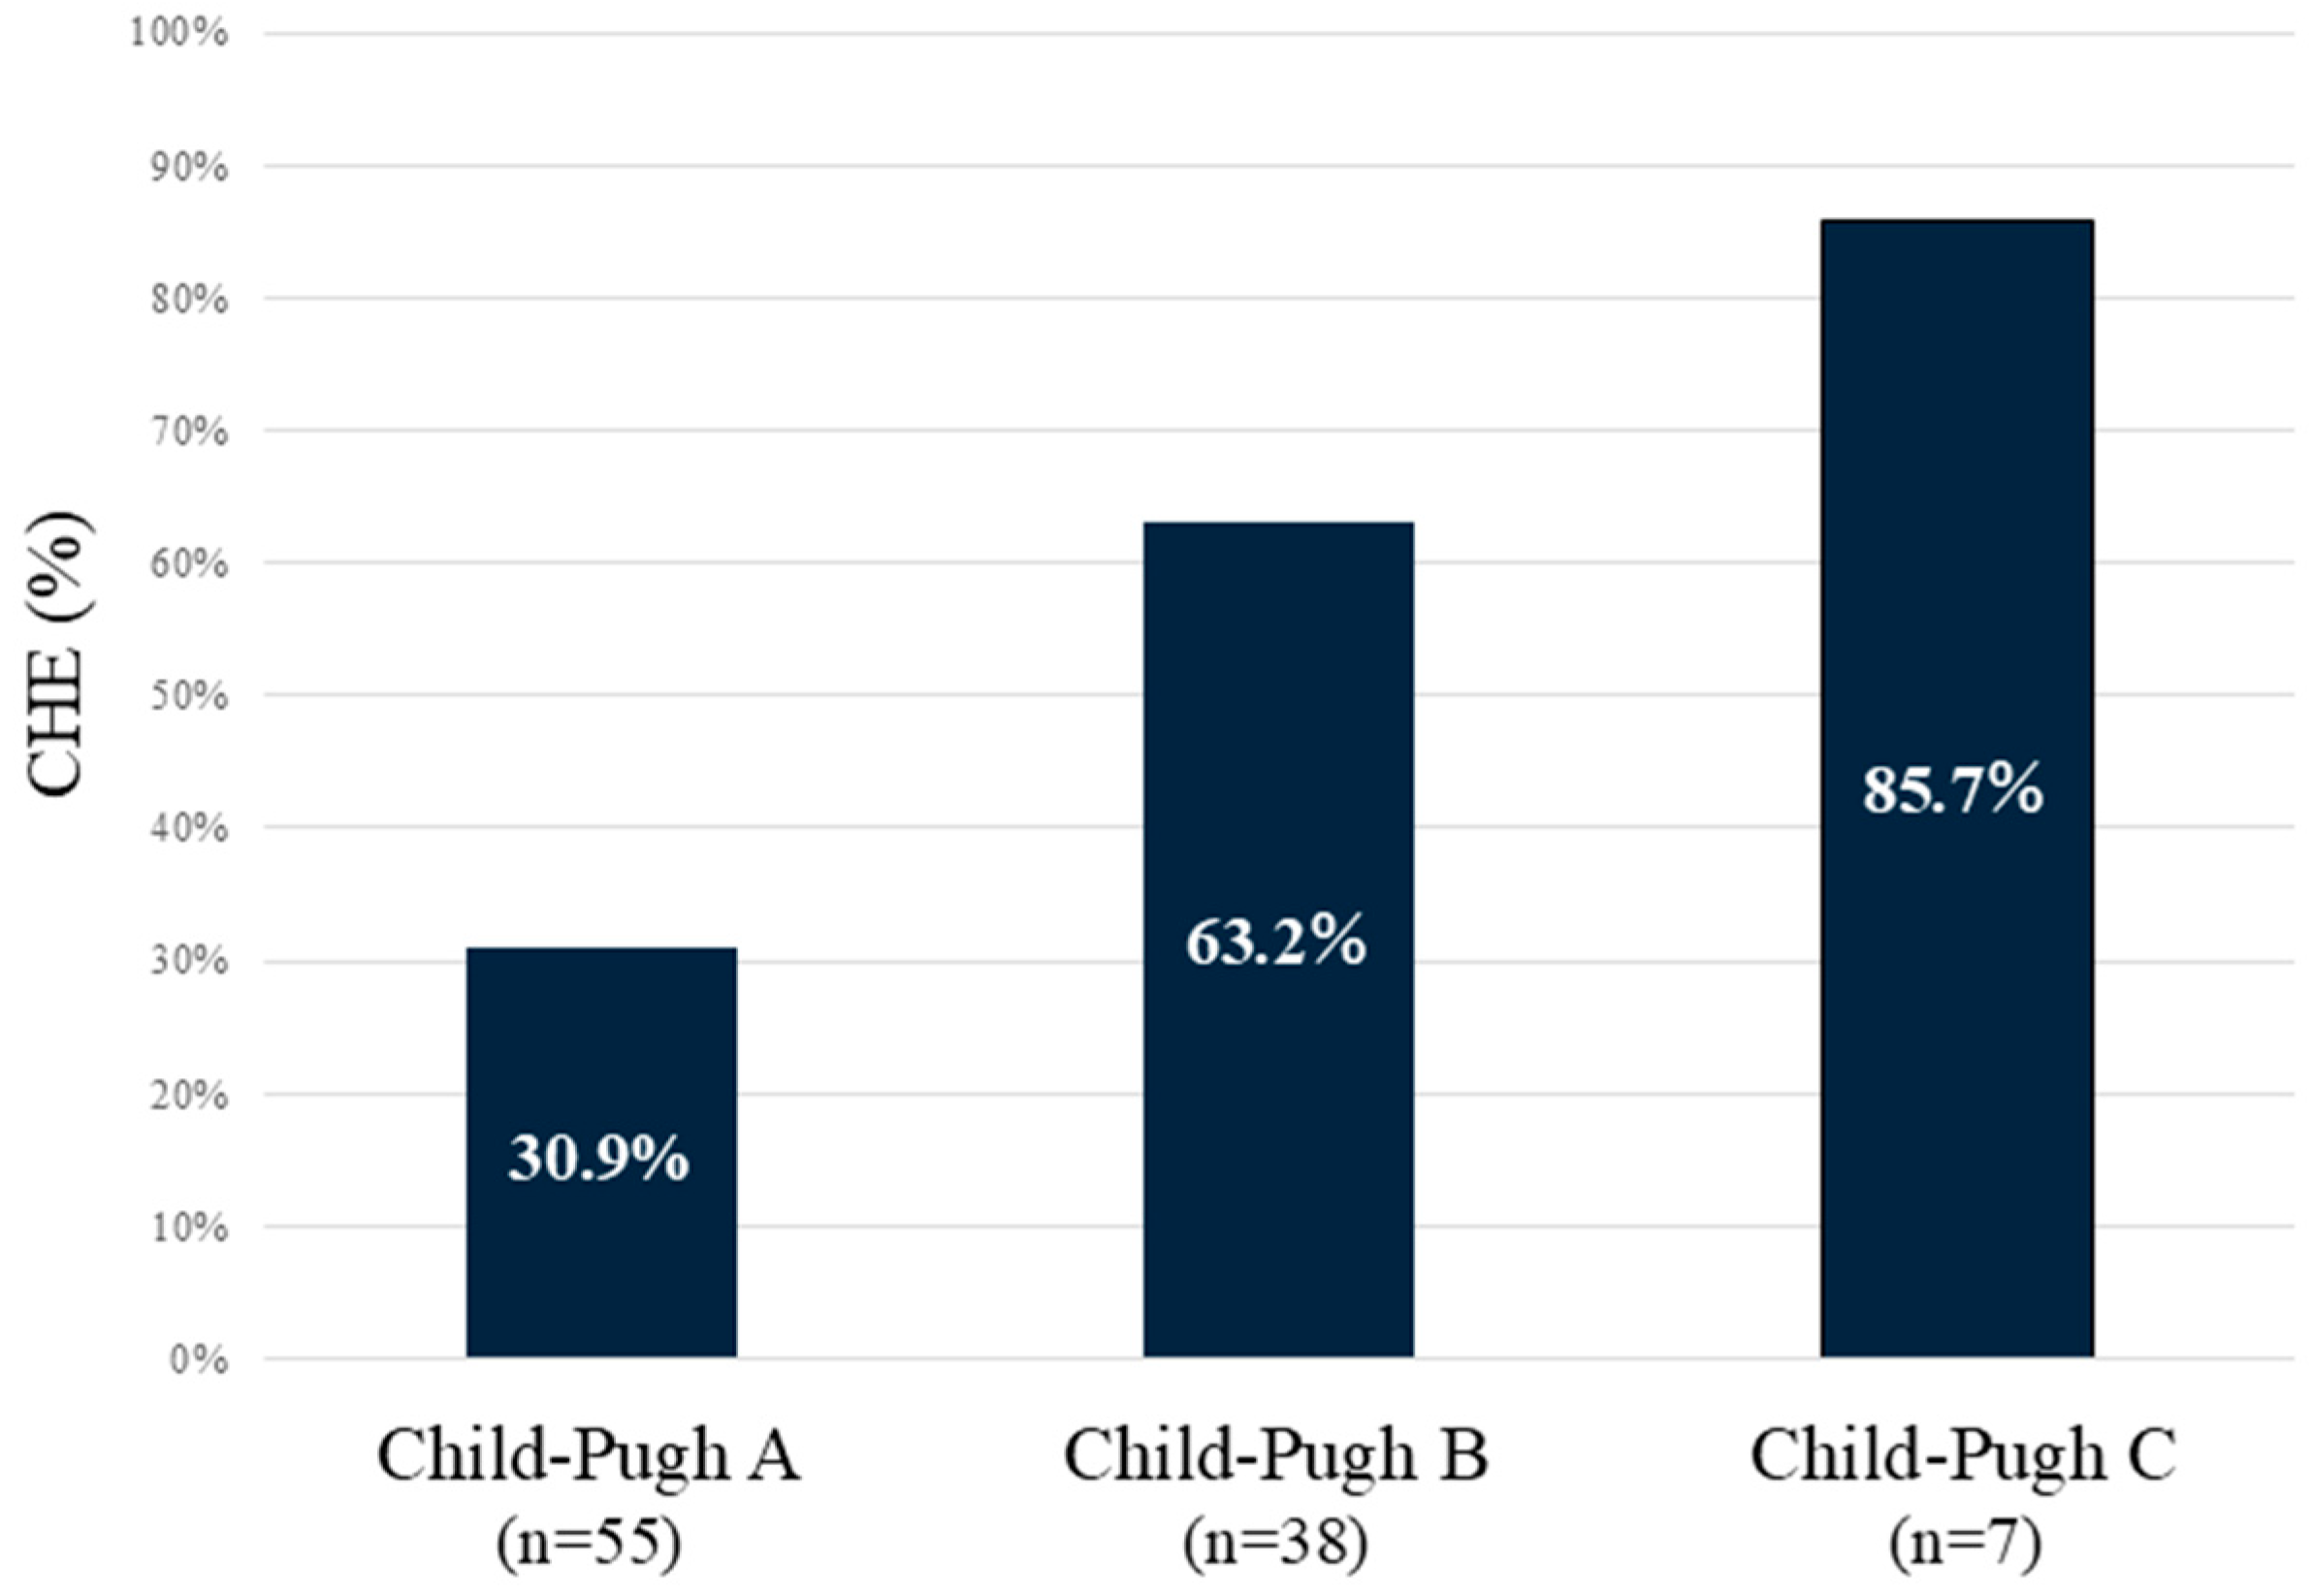
3.1. CHE Correlates with Liver Functional Reserve
3.2. Association Between Alcohol Consumption and Liver Volume
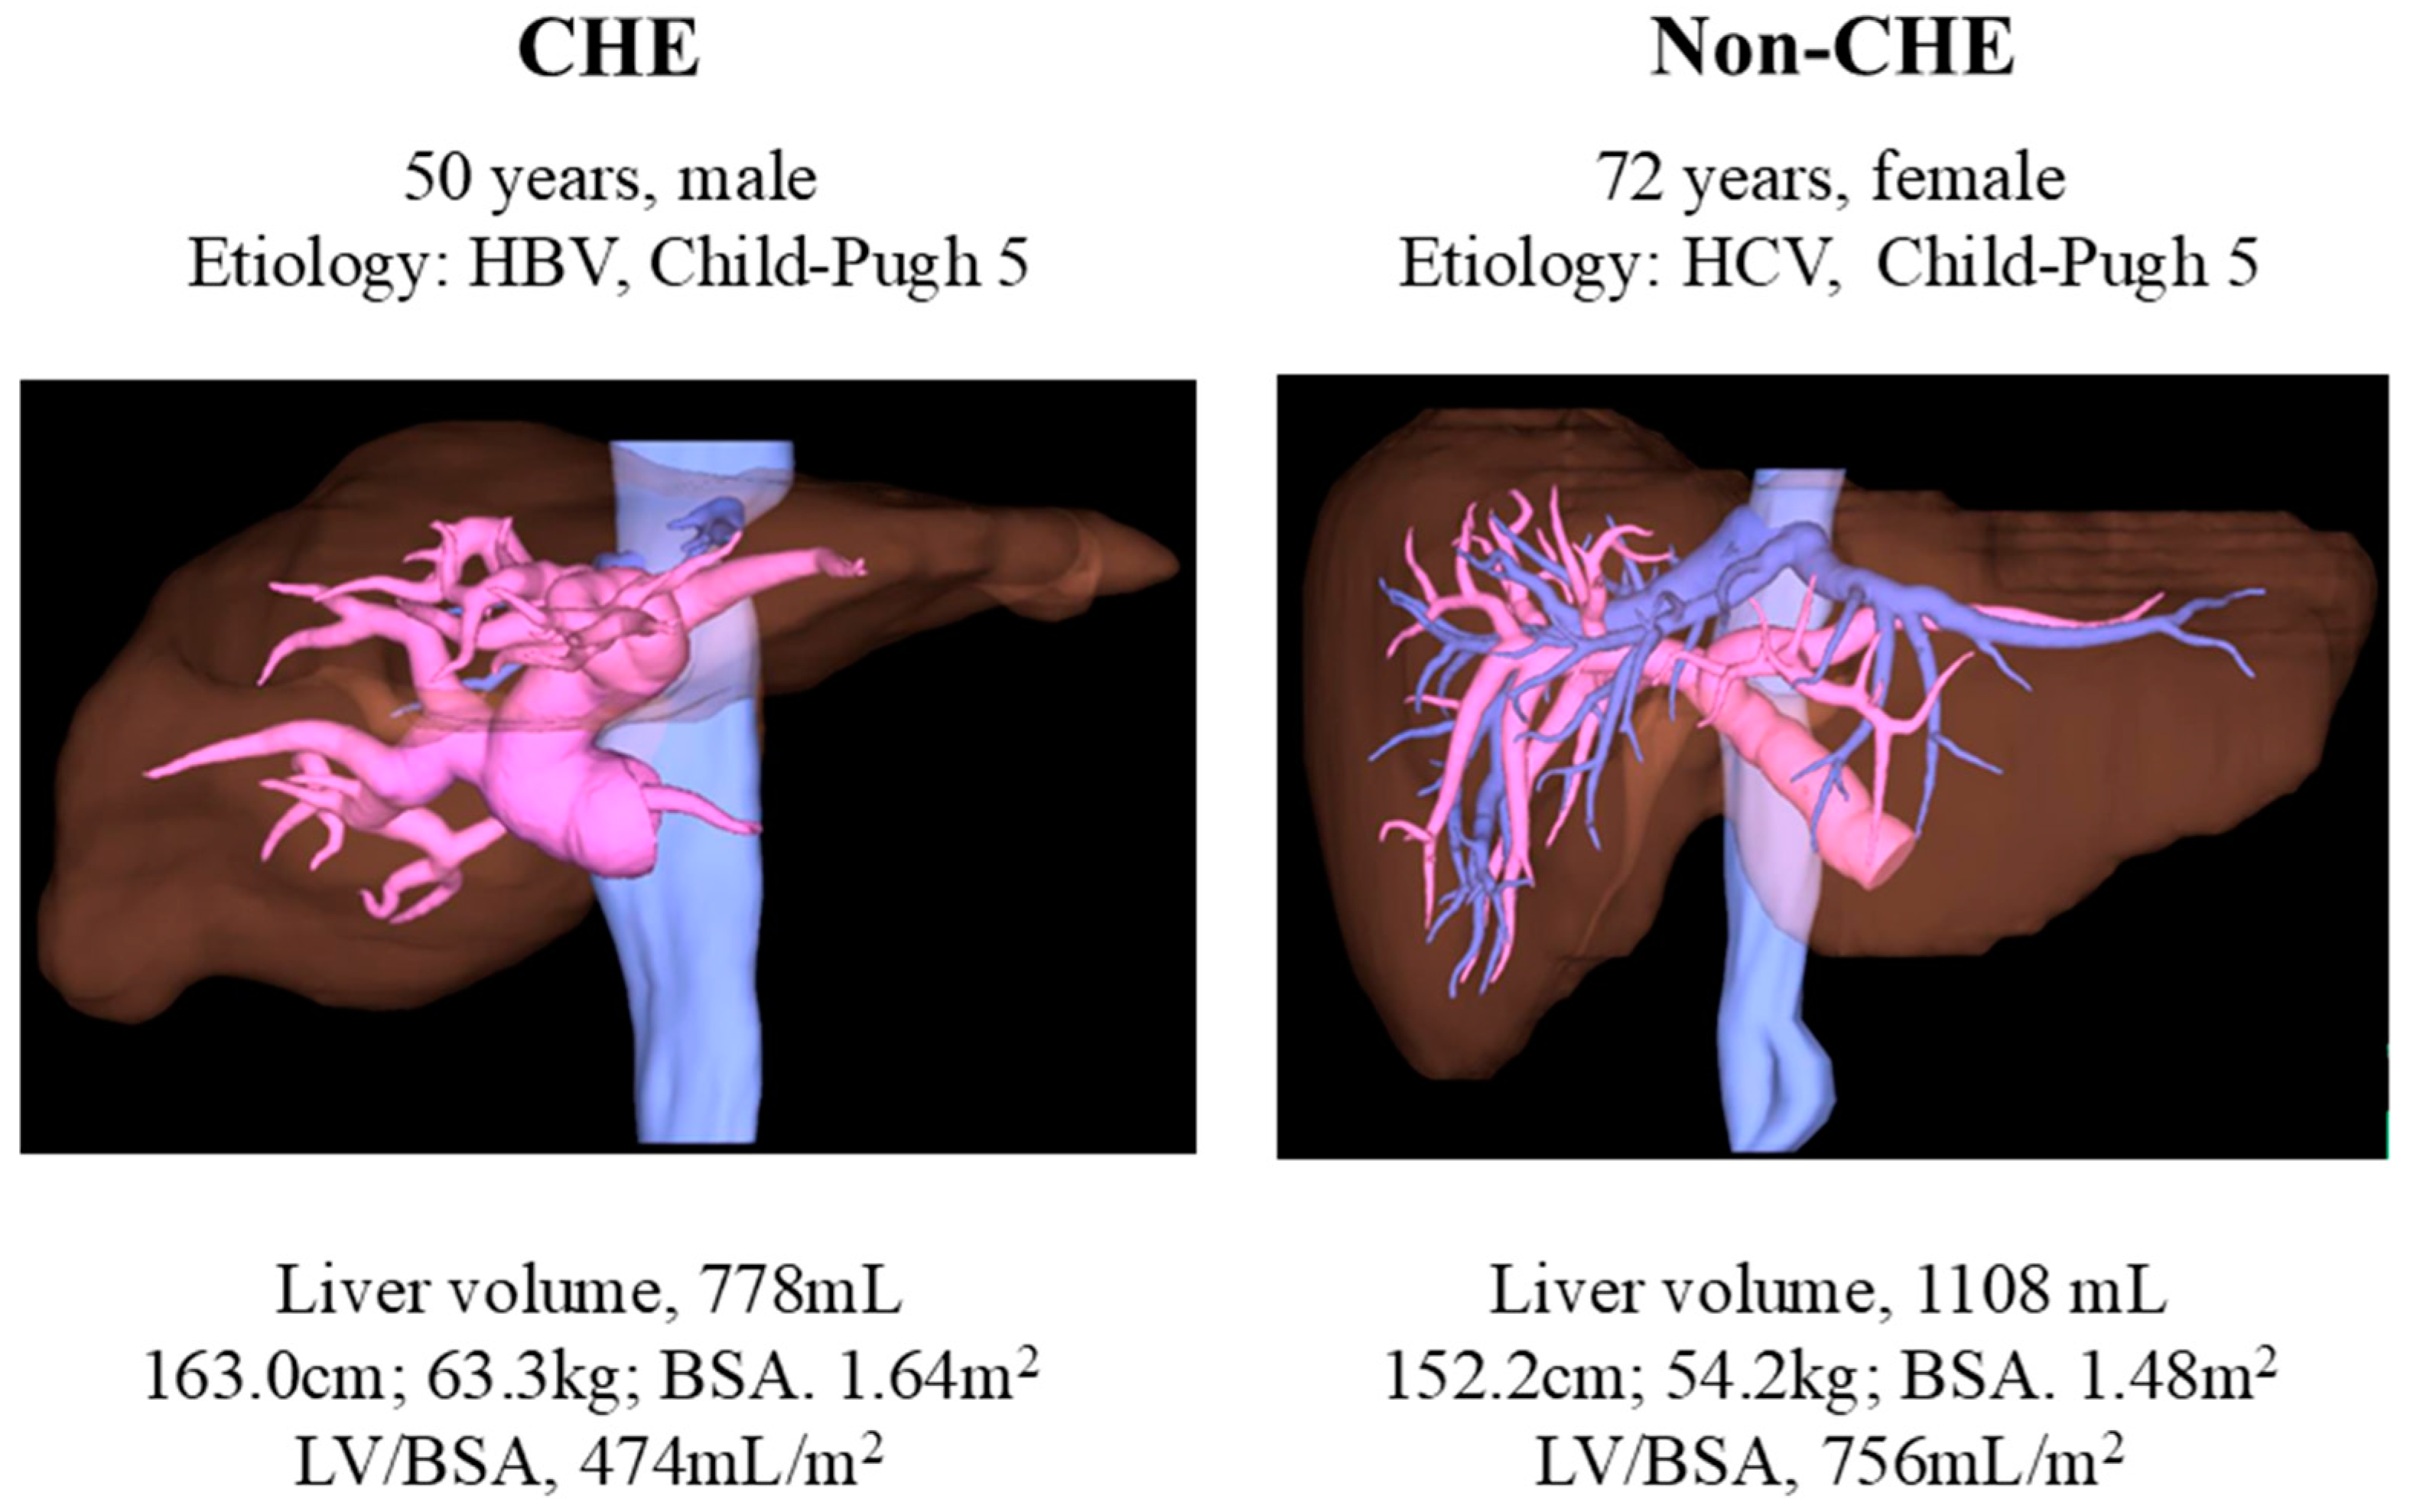
3.3. CHE in Child–Pugh Class A Correlates with Liver Volume and Serum Zn Levels
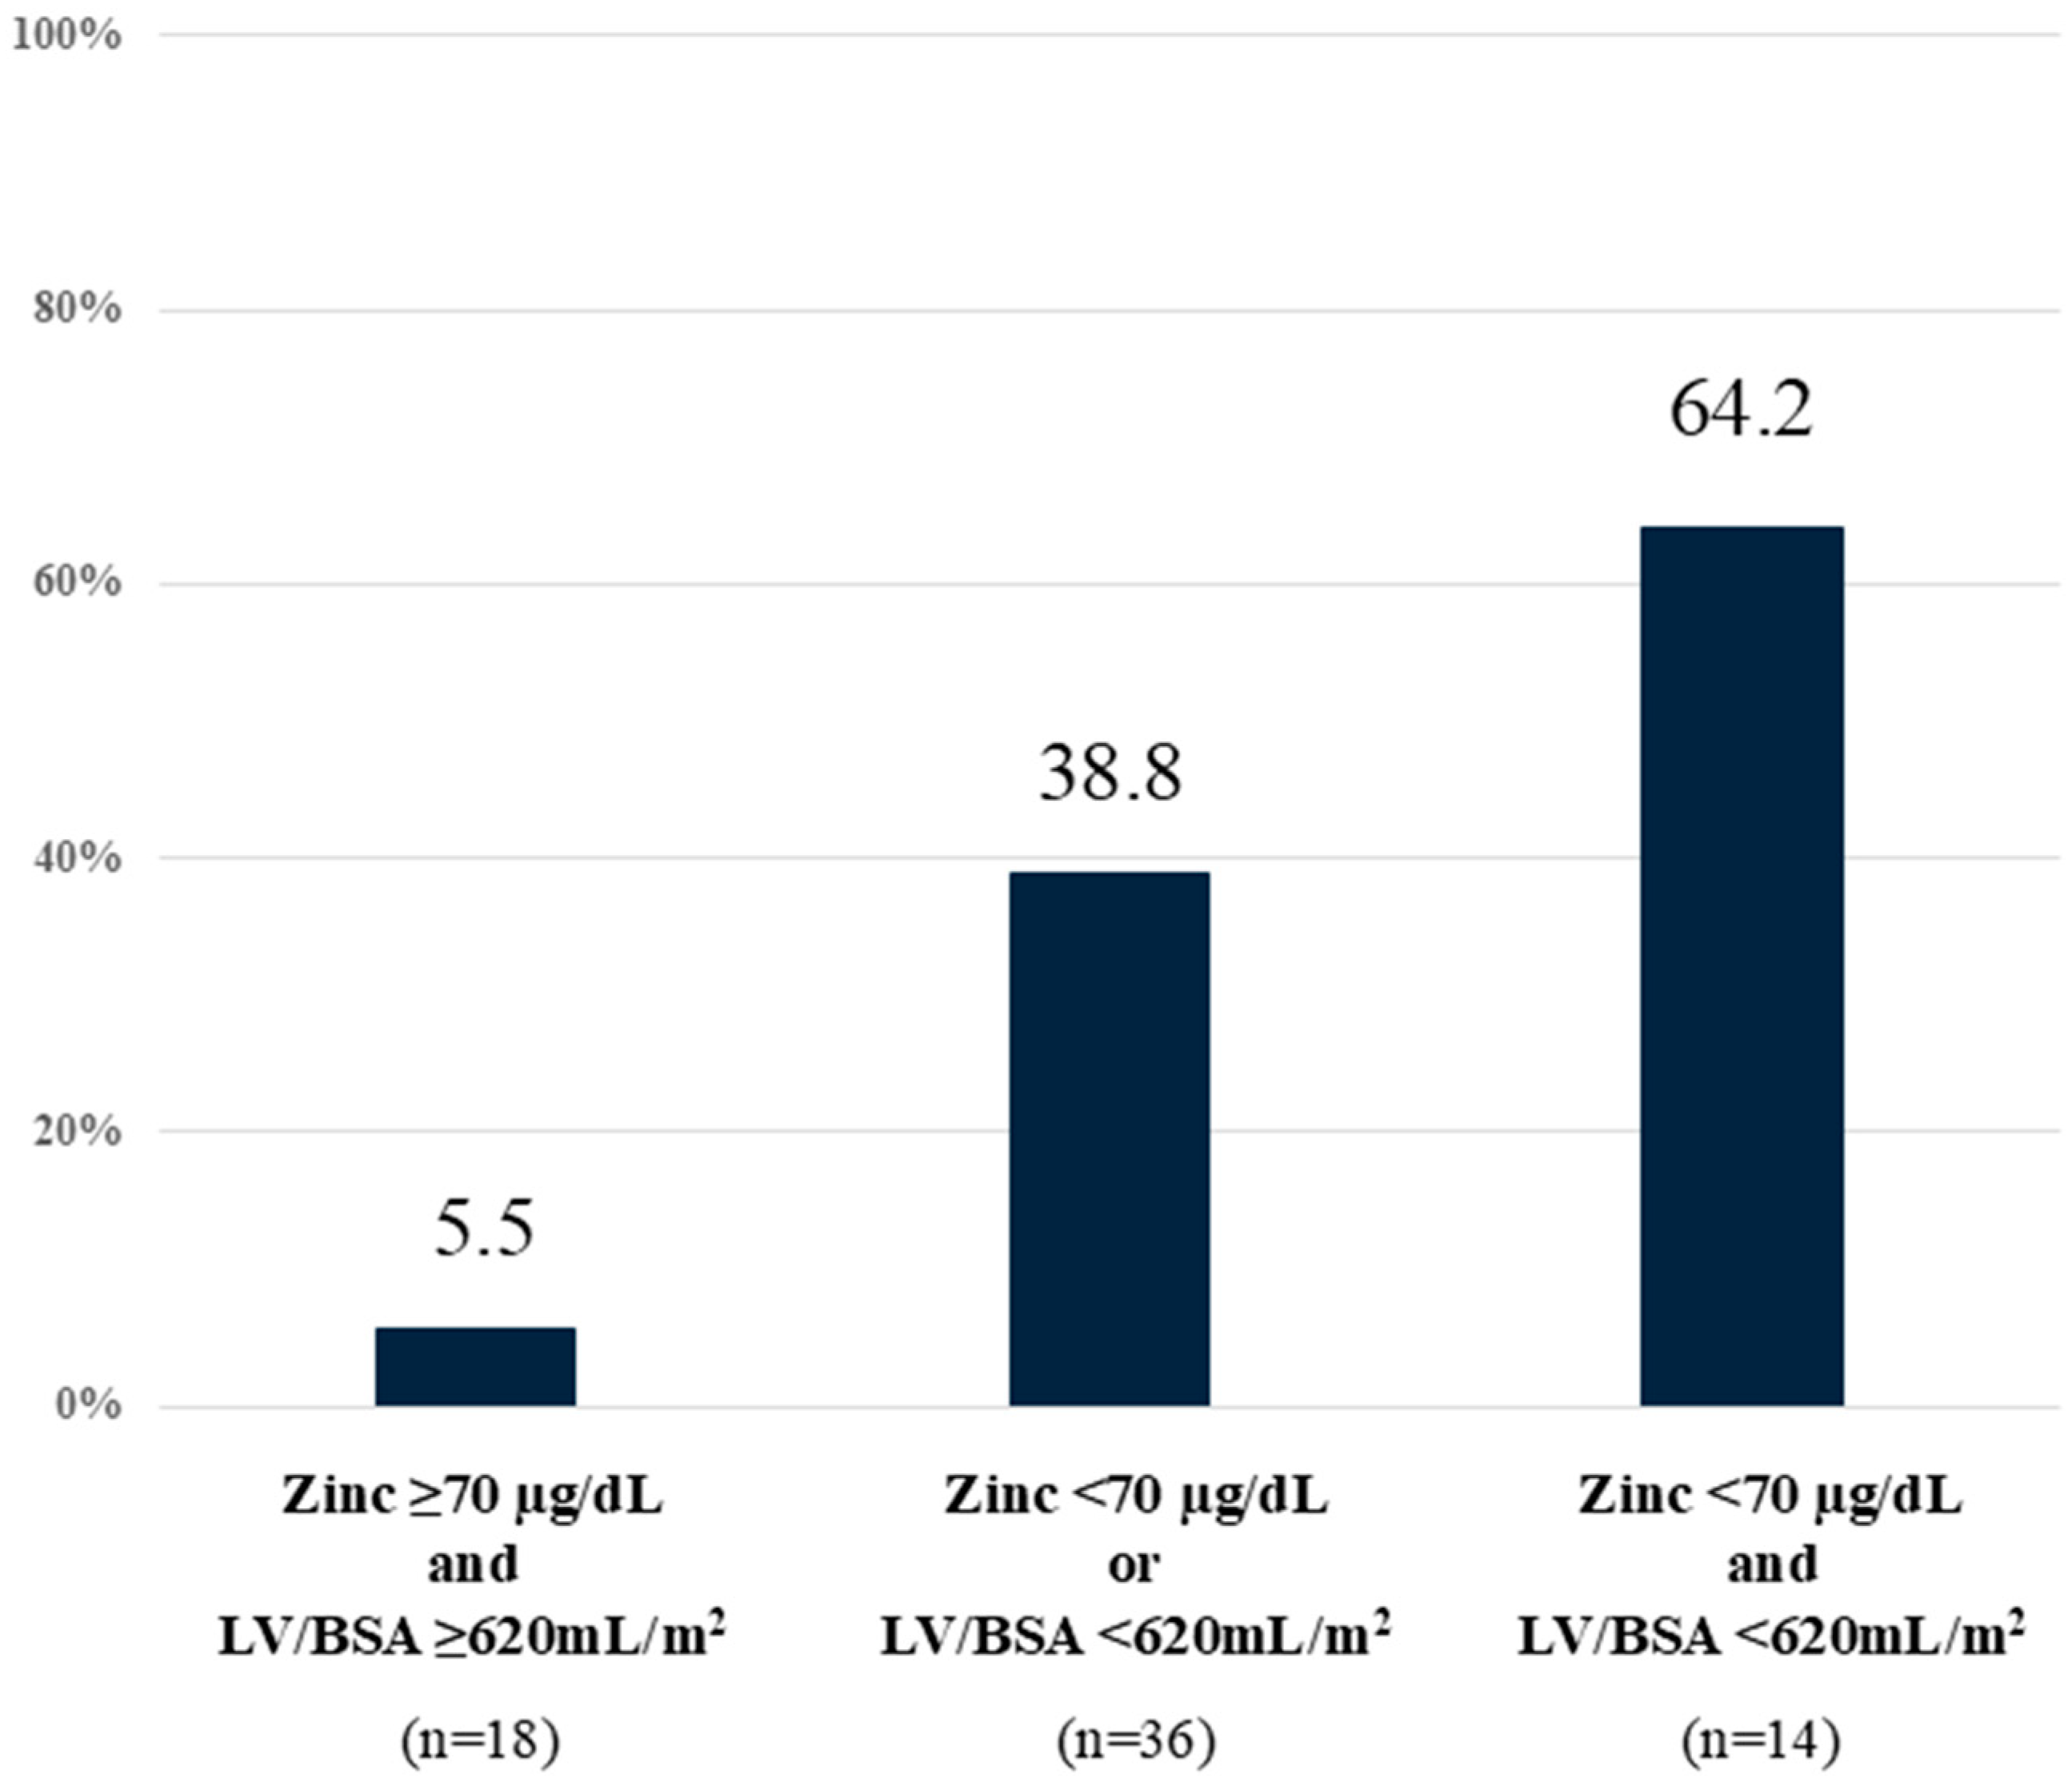
3.4. CHE Prediction Using Liver Volume and Serum Zn Levels
4. Discussion
5. Conclusions
Author Contributions
Funding
Institutional Review Board Statement
Informed Consent Statement
Data Availability Statement
Conflicts of Interest
Abbreviations
| Alb | Albumin |
| AL | Alcoholic liver |
| ALT | Alanine transaminase |
| AST | Aspartate aminotransferase |
| BCAA | Branched-chain amino acid |
| BMI | Body mass index |
| BTR | Branched-chain amino acid-to-tyrosine molecular ratio |
| CHE | Covert hepatic encephalopathy |
| CI | Confidence interval |
| CT | Computed tomography |
| eGFR | Estimated glomerular filtration rate |
| Fib4 | Fibrosis-4 index |
| γ-GTP | γ-Glutamyl transpeptidase |
| HBV | Hepatitis B virus |
| HCV | Hepatitis C virus |
| HE | Hepatic encephalopathy |
| LV/BSA | Liver volume-to-body surface area ratio |
| LV/SPV | Liver volume-to-spleen volume ratio |
| M2BPGi | Mac-2 binding protein glycosylation isomer |
| MASH | Metabolic dysfunction-associated steatohepatitis |
| MELD | Model for end-stage liver disease score |
| Na | Sodium |
| NCT-B | Number connection test B |
| NH3 | Ammonia |
| NPT | Neuropsychiatric test |
| OR | Odds ratio |
| Plt | Platelets |
| PT-INR | Prothrombin time/international normalized ratio |
| QOL | Quality of life |
| SPV/BSA | Spleen volume-to-body surface area ratio |
| TBil | Total bilirubin |
| TLA | Three-letter acronym |
| Zn | Zinc |
References
- Kondo, Y.; Iwasa, M.; Kawaratani, H.; Miyaaki, H.; Hanai, T.; Kon, K.; Hirano, H.; Shimizu, M.; Yoshiji, H.; Okita, K.; et al. Proposal of Stroop test cut-off values as screening for neuropsychological impairments in cirrhosis: A Japanese multicenter study. Hepatol. Res. 2021, 51, 674–681. [Google Scholar] [CrossRef] [PubMed]
- Miyaaki, H.; Hiraoka, A.; Haraguchi, M.; Uojima, H.; Kawaratani, H.; Hiramatsu, A.; Hanai, T.; Hiasa, Y.; Yoshiji, H.; Okita, K.; et al. Proposal for new sleep disorder criteria in patients with chronic liver disease: Influence of liver-related complications. Hepatol. Res. 2022, 52, 364–370. [Google Scholar] [CrossRef]
- Miwa, T.; Hanai, T.; Nishimura, K.; Maeda, T.; Tajirika, S.; Imai, K.; Suetsugu, A.; Takai, K.; Yamamoto, M.; Shimizu, M. A simple covert hepatic encephalopathy screening model based on blood biochemical parameters in patients with cirrhosis. PLoS ONE 2022, 17, e0277829. [Google Scholar] [CrossRef] [PubMed]
- Gairing, S.J.; Mangini, C.; Zarantonello, L.; Gioia, S.; Nielsen, E.J.; Danneberg, S.; Gabriel, M.; Ehrenbauer, A.F.; Bloom, P.P.; Ripoll, C.; et al. Prevalence of minimal hepatic encephalopathy in patients with liver cirrhosis: A multicenter study. Am. J. Gastroenterol. 2023, 118, 2191–2200. [Google Scholar] [CrossRef]
- Zhu, J.Y.; Leng, X.S.; Dong, N.; Qi, G.Y.; Du, R.Y. Measurement of liver volume and its clinical significance in cirrhotic portal hypertensive patients. World J. Gastroenterol. 1999, 5, 525–526. [Google Scholar] [CrossRef]
- Patel, M.; Puangsricharoen, P.; Arshad, H.M.S.; Garrison, S.; Techasatian, W.; Ghabril, M.; Sandrasegaran, K.; Liangpunsakul, S.; Tann, M. Does providing routine liver volume assessment add value when performing CT surveillance in cirrhotic patients? Abdom. Radiol. 2019, 44, 3263–3272. [Google Scholar] [CrossRef]
- Iranmanesh, P.; Vazquez, O.; Terraz, S.; Majno, P.; Spahr, L.; Poncet, A.; Morel, P.; Mentha, G.; Toso, C. Accurate computed tomography-based portal pressure assessment in patients with hepatocellular carcinoma. J. Hepatol. 2014, 60, 969–974. [Google Scholar] [CrossRef] [PubMed]
- Kawaguchi, T.; Konishi, M.; Kato, A.; Kato, M.; Kooka, Y.; Sawara, K.; Endo, R.; Torimura, T.; Suzuki, K.; Takikawa, Y. Updating the neuropsychological test system in Japan for the elderly and in a modern touch screen tablet society by resetting the cut-off values. Hepatol. Res. 2017, 47, 1335–1339. [Google Scholar] [CrossRef] [PubMed]
- Lauridsen, M.M.; Jepsen, P.; Vilstrup, H. Critical flicker frequency and continuous reaction times for the diagnosis of minimal hepatic encephalopathy: A comparative study of 154 patients with liver disease. Metab. Brain Dis. 2011, 26, 135–139. [Google Scholar] [CrossRef] [PubMed]
- Kato, A.; Tanaka, H.; Kawaguchi, T.; Kanazawa, H.; Iwasa, M.; Sakaida, I.; Moriwaki, H.; Murawaki, Y.; Suzuki, K.; Okita, K. Nutritional management contributes to improvement in minimal hepatic encephalopathy and quality of life in patients with liver cirrhosis: A preliminary, prospective, open-label study. Hepatol. Res. 2013, 43, 452–458. [Google Scholar] [CrossRef]
- Weissenborn, K.; Ennen, J.C.; Schomerus, H.; Rückert, N.; Hecker, H. Neuropsychological characterization of hepatic encephalopathy. J. Hepatol. 2001, 34, 768–773. [Google Scholar] [CrossRef]
- Kato, A.; Watanabe, Y.; Sawara, K.; Suzuki, K. Diagnosis of sub-clinical hepatic encephalopathy by Neuropsychological Tests (NP-tests). Hepatol. Res. 2008, 38 (Suppl. S1), S122–S127. [Google Scholar] [CrossRef] [PubMed]
- Lim, M.C.; Tan, C.H.; Cai, J.; Zheng, J.; Kow, A.W. CT volumetry of the liver: Where does it stand in clinical practice? Clin. Radiol. 2014, 69, 887–895. [Google Scholar] [CrossRef] [PubMed]
- Hagan, M.T.; Sayuk, G.S.; Lisker-Melman, M.; Korenblat, K.M.; Kerr, T.A.; Chapman, W.C.; Crippin, J.S. Liver volume in the cirrhotic patient: Does size matter? Dig. Dis. Sci. 2014, 59, 886–891. [Google Scholar] [CrossRef]
- Zhou, X.P.; Lu, T.; Wei, Y.G.; Chen, X.Z. Liver volume variation in patients with virus-induced cirrhosis: Findings on MDCT. AJR Am. J. Roentgenol. 2007, 189, W153–W159. [Google Scholar] [CrossRef] [PubMed]
- Ozaki, K.; Matsui, O.; Kobayashi, S.; Sanada, J.; Koda, W.; Minami, T.; Kawai, K.; Gabata, T. Selective atrophy of the middle hepatic venous drainage area in hepatitis C-related cirrhotic liver: Morphometric study by using multidetector CT. Radiology 2010, 257, 705–714. [Google Scholar] [CrossRef]
- Vauthey, J.N.; Abdalla, E.K.; Doherty, D.A.; Gertsch, P.; Fenstermacher, M.J.; Loyer, E.M.; Lerut, J.; Materne, R.; Wang, X.; Encarnacion, A.; et al. Body surface area and body weight predict total liver volume in Western adults. Liver Transpl. 2002, 8, 233–240. [Google Scholar] [CrossRef]
- Urata, K.; Kawasaki, S.; Matsunami, H.; Hashikura, Y.; Ikegami, T.; Ishizone, S.; Momose, Y.; Komiyama, A.; Makuuchi, M. Calculation of child and adult standard liver volume for liver transplantation. Hepatology 1995, 21, 1317–1321. [Google Scholar] [CrossRef]
- Leung, N.W.; Farrant, P.; Peters, T.J. Liver volume measurement by ultrasonography in normal subjects and alcoholic patients. J. Hepatol. 1986, 2, 157–164. [Google Scholar] [CrossRef] [PubMed]
- Katayama, K.; Kakita, N. Possible pathogenetic role of ammonia in liver cirrhosis without hyperammonemia of venous blood: The so-called latency period of abnormal ammonia metabolism. Hepatol. Res. 2024, 54, 235–243. [Google Scholar] [CrossRef] [PubMed]
- Iritani, S.; Kawamura, Y.; Muraishi, N.; Fujiyama, S.; Sezaki, H.; Hosaka, T.; Akuta, N.; Kobayashi, M.; Saitoh, S.; Suzuki, F.; et al. The useful predictors of zinc deficiency for the management of chronic liver disease. J. Gastroenterol. 2022, 57, 322–332. [Google Scholar] [CrossRef] [PubMed]
- Marchesini, G.; Fabbri, A.; Bianchi, G.; Brizi, M.; Zoli, M. Zinc supplementation and amino acid-nitrogen metabolism in patients with advanced cirrhosis. Hepatology 1996, 23, 1084–1092. [Google Scholar] [CrossRef]
- Katayama, K. Zinc and protein metabolism in chronic liver diseases. Nutr. Res. 2020, 74, 1–9. [Google Scholar] [CrossRef]
- Soma, N.; Uchida, Y.; Kouyama, J.I.; Naiki, K.; Usui, N.; Sato, A.; Yamada, S.; Tsuji, S.; Ando, S.; Sugawara, K.; et al. Serum zinc levels as predictors of covert hepatic encephalopathy in patients with liver cirrhosis. J. Gastroenterol. 2024. [Google Scholar] [CrossRef]
- Kiuchi, T.; Kasahara, M.; Uryuhara, K.; Inomata, Y.; Uemoto, S.; Asonuma, K.; Egawa, H.; Fujita, S.; Hayashi, M.; Tanaka, K. Impact of graft size mismatching on graft prognosis in liver transplantation from living donors. Transplantation 1999, 67, 321–327. [Google Scholar] [CrossRef]
- Kokudo, T.; Hasegawa, K.; Uldry, E.; Matsuyama, Y.; Kaneko, J.; Akamatsu, N.; Aoki, T.; Sakamoto, Y.; Demartines, N.; Sugawara, Y.; et al. A new formula for calculating standard liver volume for living donor liver transplantation without using body weight. J. Hepatol. 2015, 63, 848–854. [Google Scholar] [CrossRef]
- Guéchot, J.; Laudat, A.; Loria, A.; Serfaty, L.; Poupon, R.; Giboudeau, J. Diagnostic accuracy of hyaluronan and type III procollagen amino-terminal peptide serum assays as markers of liver fibrosis in chronic viral hepatitis C evaluated by ROC curve analysis. Clin. Chem. 1996, 42, 558–563. [Google Scholar] [CrossRef] [PubMed]
- Neuman, M.G.; Cohen, L.B.; Nanau, R.M. Hyaluronic acid as a non-invasive biomarker of liver fibrosis. Clin. Biochem. 2016, 49, 302–315. [Google Scholar] [CrossRef]
- Gairing, S.J.; Anders, J.; Kaps, L.; Nagel, M.; Michel, M.; Kremer, W.M.; Hilscher, M.; Galle, P.R.; Schattenberg, J.M.; Wörns, M.A.; et al. Evaluation of IL-6 for stepwise diagnosis of minimal hepatic encephalopathy in patients with liver cirrhosis. Hepatol. Commun. 2022, 6, 1113–1122. [Google Scholar] [CrossRef]
- Gairing, S.J.; Danneberg, S.; Kaps, L.; Nagel, M.; Schleicher, E.M.; Quack, C.; Engel, S.; Bittner, S.; Galle, P.R.; Schattenberg, J.M.; et al. Elevated serum levels of glial fibrillary acidic protein are associated with covert hepatic encephalopathy in patients with cirrhosis. JHEP Rep. 2023, 5, 100671. [Google Scholar] [CrossRef]


| Total (n = 100) | CHE (n = 47) | Non-CHE (n = 53) | p Value | |
|---|---|---|---|---|
| Age (years) | 68 [61–73] | 65 [58–73] | 69 [63–73] | ns |
| Sex | ns | |||
| Male | 62 | 28 | 34 | |
| Female | 38 | 19 | 19 | |
| BMI (kg/m2) | 23.1 [20.7–25.7] | 23.8 [20.8–27.2] | 22.9 [20.6–25.2] | ns |
| Etiology | ns | |||
| HCV | 19 | 7 (15) | 12 (23) | |
| HBV | 16 | 8 (17) | 8 (15) | |
| MASH | 24 | 10 (21) | 14 (26) | |
| AL | 30 | 14 (30) | 16 (30) | |
| Other | 11 | 8 (17) | 3 (6) | |
| Child–Pugh grade | 0.0001 | |||
| A | 55 | 17 | 38 | |
| B | 38 | 24 | 14 | |
| C | 7 | 6 | 1 | |
| Plt (104/µL) | 9.4 [6.1–13.0] | 8.5 [5.4–12.0] | 10.2 [7.5–13.4] | ns |
| PT-INR | 1.18 [1.08–1.30] | 1.24 [1.10–1.42] | 1.13 [1.06–1.23] | 0.002 |
| TBil (mg/dL) | 1.1 [0.8–1.6] | 1.3 [0.9–2.0] | 1.0 [0.7–1.4] | 0.004 |
| Alb (g/dL) | 3.3 [2.7–3.7] | 3.0 [2.4–3.5] | 3.5 [2.9–3.8] | 0.002 |
| Na (mmol/L) | 140 [138–141] | 139 [138–141] | 140 [138–141] | ns |
| eGFR (mL/min/1.73 m2) | 69.0 (55.3–77.9) | 70.6 (49.2–79.6) | 66.3 (57.1–76.2) | ns |
| Hyaluronic acid (ng/mL) | 254 [147–474] | 338 [209–715] | 191 [116–314] | 0.0003 |
| Type 4 collagen 7S (ng/mL) | 8.7 [6.3–12.0] | 10.2 [7.3–14.1] | 7.4 [5.9–10.4] | 0.003 |
| M2BPGi | 3.83 [2.10–7.31] | 5.95 [3.13–14.13] | 3.18 [1.68–4.75] | 0.0002 |
| NH3 (µg/dL) | 67 [45–97] | 69 [44–128] | 66 [46–95] | ns |
| Zinc (µg/dL) | 58 [44–71] | 53 [39–66] | 65 [53–72] | 0.002 |
| Fib4 | 5.6 [3.7–7.3] | 5.9 [4.1–7.7] | 5.1 [3.6–8.2] | ns |
| BTR | 4.1 [3.1–5.5] | 3.6 [2.8–4.9] | 4.7 [3.7–5.6] | 0.007 |
| LV/BSA (mL/m2) | 591 [476–759] | 530 [424–700] | 691 [520–779] | 0.002 |
| SPV/BSA (mL/m2) | 207 [126–327] | 256 [136–381] | 182 [125–282] | ns |
| LV/SPV | 3.1 [1.7–5.6] | 2.1 [1.6–4.1] | 3.6 [2.3–5.8] | 0.012 |
| Esophageal varices | 54 | 26 (55) | 28 (53) | ns |
| Portosystemic shunt | 28 | 14 (30) | 14 (26) | ns |
| Sarcopenia | 22 | 10 (21) | 12 (23) | ns |
| Drug therapy | ns | |||
| BCAA | 55 | 18 | 27 | |
| Lactulose | 18 | 5 | 13 | |
| Rifaximin | 12 | 3 | 9 |
| Abstinence (n = 16) | Continued Drinking (n = 14) | p Value | |
|---|---|---|---|
| Age (years) | 64.5 [61.0–70.5] | 60.5 [54.0–64.0] | ns |
| Sex | ns | ||
| Male | 16 | 11 | |
| Female | 0 | 3 | |
| BMI (kg/m2) | 23.3 [21.8–25.7] | 21.9 [20.0–25.8] | ns |
| Child–Pugh score | 6.5 [5.0–8.5] | 6.5 [6.0–9.0] | ns |
| Plt (104/µL) | 7.2 [4.8–13.1] | 9.2 [6.6–12.1] | ns |
| PT-INR | 1.13 [1.09–1.39] | 1.19 [1.06–1.32] | ns |
| AST (U/L) | 25 [20–34] | 50 [39–68] | 0.002 |
| ALT (U/L) | 18 [16–26] | 25 [21–34] | 0.04 |
| γ-GTP (U/L) | 30 [21–82] | 203 [52–313] | 0.006 |
| TBil (mg/dL) | 1.1 [0.9–1.7] | 1.5 [0.9–3.2] | ns |
| Alb (g/dL) | 3.2 [2.7–3.8] | 3.0 [2.8–3.4] | ns |
| eGFR (mL/min/1.73 m2) | 64.4 (54.5–76.2) | 82.7 (75.7–86.8) | 0.007 |
| Hyaluronic acid (ng/mL) | 218 [136–524] | 325 [91–950] | ns |
| Type 4 collagen 7S (ng/mL) | 10.4 [7.6–12.0] | 11.3 [7.7–14.7] | ns |
| M2BPGi | 4.3 [3.0–6.7] | 5.6 [3.4–10.5] | ns |
| NH3 (µg/dL) | 100 [60–127] | 69 [63–86] | ns |
| Zinc (µg/dL) | 59 [42–70] | 49 [43–56] | ns |
| Fib4 | 5.1 [3.0–8.3] | 6.8 [4.3–9.3] | ns |
| BTR | 4.3 [3.4–5.7] | 3.2 [2.9–4.9] | ns |
| LV/BSA (mL/m2) | 559 [477–701] | 832 [671–1043] | 0.004 |
| SPV/BSA (mL/m2) | 289 [143–395] | 198 [147–249] | ns |
| LV/SPV | 2.1 [1.3–4.6] | 3.4 [2.4–6.0] | 0.04 |
| Esophageal varices | 12 (75) | 10 (71) | ns |
| Portosystemic shunt | 6 (38) | 6 (43) | ns |
| Sarcopenia | 4 (25) | 1 (8) | ns |
| Drug therapy | ns | ||
| BCAA | 10 | 6 | |
| Lactulose | 5 | 0 | |
| Rifaximin | 3 | 0 |
| Total (n = 68) | CHE (n = 24) | Non-CHE (n = 44) | |
|---|---|---|---|
| Age (years) | 71.5 (67.0–77.5) | 71.0 (67.0–77.5) | 71.5 (67.0–77.5) |
| Sex | |||
| Male | 41 | 16 | 25 |
| Female | 27 | 8 | 19 |
| BMI (kg/m2) | 22.8 (20.7–25.0) | 22.3 (20.5–24.6) | 22.9 (21.2–25.0) |
| Etiology | |||
| HCV | 24 (35) | 8 (33) | 16 (36) |
| HBV | 15 (22) | 8 (33) | 7 (16) |
| MASH | 18 (26) | 5 (21) | 13 (30) |
| AL | 6 (9) | 1 (4) | 5 (11) |
| Other | 5 (7) | 2 (8) | 3 (7) |
| Child–Pugh score | |||
| 5 | 44 | 15 | 29 |
| 6 | 24 | 9 | 15 |
| Plt (104/µL) | 11.6 [8.8–15.4] | 9.6 [8.0–13.0] | 12.9 [9.7–17.3] |
| PT-INR | 1.09 [1.03–1.17] | 1.09 [1.03–1.20] | 1.09 [1.02–1.17] |
| TBil (mg/dL) | 1.0 [0.7–1.1] | 1.0 [0.7–1.4] | 0.9 [0.7–1.1] |
| Alb (g/dL) | 3.8 [3.5–4.0] | 3.7 [3.2–4.0] | 3.8 [3.5–4.0] |
| eGFR (mL/min/1.73 m2) | 69.7 (56.6–77.3) | 72.2 (58.7–78.2) | 65.3 (56.6–73.6) |
| Hyaluronic acid (ng/mL) | 191 [110–275] | 213 [177–340] | 172 [100–252] |
| Type 4 collagen 7S (ng/mL) | 6.3 [4.5–7.8] | 6.6 [4.9–8.7] | 6.2 [4.4–7.5] |
| M2BPGi | 2.0 [1.1–3.3] | 2.2 [1.2–3.3] | 1.7 [1.1–3.4] |
| NH3 (µg/dL) | 48 [39–70] | 43 [33–59] | 48 [40–73] |
| Zinc (µg/dL) | 70 [62–82] | 65 [60–76] | 73 [64–83] |
| Fib4 | 4.1 [3.0–6.2] | 4.7 [3.3–6.3] | 4.0 [2.7–6.1] |
| BTR | 5.5 [4.4–6.4] | 5.3 [3.9–6.9] | 5.5 [4.4–6.4] |
| LV/BSA (mL/m2) | 668 [513–758] | 550 [488–706] | 726 [574–797] |
| SPV/BSA (mL/m2) | 155 [85–279] | 195 [87–287] | 139 [83–266] |
| LV/SPV | 4.8 [2.8–7.4] | 3.7 [1.9–6.9] | 5.1 [3.1–7.8] |
| Esophageal varices | 25 (37) | 9 (38) | 16 (36) |
| Portosystemic shunt | 10 (15) | 3 (13) | 7 (16) |
| Sarcopenia | 17 (25) | 5 (22) | 12 (27) |
| Drug therapy | |||
| BCAA | 15 | 8 | 7 |
| Lactulose | 6 | 4 | 2 |
| Rifaximin | 1 | 1 | 0 |
| Univariate Analysis | Multivariate Analysis | ||||
|---|---|---|---|---|---|
| OR (95% CI) | p Value | OR (95% CI) | p Value | ||
| Age (years) | ≥71 | 0.76 (0.280–2.062) | 0.589 | ||
| Sex | Female | 0.658 (0.233–1.856) | 0.429 | ||
| BMI (kg/m2) | ≥23 | 0.782 (0.287–2.136) | 0.631 | ||
| Etiology | HCV or HBV | 2.000 (0.711–5.626) | 0.188 | ||
| Child–Pugh score | 6 | 1.160 (0.412–3.266) | 0.778 | ||
| Plt (104/µL) | <12 | 1.825 (0.661–5.044) | 0.245 | ||
| PT-INR | ≥1.1 | 0.782 (0.287–2.136) | 0.631 | ||
| TBil (mg/dL) | ≥1.0 | 1.294 (0.477–3.509) | 0.621 | ||
| Alb (g/dL) | <3.8 | 1.388 (0.474–4.059) | 0.549 | ||
| eGFR (mL/min/1.73 m2) | ≥70 | 2.685 (0.973–7.404) | 0.056 | ||
| Hyaluronic acid (ng/mL) | ≥190 | 2.976 (1.008–8.786) | 0.048 | 3.291 (0.947–11.440) | 0.06 |
| Type 4 collagen 7S (ng/mL) | ≥6.3 | 1.257 (0.449–3.523) | 0.663 | ||
| M2BPGi | ≥2.0 | 1.825 (0.644–5.186) | 0.257 | ||
| NH3 (µg/dL) | ≥50 | 0.806 (0.291–2.231) | 0.677 | ||
| Zinc (µg/dL) | <70 | 2.976 (1.008–8.786) | 0.048 | 4.578 (1.225–11.440) | 0.023 |
| Fib4 | ≥4.0 | 1.485 (0.531–4.155) | 0.451 | ||
| BTR | ≤5.5 | 0.873 (0.312–2.446) | 0.796 | ||
| LV/BSA (mL/m2) | <670 | 3.508 (1.208–10.184) | 0.021 | 7.715 (1.965–30.293) | 0.003 |
| SPV/BSA (mL/m2) | ≥155 | 1.321 (0.477–3.659) | 0.592 | ||
| LV/SPV | ≥4.8 | 0.531 (0.189–1.494) | 0.23 | ||
| Esophageal varices | + | 1.085 (0.383–3.072) | 0.878 | ||
| Portosystemic shunt | + | 0.755 (0.176–3.234) | 0.705 | ||
| Sarcopenia | + | 0.741 (0.225–2.441) | 0.621 | ||
| Drug therapy | + | 2.250 (0.717–7.059) | 0.164 | ||
Disclaimer/Publisher’s Note: The statements, opinions and data contained in all publications are solely those of the individual author(s) and contributor(s) and not of MDPI and/or the editor(s). MDPI and/or the editor(s) disclaim responsibility for any injury to people or property resulting from any ideas, methods, instructions or products referred to in the content. |
© 2024 by the authors. Licensee MDPI, Basel, Switzerland. This article is an open access article distributed under the terms and conditions of the Creative Commons Attribution (CC BY) license (https://creativecommons.org/licenses/by/4.0/).
Share and Cite
Fukushima, M.; Miyaaki, H.; Sasaki, R.; Nakao, Y.; Haraguchi, M.; Takahashi, K.; Ozawa, E.; Miuma, S.; Nakao, K. Benefits of Liver Volume and Serum Zinc Level Assessment for the Screening of Covert Hepatic Encephalopathy in Patients with Child–Pugh Class A Cirrhosis. Diagnostics 2025, 15, 23. https://doi.org/10.3390/diagnostics15010023
Fukushima M, Miyaaki H, Sasaki R, Nakao Y, Haraguchi M, Takahashi K, Ozawa E, Miuma S, Nakao K. Benefits of Liver Volume and Serum Zinc Level Assessment for the Screening of Covert Hepatic Encephalopathy in Patients with Child–Pugh Class A Cirrhosis. Diagnostics. 2025; 15(1):23. https://doi.org/10.3390/diagnostics15010023
Chicago/Turabian StyleFukushima, Masanori, Hisamitsu Miyaaki, Ryu Sasaki, Yasuhiko Nakao, Masafumi Haraguchi, Kosuke Takahashi, Eisuke Ozawa, Satoshi Miuma, and Kazuhiko Nakao. 2025. "Benefits of Liver Volume and Serum Zinc Level Assessment for the Screening of Covert Hepatic Encephalopathy in Patients with Child–Pugh Class A Cirrhosis" Diagnostics 15, no. 1: 23. https://doi.org/10.3390/diagnostics15010023
APA StyleFukushima, M., Miyaaki, H., Sasaki, R., Nakao, Y., Haraguchi, M., Takahashi, K., Ozawa, E., Miuma, S., & Nakao, K. (2025). Benefits of Liver Volume and Serum Zinc Level Assessment for the Screening of Covert Hepatic Encephalopathy in Patients with Child–Pugh Class A Cirrhosis. Diagnostics, 15(1), 23. https://doi.org/10.3390/diagnostics15010023