
Machine Learning and Deep Learning Models for Nocturnal High- and Low-Glucose Prediction in Adults with Type 1 Diabetes


Abstract
1. Introduction
2. Materials and Methods
2.1. Database
2.2. Data Preprocessing
2.3. Modeling
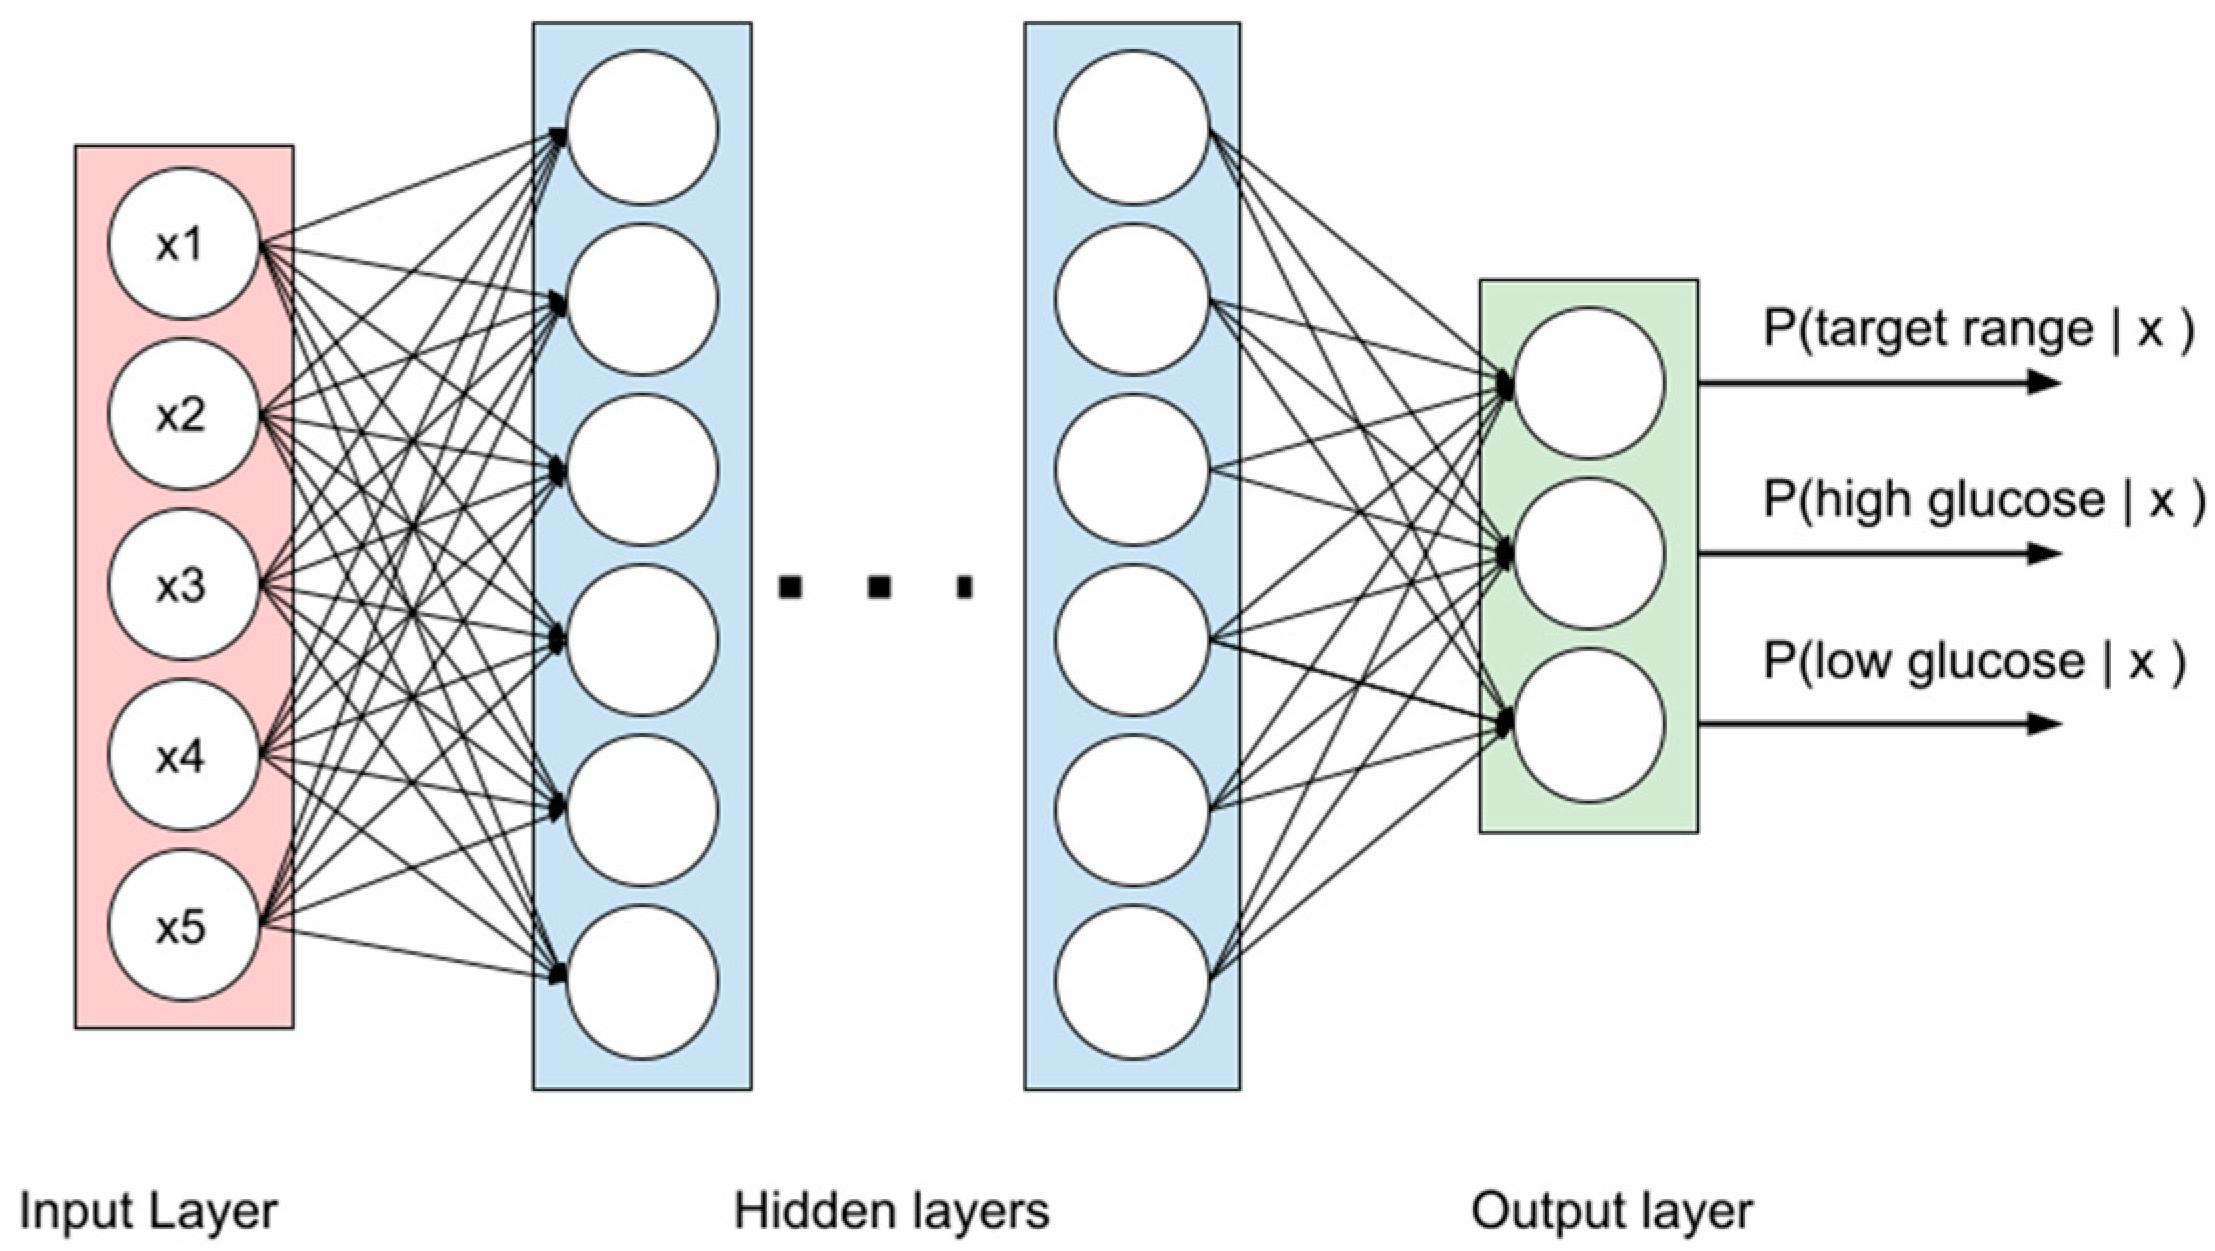
2.3.1. MLP
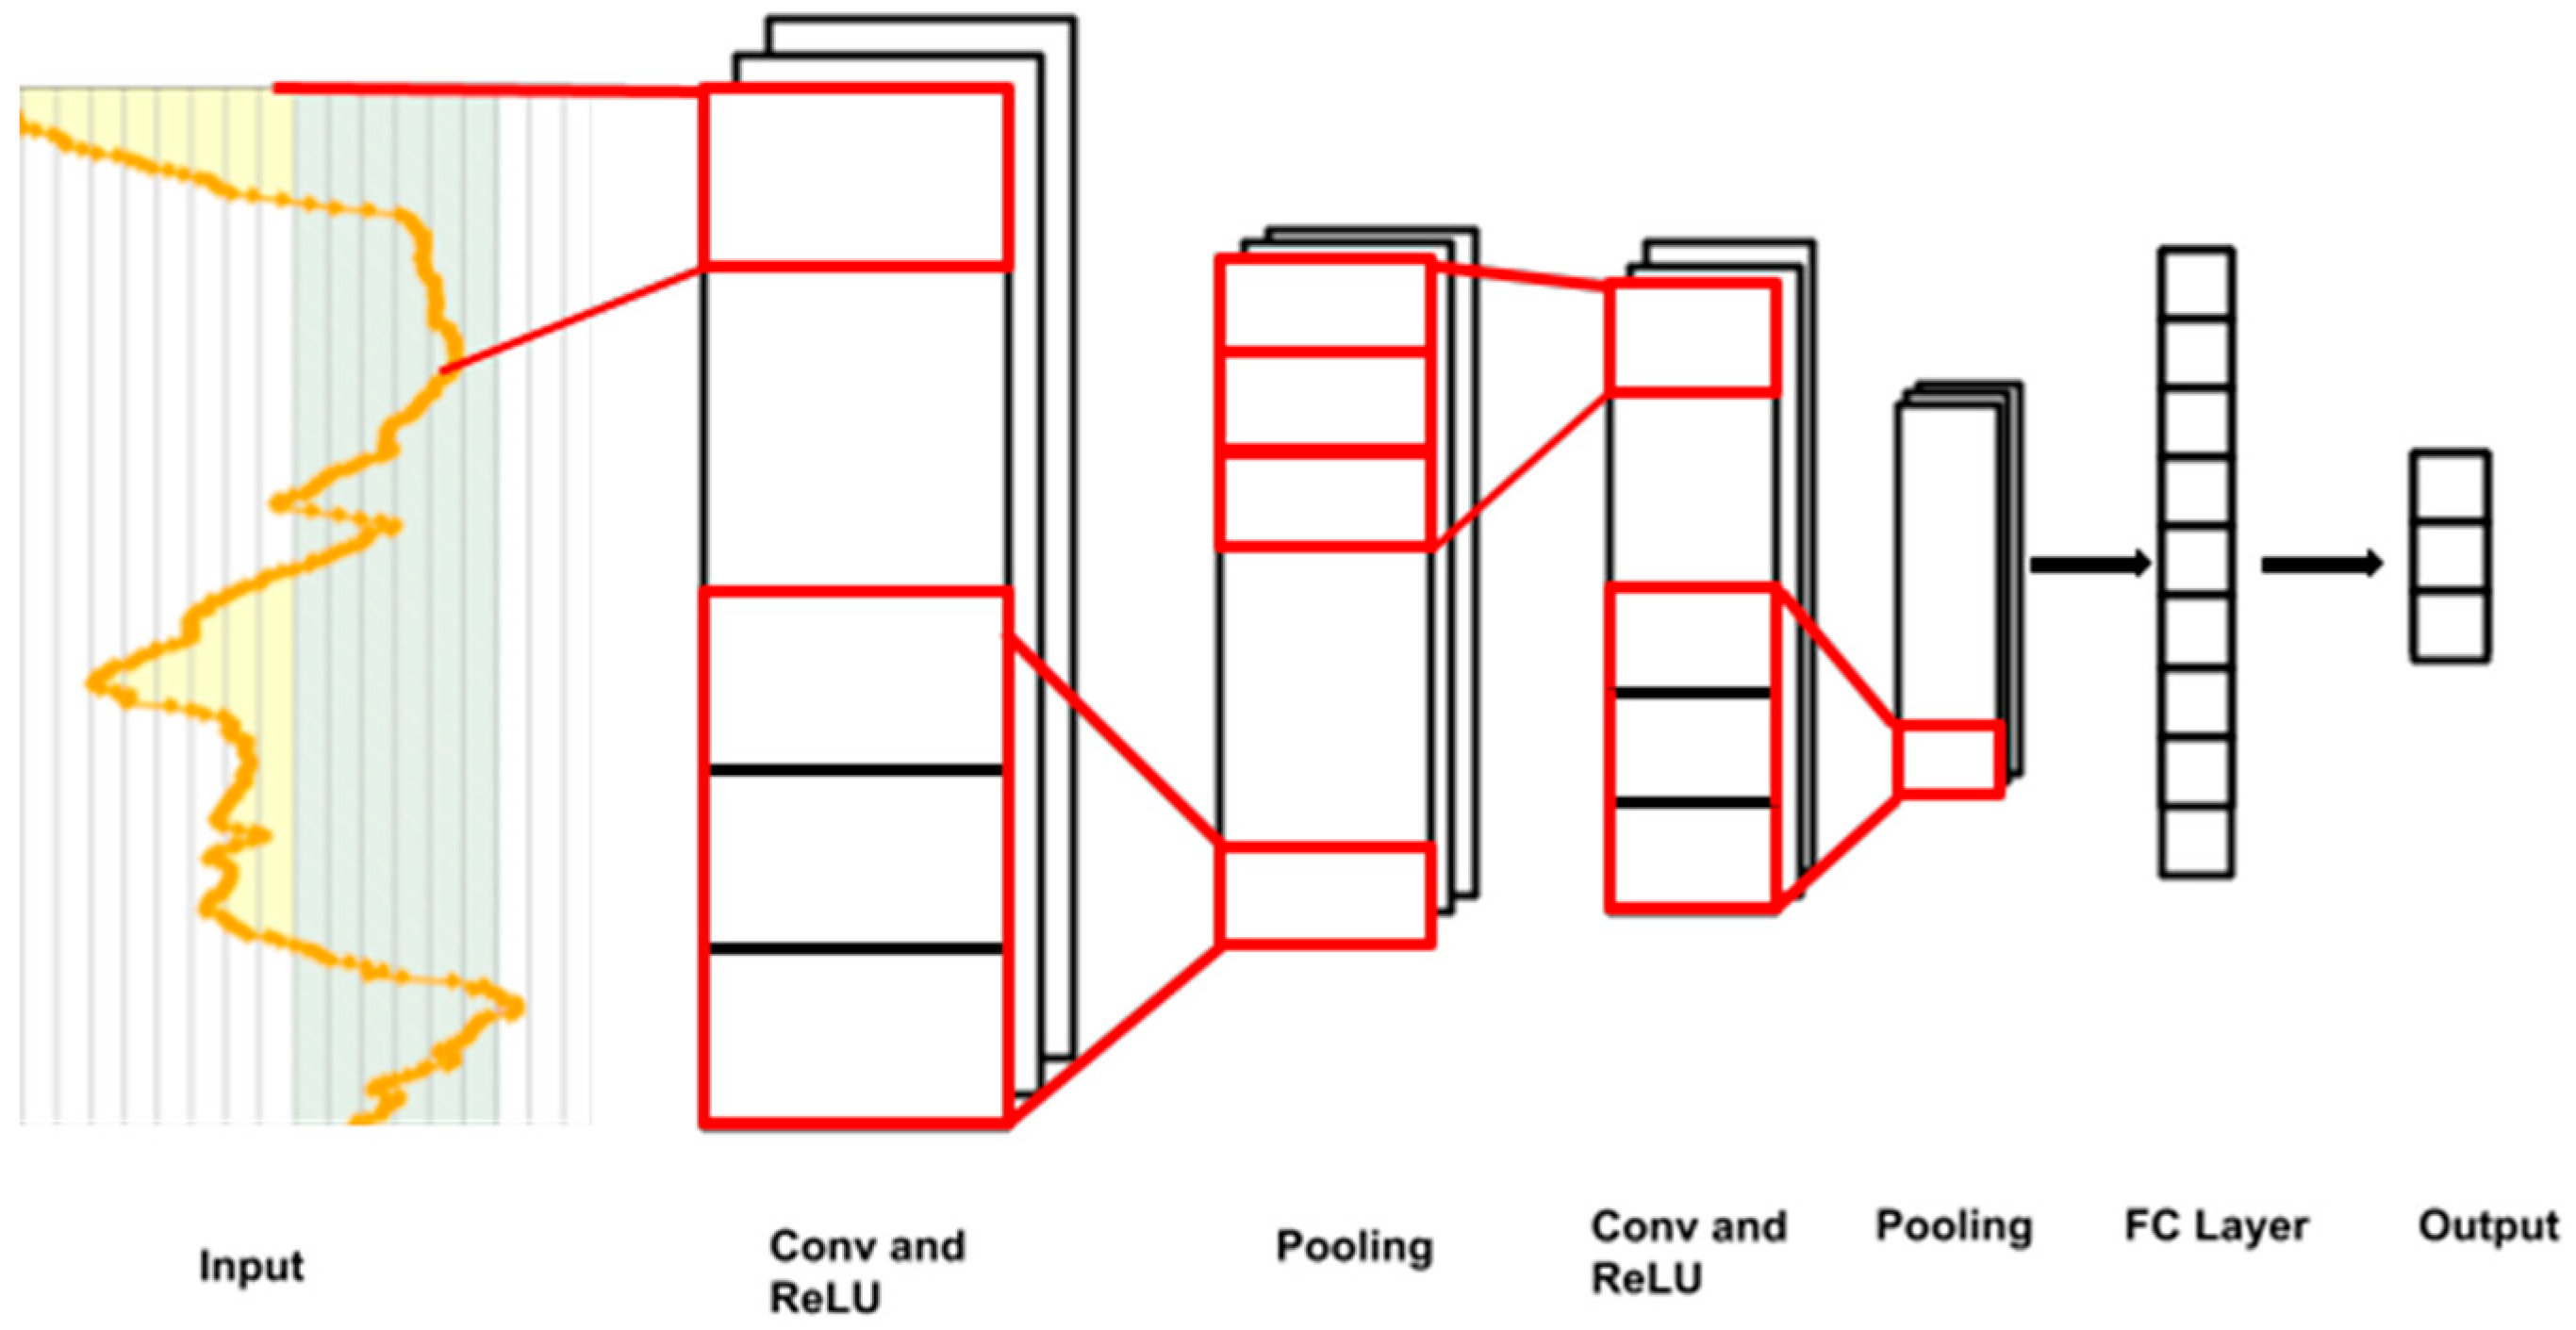
2.3.2. CNNs
2.3.3. RF and GBTs
2.4. Evaluation of the Models
3. Results
3.1. Characteristics of Patients
3.2. Performance Metrics of the Models
3.3. Effects of PH and LBW on the Model Performance
4. Discussion
4.1. Methodology and Principal Results of This Study
4.2. Comparisons with Other Studies
4.3. Limitations of This Study and Future Remarks
5. Conclusions
Author Contributions
Funding
Institutional Review Board Statement
Informed Consent Statement
Data Availability Statement
Conflicts of Interest
References
- Pedersen-Bjergaard, U.; Alsifri, S.; Aronson, R.; Berković, M.C.; Galstyan, G.; Gydesen, H.; Lekdorf, J.B.; Ludvik, B.; Moberg, E.; Ramachandran, A.; et al. Comparison of the HAT study, the largest global hypoglycaemia study to date, with similar large real-world studies. Diabetes Obes. Metab. 2019, 21, 844–853. [Google Scholar] [CrossRef] [PubMed]
- Benkhadra, K.; Alahdab, F.; Tamhane, S.U.; McCoy, R.G.; Prokop, L.J.; Murad, M.H. Continuous subcutaneous insulin infusion versus multiple daily injections in individuals with type 1 diabetes: A systematic review and meta-analysis. Endocrine 2017, 55, 77–84. [Google Scholar] [CrossRef] [PubMed]
- McAuley, S.A.; Vogrin, S.; Lee, M.H.; Paldus, B.; Trawley, S.; de Bock, M.I.; Abraham, M.B.; Bach, L.A.; Burt, M.G.; Cohen, N.D.; et al. Less Nocturnal Hypoglycemia but Equivalent Time in Range Among Adults with Type 1 Diabetes Using Insulin Pumps Versus Multiple Daily Injections. Diabetes Technol. Ther. 2021, 23, 460–466. [Google Scholar] [CrossRef] [PubMed]
- Chen, E.; King, F.; Kohn, M.A.; Spanakis, E.K.; Breton, M.; Klonoff, D.C. A Review of Predictive Low Glucose Suspend and Its Effectiveness in Preventing Nocturnal Hypoglycemia. Diabetes Technol. Ther. 2019, 21, 602–609. [Google Scholar] [CrossRef] [PubMed]
- Michou, P.; Gkiourtzis, N.; Christoforidis, A.; Kotanidou, E.P.; Galli-Tsinopoulou, A. The efficacy of automated insulin delivery systems in children and adolescents with type 1 diabetes Mellitus: A systematic review and meta-analysis of randomized controlled trials. Diabetes Res. Clin. Pract. 2023, 199, 110678. [Google Scholar] [CrossRef] [PubMed]
- Kladov, D.E.; Berikov, V.B.; Semenova, J.F.; Klimontov, V.V. Nocturnal Glucose Patterns with and without Hypoglycemia in People with Type 1 Diabetes Managed with Multiple Daily Insulin Injections. J. Pers. Med. 2023, 13, 1454. [Google Scholar] [CrossRef] [PubMed]
- Woldaregay, A.Z.; Årsand, E.; Walderhaug, S.; Albers, D.; Mamykina, L.; Botsis, T.; Hartvigsen, G. Data-driven modeling and prediction of blood glucose dynamics: Machine learning applications in type 1 diabetes. Artif. Intell. Med. 2019, 98, 109–134. [Google Scholar] [CrossRef]
- Mujahid, O.; Contreras, I.; Vehi, J. Machine learning techniques for hypoglycemia prediction: Trends and challenges. Sensors 2021, 21, 546. [Google Scholar] [CrossRef] [PubMed]
- Zhang, L.; Yang, L.; Zhou, Z. Data-based modeling for hypoglycemia prediction: Importance, trends, and implications for clinical practice. Front. Public. Health 2023, 11, 1044059. [Google Scholar] [CrossRef]
- Kodama, S.; Fujihara, K.; Shiozaki, H.; Horikawa, C.; Yamada, M.H.; Sato, T.; Yaguchi, Y.; Yamamoto, M.; Kitazawa, M.; Iwanaga, M.; et al. Ability of Current Machine Learning Algorithms to Predict and Detect Hypoglycemia in Patients with Diabetes Mellitus: Meta-analysis. JMIR Diabetes 2021, 6, e22458. [Google Scholar] [CrossRef]
- Bertachi, A.; Viñals, C.; Biagi, L.; Contreras, I.; Vehí, J.; Conget, I.; Giménez, M. Prediction of Nocturnal Hypoglycemia in Adults with Type 1 Diabetes under Multiple Daily Injections Using Continuous Glucose Monitoring and Physical Activity Monitor. Sensors 2020, 20, 1705. [Google Scholar] [CrossRef] [PubMed]
- Li, J.; Ma, X.; Tobore, I.; Liu, Y.; Kandwal, A.; Wang, L.; Lu, J.; Lu, W.; Bao, Y.; Zhou, J.; et al. A Novel CGM Metric-Gradient and Combining Mean Sensor Glucose Enable to Improve the Prediction of Nocturnal Hypoglycemic Events in Patients with Diabetes. J. Diabetes Res. 2020, 2020, 8830774. [Google Scholar] [CrossRef] [PubMed]
- Mosquera-Lopez, C.; Dodier, R.; Tyler, N.S.; Wilson, L.M.; El Youssef, J.; Castle, J.R.; Jacobs, P.G. Predicting and Preventing Nocturnal Hypoglycemia in Type 1 Diabetes Using Big Data Analytics and Decision Theoretic Analysis. Diabetes Technol. Ther. 2020, 22, 801–811. [Google Scholar] [CrossRef] [PubMed]
- Jensen, M.H.; Dethlefsen, C.; Vestergaard, P.; Hejlesen, O. Prediction of Nocturnal Hypoglycemia From Continuous Glucose Monitoring Data in People With Type 1 Diabetes: A Proof-of-Concept Study. J. Diabetes Sci. Technol. 2020, 14, 250–256. [Google Scholar] [CrossRef] [PubMed]
- Berikov, V.B.; Kutnenko, O.A.; Semenova, J.F.; Klimontov, V.V. Machine Learning Models for Nocturnal Hypoglycemia Prediction in Hospitalized Patients with Type 1 Diabetes. J. Pers. Med. 2022, 12, 1262. [Google Scholar] [CrossRef]
- Vu, L.; Kefayati, S.; Idé, T.; Pavuluri, V.; Jackson, G.; Latts, L.; Zhong, Y.; Agrawal, P.; Chang, Y.C. Predicting Nocturnal Hypoglycemia from Continuous Glucose Monitoring Data with Extended Prediction Horizon. AMIA Annu. Symp. Proc. 2020, 2019, 874–882. [Google Scholar]
- Afentakis, I.; Unsworth, R.; Herrero, P.; Oliver, N.; Reddy, M.; Georgiou, P. Development and Validation of Binary Classifiers to Predict Nocturnal Hypoglycemia in Adults With Type 1 Diabetes. J. Diabetes Sci. Technol. 2023, 19322968231185796. [Google Scholar] [CrossRef] [PubMed]
- Cichosz, S.L.; Jensen, M.H.; Olesen, S.S. Development and Validation of a Machine Learning Model to Predict Weekly Risk of Hypoglycemia in Patients with Type 1 Diabetes Based on Continuous Glucose Monitoring. Diabetes Technol. Ther. 2024, in press. [Google Scholar] [CrossRef] [PubMed]
- Dave, D.; DeSalvo, D.J.; Haridas, B.; McKay, S.; Shenoy, A.; Koh, C.J.; Lawley, M.; Erraguntla, M. Feature-Based Machine Learning Model for Real-Time Hypoglycemia Prediction. J. Diabetes Sci. Technol. 2021, 15, 842–855. [Google Scholar] [CrossRef]
- Vehí, J.; Contreras, I.; Oviedo, S.; Biagi, L.; Bertachi, A. Prediction and prevention of hypoglycaemic events in type-1 diabetic patients using machine learning. Health Inform. J. 2020, 26, 703–718. [Google Scholar] [CrossRef]
- Song, W.; Cai, W.; Li, J.; Jiang, F.; He, S. Predicting Blood Glucose Levels with EMD and LSTM Based CGM Data. In Proceedings of the 2019 6th International Conference on Systems and Informatics (ICSAI), Shanghai, China, 2–4 November 2019; pp. 1443–1448. [Google Scholar] [CrossRef]
- Jaloli, M.; Cescon, M. Long-Term Prediction of Blood Glucose Levels in Type 1 Diabetes Using a CNN-LSTM-Based Deep Neural Network. J. Diabetes Sci. Technol. 2023, 17, 1590–1601. [Google Scholar] [CrossRef] [PubMed]
- Zhu, T.; Li, K.; Chen, J.; Herrero, P.; Georgiou, P. Dilated Recurrent Neural Networks for Glucose Forecasting in Type 1 Diabetes. J. Healthc. Inform. Res. 2020, 4, 308–324. [Google Scholar] [CrossRef] [PubMed]
- Zhu, T.; Li, K.; Herrero, P.; Georgiou, P. Personalized Blood Glucose Prediction for Type 1 Diabetes Using Evidential Deep Learning and Meta-Learning. IEEE Trans. Biomed. Eng. 2023, 70, 193–204. [Google Scholar] [CrossRef] [PubMed]
- Dudukcu, H.V.; Taskiran, M.; Yildirim, T. Blood glucose prediction with deep neural networks using weighted decision level fusion. Biocybern. Biomed. Eng. 2021, 41, 1208–1223. [Google Scholar] [CrossRef]
- Van Doorn, W.P.T.M.; Foreman, Y.D.; Schaper, N.C.; Savelberg, H.H.C.M.; Koster, A.; van der Kallen, C.J.H.; Wesselius, A.; Schram, M.T.; Henry, R.M.A.; Dagnelie, P.C.; et al. Machine learning-based glucose prediction with use of continuous glucose and physical activity monitoring data: The Maastricht Study. PLoS ONE 2021, 16, e0253125. [Google Scholar] [CrossRef] [PubMed]
- Rabby, M.F.; Tu, Y.; Hossen, M.I.; Lee, I.; Maida, A.S.; Hei, X. Stacked LSTM based deep recurrent neural network with kalman smoothing for blood glucose prediction. BMC Med. Inform. Decis. Mak. 2021, 21, 101. [Google Scholar] [CrossRef] [PubMed]
- Zafar, A.; Lewis, D.M.; Shahid, A. Long-Term Glucose Forecasting for Open-Source Automated Insulin Delivery Systems: A Machine Learning Study with Real-World Variability Analysis. Healthcare 2023, 11, 779. [Google Scholar] [CrossRef] [PubMed]
- Danne, T.; Nimri, R.; Battelino, T.; Bergenstal, R.M.; Close, K.L.; DeVries, J.H.; Garg, S.; Heinemann, L.; Hirsch, I.; Amiel, S.A.; et al. International Consensus on Use of Continuous Glucose Monitoring. Diabetes Care 2017, 40, 1631–1640. [Google Scholar] [CrossRef] [PubMed]
- Battelino, T.; Danne, T.; Bergenstal, R.M.; Amiel, S.A.; Beck, R.; Biester, T.; Bosi, E.; Buckingham, B.A.; Cefalu, W.T.; Close, K.L.; et al. Clinical Targets for Continuous Glucose Monitoring Data Interpretation: Recommendations From the International Consensus on Time in Range. Diabetes Care 2019, 42, 1593–1603. [Google Scholar] [CrossRef]
- Lu, J.; Wang, C.; Shen, Y.; Chen, L.; Zhang, L.; Cai, J.; Lu, W.; Zhu, W.; Hu, G.; Xia, T.; et al. Time in Range in Relation to All-Cause and Cardiovascular Mortality in Patients With Type 2 Diabetes: A Prospective Cohort Study. Diabetes Care 2021, 44, 549–555. [Google Scholar] [CrossRef]
- Raj, R.; Mishra, R.; Jha, N.; Joshi, V.; Correa, R.; Kern, P.A. Time in range, as measured by continuous glucose monitor, as a predictor of microvascular complications in type 2 diabetes: A systematic review. BMJ Open Diabetes Res. Care 2022, 10, e002573. [Google Scholar] [CrossRef] [PubMed]
- El Malahi, A.; Van Elsen, M.; Charleer, S.; Dirinck, E.; Ledeganck, K.; Keymeulen, B.; Crenier, L.; Radermecker, R.; Taes, Y.; Vercammen, C.; et al. Relationship Between Time in Range, Glycemic Variability, HbA1c, and Complications in Adults With Type 1 Diabetes Mellitus. J. Clin. Endocrinol. Metab. 2022, 107, e570–e581. [Google Scholar] [CrossRef]
- Monnier, L.; Colette, C.; Owens, D. Glucose variability and diabetes complications: Risk factor or biomarker? Can we disentangle the "Gordian Knot"? Diabetes Metab. 2021, 47, 101225. [Google Scholar] [CrossRef] [PubMed]
- Klimontov, V.V.; Saik, O.V.; Korbut, A.I. Glucose Variability: How Does It Work? Int. J. Mol. Sci. 2021, 22, 7783. [Google Scholar] [CrossRef] [PubMed]
- Hahnloser, R.H.; Sarpeshkar, R.; Mahowald, M.A.; Douglas, R.J.; Seung, H.S. Digital selection and analogue amplification coexist in a cortex-inspired silicon circuit. Nature 2000, 405, 947–951. [Google Scholar] [CrossRef]
- Goodfellow, I.; Bengio, Y.; Courville, A. Deep Learning; The MIT Press: Cambridge, MA, USA, 2016; 800 p. [Google Scholar]
- Albawi, S.; Mohammed, T.; Al-Zawi, S. Understanding of a convolutional neural network. In Proceedings of the International Conference on Engineering and Technology (ICET), Antalya, Turkey, 21–23 August 2017; IEEE: Piscataway, NJ, USA, 2017; pp. 1–6. [Google Scholar]
- Breiman, L. Random forests. Mach. Learn. 2001, 45, 5–32. [Google Scholar] [CrossRef]
- Friedman, J.H. Stochastic gradient boosting. Comput. Stat. Data Anal. 2002, 38, 367–378. [Google Scholar] [CrossRef]
- Guemes, A.; Cappon, G.; Hernandez, B.; Reddy, M.; Oliver, N.; Georgiou, P.; Herrero, P. Predicting Quality of Overnight Glycaemic Control in Type 1 Diabetes Using Binary Classifiers. IEEE J. Biomed. Health Inform. 2020, 24, 1439–1446. [Google Scholar] [CrossRef]


| Model | Layers | Layer Dimensions |
|---|---|---|
| MLP 1 | Fully connected + ReLU | [n_input, 64] |
| Fully connected + Softmax | [64, 3] | |
| MLP 2 | Fully connected + ReLU | [n_input, 64] |
| Fully connected + ReLU | [64, 128] | |
| Fully connected + Softmax | [128, 3] | |
| MLP 3 | Fully connected + ReLU | [n_input, 64] |
| Fully connected + ReLU | [64, 128] | |
| Fully connected + ReLU | [128, 128] | |
| Fully connected + Softmax | [128, 3] | |
| MLP 4 | Fully connected + ReLU | [n_input, 64] |
| Fully connected + ReLU | [64, 128] | |
| Fully connected + ReLU | [128, 128] | |
| Fully connected + ReLU | [128, 64] | |
| Fully connected + Softmax | [64, 3] |
| CNN 1 | CNN 2 | CNN 3 | CNN 4 |
|---|---|---|---|
| Conv1d(1,32,3) | Conv1d(1,32,3) | Conv1d(1,32,3) | Conv1d(1,32,3) |
| BatchNorm | BatchNorm | BatchNorm | BatchNorm |
| ReLU | ReLU | ReLU | ReLU |
| Conv1d(8,16,3) | Conv1d(8,16,3) | Conv1d(8,16,3) | Conv1d(8,16,3) |
| BatchNorm | BatchNorm | BatchNorm | BatchNorm |
| ReLU | ReLU | ReLU | ReLU |
| Conv1d(16,32,3) | Conv1d(16,32,3) | Conv1d(16,32,3) | Conv1d(16,32,3) |
| BatchNorm | BatchNorm | BatchNorm | BatchNorm |
| ReLU | ReLU | ReLU | ReLU |
| Conv1d(32,64,3) | Conv1d(32,64,3) | Conv1d(32,64,3) | Conv1d(32,64,3) |
| BatchNorm | BatchNorm | BatchNorm | BatchNorm |
| ReLU | ReLU | ReLU | ReLU |
| AveragePooling1d | Conv1d(64,128,3) | Conv1d(64,128,3) | Conv1d(64,128,3) |
| BatchNorm | BatchNorm | BatchNorm | |
| ReLU | ReLU | ReLU | |
| Fully connected(64,3) + Softmax | AveragePooling1d | Conv1d(128,256,3) | Conv1d(128,256,3) |
| BatchNorm | BatchNorm | ||
| ReLU | ReLU | ||
| Fully connected(128,3) + Softmax | AveragePooling1d | Conv1d(256,512,3) BatchNorm ReLU | |
| Fully connected(256,3) + Softmax | AveragePooling1d | ||
| Fully connected(512,3) + Softmax |
| Metric | Formula |
|---|---|
| Parameter | Training Sample (N = 306) | Test Sample (N = 74) | p |
|---|---|---|---|
| Sex, m/f, n (%) | 108 (35.3)/198 (64.7) | 30 (40.5)/44 (59.5) | 0.40 |
| Age, years | 36 (27; 49) | 36 (28; 50) | 0.73 |
| Body mass index, kg/m2 | 23.9 (21.4; 27.4) | 23.3 (21.2; 25.9) | 0.26 |
| Diabetes duration, years | 16 (10; 25) | 15 (8; 28) | 0.85 |
| Insulin dose, IU/kg/day | 0.7 (0.54; 0.83) | 0.6 (0.5; 0.85) | 0.42 |
| Basal insulin dose, IU/kg/day | 0.28 (0.21; 0.38) | 0.25 (0.21; 0.33) | 0.06 |
| Diabetic retinopathy, n (%) | 182 (59.5) | 43 (56.3) | 0.83 |
| Chronic kidney disease, n (%) | 206 (67.3) | 52 (70.3) | 0.63 |
| Arterial hypertension, n (%) | 118 (38.6) | 35 (47.3) | 0.17 |
| Coronary artery disease, n (%) | 23 (7.5) | 5 (6.8) | 0.82 |
| Neuropathy, n (%) | 205 (67) | 49 (66.2) | 0.9 |
| Impaired awareness of hypoglycemia, n (%) | 114 (37.3) | 21 (28.4) | 0.15 |
| HbA1c, % | 8.1 (7.1; 9.2) | 7.7 (6.9; 8.9) | 0.34 |
| HbA1c, mmol/mol | 64.8 (53.7; 76.5) | 60.3 (52.2; 74.4) | 0.34 |
| Total cholesterol, mmol/L | 5.0 (4.2; 5.9) | 5.1 (4.4; 5.8) | 0.91 |
| Triglycerides, mmol/L | 82 (73; 93) | 79 (75; 95) | 0.92 |
| Serum creatinine, µmol/L | 88 (72; 99) | 85 (74; 97) | 0.58 |
| eGFR, mL/min/1.73 m2 | 0.5 (0.3; 1.1) | 0.6 (0.3; 1.6) | 0.85 |
| UACR, mg/mmol | 16 (10; 25) | 15 (8; 28) | 0.85 |
| Model | Target Glucose Range (3.9–10 mmol/L, or 70–180 mg/dL) | Above Target Glucose Range (>10 mmol/L, or >180 mg/dL) | Below Target Glucose Range (<3.9 mmol/L, or <70 mg/dL) | ||||||
|---|---|---|---|---|---|---|---|---|---|
| Precision | Recall | F1 | Precision | Recall | F1 | Precision | Recall | F1 | |
| MLP 1 | 98 | 95 | 96 | 90 | 97 | 93 | 77 | 91 | 83 |
| MLP 2 | 98 | 98 | 98 | 96 | 97 | 96 | 87 | 86 | 86 |
| MLP 3 | 99 | 98 | 98 | 96 | 97 | 96 | 84 | 88 | 86 |
| MLP 4 | 99 | 98 | 98 | 96 | 97 | 96 | 84 | 88 | 86 |
| CNN 1 | 99 | 97 | 98 | 94 | 97 | 95 | 74 | 86 | 80 |
| CNN 2 | 98 | 98 | 98 | 97 | 97 | 97 | 80 | 87 | 83 |
| CNN 3 | 99 | 98 | 98 | 95 | 97 | 96 | 80 | 88 | 84 |
| CNN 4 | 98 | 98 | 98 | 97 | 96 | 96 | 82 | 89 | 85 |
| RF | 99 | 97 | 98 | 97 | 97 | 97 | 82 | 88 | 85 |
| GBTs | 99 | 98 | 98 | 96 | 98 | 97 | 78 | 94 | 85 |
| PH | 15 min | 30 min | 45 min | 60 min | 75 min |
|---|---|---|---|---|---|
| CNN 4 | |||||
| LBW = 15 min | 97 | 93 | 90 | 87 | 85 |
| LBW = 30 min | 97 | 93 | 91 | 88 | 86 |
| LBW = 45 min | 97 | 93 | 90 | 88 | 86 |
| LBW = 60 min | 97 | 93 | 89 | 87 | 86 |
| LBW = 75 min | 97 | 93 | 90 | 87 | 86 |
| GBTs | |||||
| LBW = 15 min | 98 | 93 | 89 | 86 | 84 |
| LBW = 30 min | 97 | 92 | 89 | 87 | 85 |
| LBW = 45 min | 97 | 93 | 89 | 87 | 85 |
| LBW = 60 min | 97 | 92 | 89 | 86 | 85 |
| LBW = 75 min | 97 | 92 | 89 | 87 | 85 |
Disclaimer/Publisher’s Note: The statements, opinions and data contained in all publications are solely those of the individual author(s) and contributor(s) and not of MDPI and/or the editor(s). MDPI and/or the editor(s) disclaim responsibility for any injury to people or property resulting from any ideas, methods, instructions or products referred to in the content. |
© 2024 by the authors. Licensee MDPI, Basel, Switzerland. This article is an open access article distributed under the terms and conditions of the Creative Commons Attribution (CC BY) license (https://creativecommons.org/licenses/by/4.0/).
Share and Cite
Kozinetz, R.M.; Berikov, V.B.; Semenova, J.F.; Klimontov, V.V. Machine Learning and Deep Learning Models for Nocturnal High- and Low-Glucose Prediction in Adults with Type 1 Diabetes. Diagnostics 2024, 14, 740. https://doi.org/10.3390/diagnostics14070740
Kozinetz RM, Berikov VB, Semenova JF, Klimontov VV. Machine Learning and Deep Learning Models for Nocturnal High- and Low-Glucose Prediction in Adults with Type 1 Diabetes. Diagnostics. 2024; 14(7):740. https://doi.org/10.3390/diagnostics14070740
Chicago/Turabian StyleKozinetz, Roman M., Vladimir B. Berikov, Julia F. Semenova, and Vadim V. Klimontov. 2024. "Machine Learning and Deep Learning Models for Nocturnal High- and Low-Glucose Prediction in Adults with Type 1 Diabetes" Diagnostics 14, no. 7: 740. https://doi.org/10.3390/diagnostics14070740
APA StyleKozinetz, R. M., Berikov, V. B., Semenova, J. F., & Klimontov, V. V. (2024). Machine Learning and Deep Learning Models for Nocturnal High- and Low-Glucose Prediction in Adults with Type 1 Diabetes. Diagnostics, 14(7), 740. https://doi.org/10.3390/diagnostics14070740