
Short- and Long-Term Chest-CT Findings after Recovery from COVID-19: A Systematic Review and Meta-Analysis


Abstract
1. Introduction
2. Materials and Methods
2.1. Protocol and Registration
2.2. Eligibility Criteria
2.3. Search Strategy
2.4. Data Extraction
2.5. Meta-Analysis
2.5.1. Data Processing
2.5.2. Statistical Analysis
2.6. Quality Assessment
3. Results
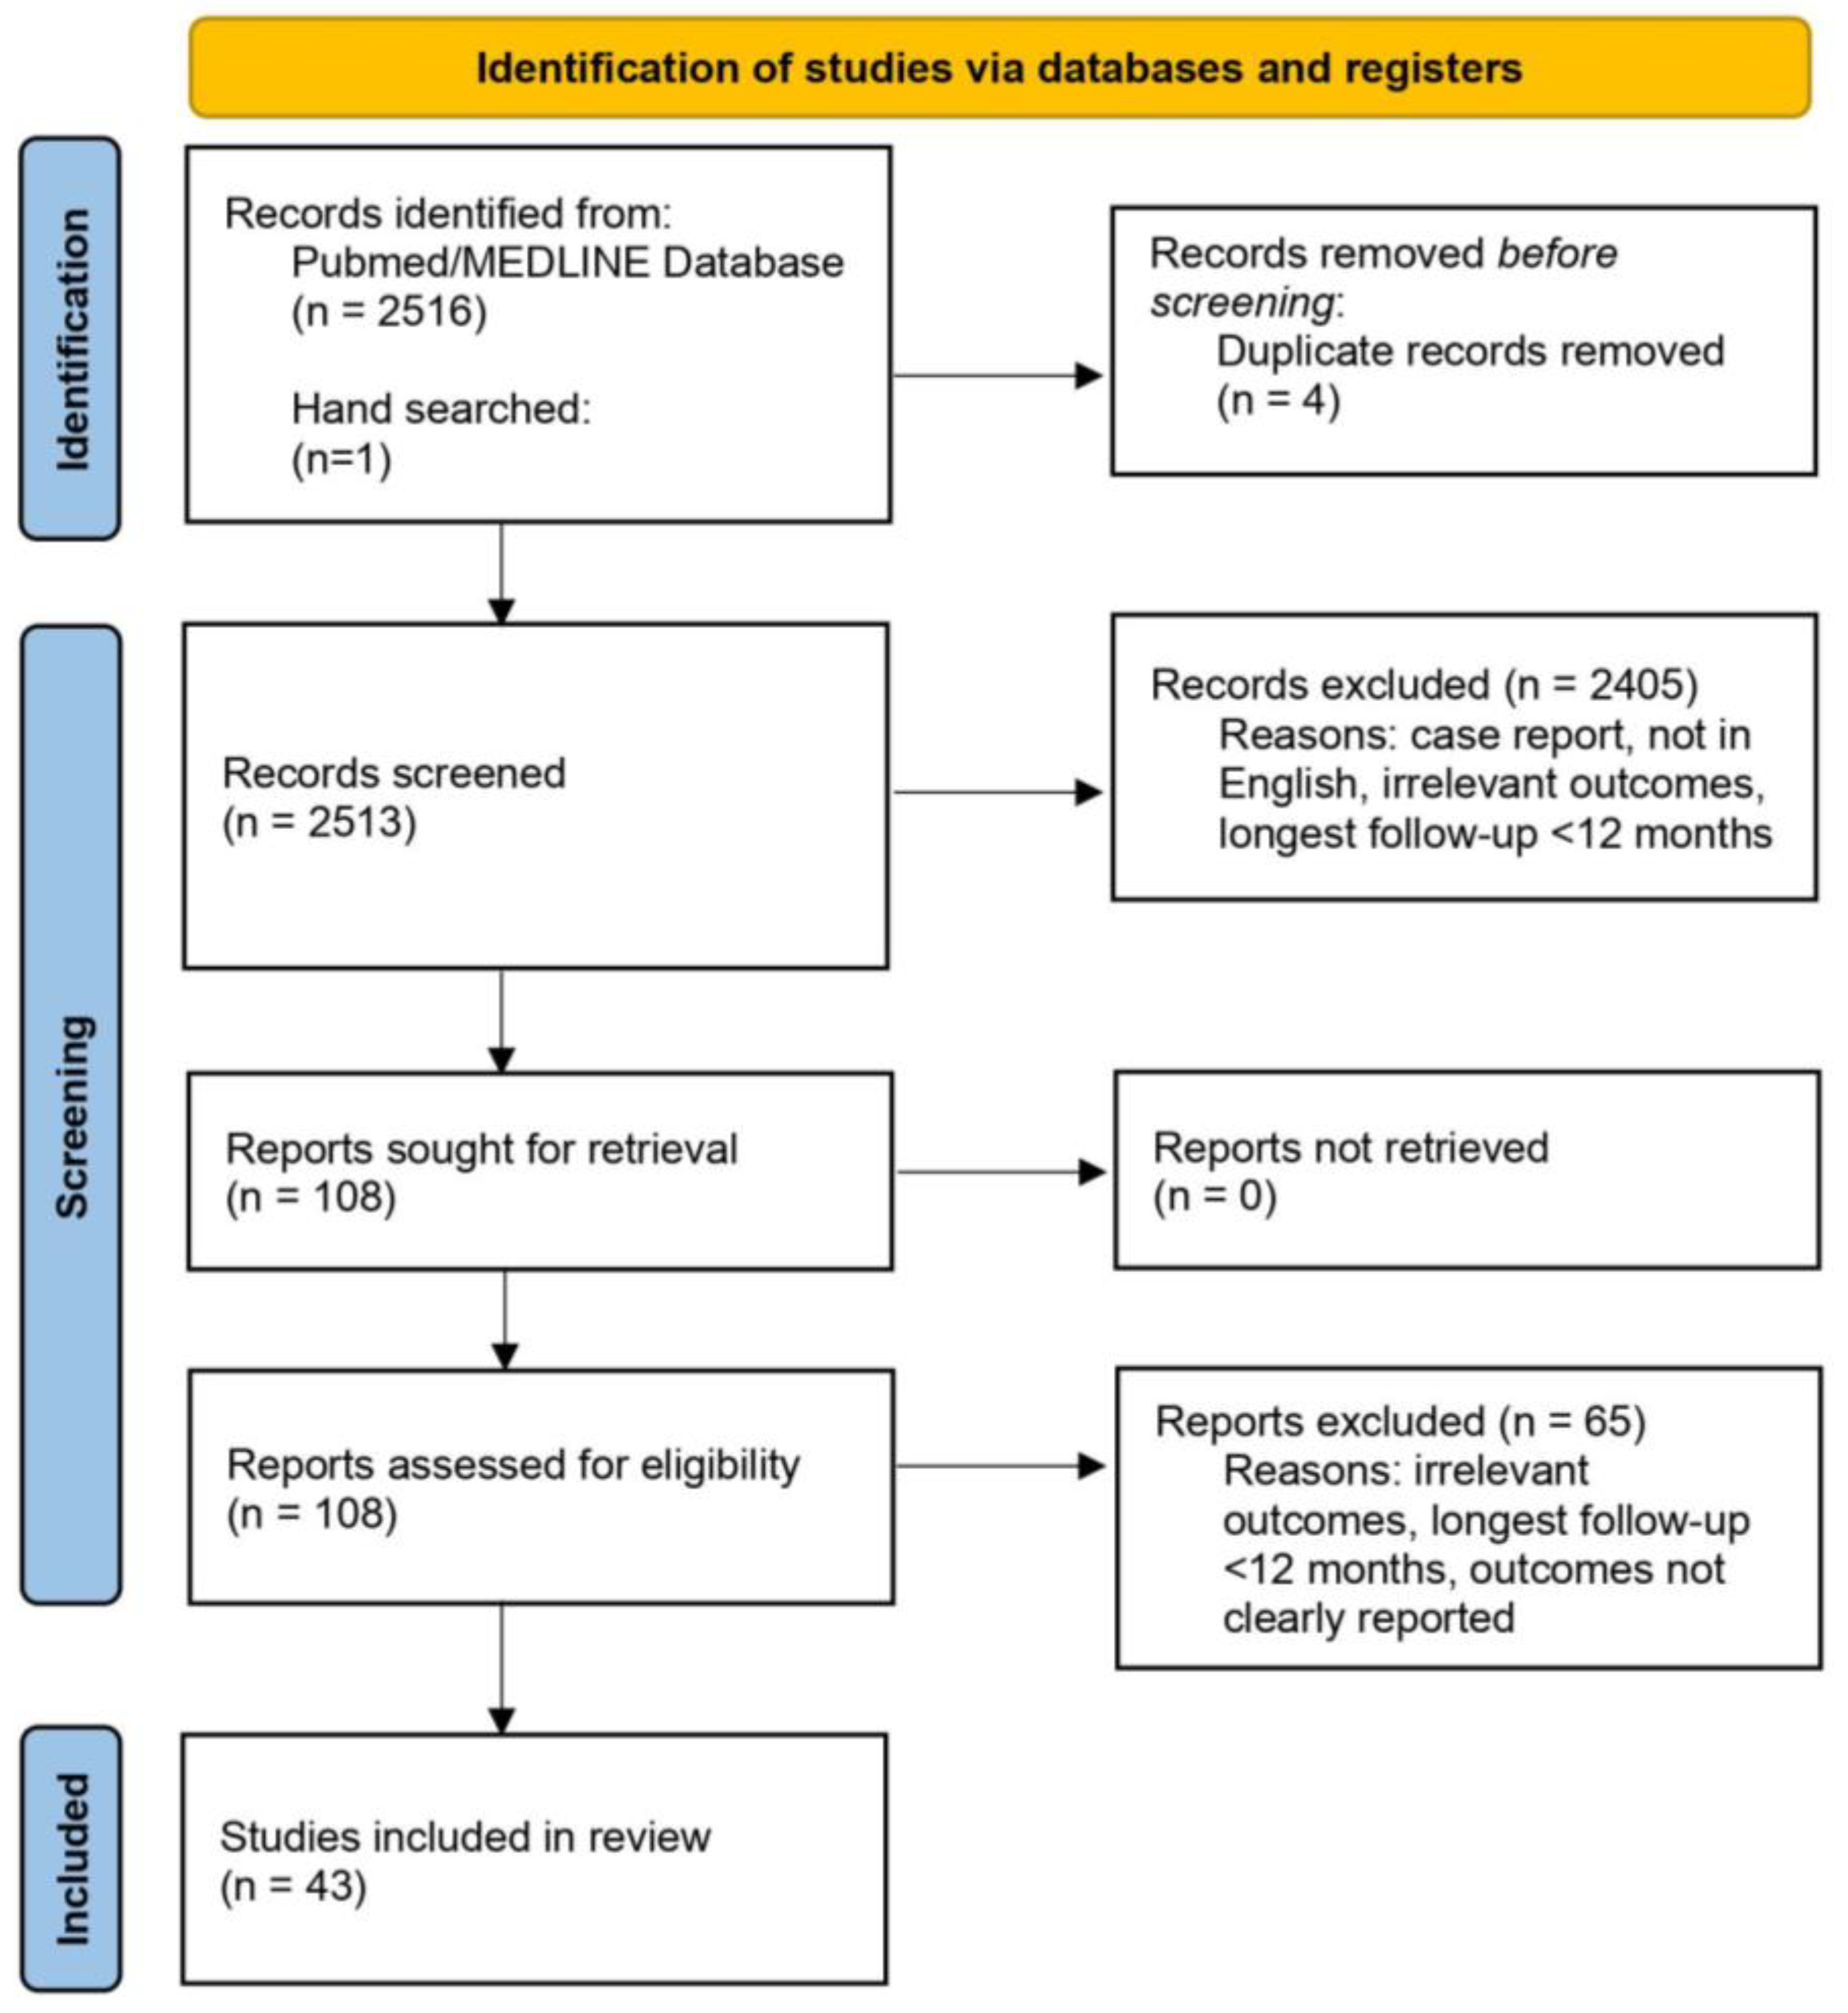
3.1. Study Selection and Characteristics
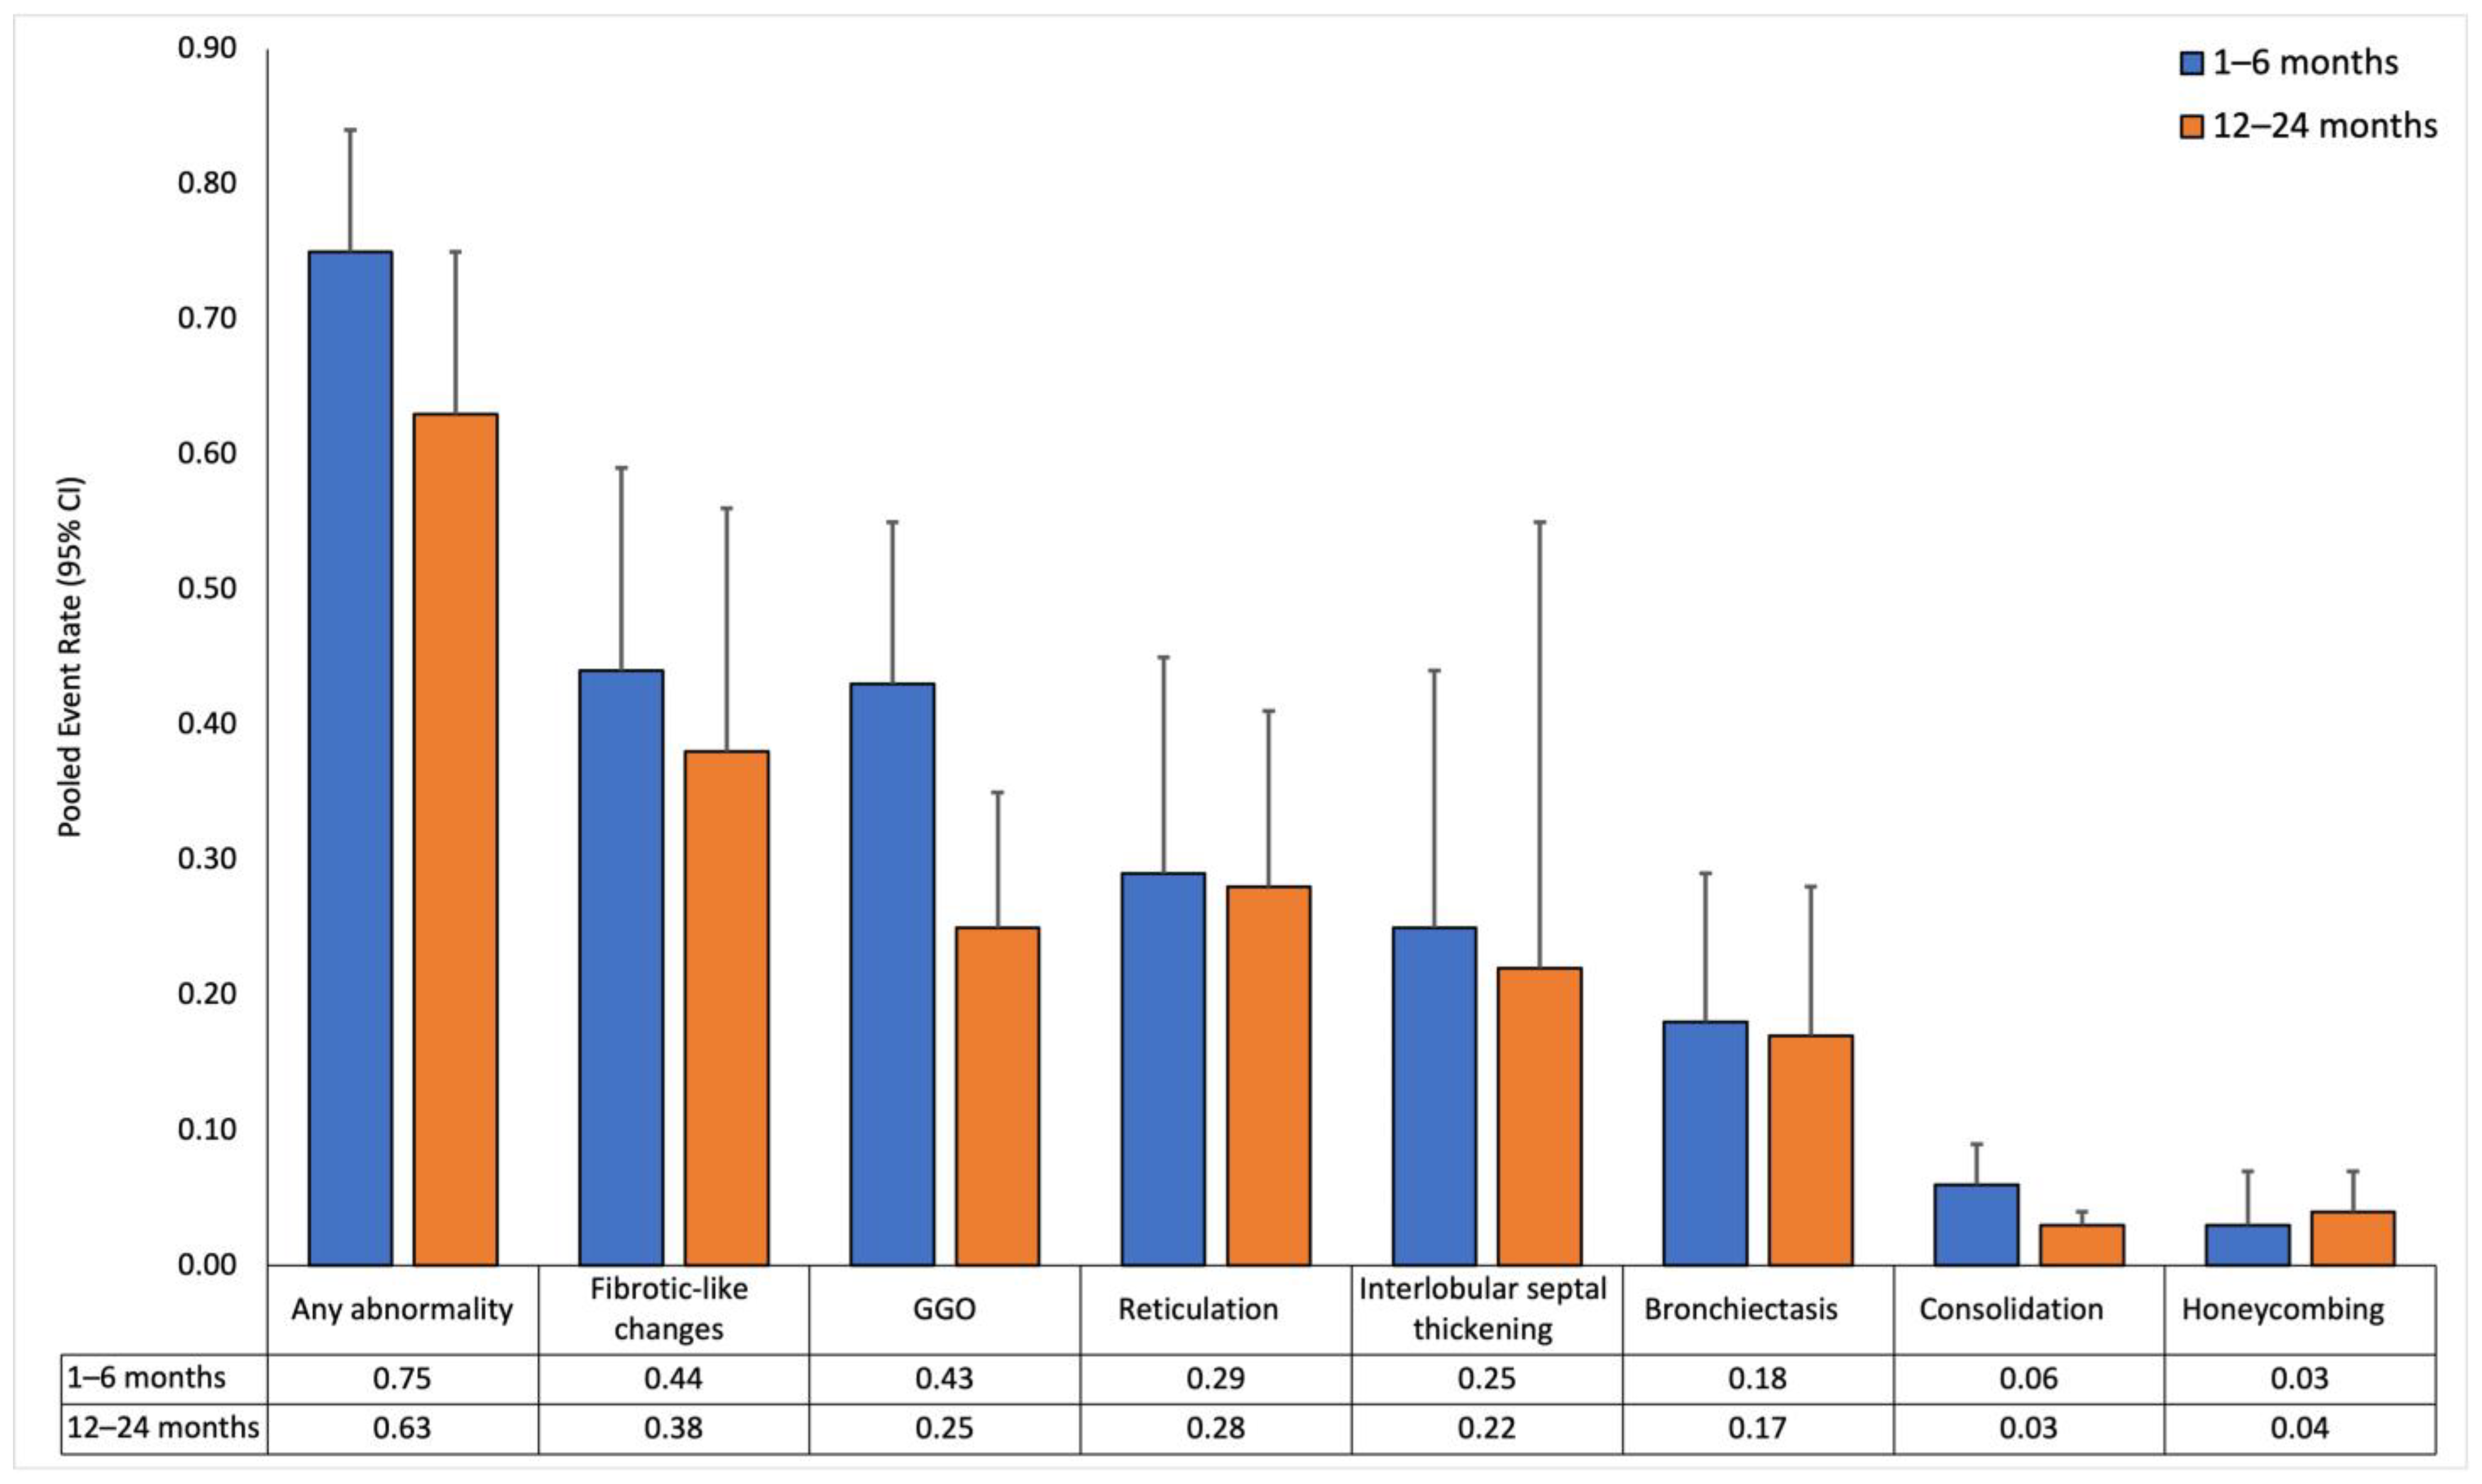
3.2. Pooled Event Rates of Follow-Up Chest-CT Lung Abnormalities over Time for Entire Population
3.2.1. Short-Term Follow-Up (1 to 6 Months)
3.2.2. Long-Term Follow-Up (12 to 24 Months)
3.2.3. Temporal Trends in Chest-CT Lung Abnormalities
3.3. Pooled Event Rates of Follow-Up Chest-CT Lung Abnormalities over Time with COVID-19 Severity as the Mediator
3.3.1. Non-Severe Subgroup
3.3.2. Severe Subgroup
3.3.3. Comparison between Severity Subgroups
3.4. Quality Assessment
4. Discussion
5. Conclusions
Supplementary Materials
Author Contributions
Funding
Institutional Review Board Statement
Informed Consent Statement
Data Availability Statement
Conflicts of Interest
References
- Filip, R.; Gheorghita Puscaselu, R.; Anchidin-Norocel, L.; Dimian, M.; Savage, W.K. Global Challenges to Public Health Care Systems during the COVID-19 Pandemic: A Review of Pandemic Measures and Problems. J. Pers. Med. 2022, 12, 1295. [Google Scholar] [CrossRef]
- Bowe, B.; Xie, Y.; Al-Aly, Z. Postacute sequelae of COVID-19 at 2 years. Nat. Med. 2023, 29, 2347–2357. [Google Scholar] [CrossRef]
- Davis, H.E.; McCorkell, L.; Vogel, J.M.; Topol, E.J. Long COVID: Major findings, mechanisms and recommendations. Nat. Rev. Microbiol. 2023, 21, 133–146. [Google Scholar] [CrossRef]
- Lippi, G.; Sanchis-Gomar, F.; Henry, B.M. COVID-19 and its long-term sequelae: What do we know in 2023? Pol. Arch. Intern. Med. 2023, 133, 16402. [Google Scholar] [CrossRef]
- Lai, C.C.; Hsu, C.K.; Yen, M.Y.; Lee, P.I.; Ko, W.C.; Hsueh, P.R. Long COVID: An inevitable sequela of SARS-CoV-2 infection. J. Microbiol. Immunol. Infect. 2023, 56, 1–9. [Google Scholar] [CrossRef]
- Chen, C.; Haupert, S.R.; Zimmermann, L.; Shi, X.; Fritsche, L.G.; Mukherjee, B. Global Prevalence of Post-Coronavirus Disease 2019 (COVID-19) Condition or Long COVID: A Meta-Analysis and Systematic Review. J. Infect. Dis. 2022, 226, 1593–1607. [Google Scholar] [CrossRef]
- Yong, S.J. Long COVID or post-COVID-19 syndrome: Putative pathophysiology, risk factors, and treatments. Infect. Dis. 2021, 53, 737–754. [Google Scholar] [CrossRef]
- Bazdar, S.; Kwee, A.; Houweling, L.; de Wit-van Wijck, Y.; Mohamed Hoesein, F.A.A.; Downward, G.S.; Nossent, E.J.; Maitland-van der Zee, A.H. A Systematic Review of Chest Imaging Findings in Long COVID Patients. J. Pers. Med. 2023, 13, 282. [Google Scholar] [CrossRef] [PubMed]
- Michelen, M.; Manoharan, L.; Elkheir, N.; Cheng, V.; Dagens, A.; Hastie, C.; O’Hara, M.; Suett, J.; Dahmash, D.; Bugaeva, P.; et al. Characterising long COVID: A living systematic review. BMJ Glob. Health 2021, 6, e005427. [Google Scholar] [CrossRef] [PubMed]
- Crook, H.; Raza, S.; Nowell, J.; Young, M.; Edison, P. Long COVID-mechanisms, risk factors, and management. BMJ 2021, 374, n1648. [Google Scholar] [CrossRef] [PubMed]
- George, P.M.; Barratt, S.L.; Condliffe, R.; Desai, S.R.; Devaraj, A.; Forrest, I.; Gibbons, M.A.; Hart, N.; Jenkins, R.G.; McAuley, D.F.; et al. Respiratory follow-up of patients with COVID-19 pneumonia. Thorax 2020, 75, 1009–1016. [Google Scholar] [CrossRef]
- Lu, J.Q.; Lu, J.Y.; Wang, W.; Liu, Y.; Buczek, A.; Fleysher, R.; Hoogenboom, W.S.; Zhu, W.; Hou, W.; Rodriguez, C.J.; et al. Clinical predictors of acute cardiac injury and normalization of troponin after hospital discharge from COVID-19. eBioMedicine 2022, 76, 103821. [Google Scholar] [CrossRef] [PubMed]
- Lu, J.Y.; Wilson, J.; Hou, W.; Fleysher, R.; Herold, B.C.; Herold, K.C.; Duong, T.Q. Incidence of new-onset in-hospital and persistent diabetes in COVID-19 patients: Comparison with influenza. eBioMedicine 2023, 90, 104487. [Google Scholar] [CrossRef] [PubMed]
- Zhang, V.; Fisher, M.; Hou, W.; Zhang, L.; Duong, T.Q. Incidence of New-Onset Hypertension Post-COVID-19: Comparison With Influenza. Hypertension 2023, 80, 2135–2148. [Google Scholar] [CrossRef] [PubMed]
- Shrestha, D.B.; Budhathoki, P.; Raut, S.; Adhikari, S.; Ghimire, P.; Thapaliya, S.; Rabaan, A.A.; Karki, B.J. New-onset diabetes in COVID-19 and clinical outcomes: A systematic review and meta-analysis. World J. Virol. 2021, 10, 275–287. [Google Scholar] [CrossRef] [PubMed]
- Sathish, T.; Anton, M.C.; Sivakumar, T. New-onset diabetes in “long COVID”. J. Diabetes 2021, 13, 693–694. [Google Scholar] [CrossRef] [PubMed]
- Rubino, F.; Amiel, S.A.; Zimmet, P.; Alberti, G.; Bornstein, S.; Eckel, R.H.; Mingrone, G.; Boehm, B.; Cooper, M.E.; Chai, Z.; et al. New-Onset Diabetes in COVID-19. N. Engl. J. Med. 2020, 383, 789–790. [Google Scholar] [CrossRef] [PubMed]
- Xie, Y.; Al-Aly, Z. Risks and burdens of incident diabetes in long COVID: A cohort study. Lancet Diabetes Endocrinol. 2022, 10, 311–321. [Google Scholar] [CrossRef]
- Xu, A.Y.; Wang, S.H.; Duong, T.Q. Patients with prediabetes are at greater risk of developing diabetes 5 months postacute SARS-CoV-2 infection: A retrospective cohort study. BMJ Open Diabetes Res. Care 2023, 11, e003257. [Google Scholar] [CrossRef]
- Lu, J.Y.; Boparai, M.S.; Shi, C.; Henninger, E.M.; Rangareddy, M.; Veeraraghavan, S.; Mirhaji, P.; Fisher, M.C.; Duong, T.Q. Long-term outcomes of COVID-19 survivors with hospital AKI: Association with time to recovery from AKI. Nephrol. Dial. Transplant. 2023, 38, 2160–2169. [Google Scholar] [CrossRef]
- Akbarialiabad, H.; Taghrir, M.H.; Abdollahi, A.; Ghahramani, N.; Kumar, M.; Paydar, S.; Razani, B.; Mwangi, J.; Asadi-Pooya, A.A.; Malekmakan, L.; et al. Long COVID, a comprehensive systematic scoping review. Infection 2021, 49, 1163–1186. [Google Scholar] [CrossRef] [PubMed]
- Jalaber, C.; Lapotre, T.; Morcet-Delattre, T.; Ribet, F.; Jouneau, S.; Lederlin, M. Chest CT in COVID-19 pneumonia: A review of current knowledge. Diagn. Interv. Imaging 2020, 101, 431–437. [Google Scholar] [CrossRef]
- Xu, X.; Yu, C.; Qu, J.; Zhang, L.; Jiang, S.; Huang, D.; Chen, B.; Zhang, Z.; Guan, W.; Ling, Z.; et al. Imaging and clinical features of patients with 2019 novel coronavirus SARS-CoV-2. Eur. J. Nucl. Med. Mol. Imaging 2020, 47, 1275–1280. [Google Scholar] [CrossRef] [PubMed]
- Ullah, N.; Khan, J.A.; El-Sappagh, S.; El-Rashidy, N.; Khan, M.S. A Holistic Approach to Identify and Classify COVID-19 from Chest Radiographs, ECG, and CT-Scan Images Using ShuffleNet Convolutional Neural Network. Diagnostics 2023, 13, 162. [Google Scholar] [CrossRef] [PubMed]
- Ullah, N.; Khan, J.A.; Almakdi, S.; Khan, M.S.; Alshehri, M.; Alboaneen, D.; Raza, A. A Novel CovidDetNet Deep Learning Model for Effective COVID-19 Infection Detection Using Chest Radiograph Images. Appl. Sci. 2022, 12, 6269. [Google Scholar] [CrossRef]
- Hussain, L.; Nguyen, T.; Li, H.; Abbasi, A.A.; Lone, K.J.; Zhao, Z.; Zaib, M.; Chen, A.; Duong, T.Q. Machine-learning classification of texture features of portable chest X-ray accurately classifies COVID-19 lung infection. Biomed. Eng. Online 2020, 19, 88. [Google Scholar] [CrossRef] [PubMed]
- Sailunaz, K.; Ozyer, T.; Rokne, J.; Alhajj, R. A survey of machine learning-based methods for COVID-19 medical image analysis. Med. Biol. Eng. Comput. 2023, 61, 1257–1297. [Google Scholar] [CrossRef]
- Majrashi, N.A.A. The value of chest X-ray and CT severity scoring systems in the diagnosis of COVID-19: A review. Front. Med. 2022, 9, 1076184. [Google Scholar] [CrossRef]
- Cohen, J.P.; Morrison, P.; Dao, L.; Roth, K.; Duong, T.Q.; Ghassemi, M. COVID-19 image data collection: Prospective predictions are the future. J. Mach. Learn. Biomed. Imaging (MELBA) 2020, 2, 1–38. [Google Scholar] [CrossRef]
- Cohen, J.P.; Dao, L.; Roth, K.; Morrison, P.; Bengio, Y.; Abbasi, A.F.; Shen, B.; Mahsa, H.K.; Ghassemi, M.; Li, H.; et al. Predicting COVID-19 Pneumonia Severity on Chest X-ray With Deep Learning. Cureus 2020, 12, e9448. [Google Scholar] [CrossRef]
- Eligulashvili, A.; Darrell, M.; Miller, C.; Lee, J.; Congdon, S.; Lee, J.S.; Hsu, K.; Yee, J.; Hou, W.; Islam, M.; et al. COVID-19 Patients in the COVID-19 Recovery and Engagement (CORE) Clinics in the Bronx. Diagnostics 2022, 13, 119. [Google Scholar] [CrossRef]
- Kikkisetti, S.; Zhu, J.; Shen, B.; Li, H.; Duong, T.Q. Deep-learning convolutional neural networks with transfer learning accurately classify COVID-19 lung infection on portable chest radiographs. PeerJ 2020, 8, e10309. [Google Scholar] [CrossRef] [PubMed]
- Shen, B.; Hoshmand-Kochi, M.; Abbasi, A.; Glass, S.; Jiang, Z.; Singer, A.J.; Thode, H.C.; Li, H.; Hou, W.; Duong, T.Q. Initial chest radiograph scores inform COVID-19 status, intensive care unit admission and need for mechanical ventilation. Clin. Radiol. 2021, 76, 473.e1–473.e7. [Google Scholar] [CrossRef]
- Zhu, J.; Shen, B.; Abbasi, A.; Hoshmand-Kochi, M.; Li, H.; Duong, T.Q. Deep transfer learning artificial intelligence accurately stages COVID-19 lung disease severity on portable chest radiographs. PLoS ONE 2020, 15, e0236621. [Google Scholar] [CrossRef]
- Duanmu, H.; Ren, T.; Li, H.; Mehta, N.; Singer, A.J.; Levsky, J.M.; Lipton, M.L.; Duong, T.Q. Deep learning of longitudinal chest X-ray and clinical variables predicts duration on ventilator and mortality in COVID-19 patients. Biomed. Eng. Online 2022, 21, 77. [Google Scholar] [CrossRef] [PubMed]
- Ye, Z.; Zhang, Y.; Wang, Y.; Huang, Z.; Song, B. Chest CT manifestations of new coronavirus disease 2019 (COVID-19): A pictorial review. Eur. Radiol. 2020, 30, 4381–4389. [Google Scholar] [CrossRef]
- Li, J.; Yan, R.; Zhai, Y.; Qi, X.; Lei, J. Chest CT findings in patients with coronavirus disease 2019 (COVID-19): A comprehensive review. Diagn. Interv. Radiol. 2021, 27, 621–632. [Google Scholar] [CrossRef] [PubMed]
- Bocchino, M.; Rea, G.; Capitelli, L.; Lieto, R.; Bruzzese, D. Chest CT Lung Abnormalities 1 Year after COVID-19: A Systematic Review and Meta-Analysis. Radiology 2023, 308, e230535. [Google Scholar] [CrossRef]
- Guinto, E.; Gerayeli, F.V.; Eddy, R.L.; Lee, H.; Milne, S.; Sin, D.D. Post-COVID-19 dyspnoea and pulmonary imaging: A systematic review and meta-analysis. Eur. Respir. Rev. 2023, 32, 220253. [Google Scholar] [CrossRef]
- Watanabe, A.; So, M.; Iwagami, M.; Fukunaga, K.; Takagi, H.; Kabata, H.; Kuno, T. One-year follow-up CT findings in COVID-19 patients: A systematic review and meta-analysis. Respirology 2022, 27, 605–616. [Google Scholar] [CrossRef]
- Lee, J.H.; Yim, J.J.; Park, J. Pulmonary function and chest computed tomography abnormalities 6-12 months after recovery from COVID-19: A systematic review and meta-analysis. Respir. Res. 2022, 23, 233. [Google Scholar] [CrossRef]
- Page, M.J.; McKenzie, J.E.; Bossuyt, P.M.; Boutron, I.; Hoffmann, T.C.; Mulrow, C.D.; Shamseer, L.; Tetzlaff, J.M.; Akl, E.A.; Brennan, S.E.; et al. The PRISMA 2020 statement: An updated guideline for reporting systematic reviews. BMJ 2021, 372, n71. [Google Scholar] [CrossRef]
- Covidence Systematic Review Software. Available online: www.covidence.org (accessed on 23 May 2023).
- COVID-19 Treatment Guidelines Panel. Coronavirus Disease 2019 (COVID-19) Treatment Guidelines. Available online: https://www.covid19treatmentguidelines.nih.gov/ (accessed on 25 January 2024).
- Hoy, D.; Brooks, P.; Woolf, A.; Blyth, F.; March, L.; Bain, C.; Baker, P.; Smith, E.; Buchbinder, R. Assessing risk of bias in prevalence studies: Modification of an existing tool and evidence of interrater agreement. J. Clin. Epidemiol. 2012, 65, 934–939. [Google Scholar] [CrossRef] [PubMed]
- Barini, M.; Percivale, I.; Danna, P.; Longo, V.; Costantini, P.; Paladini, A.; Airoldi, C.; Bellan, M.; Saba, L.; Carriero, A. 18 months computed tomography follow-up after COVID-19 interstitial pneumonia. J. Public Health Res. 2022, 11, 2782. [Google Scholar] [CrossRef] [PubMed]
- Bellan, M.; Baricich, A.; Patrucco, F.; Zeppegno, P.; Gramaglia, C.; Balbo, P.E.; Carriero, A.; Amico, C.S.; Avanzi, G.C.; Barini, M.; et al. Long-term sequelae are highly prevalent one year after hospitalization for severe COVID-19. Sci. Rep. 2021, 11, 22666. [Google Scholar] [CrossRef] [PubMed]
- Bernardinello, N.; Cocconcelli, E.; Giraudo, C.; Daverio, M.; Castelli, G.; Petrarulo, S.; Bovo, M.; Fichera, G.; Cavinato, S.; Cattelan, A.M.; et al. Predictors of pulmonary sequelae after COVID-19 pneumonia: A 12-month follow-up study. Front. Med. 2023, 10, 1084002. [Google Scholar] [CrossRef] [PubMed]
- Bocchino, M.; Lieto, R.; Romano, F.; Sica, G.; Bocchini, G.; Muto, E.; Capitelli, L.; Sequino, D.; Valente, T.; Fiorentino, G.; et al. Chest CT-based Assessment of 1-year Outcomes after Moderate COVID-19 Pneumonia. Radiology 2022, 305, 479–485. [Google Scholar] [CrossRef] [PubMed]
- Bongiovanni, M.; Barilaro, G.; Bini, F. Twelve-month clinical, functional, and radiological outcomes in patients hospitalized for SARS-CoV-2 pneumonia. J. Med. Virol. 2023, 95, e28524. [Google Scholar] [CrossRef]
- Chen, Y.; Ding, C.; Yu, L.; Guo, W.; Feng, X.; Yu, L.; Su, J.; Xu, T.; Ren, C.; Shi, D.; et al. One-year follow-up of chest CT findings in patients after SARS-CoV-2 infection. BMC Med. 2021, 19, 191. [Google Scholar] [CrossRef]
- Corsi, A.; Caroli, A.; Bonaffini, P.A.; Conti, C.; Arrigoni, A.; Mercanzin, E.; Imeri, G.; Anelli, M.; Balbi, M.; Pace, M.; et al. Structural and Functional Pulmonary Assessment in Severe COVID-19 Survivors at 12 Months after Discharge. Tomography 2022, 8, 2588–2603. [Google Scholar] [CrossRef]
- Eberst, G.; Claudé, F.; Laurent, L.; Meurisse, A.; Roux-Claudé, P.; Barnig, C.; Vernerey, D.; Paget-Bailly, S.; Bouiller, K.; Chirouze, C.; et al. Result of one-year, prospective follow-up of intensive care unit survivors after SARS-CoV-2 pneumonia. Ann. Intensive Care 2022, 12, 23. [Google Scholar] [CrossRef]
- Faverio, P.; Luppi, F.; Rebora, P.; D’Andrea, G.; Stainer, A.; Busnelli, S.; Catalano, M.; Modafferi, G.; Franco, G.; Monzani, A.; et al. One-year pulmonary impairment after severe COVID-19: A prospective, multicenter follow-up study. Respir. Res. 2022, 23, 65. [Google Scholar] [CrossRef]
- Flor, N.; Leidi, F.; Casella, F.; Mariani, L.; Piazza, M.; Del Medico, M.; Cogliati, C.B. Two-years chest-CT follow-up after severe COVID-19 pneumonia. Intern. Emerg. Med. 2023, 18, 1243–1245. [Google Scholar] [CrossRef]
- Gamberini, L.; Mazzoli, C.A.; Prediletto, I.; Sintonen, H.; Scaramuzzo, G.; Allegri, D.; Colombo, D.; Tonetti, T.; Zani, G.; Capozzi, C.; et al. Health-related quality of life profiles, trajectories, persistent symptoms and pulmonary function one year after ICU discharge in invasively ventilated COVID-19 patients, a prospective follow-up study. Respir. Med. 2021, 189, 106665. [Google Scholar] [CrossRef]
- González, J.; Zuil, M.; Benítez, I.D.; de Gonzalo-Calvo, D.; Aguilar, M.; Santisteve, S.; Vaca, R.; Minguez, O.; Seck, F.; Torres, G.; et al. One Year Overview and Follow-Up in a Post-COVID Consultation of Critically Ill Patients. Front. Med. 2022, 9, 897990. [Google Scholar] [CrossRef]
- Guo, Y.; Wang, H.; Xiao, M.; Guan, X.; Lei, Y.; Diao, T.; Long, P.; Zeng, R.; Lai, X.; Cai, H.; et al. Long-term outcomes of COVID-19 convalescents: An 18.5-month longitudinal study in Wuhan. Int. J. Infect. Dis. 2023, 127, 85–92. [Google Scholar] [CrossRef]
- Han, X.; Chen, L.; Fan, Y.; Alwalid, O.; Jia, X.; Zheng, Y.; Liu, J.; Li, Y.; Cao, Y.; Gu, J.; et al. Longitudinal Assessment of Chest CT Findings and Pulmonary Function after COVID-19 Infection. Radiology 2023, 307, e222888. [Google Scholar] [CrossRef]
- Han, X.; Fan, Y.; Alwalid, O.; Zhang, X.; Jia, X.; Zheng, Y.; Shi, H. Fibrotic Interstitial Lung Abnormalities at 1-year Follow-up CT after Severe COVID-19. Radiology 2021, 301, E438–E440. [Google Scholar] [CrossRef] [PubMed]
- Huang, L.; Li, X.; Gu, X.; Zhang, H.; Ren, L.; Guo, L.; Liu, M.; Wang, Y.; Cui, D.; Wang, Y.; et al. Health outcomes in people 2 years after surviving hospitalisation with COVID-19: A longitudinal cohort study. Lancet Respir. Med. 2022, 10, 863–876. [Google Scholar] [CrossRef] [PubMed]
- Lenoir, A.; Christe, A.; Ebner, L.; Beigelman-Aubry, C.; Bridevaux, P.O.; Brutsche, M.; Clarenbach, C.; Erkosar, B.; Garzoni, C.; Geiser, T.; et al. Pulmonary Recovery 12 Months after Non-Severe and Severe COVID-19: The Prospective Swiss COVID-19 Lung Study. Respiration 2023, 102, 120–133. [Google Scholar] [CrossRef] [PubMed]
- Lerum, T.V.; Meltzer, C.; Rodriguez, J.R.; Aaløkken, T.M.; Brønstad, E.; Aarli, B.B.; Aarberg-Lund, K.M.; Durheim, M.T.; Ashraf, H.; Einvik, G.; et al. A prospective study of pulmonary outcomes and chest computed tomography in the first year after COVID-19. ERJ Open Res. 2023, 9, 00575-2022. [Google Scholar] [CrossRef]
- Li, Y.; Han, X.; Huang, J.; Alwalid, O.; Jia, X.; Yuan, M.; Cao, Y.; Shao, G.; Cui, Y.; Liu, J.; et al. Follow-up study of pulmonary sequelae in discharged COVID-19 patients with diabetes or secondary hyperglycemia. Eur. J. Radiol. 2021, 144, 109997. [Google Scholar] [CrossRef] [PubMed]
- Liao, T.; Meng, D.; Xiong, L.; Wu, S.; Yang, L.; Wang, S.; Zhou, M.; He, X.; Cao, X.; Xiong, H.; et al. Long-Term Effects of COVID-19 on Health Care Workers 1-Year Post-Discharge in Wuhan. Infect. Dis. Ther. 2022, 11, 145–163. [Google Scholar] [CrossRef]
- Liu, T.; Wu, D.; Yan, W.; Wang, X.; Zhang, X.; Ma, K.; Chen, H.; Zeng, Z.; Qin, Y.; Wang, H.; et al. Twelve-Month Systemic Consequences of Coronavirus Disease 2019 (COVID-19) in Patients Discharged From Hospital: A Prospective Cohort Study in Wuhan, China. Clin. Infect. Dis. 2022, 74, 1953–1965. [Google Scholar] [CrossRef] [PubMed]
- Lorent, N.; Vande Weygaerde, Y.; Claeys, E.; Guler Caamano Fajardo, I.; De Vos, N.; De Wever, W.; Salhi, B.; Gyselinck, I.; Bosteels, C.; Lambrecht, B.N.; et al. Prospective longitudinal evaluation of hospitalised COVID-19 survivors 3 and 12 months after discharge. ERJ Open Res. 2022, 8, 00004-2022. [Google Scholar] [CrossRef] [PubMed]
- Luger, A.K.; Sonnweber, T.; Gruber, L.; Schwabl, C.; Cima, K.; Tymoszuk, P.; Gerstner, A.K.; Pizzini, A.; Sahanic, S.; Boehm, A.; et al. Chest CT of Lung Injury 1 Year after COVID-19 Pneumonia: The CovILD Study. Radiology 2022, 304, 462–470. [Google Scholar] [CrossRef] [PubMed]
- Marando, M.; Fusi-Schmidhauser, T.; Tamburello, A.; Grazioli Gauthier, L.; Rigamonti, E.; Argentieri, G.; Puligheddu, C.; Pagnamenta, A.; Valenti, A.; Pons, M.; et al. 1-year radiological, functional and quality-of-life outcomes in patients with SARS-CoV-2 pneumonia—A prospective observational study. NPJ Prim. Care Respir. Med. 2022, 32, 8. [Google Scholar] [CrossRef] [PubMed]
- Martino, G.P.; Benfaremo, D.; Bitti, G.; Valeri, G.; Postacchini, L.; Marchetti, A.; Angelici, S.; Moroncini, G. 6 and 12 month outcomes in patients following COVID-19-related hospitalization: A prospective monocentric study. Intern. Emerg. Med. 2022, 17, 1641–1649. [Google Scholar] [CrossRef]
- Mulet, A.; Tarrasó, J.; Rodríguez-Borja, E.; Carbonell-Asins, J.A.; Lope-Martínez, A.; Martí-Martinez, A.; Murria, R.; Safont, B.; Fernandez-Fabrellas, E.; Ros, J.A.; et al. Biomarkers of Fibrosis in Patients with COVID-19 One Year After Hospital Discharge: A Prospective Cohort Study. Am. J. Respir. Cell Mol. Biol. 2023, 69, 321–327. [Google Scholar] [CrossRef]
- Noureddine, S.; Roux-Claudé, P.; Laurent, L.; Ritter, O.; Dolla, P.; Karaer, S.; Claudé, F.; Eberst, G.; Westeel, V.; Barnig, C. Evaluation of long-term sequelae by cardiopulmonary exercise testing 12 months after hospitalization for severe COVID-19. BMC Pulm. Med. 2023, 23, 13. [Google Scholar] [CrossRef]
- Núñez-Fernández, M.; Ramos-Hernández, C.; García-Río, F.; Pérez-González, A.; Tilve-Gómez, A.; Rodríguez-Fernández, P.; Nodar-Germiñas, A.; Fernández-García, A.; Ruano-Raviña, A.; Fernández-Villar, A. Evolution and long-term respiratory sequelae after severe COVID-19 pneumonia: Nitric oxide diffusion measurement value. Respir. Res. 2023, 24, 48. [Google Scholar] [CrossRef]
- Pan, F.; Yang, L.; Liang, B.; Ye, T.; Li, L.; Li, L.; Liu, D.; Wang, J.; Hesketh, R.L.; Zheng, C. Chest CT Patterns from Diagnosis to 1 Year of Follow-up in Patients with COVID-19. Radiology 2022, 302, 709–719. [Google Scholar] [CrossRef] [PubMed]
- Rigoni, M.; Torri, E.; Nollo, G.; Donne, L.D.; Rizzardo, S.; Lenzi, L.; Falzone, A.; Cozzio, S. “Long COVID” results after hospitalization for SARS-CoV-2 infection. Sci. Rep. 2022, 12, 9581. [Google Scholar] [CrossRef]
- Sahanic, S.; Tymoszuk, P.; Luger, A.K.; Hüfner, K.; Boehm, A.; Pizzini, A.; Schwabl, C.; Koppelstätter, S.; Kurz, K.; Asshoff, M.; et al. COVID-19 and its continuing burden after 12 months: A longitudinal observational prospective multicentre trial. ERJ Open Res. 2023, 9, 00317-2022. [Google Scholar] [CrossRef] [PubMed]
- Sanna, A.; Pellegrino, D.; Messina, E.; Siena, L.M.; Baccolini, V.; D’Antoni, L.; Landini, N.; Baiocchi, P.; Villari, P.; Catalano, C.; et al. The Role of Pulmonary Function Testing and Lung Imaging in the Long-Term Follow-Up of Patients with COVID-19 Pneumonia Role of Pulmonary Function Tests and High-Resolution Computed Tomography in Post-COVID-19 Interstitial Lung Disease. Respiration 2023, 102, 287–295. [Google Scholar] [CrossRef] [PubMed]
- Schlemmer, F.; Valentin, S.; Boyer, L.; Guillaumot, A.; Chabot, F.; Dupin, C.; Le Guen, P.; Lorillon, G.; Bergeron, A.; Basille, D.; et al. Respiratory recovery trajectories after severe-to-critical COVID-19: A 1-year prospective multicentre study. Eur. Respir. J. 2023, 61, 2201532. [Google Scholar] [CrossRef]
- Tarraso, J.; Safont, B.; Carbonell-Asins, J.A.; Fernandez-Fabrellas, E.; Sancho-Chust, J.N.; Naval, E.; Amat, B.; Herrera, S.; Ros, J.A.; Soler-Cataluña, J.J.; et al. Lung function and radiological findings 1 year after COVID-19: A prospective follow-up. Respir. Res. 2022, 23, 242. [Google Scholar] [CrossRef]
- van der Sar-van der Brugge, S.; Flikweert, A.; du Mee, A.; Gense, K.; Talman, S.; Kant, M.; De Backer, I. Recovery after admission with COVID-19 pneumonia—A follow-up study. Respir. Med. Res. 2023, 83, 101001. [Google Scholar] [CrossRef]
- van Raaij, B.F.M.; Stöger, J.L.; Hinnen, C.; Penfornis, K.M.; de Jong, C.M.M.; Klok, F.A.; Roukens, A.H.E.; Veldhuijzen, D.S.; Arbous, M.S.; Noordam, R.; et al. Fibrotic-like abnormalities notably prevalent one year after hospitalization with COVID-19. Respir. Med. Res. 2022, 82, 100973. [Google Scholar] [CrossRef]
- Vijayakumar, B.; Tonkin, J.; Devaraj, A.; Philip, K.E.J.; Orton, C.M.; Desai, S.R.; Shah, P.L. CT Lung Abnormalities after COVID-19 at 3 Months and 1 Year after Hospital Discharge. Radiology 2022, 303, 444–454. [Google Scholar] [CrossRef]
- Wu, X.; Liu, X.; Zhou, Y.; Yu, H.; Li, R.; Zhan, Q.; Ni, F.; Fang, S.; Lu, Y.; Ding, X.; et al. 3-month, 6-month, 9-month, and 12-month respiratory outcomes in patients following COVID-19-related hospitalisation: A prospective study. Lancet Respir. Med. 2021, 9, 747–754. [Google Scholar] [CrossRef]
- Zangrillo, A.; Belletti, A.; Palumbo, D.; Calvi, M.R.; Guzzo, F.; Fominskiy, E.V.; Ortalda, A.; Nardelli, P.; Ripa, M.; Baiardo Redaelli, M.; et al. One-Year Multidisciplinary Follow-Up of Patients With COVID-19 Requiring Invasive Mechanical Ventilation. J. Cardiothorac. Vasc. Anesth. 2022, 36, 1354–1363. [Google Scholar] [CrossRef]
- Zhan, Y.; Zhu, Y.; Wang, S.; Jia, S.; Gao, Y.; Lu, Y.; Zhou, C.; Liang, R.; Sun, D.; Wang, X.; et al. SARS-CoV-2 immunity and functional recovery of COVID-19 patients 1-year after infection. Signal Transduct. Target. Ther. 2021, 6, 368. [Google Scholar] [CrossRef]
- Zhang, L.; Lei, J.; Zhang, J.; Yin, L.; Chen, Y.; Xi, Y.; Moreira, J.P. Undiagnosed Long COVID-19 in China Among Non-vaccinated Individuals: Identifying Persistent Symptoms and Impacts on Patients’ Health-Related Quality of Life. J. Epidemiol. Glob. Health 2022, 12, 560–571. [Google Scholar] [CrossRef] [PubMed]
- Zhao, Y.; Yang, C.; An, X.; Xiong, Y.; Shang, Y.; He, J.; Qiu, Y.; Zhang, N.; Huang, L.; Jia, J.; et al. Follow-up study on COVID-19 survivors one year after discharge from hospital. Int. J. Infect. Dis. 2021, 112, 173–182. [Google Scholar] [CrossRef]
- Zhou, F.; Tao, M.; Shang, L.; Liu, Y.; Pan, G.; Jin, Y.; Wang, L.; Hu, S.; Li, J.; Zhang, M.; et al. Assessment of Sequelae of COVID-19 Nearly 1 Year After Diagnosis. Front. Med. 2021, 8, 717194. [Google Scholar] [CrossRef]
- Lassan, S.; Tesar, T.; Tisonova, J.; Lassanova, M. Pharmacological approaches to pulmonary fibrosis following COVID-19. Front. Pharmacol. 2023, 14, 1143158. [Google Scholar] [CrossRef]
- Zhang, C.; Wu, Z.; Li, J.W.; Tan, K.; Yang, W.; Zhao, H.; Wang, G.Q. Discharge may not be the end of treatment: Pay attention to pulmonary fibrosis caused by severe COVID-19. J. Med. Virol. 2021, 93, 1378–1386. [Google Scholar] [CrossRef] [PubMed]
- Najjar-Debbiny, R.; Barnett-Griness, O.; Khoury, J.; Gronich, N.; Weber, G.; Adir, Y.; Steinberg, M.; Shneir, S.; Sharma, L.; Saliba, W. Association between COVID-19 infection and pulmonary fibrosis: A nested case-control study. Am. J. Med. 2023, 136, 1087–1093.e2. [Google Scholar] [CrossRef] [PubMed]
- Ojo, A.S.; Balogun, S.A.; Williams, O.T.; Ojo, O.S. Pulmonary Fibrosis in COVID-19 Survivors: Predictive Factors and Risk Reduction Strategies. Pulm. Med. 2020, 2020, 6175964. [Google Scholar] [CrossRef]
- Twomey, R.; DeMars, J.; Franklin, K.; Culos-Reed, S.N.; Weatherald, J.; Wrightson, J.G. Chronic Fatigue and Postexertional Malaise in People Living With Long COVID: An Observational Study. Phys. Ther. 2022, 102, pzac005. [Google Scholar] [CrossRef]
- Verveen, A.; Müller, F.; Lloyd, A.; Moss-Morris, R.; Omland, T.; Penninx, B.; Raijmakers, R.P.H.; van der Schaaf, M.; Sandler, C.X.; Stavem, K.; et al. A research agenda for post-COVID-19 fatigue. J. Psychosom. Res. 2022, 154, 110726. [Google Scholar] [CrossRef]
- Chiner-Vives, E.; Cordovilla-Pérez, R.; de la Rosa-Carrillo, D.; García-Clemente, M.; Izquierdo-Alonso, J.L.; Otero-Candelera, R.; Pérez-de Llano, L.; Sellares-Torres, J.; de Granda-Orive, J.I. Short and Long-Term Impact of COVID-19 Infection on Previous Respiratory Diseases. Arch. Bronconeumol. 2022, 58 (Suppl. S1), 39–50. [Google Scholar] [CrossRef] [PubMed]
- Lewis, K.L.; Helgeson, S.A.; Tatari, M.M.; Mallea, J.M.; Baig, H.Z.; Patel, N.M. COVID-19 and the effects on pulmonary function following infection: A retrospective analysis. eClinicalMedicine 2021, 39, 101079. [Google Scholar] [CrossRef]
- Tsampasian, V.; Elghazaly, H.; Chattopadhyay, R.; Debski, M.; Naing, T.K.P.; Garg, P.; Clark, A.; Ntatsaki, E.; Vassiliou, V.S. Risk Factors Associated With Post−COVID-19 Condition: A Systematic Review and Meta-analysis. JAMA Intern. Med. 2023, 183, 566–580. [Google Scholar] [CrossRef]
- Hui, D.S.; Joynt, G.M.; Wong, K.T.; Gomersall, C.D.; Li, T.S.; Antonio, G.; Ko, F.W.; Chan, M.C.; Chan, D.P.; Tong, M.W.; et al. Impact of severe acute respiratory syndrome (SARS) on pulmonary function, functional capacity and quality of life in a cohort of survivors. Thorax 2005, 60, 401–409. [Google Scholar] [CrossRef]
- Ng, C.K.; Chan, J.W.; Kwan, T.L.; To, T.S.; Chan, Y.H.; Ng, F.Y.; Mok, T.Y. Six month radiological and physiological outcomes in severe acute respiratory syndrome (SARS) survivors. Thorax 2004, 59, 889–891. [Google Scholar] [CrossRef] [PubMed]
- Zhang, P.; Li, J.; Liu, H.; Han, N.; Ju, J.; Kou, Y.; Chen, L.; Jiang, M.; Pan, F.; Zheng, Y.; et al. Long-term bone and lung consequences associated with hospital-acquired severe acute respiratory syndrome: A 15-year follow-up from a prospective cohort study. Bone Res. 2020, 8, 8. [Google Scholar] [CrossRef] [PubMed]
- Antonio, G.E.; Wong, K.T.; Hui, D.S.; Wu, A.; Lee, N.; Yuen, E.H.; Leung, C.B.; Rainer, T.H.; Cameron, P.; Chung, S.S.; et al. Thin-section CT in patients with severe acute respiratory syndrome following hospital discharge: Preliminary experience. Radiology 2003, 228, 810–815. [Google Scholar] [CrossRef] [PubMed]
- Das, K.M.; Lee, E.Y.; Singh, R.; Enani, M.A.; Al Dossari, K.; Van Gorkom, K.; Larsson, S.G.; Langer, R.D. Follow-up chest radiographic findings in patients with MERS-CoV after recovery. Indian J. Radiol. Imaging 2017, 27, 342–349. [Google Scholar] [CrossRef]
- Chen, J.; Wu, J.; Hao, S.; Yang, M.; Lu, X.; Chen, X.; Li, L. Long term outcomes in survivors of epidemic Influenza A (H7N9) virus infection. Sci. Rep. 2017, 7, 17275. [Google Scholar] [CrossRef]
- Hu, B.; Guo, H.; Zhou, P.; Shi, Z.-L. Characteristics of SARS-CoV-2 and COVID-19. Nat. Rev. Microbiol. 2021, 19, 141–154. [Google Scholar] [CrossRef]
- Lu, R.; Zhao, X.; Li, J.; Niu, P.; Yang, B.; Wu, H.; Wang, W.; Song, H.; Huang, B.; Zhu, N.; et al. Genomic characterisation and epidemiology of 2019 novel coronavirus: Implications for virus origins and receptor binding. Lancet 2020, 395, 565–574. [Google Scholar] [CrossRef]
- Rabaan, A.A.; Al-Ahmed, S.H.; Haque, S.; Sah, R.; Tiwari, R.; Malik, Y.S.; Dhama, K.; Yatoo, M.I.; Bonilla-Aldana, D.K.; Rodriguez-Morales, A.J. SARS-CoV-2, SARS-CoV, and MERS-COV: A comparative overview. Infez. Med. 2020, 28, 174–184. [Google Scholar] [PubMed]
- Mylvaganam, R.J.; Bailey, J.I.; Sznajder, J.I.; Sala, M.A. Recovering from a pandemic: Pulmonary fibrosis after SARS-CoV-2 infection. Eur. Respir. Rev. 2021, 30, 210194. [Google Scholar] [CrossRef] [PubMed]
- Xie, Y.; Choi, T.; Al-Aly, Z. Long-term outcomes following hospital admission for COVID-19 versus seasonal influenza: A cohort study. Lancet Infect. Dis. 2024, 24, 239–255. [Google Scholar] [CrossRef] [PubMed]
- Pormohammad, A.; Ghorbani, S.; Khatami, A.; Farzi, R.; Baradaran, B.; Turner, D.L.; Turner, R.J.; Bahr, N.C.; Idrovo, J.P. Comparison of confirmed COVID-19 with SARS and MERS cases—Clinical characteristics, laboratory findings, radiographic signs and outcomes: A systematic review and meta-analysis. Rev. Med. Virol. 2020, 30, e2112. [Google Scholar] [CrossRef] [PubMed]
- Saxena, S.; Singh, D.; Zia, A.; Umrao, J.; Srivastava, N.; Pandey, A.; Singh, S.; Bhattacharya, P.; Kumari, R.; Kushwaha, R.; et al. Clinical characterization of influenza A and human respiratory syncytial virus among patients with influenza like illness. J. Med. Virol. 2017, 89, 49–54. [Google Scholar] [CrossRef] [PubMed]
- Franquet, T.; Jeong, Y.J.; Lam, H.Y.S.; Wong, H.Y.F.; Chang, Y.C.; Chung, M.J.; Lee, K.S. Imaging findings in coronavirus infections: SARS-CoV, MERS-CoV, and SARS-CoV-2. Br. J. Radiol. 2020, 93, 20200515. [Google Scholar] [CrossRef] [PubMed]
- WHO Coronavirus (COVID-19) Dashboard. Available online: https://covid19.who.int/ (accessed on 31 August 2023).
- Pustake, M.; Tambolkar, I.; Giri, P.; Gandhi, C. SARS, MERS and COVID-19: An overview and comparison of clinical, laboratory and radiological features. J. Fam. Med. Prim. Care 2022, 11, 10–17. [Google Scholar] [CrossRef] [PubMed]


| Author (Year) | Country | Study Design | Patients with Chest CT at Follow-Up, n (%) | Longest Follow-Up Time, Months | Initial-Infection Time Period | Patient Characteristics | ||||||
|---|---|---|---|---|---|---|---|---|---|---|---|---|
| Start Date | End Date | N | Male Sex, % | Age, Years | Ever Smoker, % | Disease-Severity Group(s) | Hospitalization Status | |||||
| Bellan et al. (2021) [47] | Italy | P | 190 (95) | 12 | 1 March 2020 | 29 June 2020 | 200 | 61 | Median 62 (51–71) | 44.5 | Severe | H |
| Zhan et al. (2021) [85] | China | P | 121 (100) | 12 | 15 January 2020 | 31 March 2020 | 121 | 41.3 | Median 49 (40–57) | NR | Non-severe, severe | H |
| Zhou et al. (2021) [87] | China | P | 97 (80.8) | 12 | 29 January 2020 | 1 April 2020 | 120 | 40.8 | Mean 51.6 (10.8) | 13.3 | Non-severe, severe | H |
| Li et al. (2021) [64] | China | P | 141 (100) | 12 | 28 December 2019 | 30 April 2020 | 141 | 63.1 | Median 59.0 (51–66) | 11.3 | NR | H |
| Chen et al. (2021) [51] | China | P | 36 (87.8) | 12 | 1 February 2020 | 15 March 2020 | 41 | 58.5 | Median 51 (38–59) | 9.8 | Mild, severe | H |
| Zhao et al. (2021) [87] | China | P | 94 (100) | 12 | 16 January 2020 | 6 February 2020 | 94 | 57.5 | Mean 48.1 (11.9) | 7.5 | Mild, moderate, severe, critical | H |
| Gamberini et al. (2021) [56] | Italy | P | 37 (20.8) | 12 | 22 February 2020 | 4 May 2020 | 178 | 72.5 | Median 64 (55–70) | NR | Severe | H |
| Han et al. (2021) [60] | China | P | 62 (100) | 12 | NR | 1 June 2020 | 62 | 54.8 | Mean 57 (10) | NR | Severe | H |
| Wu et al. (2021) [83] | China | P | 83 (100) | 12 | 1 February 2020 | 31 March 2020 | 83 | 57.8 | Median 60 (52–66) | 0 | Severe | H |
| Zangrillo et al. (2021) [84] | Italy | P | 36 (64.3) | 12 | 25 February 2020 | 27 April 2020 | 56 | 89.3 | Mean 56 (11.9) | 35.4 | Severe | H |
| Faverio et al. (2022) [54] | Italy | P | 270 (94.1) | 12 | 1 March 2020 | 1 June 2020 | 287 | 74.2 | Median 60.7 (53.4–68.8) | 26.5 | Severe | H |
| Rigoni et al. (2022) [75] | Italy | P | 47 (10) | 12 | 1 March 2020 | 1 May 2020 | 471 | 63.8 | Median 71 (58–81) | NR | Mixed (mild/moderate/severe) | H |
| Liao et al. (2022) [65] | China | P | 256 (84.5) | 12 | 18 March 2021 | 30 April 2021 | 303 | 19.5 | Median 39, (33–48) | 3.3 | Mild, moderate, severe, critical | H |
| González et al. (2022) [57] | Spain | P | 41 (22.7) | 12 | 1 March 2020 | 1 August 2020 | 181 | 66.9 | Median 61 (52–67) | 38.1 | Critical | H |
| Corsi et al. (2022) [52] | Italy | P | 63 (88.7) | 12 | 25 February 2020 | 2 May 2020 | 71 | 36.7 | Median 66 (59–73) | 54 | Severe | H |
| Zhang et al. (2022) [86] | China | P | 204 (80) | 12 | 1 January 2020 | 1 April 2020 | 255 | 51 | Mean 43.8 (16.1) | 13.7 | Mild, moderate, severe, critical | H |
| Eberst et al. (2022) [53] | France | P | 64 (75.3) | 12 | 1 April 2020 | 1 June 2021 | 85 | 78.8 | Median 68.4 (60.1–72.9) | 58.8 | Severe | H |
| Lorent et al. (2022) [67] | Belgium | P | 105 (35.1) | 12 | 1 March 2020 | 31 May 2020 | 299 | 68.6 | Median 59 (52–68) | NR | Moderate, severe | H |
| Liu et al. (2022) [66] | China | P | 486 (81.8) | 12 | 10 February 2020 | 30 April 2020 | 594 | 46.3 | Median 63 (53–68) | 13 | Moderate, severe, critical | H |
| Marando et al. (2022) [69] | Switzerland | P | 31 (79.5) | 12 | 1 March 2020 | 15 April 2020 | 39 | 79.5 | Median 64.5 (52.7–72.2) | 38.7 | NR | H |
| Luger et al. (2022) [68] | Austria | P | 91 (100) | 12 | 29 April 2020 | 12 August 2020 | 91 | 61.5 | Median 57 (51–70) | 34 | Mixed (mild/moderate/severe/critical) | H and NH |
| Pan et al. (2022) [74] | China | P | 209 (100) | 12 | 27 January 2020 | 31 March 2020 | 209 | 44.5 | Mean 49 (13) | 1.9 | Severe, critical | H |
| Tarraso et al. (2022) [79] | Spain | P | 156 (54.9) | 12 | 1 May 2020 | 31 July 2020 | 284 | 55.3 | Mean 60.5 (11.9) | 42.3 | Mild, moderate, severe | H |
| Vijayakumar et al. (2022) [82] | England | P | 32 (100) | 12 | 1 March 2020 | 1 June 2020 | 32 | 65.6 | Mean 62 (11) | 59 | Mixed (mild/moderate/severe) | H |
| Martino et al. (2022) [70] | Italy | P | 47 (73.4) | 12 | 25 March 2020 | 15 May 2020 | 64 | 64.1 | Median 68 (56.5–75) | 43.6 | Severe | H |
| Bocchino et al. (2022) [49] | Italy | P | 84 (100) | 12 | 1 March 2020 | 1 July 2021 | 84 | 66.7 | Mean 61 (11) | 42 | Moderate | H |
| Huang et al. (2022) [61] | China | P | 57 (4.8) | 24 | 7 January 2020 | 29 May 2020 | 1192 | 54 | Median 57.0 (48.0–65.0) | 17 | Moderate, severe, critical | H |
| Barini et al. (2022) [46] | Italy | P | 115 (100) | 18 | 1 March 2020 | 1 May 2020 | 115 | 67.8 | Mean 60 (15) | NR | NR | H |
| van Raaij et al. (2022) [81] | Netherlands | P | 66 (100) | 12 | 23 March 2020 | 23 June 2020 | 66 | 69.7 | Median 60.5 (54.0−69.3) | 43.9 | Moderate, severe | H |
| Lenoir et al. (2022) [62] | Switzerland | P | 25 (4.3) | 12 | 1 May 2020 | 31 December 2021 | 584 | 56.8 | Mean 58.0 (14.1) | 45 | Mixed (non-severe/severe) | NR |
| Guo et al. (2022) [58] | China | P | 95 (45.7) | 18.5 | NR | 17 February 2020 | 208 | 48.1 | Median 58 (50.0–64.3) | 12 | Mild, severe | H |
| Bernardinello et al. (2023) [48] | Italy | P | 347 (100) | 12 | 1 February 2020 | 1 April 2021 | 347 | 62.5 | Median 63 (53–72) | 37.8 | NR | H |
| Han et al. (2023) [59] | China | P | 144 (100) | 24 | 20 January 2020 | 10 March 2020 | 144 | 55 | Median 60 (27–80) | 17 | Mixed (moderate/severe/critical) | H |
| Bongiovanni et al. (2023) [50] | Italy | P | 233 (100) | 12 | 1 March 2020 | 1 April 2021 | 233 | 61.4 | NR | 42.1 | Moderate, severe, critical | H |
| Lerum et al. (2023) [63] | Norway | P | 124 (47.3) | 12 | NR | 1 June 2020 | 262 | 58 | Mean 58.6 (14.2) | 41.9 | Mild, moderate, severe | H |
| Sanna et al. (2023) [77] | Italy | P | 19 (19) | 15 | 1 March 2020 | 1 August 2020 | 100 | 62 | Mean 59.6 (12.8) | 39 | Mixed (moderate/severe/critical) | H |
| Núñez-Fernández et al. (2023) [73] | Spain | P | 70 (36.1) | 12 | NR | NR | 194 | 55.8 | Median 62 (51.5–71) | 40.2 | Severe | H |
| Mulet et al. (2023) [71] | Spain | P | 126 (93.3) | 12 | NR | NR | 135 | 61.5 | Mean 61 (19) | 37.8 | Mixed (mild/moderate/severe) | H |
| Noureddine et al. (2023) [72] | France | P | 60 (100) | 12 | 1 April 2020 | 1 June 2020 | 60 | 78 | Mean 64.6 (9.6) | 56.7 | Severe | H |
| Sahanic et al. (2023) [76] | Austria | P | 101 (93.5) | 12 | 1 April 2020 | 1 June 2020 | 108 | 64 | Median 56 (49–68) | 32 | Mild, moderate, severe | H and NH |
| van der Sar-van der Brugge et al. (2023) [80] | Netherlands | P | 66 (40.7) | 12 | 1 March 2020 | 1 April 2020 | 162 | 59 | Mean 65.5 (0.95) | 54 | Moderate, severe, critical | H |
| Schlemmer et al. (2023) [78] | France | P | 123 (25.4) | 12 | 10 March 2020 | 25 November 2020 | 485 | 73 | Median 60.7 (53.4–67.6) | 37.3 | Severe, critical | H |
| Flor et al. (2023) [55] | Italy | P | 18 (100) | 24 | 1 February 2020 | 31 May 2020 | 18 | 83 | Median 70 (65–78) | NR | Severe | H |
| Author (Year) | Longest Follow-Up Time, Months | Chest-CT Findings, n/N (%) | |||||||
|---|---|---|---|---|---|---|---|---|---|
| Any Abnormality | GGO | Fibrotic-like Changes | Reticulation | Consolidation | Interlobular Septal Thickening | Bronchiectasis | Honeycombing | ||
| Bellan et al. (2021) [47] | 12 | 44/190 (23.1) | NR | NR | NR | NR | NR | NR | NR |
| Zhan et al. (2021) [85] | 12 | 10/121 (8.3) | NR | NR | NR | NR | NR | NR | NR |
| Zhou et al. (2021) [87] | 12 | 55/97 (56.7) | 16/97 (16.5) | 17/97 (17.5) | NR | NR | NR | 14/97 (14.4) | NR |
| Li et al. (2021) [64] | 12 | 13/25 (52) | 6/25 (24) | NR | 7/25 (28) | 0/25 (0) | 9/25 (36) | NR | NR |
| Chen et al. (2021) [51] | 12 | 17/36 (47.2) | NR | NR | NR | NR | NR | NR | NR |
| Zhao et al. (2021) [87] | 12 | 67/94 (71.3) | 38/94 (40.4) | 8/94 (8.5) | 4/94 (4.3) | 2/94 (2.1) | 10/94 (10.7) | NR | NR |
| Gamberini et al. (2021) [56] | 12 | NR | 21/37 (56.8) | 26/37 (70.3) | 13/37 (35.1) | 3/37 (8.1) | NR | 10/37 (27) | 3/37 (8.1) |
| Han et al. (2021) [60] | 12 | 45/62 (72.6) | 7/62 (11.3) | 35/62 (56.5) | 32/62 (51.6) | 6/62 (9.7) | 28/62 (45.2) | 27/62 (43.5) | NR |
| Wu et al. (2021) [83] | 12 | 20/83 (24.1) | 19/83 (22.9) | NR | 3/83 (3.6) | NR | 4/83 (4.8) | 1/83 (1.2) | NR |
| Zangrillo et al. (2021) [84] | 12 | NR | NR | 4/36 (11.1) | NR | NR | NR | NR | NR |
| Faverio et al. (2022) [54] | 12 | 178/270 (65.9) | 61/270 (22.6) | NR | 98/270 (36.3) | 8/270 (3) | NR | 14/270 (5.2) | 3/270 (1.1) |
| Rigoni et al. (2022) [75] | 12 | NR | 23/47 (48.9) | NR | NR | 1/47 (2.1) | 45/47 (95.7) | 13/47 (27.7) | NR |
| Liao et al. (2022) [65] | 12 | 96/256 (37.5) | 63/256 (24.6) | 26/256 (10.2) | 2/256 (0.8) | 8/256 (3.1) | NR | 4/256 (1.6) | NR |
| González et al. (2022) [57] | 12 | 41/41 (100) | 27/41 (65.9) | 15/41 (36.6) | 22/41 (53.7) | 3/41 (7.3) | 41/41 (100) | 37/41 (90.2) | NR |
| Corsi et al. (2022) [52] | 12 | 48/63 (76.2) | 2/63 (3.2) | NR | 38/63 (60.3) | 2/63 (3.2) | NR | 42/63 (66.7) | NR |
| Zhang et al. (2022) [86] | 12 | 137/245 (55.9) | 11/204 (5.4) | 45/245 (18.4) | NR | 1/245 (0.4) | 13/245 (5.3) | NR | NR |
| Eberst et al. (2022) [53] | 12 | 60/64 (93.8) | 32/64 (53.3) | NR | 51/64 (85) | NR | NR | 44/64 (73.3) | 3/64 (5) |
| Lorent et al. (2022) [67] | 12 | 68/105 (64.8) | 39/105 (37.1) | NR | 58/105 (55.2) | 1/105 (1) | NR | 21/105 (20) | NR |
| Liu et al. (2022) [66] | 12 | NR | 0/486 (0) | 249/486 (51.2) | NR | NR | NR | 22/486 (4.5) | NR |
| Marando et al. (2022) [69] | 12 | 30/31 (96.8) | 21/31 (67.7) | 23/31 (74.2) | NR | 3/31 (9.7) | NR | NR | NR |
| Luger et al. (2022) [68] | 12 | 49/91 (53.8) | 40/91 (44) | NR | 39/91 (42.9) | 1/91 (1.1) | NR | 8/91 (8.8) | NR |
| Pan et al. (2022) [74] | 12 | 53/209 (25) | 50/209 (23.9) | NR | 28/209 (13.4) | 3/209 (1.4) | NR | 14/209 (11.5) | NR |
| Tarraso et al. (2022) [79] | 12 | 123/156 (78.8) | 71/156 (45.5) | 102/156 (65.4) | 53/156 (33.9) | 25/156 (16) | NR | 48/156 (30.8) | NR |
| Vijayakumar et al. (2022) [82] | 12 | 27/32 (84.4) | NR | NR | NR | NR | NR | NR | NR |
| Martino et al. (2022) [70] | 12 | 30/47 (63.8) | 7/47 (14.9) | 7/47 (14.9) | 19/47 (40.4) | 7/47 (14.9) | 5/47 (10.6) | 4/47 (8.5) | 2/47 (4.2) |
| Bocchino et al. (2022) [49] | 12 | 6/84 (7.1) | 2/84 (2.4) | 4/84 (4.8) | 2/84 (2.4) | 0/84 (0) | NR | 2/84 (2.4) | 0/84 (0) |
| Huang et al. (2022) [61] | 24 | 47/57 (82.5) | 34/57 (59.6) | NR | 1/57 (1.8) | 2/57 (3.5) | 4/57 (7) | NR | NR |
| Barini et al. (2022) [46] | 18 | NR | NR | NR | NR | NR | NR | 17/115 (14.8) | NR |
| van Raaij et al. (2022) [81] | 12 | 34/66 (51.5) | 19/66 (28.8) | NR | 14/66 (21.2) | 3/66 (4.5) | NR | 23/66 (34.8) | NR |
| Lenoir et al. (2022) [62] | 12 | NR | 24/25 (96) | NR | 11/25 (44) | 3/25 (12) | NR | 8/25 (32) | NR |
| Guo et al. (2022) [58] | 18.5 | NR | 28/95 (29.5) | NR | 34/95 (35.8) | NR | NR | NR | NR |
| Bernardinello et al. (2023) [48] | 12 | 24/347 (6.9) | 19/347 (5.5) | NR | NR | 2/347 (0.6) | 21/347 (6.1) | 7/347 (2) | NR |
| Han et al. (2023) [59] | 24 | 56/144 (38.9) | 6/144 (4.2) | 33/144 (22.9) | 50/144 (34.7) | 0/144 (0) | NR | 23/144 (16) | 8/144 (6) |
| Bongiovanni et al. (2023) [50] | 12 | 140/233 (60.1) | 39/233 (16.7) | 74/233 (31.8) | NR | NR | NR | 41/233 (17.6) | NR |
| Lerum et al. (2023) [63] | 12 | NR | 62/124 (50) | 74/124 (59.7) | 37/124 (29.8) | 8/124 (6.5) | 17/124 (13.7) | NR | NR |
| Sanna et al. (2023) [77] | 15 | 19/19 (100) | 7/19 (36.8) | 19/19 (100) | NR | 0/19 (0) | 0/19 (0) | 0/19 (0) | 0/19 (0) |
| Núñez-Fernández et al. (2023) [73] | 12 | NR | 13/70 (18.6) | NR | 21/70 (30) | NR | NR | 20/70 (28.6) | NR |
| Mulet et al. (2023) [71] | 12 | 46/125 (36.8) | 31/125 (24.6) | 37/125 (29.4) | NR | NR | NR | NR | NR |
| Noureddine et al. (2023) [72] | 12 | 50/60 (83.3) | 29/60 (48.3) | NR | 42/60 (70) | NR | NR | 35/60 (58.3) | 3/60 (5) |
| Sahanic et al. (2023) [76] | 12 | 52/101 (51.5) | NR | NR | NR | NR | NR | NR | NR |
| van der Sar-van der Brugge et al. (2023) [80] | 12 | 33/66 (50) | 31/66 (47) | 16/66 (24.2) | NR | NR | NR | NR | NR |
| Schlemmer et al. (2023) [78] | 12 | 114/123 (92.7) | 73/123 (70.7) | NR | 74/123 (60.2) | 1/123 (0.8) | NR | 71/123 (81.6) | 13/123 (10.6) |
| Flor et al. (2023) [55] | 24 | 18/18 (100) | 1/18 (5.5) | 18/18 (100) | 15/18 (83.3) | 0/18 (0) | NR | 3/18 (16.7) | 2/18 (11.1) |
Disclaimer/Publisher’s Note: The statements, opinions and data contained in all publications are solely those of the individual author(s) and contributor(s) and not of MDPI and/or the editor(s). MDPI and/or the editor(s) disclaim responsibility for any injury to people or property resulting from any ideas, methods, instructions or products referred to in the content. |
© 2024 by the authors. Licensee MDPI, Basel, Switzerland. This article is an open access article distributed under the terms and conditions of the Creative Commons Attribution (CC BY) license (https://creativecommons.org/licenses/by/4.0/).
Share and Cite
Babar, M.; Jamil, H.; Mehta, N.; Moutwakil, A.; Duong, T.Q. Short- and Long-Term Chest-CT Findings after Recovery from COVID-19: A Systematic Review and Meta-Analysis. Diagnostics 2024, 14, 621. https://doi.org/10.3390/diagnostics14060621
Babar M, Jamil H, Mehta N, Moutwakil A, Duong TQ. Short- and Long-Term Chest-CT Findings after Recovery from COVID-19: A Systematic Review and Meta-Analysis. Diagnostics. 2024; 14(6):621. https://doi.org/10.3390/diagnostics14060621
Chicago/Turabian StyleBabar, Mustufa, Hasan Jamil, Neil Mehta, Ahmed Moutwakil, and Tim Q. Duong. 2024. "Short- and Long-Term Chest-CT Findings after Recovery from COVID-19: A Systematic Review and Meta-Analysis" Diagnostics 14, no. 6: 621. https://doi.org/10.3390/diagnostics14060621
APA StyleBabar, M., Jamil, H., Mehta, N., Moutwakil, A., & Duong, T. Q. (2024). Short- and Long-Term Chest-CT Findings after Recovery from COVID-19: A Systematic Review and Meta-Analysis. Diagnostics, 14(6), 621. https://doi.org/10.3390/diagnostics14060621