
Performance Assessment of Sysmex DI-60: Is Digital Morphology Analyzer Reliable for White Blood Cell Differentials in Body Fluids?
 ,
,  , , , , and
Abstract
1. Introduction
2. Materials and Methods
2.1. Study Samples
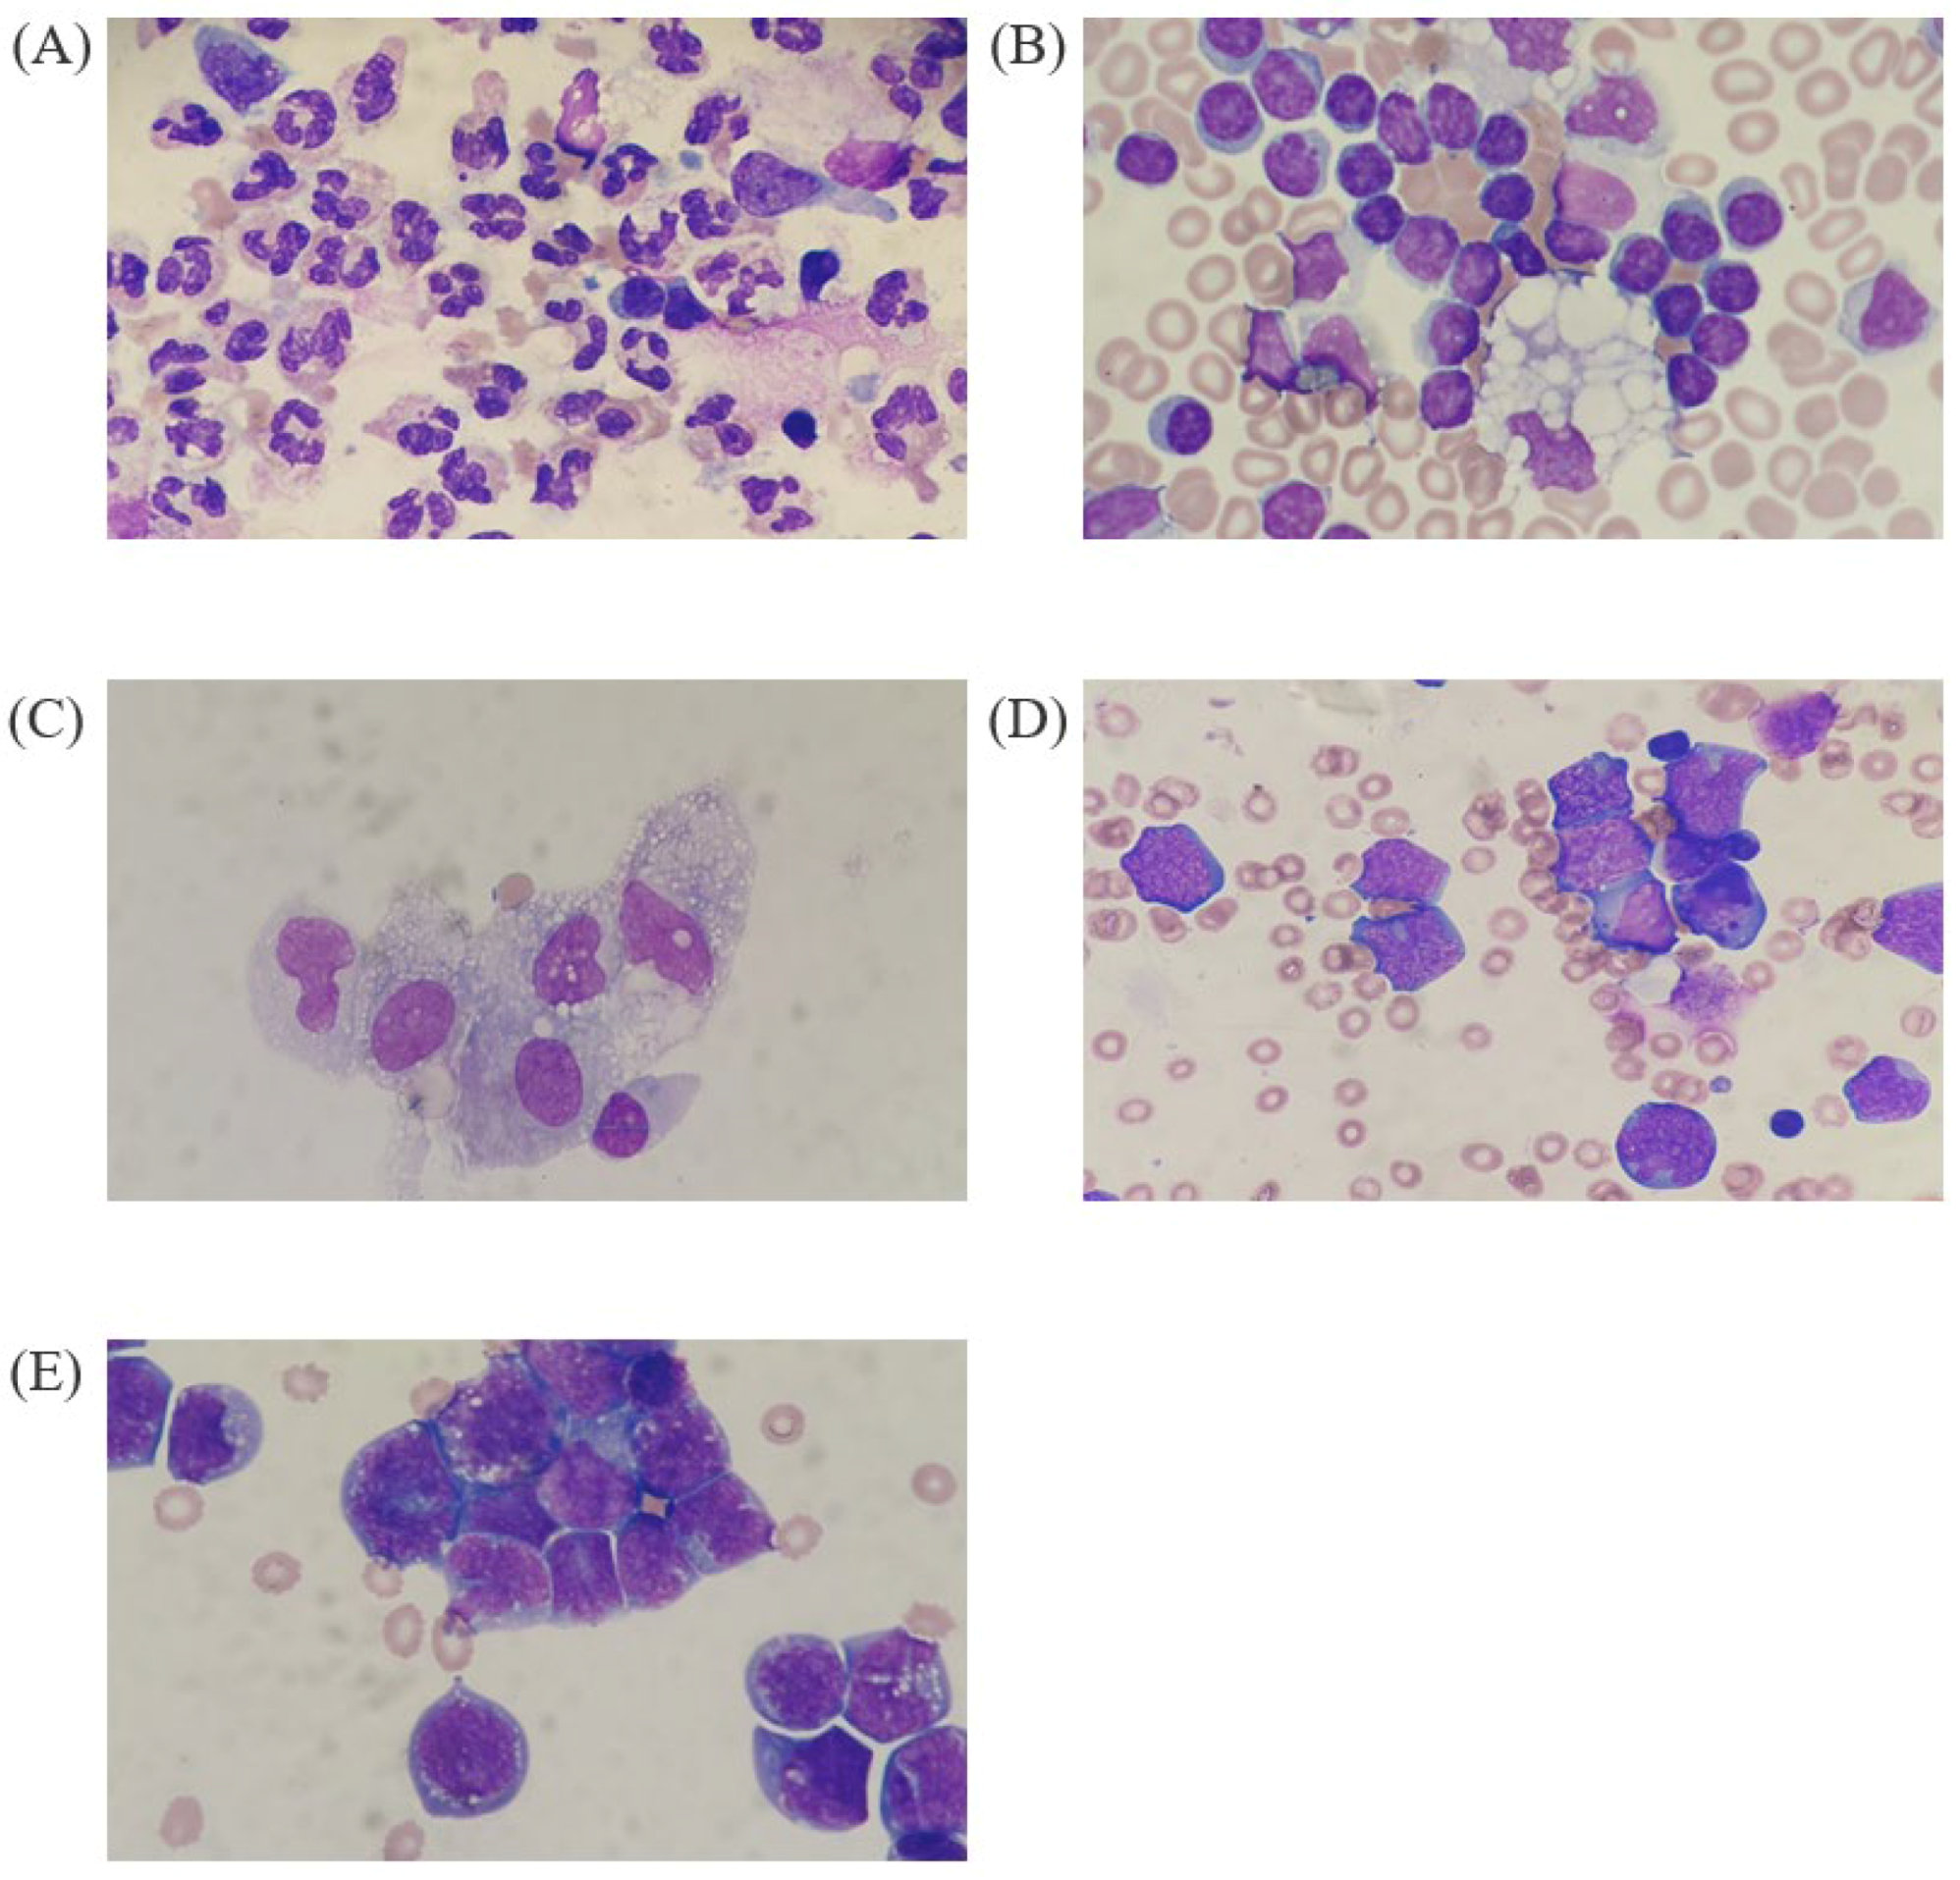
2.2. WBC Differential in BF Using DI-60 and Manual Counting
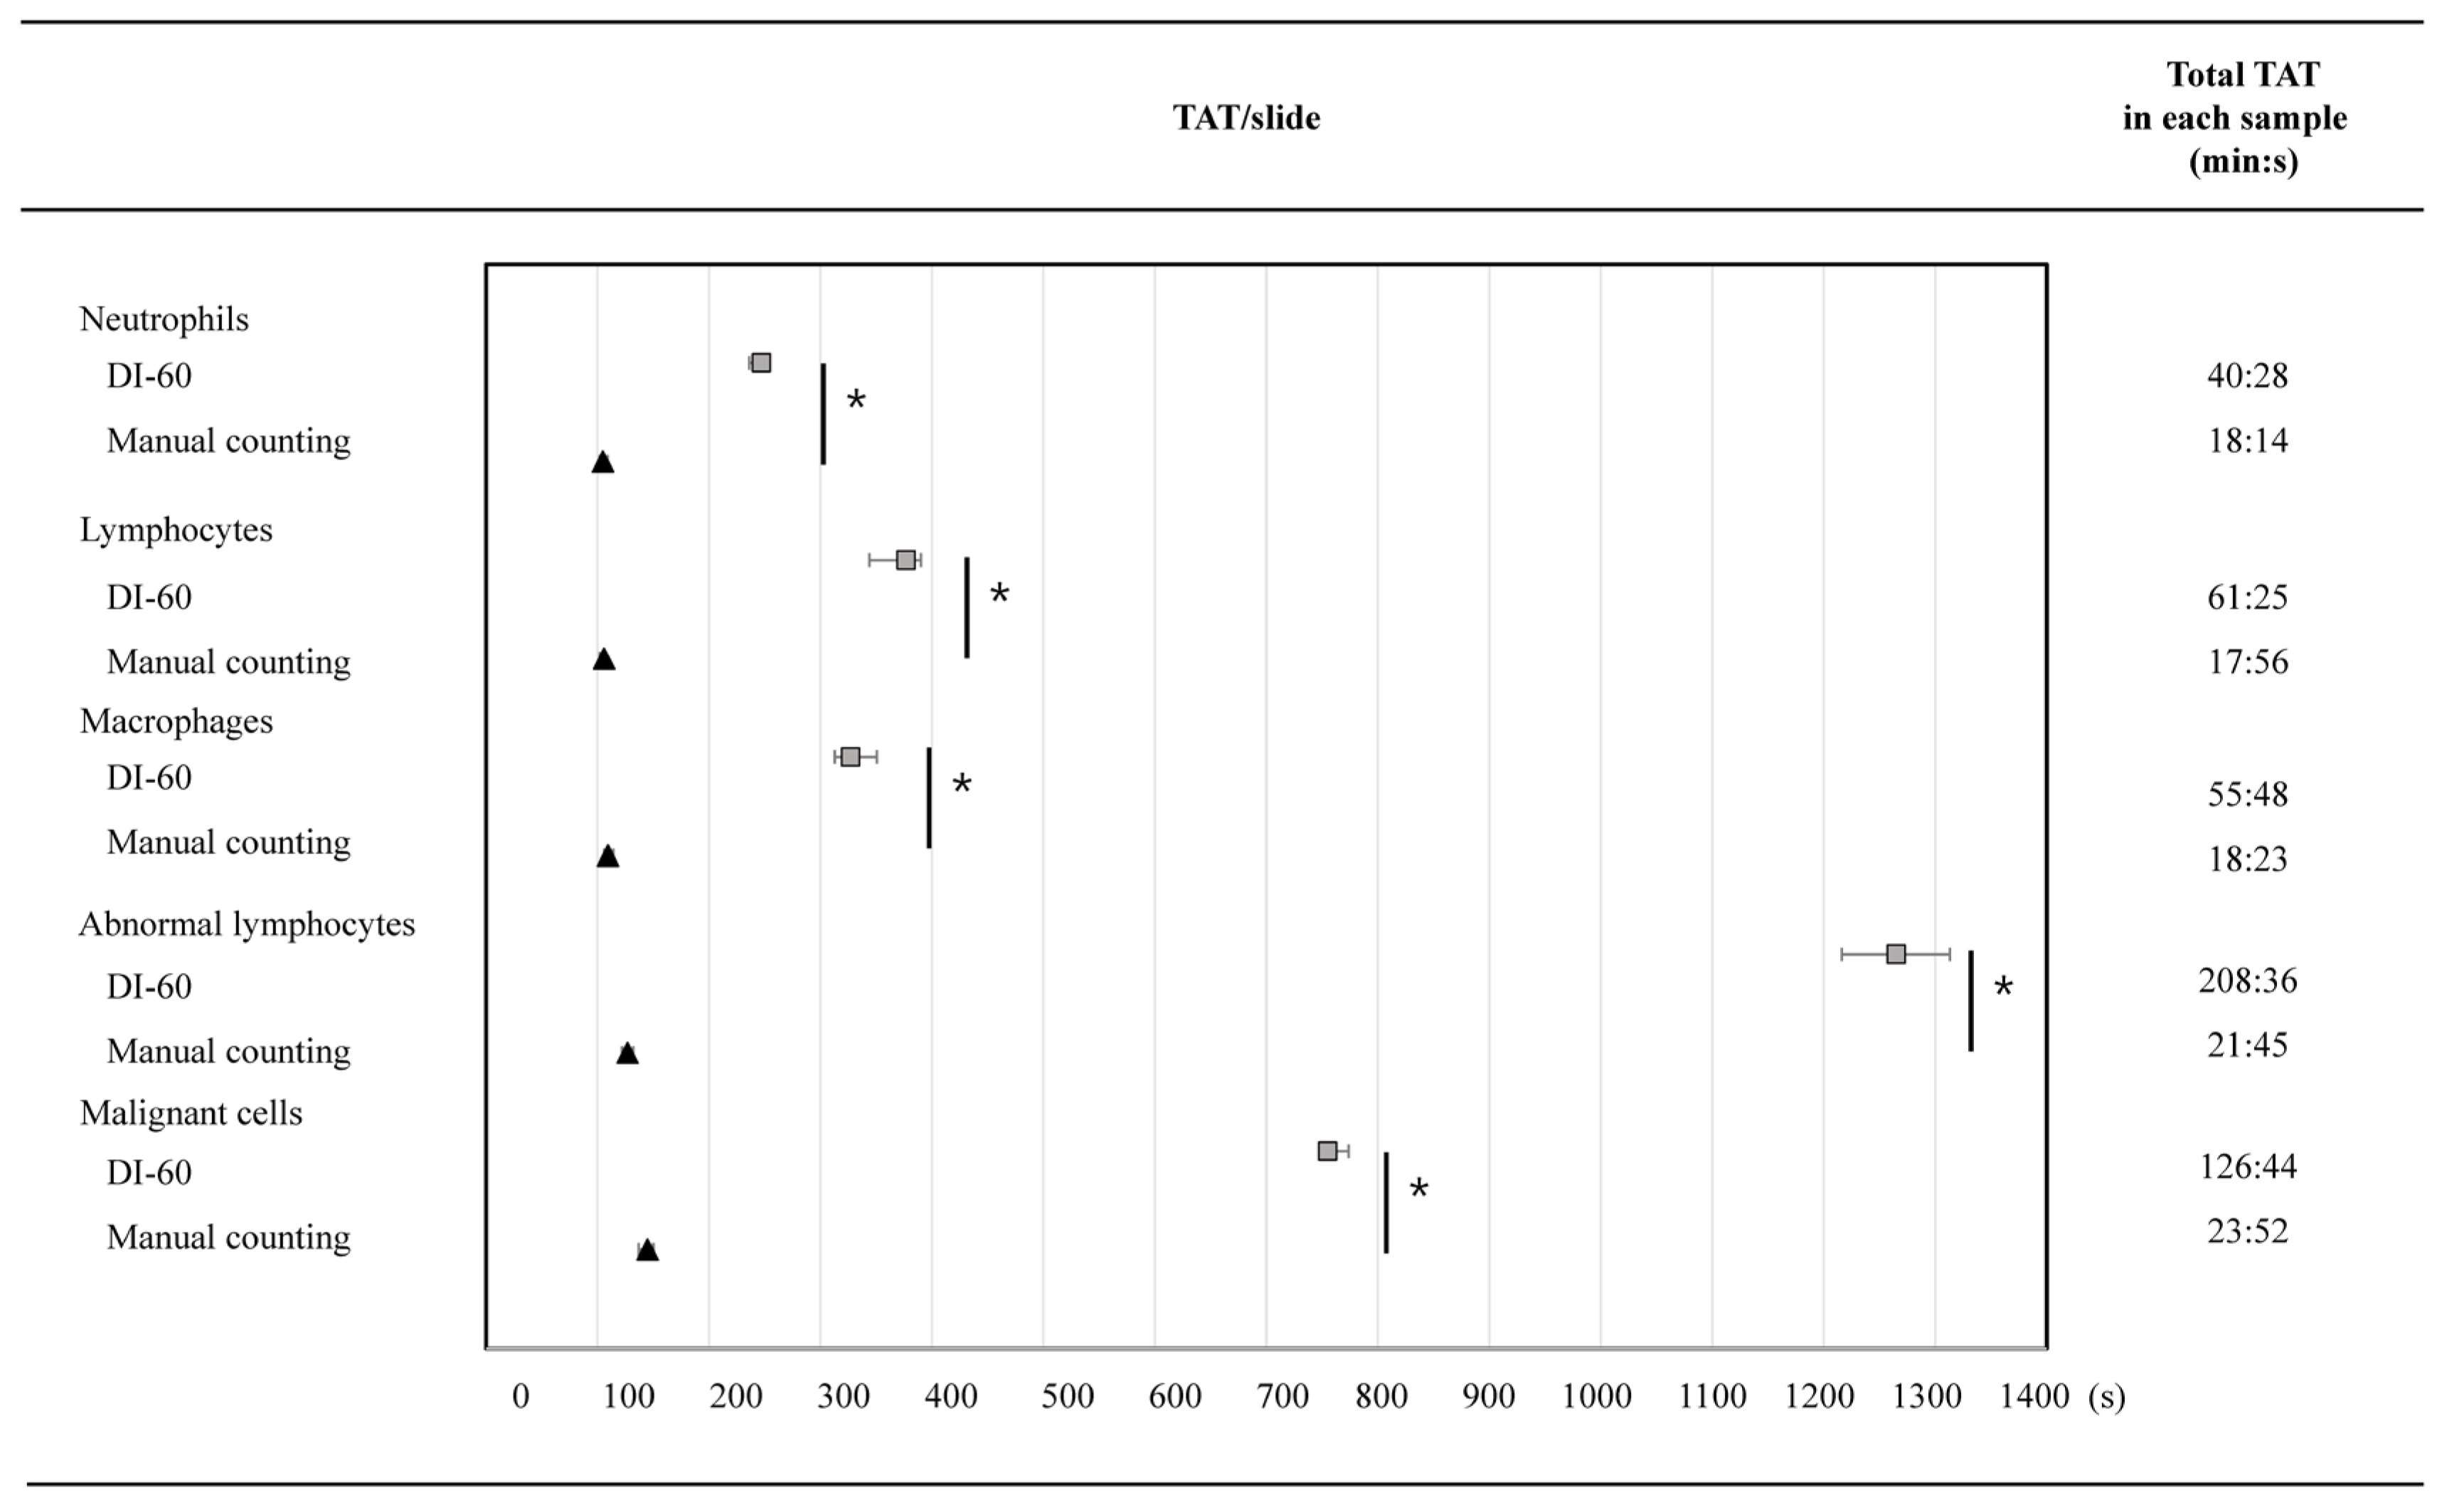
2.3. Assessment of TAT
2.4. Statistical Analysis
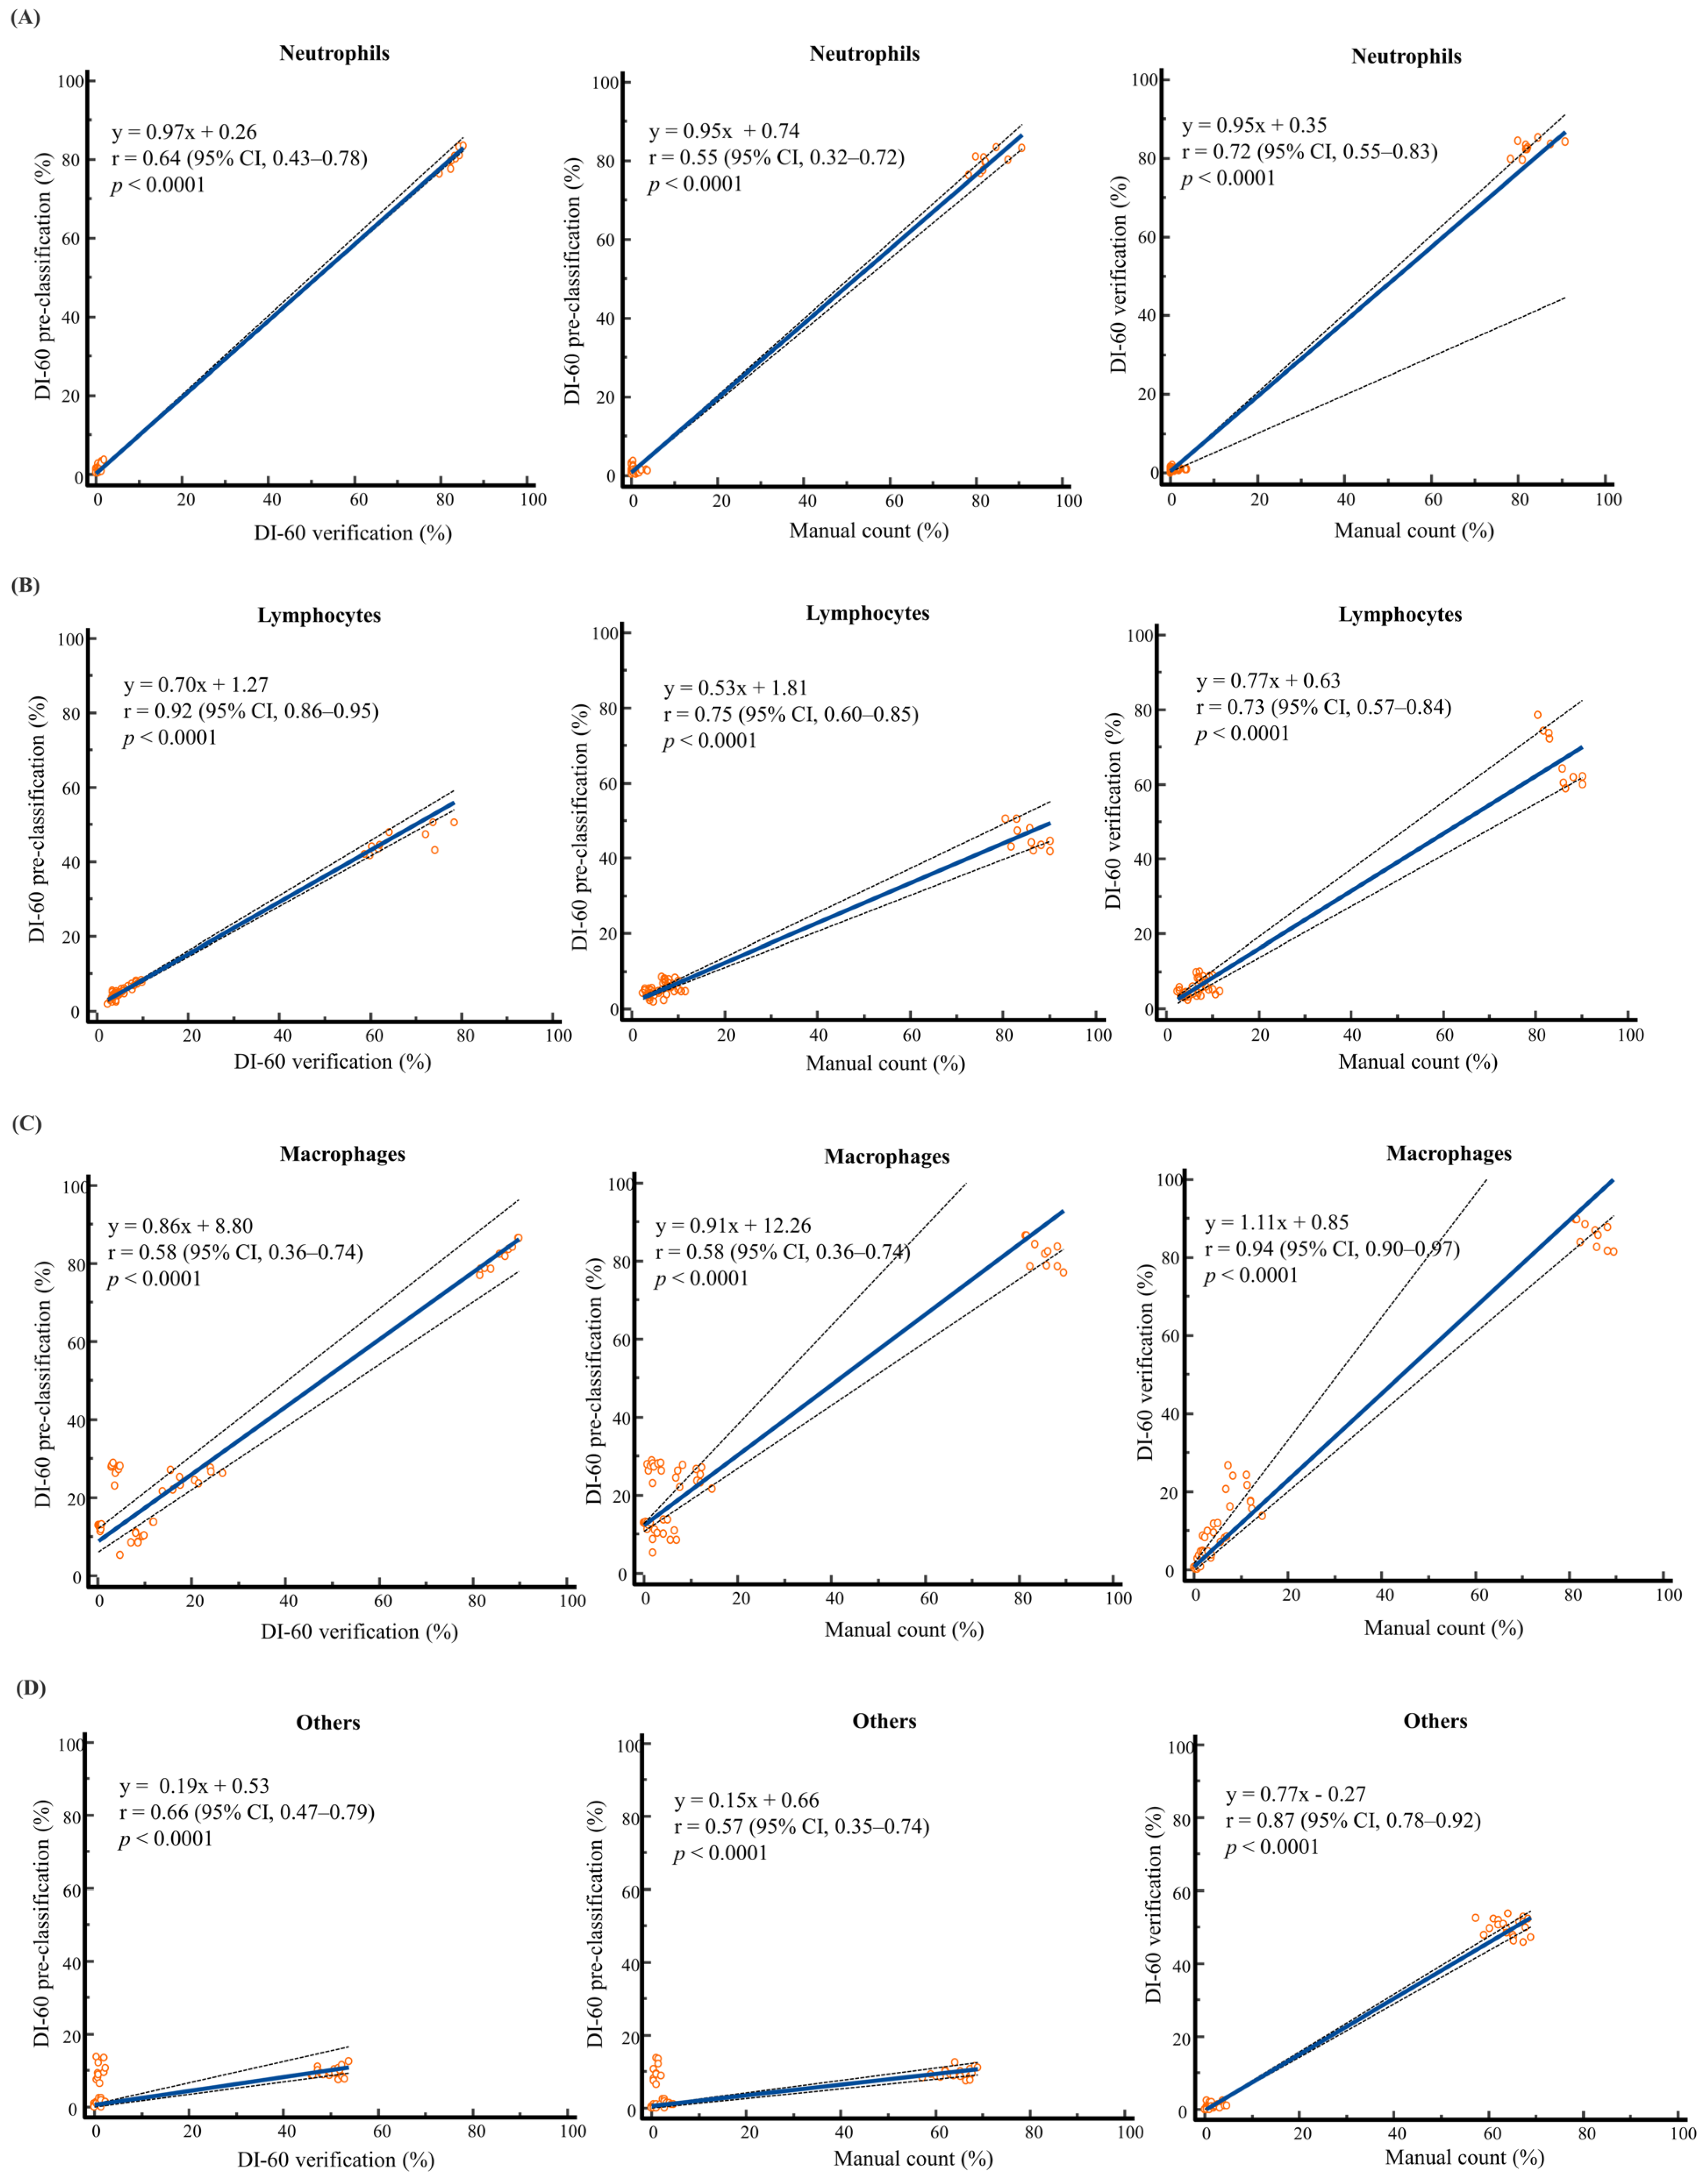
3. Results
4. Discussion
5. Conclusions
Author Contributions
Funding
Institutional Review Board Statement
Informed Consent Statement
Data Availability Statement
Conflicts of Interest
References
- Briggs, C.; Longair, I.; Slavik, M.; Thwaite, K.; Mills, R.; Thavaraja, V.; Foster, A.; Romanin, D.; Machin, S.J. Can Automated Blood Film Analysis Replace the Manual Differential? An Evaluation of the CellaVision DM96 Automated Image Analysis System. Int. J. Lab. Hematol. 2009, 31, 48–60. [Google Scholar] [CrossRef]
- Da Costa, L. Digital Image Analysis of Blood Cells. Clin. Lab. Med. 2015, 35, 105–122. [Google Scholar] [CrossRef] [PubMed]
- Leung, E.; Johnston, A.; Olsen, B.; Chang, H.; Martin, T.; Wozniak, M.; Good, D. Laboratory Practices for Manual Blood Film Review: Results of an IQMH Patterns of Practice Survey. Int. J. Lab. Hematol. 2021, 43, 184–190. [Google Scholar] [CrossRef] [PubMed]
- Kratz, A.; Lee, S.H.; Zini, G.; Riedl, J.A.; Hur, M.; Machin, S. Digital Morphology Analyzers in Hematology: ICSH Review and Recommendations. Int. J. Lab. Hematol. 2019, 41, 437–447. [Google Scholar] [CrossRef]
- Yoon, S.; Hur, M.; Lee, G.H.; Nam, M.; Kim, H. How Reproducible Is the Data from Sysmex DI-60 in Leukopenic Samples? Diagnostics 2021, 11, 2173. [Google Scholar] [CrossRef]
- Tabe, Y.; Yamamoto, T.; Maenou, I.; Nakai, R.; Idei, M.; Horii, T.; Miida, T.; Ohsaka, A. Performance Evaluation of the Digital Cell Imaging Analyzer DI-60 Integrated into the Fully Automated Sysmex XN Hematology Analyzer System. Clin. Chem. Lab. Med. 2015, 53, 281–289. [Google Scholar] [CrossRef]
- Kim, H.N.; Hur, M.; Kim, H.; Kim, S.W.; Moon, H.W.; Yun, Y.M. Performance of Automated Digital Cell Imaging Analyzer Sysmex DI-60. Clin. Chem. Lab. Med. 2018, 56, 94–102. [Google Scholar] [CrossRef] [PubMed]
- Yoon, S.; Hur, M.; Park, M.; Kim, H.; Kim, S.W.; Lee, T.-H.; Nam, M.; Moon, H.-W.; Yun, Y.-M. Performance of Digital Morphology Analyzer Vision Pro on White Blood Cell Differentials. Clin. Chem. Lab. Med. 2021, 59, 1099–1106. [Google Scholar] [CrossRef]
- Nam, M.; Yoon, S.; Hur, M.; Lee, G.H.; Kim, H.; Park, M.; Kim, H.N. Digital Morphology Analyzer Sysmex DI-60 vs. Manual Counting for White Blood Cell Differentials in Leukopenic Samples: A Comparative Assessment of Risk and Turnaround Time. Ann. Lab. Med. 2022, 42, 398–405. [Google Scholar] [CrossRef]
- Lee, G.H.; Yoon, S.; Nam, M.; Kim, H.; Hur, M. Performance of Digital Morphology Analyzer CellaVision DC-1. Clin. Chem. Lab. Med. 2023, 61, 133–141. [Google Scholar] [CrossRef]
- Kweon, O.J.; Lim, Y.K.; Lee, M.K.; Kim, H.R. Red and White Blood Cell Morphology Characterization and Hands-on Time Analysis by the Digital Cell Imaging Analyzer DI-60. PLoS ONE 2022, 17, e0267638. [Google Scholar] [CrossRef] [PubMed]
- Khongjaroensakun, N.; Chaothai, N.; Chamchomdao, L.; Suriyachand, K.; Paisooksantivatana, K. White Blood Cell Differentials Performance of a New Automated Digital Cell Morphology Analyzer: Mindray MC-80. Int. J. Lab. Hematol. 2023, 45, 691–699. [Google Scholar] [CrossRef] [PubMed]
- Kim, H.; Lee, G.-H.; Yoon, S.; Hur, M.; Kim, H.N.; Park, M.; Kim, S.W. Performance of Digital Morphology Analyzer Medica EasyCell Assistant. Clin. Chem. Lab. Med. 2023, 61, 1858–1866. [Google Scholar] [CrossRef] [PubMed]
- Zhang, S.; He, Y.; Wu, W.; Tan, H.; Xie, S.; Liu, M.; Chen, W.; Sun, D. Comparison of the Performance of Two Automatic Cell Morphology Analyzers for Peripheral-Blood Leukocyte Morphology Analysis: Mindray MC-100i and Sysmex DI-60. Int. J. Lab. Hematol. 2023, 45, 860–868. [Google Scholar] [CrossRef] [PubMed]
- Buoro, S.; Mecca, T.; Azzarà, G.; Seghezzi, M.; Dominoni, P.; Crippa, A.; Ottomano, C.; Lippi, G. Cell Population Data and Reflex Testing Rules of Cell Analysis in Pleural and Ascitic Fluids Using Body Fluid Mode on Sysmex XN-9000. Clin. Chim. Acta 2016, 452, 92–98. [Google Scholar] [CrossRef]
- de Jonge, R.; Brouwer, R.; de Graaf, M.T.; Luitwieler, R.L.; Fleming, C.; de Frankrijker-Merkestijn, M.; Smitt, P.A.E.S.; Joke GBoonstra, J.G.; Lindemans, J. Evaluation of the New Body Fluid Mode on the Sysmex XE-5000 for Counting Leukocytes and Erythrocytes in Cerebrospinal Fluid and Other Body Fluids. Clin. Chem. Lab. Med. 2010, 48, 665–675. [Google Scholar] [CrossRef]
- Zimmermann, M.; Ruprecht, K.; Kainzinger, F.; Heppner, F.L.; Weimann, A. Automated vs. Manual Cerebrospinal Fluid Cell Counts: A Work and Cost Analysis Comparing the Sysmex XE-5000 and the Fuchs-Rosenthal Manual Counting Chamber. Int. J. Lab. Hematol. 2011, 33, 629–637. [Google Scholar] [CrossRef]
- Riedl, J.A.; Dinkelaar, R.B.; Gelder, W. Automated Morphological Analysis of Cells in Body Fluids by the Digital Microscopy System DM96. J. Clin. Pathol. 2010, 63, 538–543. [Google Scholar] [CrossRef]
- Takemura, H.; Ai, T.; Kimura, K.; Nagasaka, K.; Takahashi, T.; Tsuchiya, K.; Yang, H.; Konishi, A.; Uchihashi, K.; Horii, T.; et al. Evaluation of Cell Count and Classification Capabilities in Body Fluids Using a Fully Automated Sysmex XN Equipped With High-Sensitive Analysis (hsA) Mode and DI-60 Hematology Analyzer System. PLoS ONE 2018, 13, e0195923. [Google Scholar] [CrossRef]
- Sandhaus, L.M. Body Fluid Cell Counts by Automated Methods. Clin. Lab. Med. 2015, 35, 93–103. [Google Scholar] [CrossRef]
- Martín, M.J.; Queral, L.A.; Frías, L.S.; Amado, L.V.; Merino, A.; Guadiana-Romualdo, L.G. Automated Cell Count in Body Fluids: A Review. Adv. Lab. Med. 2021, 2, 149–177. [Google Scholar]
- Boldú, L.; Laguna, J.; Casanova, A.; García, S.; Molina, A.; Merino, A. Serous Body Fluid Evaluation Using the New Automated Haematology Analyser Mindray BC-6800Plus. Clin. Chem. Lab. Med. 2022, 60, 1786–1795. [Google Scholar] [CrossRef]
- Yamatani, K.; Tabe, Y.; Ai, T.; Kimura, K.; Takemura, H.; Tsuchiya, K.; Yang, H.; Konishi, A.; Uchihashi, K.; Horii, T.; et al. Performance Evaluation of the Sysmex DI-60 Overview Application for Tumor Cell Detection in Body Fluid Samples. Int. J. Lab. Hematol. 2019, 41, e134–e138. [Google Scholar] [CrossRef] [PubMed]
- Yoon, S.; Kim, H.R. Analytical Performance of the Digital Morphology Analyzer Sysmex DI-60 for Body Fluid Cell Differential Counts. PLoS ONE 2023, 18, e0288551. [Google Scholar] [CrossRef] [PubMed]
- Sysmex. Automated Digital Cell Morphology System DI-60. February 2021. Available online: https://www.sysmex.com/US/en/brochures/di-60-brochure_mkt-10-1196%20rev5.pdf (accessed on 15 November 2023).
- Clinical and Laboratory Standards Institute (CLSI). Body Fluid Analysis for Cellular Composition; Approved Guideline, 1st ed.; CLSI document H56-A; CLSI: Wayne, PA, USA, 2006. [Google Scholar]
- Bourner, G.; De la Salle, B.; George, T.; Tabe, Y.; Baum, H.; Culp, N.; Keng, T.B.; the International Committee for Standardization in Hematology (ICSH). ICSH Guidelines for the Verification and Performance of Automated Cell Counters for Body Fluids. Int. J. Lab. Hematol. 2014, 36, 598–612. [Google Scholar] [CrossRef] [PubMed]
- Barnhart, H.X.; Barboriak, D.P. Applications of the Repeatability of Quantitative Imaging Biomarkers: A Review of Statistical Analysis of Repeat Data Sets. Transl. Oncol. 2009, 2, 231–235. [Google Scholar] [CrossRef] [PubMed]
- Clinical and Laboratory Standards Institute (CLSI). Evaluation of Qualitative, Binary Output Examination Performance; CLSI document EP12-Ed3; CLSI: Wayne, PA, USA, 2023. [Google Scholar]
- Clinical and Laboratory Standards Institute (CLSI). Measurement Procedure Comparison and Bias Estimation Using Patient Samples; CLSI document EP09c-Ed3; CLSI: Wayne, PA, USA, 2018. [Google Scholar]
- Mukaka, M.M. Statistics Corner: A Guide to Appropriate Use of Correlation Coefficient in Medical Research. Malawi. Med. J. 2012, 24, 69–71. [Google Scholar] [PubMed]
- McHugh, M.L. Interrater Reliability: The Kappa Statistic. Biochem. Med. 2012, 22, 276–282. [Google Scholar] [CrossRef]
- Njoroge, S.W.; Nichols, J.H. Risk Management in the Clinical Laboratory. Ann. Lab. Med. 2014, 34, 274–278. [Google Scholar] [CrossRef]
- Herman, D.S.; Rhoads, D.D.; Schulz, W.L.; Durant, T.J.S. Artificial Intelligence and Mapping a New Direction in Laboratory Medicine: A Review. Clin. Chem. 2021, 67, 1466–1482. [Google Scholar] [CrossRef]
- Rabbani, N.; Kim, G.Y.E.; Suarez, C.J.; Chen, J.H. Applications of Machine Learning in Routine Laboratory Medicine: Current State and Future Directions. Clin. Biochem. 2022, 103, 1–7. [Google Scholar] [CrossRef] [PubMed]

| BF Samples | Cell Class | XN-9000 | DI-60 | Manual Count | DI-60 Repeatability | Mean Difference (%, 95% CI) | |||
|---|---|---|---|---|---|---|---|---|---|
| Cell n/μL (%) | Cell n/Slide, Median (IQR) | Cell n/Slide, Median (IQR) | SD (%CV) | Pre-Classification vs. Manual Counting | Verification vs. Manual Counting | ||||
| Pre-Classification | Verification | Pre-Classification | Verification | ||||||
| Neutrophil-dominant | N | 672 (86.9) | 168 (162.8–170.8) | 173.5 (171.3–176.8) | 175 (174–180.5) | 5.21 (0.03) | 4.11 (0.02) | −3.13 (−8.51 to 2.26) | −0.27 (−6.30 to 5.77) |
| L | 36 (4.7) | 7.5 (5.3–9.8) | 9 (7.5–9.8) | 8 (6.5–8.8) | 2.67 (0.35) | 2.07 (0.24) | −0.28 (−4.78 to 4.22) | 0.20 (−3.50 to 3.89) | |
| E | 1 (0.1) | 1 (0–1) | 0 (0–0) | 0 (0–0) | 0.67 (0.96) | 0.63 (3.16) | 0.29 (−0.37 to 0.94) | 0.10 (−0.49 to 0.68) | |
| M | 64 (8.3) † | 21.5 (18–22.8) | 18 (17–20.8) | 9 (5.3–11.8) | 5.38 (0.26) | 4.50 (0.24) | 5.87 (0.54 to 11.21) | 4.68 (−0.28 to 9.64) | |
| O * | NA | 3 (2–3.8) | 2 (1.25–3) | 6 (5.3–7.8) | 1.52 (0.53) | 1.25 (0.54) | −1.57 (−4.09 to 0.95) | −1.86 (−3.86 to 0.15) | |
| S | NA | 5 (3.25–6) | 4 (3–4.8) | 11.5 (7.8–12) | 1.64 (0.35) | 1.89 (0.44) | −2.63 (−6.45 to 1.19) | −2.63 (−6.45 to 1.19) | |
| A | NA | 3 (1.25–3) | 2 (1.3–3) | 2.5 (2–4) | 1.35 (0.52) | 1.45 (0.69) | −0.07 (−2.16 to 2.02) | −0.32 (−2.17 to 1.55) | |
| U | NA | 3 (2–3) | 0 (0–0) | 0 (0–0) | 0.95 (0.35) | 0.42 (2.11) | 1.28 (0.41 to 2.16) | 0.10 (−0.30 to 0.49) | |
| Lymphocyte-dominant | N | 8 (1.2) | 2 (2–2) | 2 (2–2) | 0.5 (0–1) | 0.82 (0.41) | 0.79 (0.44) | 0.46 (−0.53 to 1.45) | 0.38 (−0.59 to 1.36) |
| L | 623 (89.9) | 113 (108.5–115.8) | 156 (151.8–173.3) | 175 (171.3–179.8) | 4.98 (0.04) | 12.67 (0.08) | −40.09 (−51.92 to −28.25) | −18.99 (−39.34 to 1.36) | |
| E | 0 (0.0) | 0.5 (0–1) | 0 (0–0) | 0 (0–0) | 0.70 (1.17) | 0.0 (NA) | 0.14 (−0.67 to 0.96) | −0.10 (−0.50 to 0.30) | |
| M | 62 (8.9) | 62.5 (59–64) | 48.5 (41.3–58.8) | 23 (16.3–25) | 5.80 (0.09) | 15.44 (0.30) | 14.38 (7.01 to 21.75) | 9.35 (−2.75 to 21.46) | |
| O | NA | 24 (21.3–27.8) | 2 (1.3–3) | 2 (1.3–2.8) | 5.28 (0.22) | 1.51 (0.60) | 8.99 (4.33 to 13.65) | 0.15 (−1.60 to 1.90) | |
| S | NA | 6.5 (6–10.5) | 5.5 (5–8.8) | 3 (3–5.5) | 3.02 (0.38) | 2.99 (0.46) | 1.52 (−0.85 to 3.89) | 0.73 (−1.78 to 3.23) | |
| A | NA | 26 (16.5–34.8) | 20.5 (12–25.5) | 1 (1–2) | 14.61 (0.51) | 13.47 (0.62) | 10.43 (1.77 to 19.09) | 8.09 (−1.86 to 18.04) | |
| U | NA | 10 (8.5–11) | 1 (0–1) | 0 (0–0) | 2.82 (0.28) | 0.99 (1.10) | 4.17 (1.71 to 6.62) | 0.37 (−0.46 to 1.20) | |
| Macrophage-dominant | N | 14 (14.6) | 4.5 (4–6) | 1 (1–2.8) | 0 (0–1) | 1.85 (0.38) | 1.35 (0.84) | 1.95 (0.24 to 3.66) | 0.48 (−0.85 to 1.81) |
| L | 39 (40.6) | 11 (10–12.8) | 10.5 (8.3–11.8) | 17 (14.5–21.5) | 1.48 (0.13) | 2.00 (0.19) | −3.20 (−8.14 to 1.74) | −3.57 (−8.22 to 1.07) | |
| E | 0 (0.0) | 0 (0–0) | 0 (0–0) | 0 (0–0) | 0.32 (3.16) | 0.00 (NA) | 0.04 (−0.22 to 0.31) | 0.00 (0.00 to 0.00) | |
| M | 43 (44.8) | 183.5 (183–184.8) | 192 (192–193.8) | 181.5 (177.8–185.3) | 2.06 (0.01) | 2.62 (0.01) | −3.38 (−14.69 to 7.93) | 0.58 (−10.41 to 11.56) | |
| O | NA | 0 (0–1) | 0 (0–0) | 0.5 (0–1) | 0.71 (1.41) | 0.00 (NA) | −0.05 (−0.97 to 0.87) | −0.28 (−0.94 to 0.37) | |
| S | NA | 6 (5–7) | 3 (2–3) | 6 (4.3–6.8) | 1.66 (0.27) | 1.60 (0.55) | 0.17 (−1.81 to 2.15) | −1.25 (−3.80 to 1.31) | |
| A | NA | 11.5 (10–23) | 11.5 (9.3–25.5) | 8 (5.5–9.8) | 7.69 (0.49) | 9.22 (0.55) | 3.37 (−4.01 to 10.74) | 3.79 (−4.85 to 12.42) | |
| U | NA | 2.5 (1.25–3) | 0 (0–1) | 0 (0–0) | 1.35 (0.54) | 0.84 (1.41) | 1.10 (−0.02 to 2.22) | 0.26 (−0.45 to 0.96) | |
| Abnormal lymphocyte-dominant | N | 17 (10.3) | 6 (6–6.8) | 4 (4–4.8) | 0 (0–1) | 0.74 (0.12) | 0.63 (0.15) | 0.69 (0.26 to 1.12) | 0.43 (−0.05 to 0.91) |
| L | 28 (17.1) | 28.5 (27–29.8) | 26.5 (25.3–27) | 11 (10–11.8) | 2.62 (0.09) | 2.25 (0.09) | −0.17 (−1.60 to 1.27) | −0.48 (−1.89 to 0.93) | |
| E | 0 (0.0) | 1.5 (1–2.8) | 0 (0–0) | 0 (0–0) | 1.34 (0.79) | 0.0 (NA) | 0.23 (−0.13 to 0.60) | 0.00 (0.00 to 0.00) | |
| M | 119 (72.6) | 93 (88.5–95.5) | 4 (2.5–4.8) | 2 (1–2) | 4.06 (0.04) | 1.69 (0.44) | 11.89 (10.42 to 13.36) | −0.11 (−0.90 to 0.67) | |
| O | NA | 70.5 (69.25–4.75) | 362.5 (352.3–370.5) | 187 (186–187.8) | 3.81 (0.05) | 19.69 (0.05) | −56.38 (−59.67 to −53.08) | −17.18 (−23.19 to −11.17) | |
| S | NA | 109.5 (103.3–112.5) | 195 (188.5–206.3) | 67.5 (63–75.5) | 6.87 (0.06) | 13.94 (0.07) | −9.16 (−15.54 to −2.77) | 3.23 (−2.25 to 8.72) | |
| A | NA | 248.4 (230–267.8) | 118.5 (123.8–113.5) | 7 (6.25–8) | 29.84 (0.12) | 28.43 (0.23) | 30.98 (26.27 to 35.69) | 14.51 (7.94 to 21.08) | |
| U | NA | 183 (176.3–188.8) | 20 (18.5–23) | 8 (6–9) | 12.53 (0.07) | 4.37 (0.22) | 21.91 (18.90 to 24.91) | −0.01 (−1.72 to 1.70) | |
| Malignant cell-dominant | N | 109 (4.9) | 4.5 (4–6) | 4 (4–4) | 5 (4.25–6) | 1.29 (0.26) | 0.57 (0.14) | −1.08 (−2.55 to 0.40) | −1.26 (−2.82 to 0.31) |
| L | 540 (23.7) | 33.5 (31.3–35) | 37.5 (35.3–39.5) | 20.5 (19–22.5) | 3.28 (0.10) | 3.99 (0.11) | −0.52 (−3.44 to 2.39) | 0.57 (−2.47 to 3.62) | |
| E | 14 (0.6) | 0 (0–0) | 0 (0–0) | 0 (0–0) | 0 (NA) | 0.0 (NA) | 0.0 (0.0 to 0.0) | 0.0 (0.0 to 0.0) | |
| M | 1611 (70.8) | 121 (120–125.5) | 17 (15.5–20) | 5 (4.25–7.5) | 5.96 (0.05) | 2.80 (0.16) | 24.99 (21.32 to 28.66) | 1.75 (−0.54 to 4.03) | |
| O | NA | 39.5 (37–44) | 231 (222.8–234) | 169.5 (163.5–170) | 7.28 (0.18) | 13.18 (0.06) | −53.24 (−60.41 to −46.07) | −11.35 (−18.18 to −4.52) | |
| S | NA | 73.5 (70.3–74.8) | 132.5 (125.5–138) | 54.5 (48.3–63.5) | 4.92 (0.07) | 8.79 (0.07) | −3.75 (−10.17 to 2.67) | 9.54 (4.32 to 14.76) | |
| A | NA | 85 (81.5–88.3) | 18.5 (13–23.3) | 7.5 (5.5–10) | 6.87 (0.08) | 9.30 (0.46) | 15.73 (12.78 to 18.69) | 0.97 (−3.58 to 5.52) | |
| U | NA | 89 (82.8–92.5) | 6 (5–7) | 4.5 (4–5) | 9.21 (0.11) | 2.72 (0.42) | 17.87 (14.29 to 21.45) | −0.22 (−1.37 to 0.93) | |
| BF Samples | Cell Class | Total Cell n | Sensitivity (%) | Specificity (%) | Efficiency (%) | ||||
|---|---|---|---|---|---|---|---|---|---|
| Pre-Classification | Verification | Pre-Classification | Verification | Pre-Classification | Verification | Pre-Classification | Verification | ||
| Neutrophil-dominant | N | 1677 | 1737 | 95.1 (94.0–96.0) | 98.1 (97.3–98.7) | 100 (98.9–100) | 97.9 (95.8–99.2) | 95.9 (94.9–96.7) | 98.0 (97.4–98.6) |
| L | 76 | 86 | 74.7 (64.0–83.6) | 83.1 (73.3–90.5) | 99.3 (98.8–99.6) | 99.2 (98.7–99.5) | 98.3 (97.7–98.8) | 98.5 (97.9–99.0) | |
| E | 7 | 2 | NA | NA | 99.7 (99.3–99.9) | 99.9 (99.7–100) | NA | NA | |
| M | 211 | 186 | 42.2 (35.4–49.2) | 100 (95.9–100) | 100 (99.8–100) | 95.2 (94.1–96.1) | 94.2 (93.1–95.2) | 95.4 (94.4–96.2) | |
| O * | 29 | 23 | 46.0 (33.4–59.1) | 36.5 (24.7–49.6) | 100 (99.8–100) | 100 (99.8–100) | 98.4 (97.7–98.9) | 98.1 (97.4–98.6) | |
| S | 47 | 43 | 45.0 (35.0–55.3) | 90.7 (77.9–97.4) | 99.9 (99.6–100) | 97.0 (96.2–97.7) | 97.3 (96.5–97.9) | 96.9 (96.1–97.6) | |
| A | 26 | 21 | 64.3 (44.1–81.4) | 60.7 (40.6–78.5) | 99.6 (99.2–99.8) | 99.8 (99.5–99.9) | 99.1 (98.6–99.5) | 99.3 (98.8–99.6) | |
| U | 27 | 2 | NA | NA | 98.7 (98.1–99.2) | 99.9 (99.7–100) | NA | NA | |
| Lymphocyte-dominant | N | 20 | 18 | 85.7 (42.1–99.6) | 85.7 (42.1–99.6) | 99.4 (99.0–99.7) | 99.5 (99.1–99.7) | 99.4 (99.0–99.7) | 99.5 (99.1–99.7) |
| L | 1118 | 1617 | 63.7 (61.4–65.9) | 90.8 (89.3–92.1) | 100 (99.5–100) | 96.8 (95.2–97.9) | 74.1 (72.3–75.8) | 92.5 (91.4–93.5) | |
| E | 6 | 0 | 0 (0–84.2) | 0 (0–84.2) | 99.8 (99.5–99.9) | 100 (99.9–100) | 99.7 (99.4–99.9) | 99.9 (99.7–100) | |
| M | 611 | 516 | 100 (98.3–100) | 100 (98.3–100) | 82.4 (80.7–83.9) | 86.6 (85.1–88.0) | 83.9 (82.4–85.3) | 87.8 (86.4–89.0) | |
| O | 245 | 25 | 100 (83.9–100) | 76.2 (52.8–91.8) | 90.8 (89.6–92.0) | 99.5 (99.1–99.7) | 90.9 (89.7–92.0) | 99.4 (98.9–99.6) | |
| S | 80 | 65 | 97.4 (86.5–99.9) | 53.8 (41.0–66.3) | 98.3 (97.7–98.8) | 99.8 (99.6–100) | 98.3 (97.7–98.7) | 98.6 (98.1–99.0) | |
| A | 287 | 219 | 100 (76.8–100) | 100 (76.8–100) | 88.9 (87.6–90.1) | 91.7 (90.5–92.7) | 89.0 (87.7–90.2) | 91.7 (90.5–92.8) | |
| U | 102 | 9 | NA | NA | 95.9 (95.0–96.6) | 99.6 (99.3–99.8) | NA | NA | |
| Macrophage-dominant | N | 49 | 16 | 100 (47.8–100) | 80.0 (28.4–99.5) | 98.0 (97.4–98.6) | 99.5 (99.1–99.7) | 98.0 (97.4–98.6) | 99.4 (99.0–99.7) |
| L | 112 | 103 | 61.7 (54.1–68.9) | 58.3 (50.6–65.7) | 99.8 (99.5–99.9) | 100 (99.7–100) | 96.8 (96.0–97.5) | 96.7 (95.9–97.4) | |
| E | 1 | 0 | NA | NA | 100 (100–100) | 100 (99.8–100) | NA | NA | |
| M | 1833 | 1922 | 99.3 (98.8–99.6) | 100 (99.8–100) | 92.6 (89.7–94.9) | 74.9 (70.5–78.9) | 98.0 (97.3–98.5) | 95.2 (94.2–96.0) | |
| O | 5 | 0 | 33.3 (4.3–77.7) | 0 (0–45.9) | 99.9 (99.6–100) | 100 (99.8–100) | 99.7 (99.4–99.9) | 99.7 (99.4–99.9) | |
| S | 61 | 29 | 90.7 (79.7–96.9) | 46.3 (32.6–60.4) | 99.5 (99.0–99.7) | 99.8 (99.5–100) | 99.2 (98.8–99.6) | 98.5 (97.9–99.0) | |
| A | 158 | 168 | 46.8 (38.9–54.9) | 96.1 (88.9–99.2) | 99.9 (99.7–100) | 95.6 (94.7–96.4) | 96.1 (95.3–96.9) | 95.6 (94.7–96.4) | |
| U | 25 | 6 | NA | NA | 98.9 (98.4–99.3) | 99.7 (99.4–99.9) | NA | NA | |
| Abnormal lymphocyte-dominant | N | 61 | 42 | 100 (39.8–100) | 100 (39.8–100) | 99.2 (99.0–99.4) | 99.5 (99.3–99.6) | 99.2 (99.0–99.4) | 99.5 (99.3–99.6) |
| L | 282 | 258 | 100 (96.8–100) | 100 (96.8–100) | 97.7 (97.3–98.0) | 98.0 (97.6–98.3) | 97.7 (97.3–98.0) | 98.0 (97.7–98.3) | |
| E | 17 | 0 | NA | NA | 99.8 (99.6–99.9) | 100 (100–100) | NA | NA | |
| M | 924 | 38 | 100 (81.5–100) | 100 (81.5–100) | 87.7 (86.9–88.4) | 99.7 (99.6–99.8) | 87.7 (87.0–88.5) | 99.7 (99.6–99.8) | |
| O | 716 | 3598 | 38.4 (36.2–40.6) | 100 (99.8–100) | 100 (99.9–100) | 68.6 (67.4–69.9) | 84.4 (83.6–85.3) | 76.6 (75.6–77.5) | |
| S | 1084 | 1992 | 100 (99.5–100) | 100 (99.5–100) | 93.9 (93.3–94.5) | 80.4 (79.4–81.3) | 94.5 (93.9–95.0) | 82.2 (81.3–83.1) | |
| A | 2484 | 1260 | 100 (95.0–100) | 100 (95.0–100) | 67.0 (65.9–68.1) | 83.8 (82.9–84.6) | 67.4 (66.3–68.4) | 83.9 (83.1–84.8) | |
| U | 1820 | 200 | 100 (95.3–100) | 100 (95.3–100) | 76.2 (75.2–77.1) | 98.3 (98.0–98.6) | 76.4 (75.4–77.4) | 98.3 (98.0–98.6) | |
| Malignant cell-dominant | N | 49 | 41 | 79.3 (66.6–88.8) | 100 (91.4–100) | 99.9 (99.8–100) | 99.6 (99.4–99.8) | 99.7 (99.4–99.8) | 99.6 (99.4–99.8) |
| L | 329 | 378 | 100 (98.3–100) | 100 (98.3–100) | 97.2 (96.7–97.7) | 96.1 (95.5–96.7) | 97.4 (96.9–97.8) | 96.3 (95.7–96.8) | |
| E | 0 | 0 | NA | NA | 100 (99.9–100) | 100 (99.9–100) | NA | NA | |
| M | 1210 | 174 | 100 (93.8–100) | 100 (93.8–100) | 73.8 (72.5–75.1) | 97.4 (96.8–97.8) | 74.2 (72.9–75.5) | 97.4 (96.9–97.8) | |
| O | 412 | 2281 | 24.7 (22.6–26.8) | 100 (99.8–100) | 100 (99.9–100) | 78.1 (76.5–79.7) | 71.8 (70.4–73.1) | 86.3 (85.3–87.3) | |
| S | 728 | 1321 | 100 (99.3–100) | 100 (99.3–100) | 95.2 (94.5–95.9) | 80.1 (78.8–81.3) | 95.8 (95.2–96.4) | 82.5 (81.3–83.6) | |
| A | 859 | 200 | 100 (96.2–100) | 100 (96.2–100) | 82.5 (81.3–83.6) | 97.6 (97.1–98.0) | 82.8 (81.7–83.9) | 97.6 (97.1–98.1) | |
| U | 873 | 65 | 100 (92.1–100) | 95.6 (84.9–99.5) | 81.2 (80.1–82.4) | 99.5 (99.2–99.7) | 81.4 (80.3–82.6) | 99.5 (99.2–99.7) | |
| Neutrophil-dominant (total cells n = 2100), κ* = 0.81 (0.79–0.84) | ||||||||
| Pre-classification | Verification | |||||||
| N (n = 1737) | L (n = 86) | E (n = 2) | M (n = 186) | O (n = 23) | S (n = 43) | A (n = 21) | U (n = 2) | |
| N (n = 1677) | 1677 | 0 | 0 | 0 | 0 | 0 | 0 | 0 |
| L (n = 76) | 8 | 64 | 0 | 0 | 0 | 4 | 0 | 0 |
| E (n = 7) | 3 | 0 | 2 | 0 | 0 | 1 | 1 | 0 |
| M (n = 211) | 19 | 3 | 0 | 182 | 4 | 1 | 1 | 1 |
| O (n = 29) | 10 | 12 | 0 | 0 | 4 | 3 | 0 | 0 |
| S (n = 47) | 7 | 2 | 0 | 1 | 4 | 28 | 4 | 0 |
| A (n = 26) | 2 | 0 | 0 | 1 | 3 | 4 | 15 | 1 |
| U (n = 27) | 10 | 5 | 0 | 2 | 8 | 2 | 0 | 0 |
| Lymphocyte-dominant (total cells n = 2469), κ = 0.58 (0.56–0.61) | ||||||||
| Pre-classification | Verification | |||||||
| N (n = 18) | L (n = 1617) | E (n = 0) | M (n = 516) | O (n = 25) | S (n = 65) | A (n = 219) | U (n = 9) | |
| N (n = 20) | 12 | 1 | 0 | 4 | 0 | 2 | 0 | 1 |
| L (n = 1118) | 1 | 1116 | 0 | 0 | 1 | 0 | 0 | 0 |
| E (n = 6) | 5 | 1 | 0 | 0 | 0 | 0 | 0 | 0 |
| M (n = 611) | 0 | 129 | 0 | 453 | 11 | 1 | 17 | 0 |
| O (n = 245) | 0 | 242 | 0 | 1 | 0 | 0 | 2 | 0 |
| S (n = 80) | 0 | 22 | 0 | 2 | 1 | 44 | 10 | 1 |
| A (n = 287) | 0 | 37 | 0 | 47 | 6 | 13 | 181 | 3 |
| U (n = 102) | 0 | 69 | 0 | 9 | 6 | 5 | 9 | 4 |
| Macrophage-dominant (total cells n = 2244), κ = 0.77 (0.73–0.80) | ||||||||
| Pre-classification | Verification | |||||||
| N (n = 16) | L (n = 103) | E (n = 0) | M (n = 1922) | O (n = 0) | S (n = 29) | A (n = 168) | U (n = 6) | |
| N (n = 49) | 16 | 0 | 0 | 26 | 0 | 0 | 6 | 1 |
| L (n = 112) | 0 | 88 | 0 | 19 | 0 | 1 | 1 | 3 |
| E (n = 1) | 0 | 0 | 0 | 0 | 0 | 0 | 0 | 1 |
| M (n = 1833) | 0 | 10 | 0 | 1816 | 0 | 3 | 4 | 0 |
| O (n = 5) | 0 | 4 | 0 | 0 | 0 | 1 | 0 | 0 |
| S (n = 61) | 0 | 0 | 0 | 31 | 0 | 22 | 8 | 0 |
| A (n = 158) | 0 | 0 | 0 | 11 | 0 | 0 | 147 | 0 |
| U (n = 25) | 0 | 1 | 0 | 19 | 0 | 2 | 2 | 1 |
| Abnormal lymphocyte-dominant (total cells n = 7388), κ = 0.32 (0.31–0.33) | ||||||||
| Pre-classification | Verification | |||||||
| N (n = 42) | L (n = 258) | E (n = 0) | M (n = 38) | O (n = 3598) | S (n = 1992) | A (n = 1260) | U (n = 200) | |
| N (n = 61) | 39 | 0 | 0 | 0 | 0 | 10 | 10 | 2 |
| L (n = 282) | 0 | 225 | 0 | 2 | 11 | 25 | 14 | 5 |
| E (n = 17) | 0 | 0 | 0 | 0 | 11 | 6 | 0 | 0 |
| M (n = 924) | 3 | 5 | 0 | 32 | 615 | 224 | 8 | 37 |
| O (n = 716) | 0 | 6 | 0 | 0 | 646 | 57 | 4 | 3 |
| S (n = 1084) | 0 | 8 | 0 | 1 | 114 | 941 | 4 | 16 |
| A (n = 2484) | 0 | 1 | 0 | 0 | 715 | 447 | 1213 | 108 |
| U (n = 1820) | 0 | 13 | 0 | 3 | 1486 | 282 | 7 | 29 |
| Malignant cell-dominant (total cells n = 4460), κ = 0.29 (0.27–0.30) | ||||||||
| Pre-classification | Verification | |||||||
| N (n = 41) | L (n = 378) | E (n = 0) | M (n = 174) | O (n = 2281) | S (n = 1321) | A (n = 200) | U (n = 65) | |
| N (n = 49) | 38 | 0 | 0 | 5 | 0 | 0 | 3 | 3 |
| L (n = 329) | 0 | 294 | 0 | 0 | 3 | 29 | 2 | 1 |
| E (n = 0) | 0 | 0 | 0 | 0 | 0 | 0 | 0 | 0 |
| M (n = 1210) | 1 | 39 | 0 | 142 | 969 | 57 | 0 | 2 |
| O (n = 412) | 0 | 34 | 0 | 0 | 300 | 76 | 1 | 1 |
| S (n = 728) | 1 | 0 | 0 | 14 | 6 | 696 | 4 | 7 |
| A (n = 859) | 0 | 0 | 0 | 4 | 430 | 218 | 178 | 29 |
| U (n = 873) | 1 | 11 | 0 | 9 | 573 | 245 | 12 | 22 |
| Process Step | TAT (min: s) (Median, IQR) | |||||
|---|---|---|---|---|---|---|
| Total (n = 50) | Neutrophil-Dominant (n = 10) | Lymphocyte-Dominant (n = 10) | Macrophage-Dominant (n = 10) | Abnormal Lymphocyte-Dominant (n = 10) | Malignant Cell-Dominant (n = 10) | |
| DI-60 | ||||||
| 1. Preparing for scan | 0:56 (0:51–1:05) | 0:50 (0:49–0:51) | 0:49 (0:49–0:51) | 1:15 (1:14–1:16) | 0:55 (0:55–0:56) | 1:04 (1:04–1:05) |
| 2. Scanning ideal zone | 0:21 (0:21–0:21) | 0:21 (0:21–0:22) | 0:21 (0:21–0:21) | 0:21 (0:21–0:21) | 0:21 (0:21–0:21) | 0:21 (0:21–0:21) |
| 3. Pre-classification | 2:50 (2:05–6:47) | 1:27 (1:20–1:29) | 2:10 (2:05–2:13) | 2:50 (2:43–3:05) | 11:23 (11:08–11:41) | 6:36 (6:25–6:47) |
| 4. Verification | 2:58 (1:17–4:56) | 1:28 (1:11–1:35) | 2:58 (2:27–3:03) | 0:59 (0:51–1:06) | 8:18 (7:44–8:44) | 4:31 (4:21–4:56) |
| Total * | 6:28 (5:12–12:53) | 4:06 (3:55–4:11) | 6:17 (5:43–6:30) | 5:27 (5:12–5:50) | 21:05 (20:16–21:53) | 12:34 (12:29–12:53) |
| Manual counting | ||||||
| 1. Placing a slide on the microscope | 0:05 (0:04–0:05) | 0:05 (0:04–0:05) | 0:05 (0:04–0:05) | 0:05 (0:05–0:06) | 0:05 (0:04–0:05) | 0:05 (0:05–0:05) |
| 2. Scanning ideal zone | 0:07 (0:06–0:08) | 0:08 (0:06–0:08) | 0:07 (0:07–0:07) | 0:07 (0:06–0:08) | 0:07 (0:07–0:08) | 0:07 (0:07–0:08) |
| 3. Counting cells | 1:28 (1:23–1:42) | 1:21 (1:19–1:24) | 1:24 (1:21–1:25) | 1:23 (1:23–1:27) | 1:42 (1:39–1:44) | 1:59 (1:56–2:09) |
| 4. Recording results | 0:11 (0:09–0:13) | 0:11 (0:10–0:13) | 0:12 (0:10–0:13) | 0:11 (0:10–0:12) | 0:13 (0:10–0:14) | 0:08 (0:08–0:12) |
| Total * | 1:53 (1:46–2:10) | 1:45 (1:41–1:49) | 1:48 (1:45–1:50) | 1:49 (1:46–1:54) | 2:06 (2:02–2:11) | 2:25 (2:16–2:29) |
Disclaimer/Publisher’s Note: The statements, opinions and data contained in all publications are solely those of the individual author(s) and contributor(s) and not of MDPI and/or the editor(s). MDPI and/or the editor(s) disclaim responsibility for any injury to people or property resulting from any ideas, methods, instructions or products referred to in the content. |
© 2024 by the authors. Licensee MDPI, Basel, Switzerland. This article is an open access article distributed under the terms and conditions of the Creative Commons Attribution (CC BY) license (https://creativecommons.org/licenses/by/4.0/).
Share and Cite
Shin, E.; Hur, M.; Kim, H.; Lee, G.-H.; Hong, M.-H.; Nam, M.; Lee, S. Performance Assessment of Sysmex DI-60: Is Digital Morphology Analyzer Reliable for White Blood Cell Differentials in Body Fluids? Diagnostics 2024, 14, 592. https://doi.org/10.3390/diagnostics14060592
Shin E, Hur M, Kim H, Lee G-H, Hong M-H, Nam M, Lee S. Performance Assessment of Sysmex DI-60: Is Digital Morphology Analyzer Reliable for White Blood Cell Differentials in Body Fluids? Diagnostics. 2024; 14(6):592. https://doi.org/10.3390/diagnostics14060592
Chicago/Turabian StyleShin, Eunju, Mina Hur, Hanah Kim, Gun-Hyuk Lee, Mi-Hyun Hong, Minjeong Nam, and Seungho Lee. 2024. "Performance Assessment of Sysmex DI-60: Is Digital Morphology Analyzer Reliable for White Blood Cell Differentials in Body Fluids?" Diagnostics 14, no. 6: 592. https://doi.org/10.3390/diagnostics14060592
APA StyleShin, E., Hur, M., Kim, H., Lee, G.-H., Hong, M.-H., Nam, M., & Lee, S. (2024). Performance Assessment of Sysmex DI-60: Is Digital Morphology Analyzer Reliable for White Blood Cell Differentials in Body Fluids? Diagnostics, 14(6), 592. https://doi.org/10.3390/diagnostics14060592