

Longitudinal Risk Analysis of Second Primary Cancer after Curative Treatment in Patients with Rectal Cancer


 , ,
, , 
Abstract
1. Introduction
2. Materials and Methods
2.1. Ethic Statement
2.2. Study Population
2.3. The Evidence-Based Clinical Decision-Making Model
3. Results
4. Discussion
5. Conclusions
Author Contributions
Funding
Institutional Review Board Statement
Informed Consent Statement
Data Availability Statement
Conflicts of Interest
References
- Siegel, R.L.; Miller, K.D.; Fuchs, H.E.; Jemal, A. Cancer statistics, 2022. CA Cancer J. Clin. 2022, 72, 7–33. [Google Scholar] [CrossRef] [PubMed]
- Gollins, S.; Sebag-Montefiore, D. Neoadjuvant Treatment Strategies for Locally Advanced Rectal Cancer. Clin. Oncol. 2016, 28, 146–151. [Google Scholar] [CrossRef] [PubMed]
- Salazar, R.; Capdevila, J.; Laquente, B.; Manzano, J.L.; Pericay, C.; Villacampa, M.M.; López, C.; Losa, F.; Safont, M.J.; Gómez, A.; et al. A randomized phase II study of capecitabine-based chemoradiation with or without bevacizumab in resectable locally advanced rectal cancer: Clinical and biological features. BMC Cancer 2015, 15, 60. [Google Scholar] [CrossRef] [PubMed]
- Bando, H.; Tsukada, Y.; Ito, M.; Yoshino, T. Novel Immunological Approaches in the Treatment of Locally Advanced Rectal Cancer. Clin. Color. Cancer 2022, 21, 3–9. [Google Scholar] [CrossRef] [PubMed]
- Liu, L.; Lemmens, V.E.; De Hingh, I.H.; de Vries, E.; Roukema, J.A.M.; van Leerdam, M.E.; Coebergh, J.W.M.; Soerjomataram, I.M. Second primary cancers in subsites of colon and rectum in patients with previous colorectal cancer. Dis. Colon. Rectum 2013, 56, 158–168. [Google Scholar] [CrossRef] [PubMed]
- Yang, L.; Xiong, Z.; Xie, Q.K.; He, W.; Liu, S.; Kong, P.; Jiang, C.; Xia, X.; Xia, L. Second primary colorectal cancer after the initial primary colorectal cancer. BMC Cancer 2018, 18, 931. [Google Scholar] [CrossRef] [PubMed]
- Cui, Y.; Han, B.; Zhang, H.; Liu, H.; Zhang, F.; Niu, R. Identification of Metabolic-Associated Genes for the Prediction of Colon and Rectal Adenocarcinoma. Onco Targets Ther. 2021, 14, 2259–2277. [Google Scholar] [CrossRef]
- Robertson, D.; Ng, S.K.; Baade, P.D.; Lam, A.K. Risk of extracolonic second primary cancers following a primary colorectal cancer: A systematic review and meta-analysis. Int. J. Color. Dis. 2022, 37, 541–551. [Google Scholar] [CrossRef] [PubMed]
- Green, R.J.; Metlay, J.P.; Propert, K.; Catalano, P.J.; Macdonald, J.S.; Mayer, R.J.; Haller, D.G. Surveillance for second primary colorectal cancer after adjuvant chemotherapy: An analysis of Intergroup 0089. Ann. Intern. Med. 2002, 136, 261–269. [Google Scholar] [CrossRef]
- Kendal, W.S.; Nicholas, G. A population-based analysis of second primary cancers after irradiation for rectal cancer. Am. J. Clin. Oncol. 2007, 30, 333–339. [Google Scholar] [CrossRef]
- Lee, H.C.; Lin, T.C.; Chang, C.C.; Lu, Y.C.A.; Lee, C.M.; Purevdorj, B. Clinical Risk Factor Prediction for Second Primary Skin Cancer: A Hospital-Based Cancer Registry Study. Appl. Sci. 2022, 12, 12520. [Google Scholar] [CrossRef]
- Chang, C.C.; Huang, T.H.; Shueng, P.W.; Chen, S.H.; Chen, C.C.; Lu, C.J.; Tseng, Y.J. Developing a Stacked Ensemble-Based Classification Scheme to Predict Second Primary Cancers in Head and Neck Cancer Survivors. Int. J. Environ. Res. Public. Health 2021, 18, 12499. [Google Scholar] [CrossRef] [PubMed]
- Liao, H.H.; Chang, C.C.; Wang, Y.X.; Cheewakriangkrai, C. Predicting the risk factors of second primary cancer in patients with hepatocellular carcinoma. Stud. Health Technol. Inform. 2022, 289, 93–96. [Google Scholar] [PubMed]
- Chang, C.C.; Chen, C.C.; Cheewakriangkrai, C.; Chen, Y.C.; Yang, S.F. Risk Prediction of Second Primary Endometrial Cancer in Obese Women: A Hospital-Based Cancer Registry Study. Int. J. Environ. Res. Public. Health 2021, 18, 8997. [Google Scholar] [CrossRef] [PubMed]
- Ting, W.C.; Chang, H.R.; Chang, C.C.; Lu, C.J. Developing a Novel Machine Learning-Based Classification Scheme for Predicting SPCs in Colorectal Cancer Survivors. Appl. Sci. 2020, 10, 1355. [Google Scholar] [CrossRef]
- Chang, C.C.; Chen, S.H. Developing a Novel Machine Learning-Based Classification Scheme for Predicting SPCs in Breast Cancer Survivors. Front. Genet. 2019, 10, 848. [Google Scholar] [CrossRef] [PubMed]
- Benson, A.B.; Venook, A.P.; Al-Hawary, M.M.; Arain, M.A.; Chen, Y.-J.; Ciombor, K.K.; Cohen, S.; Cooper, H.S.; Deming, D.; Farkas, L.; et al. Colon Cancer, Version 2.2021, NCCN Clinical Practice Guidelines in Oncology. J. Natl. Compr. Cancer Netw. 2021, 19, 329–359. [Google Scholar] [CrossRef] [PubMed]
- Ding, C.H.; Dubchak, I. Multi-class protein fold recognition using support vector machines and neural networks. Bioinformatics 2001, 17, 349–358. [Google Scholar] [CrossRef] [PubMed]
- Sidey-Gibbons, J.A.M.; Sidey-Gibbons, C.J. Machine learning in medicine: A practical introduction. BMC Med. Res. Methodol. 2019, 19, 64. [Google Scholar] [CrossRef]
- Pham, T.H.; Vicnesh, J.; Wei, J.K.E.; Oh, S.L.; Arunkumar, N.; Abdulhay, E.W.; Ciaccio, E.J.; Acharya, U.R. Autism Spectrum Disorder Diagnostic System Using HOS Bispectrum with EEG Signals. Int. J. Environ. Res. Public. Health 2020, 17, 971. [Google Scholar] [CrossRef]
- Witjes, H.; Rijpkema, M.; van der Graaf, M.; Melssen, W.; Heerschap, A.; Buydens, L. Multispectral magnetic resonance image analysis using principal component and linear discriminant analysis. J. Magn. Reson. Imaging 2003, 17, 261–269. [Google Scholar] [CrossRef] [PubMed]
- Park, H.A. An introduction to logistic regression: From basic concepts to interpretation with particular attention to nursing domain. J. Korean Acad. Nurs. 2013, 43, 154–164. [Google Scholar] [CrossRef] [PubMed]
- Levy, J.J.; O’Malley, A.J. Don’t dismiss logistic regression: The case for sensible extraction of interactions in the era of machine learning. BMC Med. Res. Methodol. 2020, 20, 171. [Google Scholar] [CrossRef] [PubMed]
- Dima, S.; Wang, K.J.; Chen, K.H.; Huang, Y.-K.; Chang, W.-J.; Lee, S.-Y.; Teng, N.-C. Decision Tree Approach to the Impact of Parents’ Oral Health on Dental Caries Experience in Children: A Cross-Sectional Study. Int. J. Environ. Res. Public. Health 2018, 15, 692. [Google Scholar] [CrossRef]
- Ai, D.; Pan, H.; Han, R.; Li, X.; Liu, G.; Xia, L.C. Using Decision Tree Aggregation with Random Forest Model to Identify Gut Microbes Associated with Colorectal Cancer. Genes 2019, 10, 112. [Google Scholar] [CrossRef]
- Peng, J.; Chen, C.; Zhou, M.; Xie, X.; Zhou, Y.; Luo, C.H. A Machine-learning Approach to Forecast Aggravation Risk in Patients with Acute Exacerbation of Chronic Obstructive Pulmonary Disease with Clinical Indicators. Sci. Rep. 2020, 10, 3118. [Google Scholar] [CrossRef]
- Yang, C.C.; Su, Y.C.; Lin, Y.W.; Huang, C.I.; Lee, C.C. Differential impact of age on survival in head and neck cancer according to classic Cox regression and decision tree analysis. Clin. Otolaryngol. 2019, 44, 244–253. [Google Scholar] [CrossRef]
- Zhang, B.; Guo, K.; Zheng, X.; Sun, L.; Shen, M.; Ruan, S. Risk of Second Primary Malignancies in Colon Cancer Patients Treated With Colectomy. Front. Oncol. 2020, 10, 1154. [Google Scholar] [CrossRef]
- Phipps, A.I.; Chan, A.T.; Ogino, S. Anatomic subsite of primary colorectal cancer and subsequent risk and distribution of second cancers. Cancer 2013, 119, 3140–3147. [Google Scholar] [CrossRef] [PubMed]
- Papaccio, F.; Rosello, S.; Huerta, M.; Gambardella, V.; Tarazona, N.; Fleitas, T.; Roda, D.; Cervantes, A. Neoadjuvant Chemotherapy in Locally Advanced Rectal Cancer. Cancers 2020, 12, 3611. [Google Scholar] [CrossRef]
- Kim, J.K.; Marco, M.R.; Roxburgh, C.S.D.; Chen, C.-T.; Cercek, A.; Strombom, P.; Temple, L.K.F.; Nash, G.M.; Guillem, J.G.; Paty, P.B.; et al. Survival After Induction Chemotherapy and Chemoradiation Versus Chemoradiation and Adjuvant Chemotherapy for Locally Advanced Rectal Cancer. Oncologist 2022, 27, 380–388. [Google Scholar] [CrossRef] [PubMed]
- Hung, M.H.; Liu, C.J.; Teng, C.J.; Hu, Y.-W.; Yeh, C.-M.; Chen, S.-C.; Chien, S.-H.; Hung, Y.-P.; Shen, C.-C.; Chen, T.-J.; et al. Risk of Second Non-Breast Primary Cancer in Male and Female Breast Cancer Patients: A Population-Based Cohort Study. PLoS ONE 2016, 11, e0148597. [Google Scholar] [CrossRef] [PubMed]
- Rombouts, A.J.M.; Hugen, N.; Elferink, M.A.G.; Feuth, T.; Poortmans, P.M.P.; Nagtegaal, I.D.; de Wilt, J.H.W. Incidence of second tumors after treatment with or without radiation for rectal cancer. Ann. Oncol. 2017, 28, 535–540. [Google Scholar] [CrossRef] [PubMed]
- Rombouts, A.J.M.; Hugen, N.; Elferink, M.A.G.; Poortmans, P.M.P.; Nagtegaal, I.D.; de Wilt, J.H.W. Increased risk for second primary rectal cancer after pelvic radiation therapy. Eur. J. Cancer 2020, 124, 142–151. [Google Scholar] [CrossRef] [PubMed]
- Wiltink, L.M.; Nout, R.A.; Fiocco, M.; Kranenbarg, E.M.-K.; Jürgenliemk-Schulz, I.M.; Jobsen, J.J.; Nagtegaal, I.D.; Rutten, H.J.; van de Velde, C.J.; Creutzberg, C.L.; et al. No Increased Risk of Second Cancer After Radiotherapy in Patients Treated for Rectal or Endometrial Cancer in the Randomized TME, PORTEC-1, and PORTEC-2 Trials. J. Clin. Oncol. 2015, 33, 1640–1646. [Google Scholar] [CrossRef] [PubMed]
- Warschkow, R.; Guller, U.; Cerny, T.; Schmied, B.M.; Plasswilm, L.; Putora, P.M. Secondary malignancies after rectal cancer resection with and without radiation therapy: A propensity-adjusted, population-based SEER analysis. Radiother. Oncol. 2017, 123, 139–146. [Google Scholar] [CrossRef] [PubMed]
- Pawelec, G. Immunosenescence and cancer. Biogerontology 2017, 18, 717–721. [Google Scholar] [CrossRef]
- Benjamini, Y.; Hochberg, Y. Controlling the false discovery rate: A practical and powerful approach to multiple testing. J. R. Stat. Soc. Ser. B 1995, 57, 289–300. [Google Scholar] [CrossRef]
- Niculescu-Mizil, A.; Caruana, R. Predicting good probabilities with supervised learning. In Proceedings of the 22nd International Conference on Machine Learning, ICML ’05, Bonn, Germany, 7–11 August 2005; pp. 625–632. [Google Scholar]


| Risk Factors | With SPCs (%) | Without SPCs (%) | p-Value | χ2 | Odds Ratio |
|---|---|---|---|---|---|
| n (%) | 395 (9.0%) | 4007 (91.0%) | |||
| Sex | 395 | 4007 | 0.004 * | 8.477 | |
| Male | 276 (69.9%) | 2503 (62.5%) | 1.394 * [1.114–1.744] | ||
| Female | 119 (30.1%) | 1504 (37.5%) | 1.00 | ||
| Age at Diagnosis | 395 | 4007 | <0.001 *** | 25.530 | |
| <65 years | 174 (44.1%) | 2295 (57.3%) | 1.00 | ||
| ≥65 years | 221 (55.9%) | 1712 (42.7%) | 1.703 * [1.383–2.097] | ||
| Tumor size | 395 | 4007 | 0.433 | 0.614 | |
| <5 cm | 267 (67.6%) | 2630 (65.6%) | 1.092 [0.876–1.362] | ||
| ≥5 cm | 128 (32.4%) | 1377 (34.4%) | 1.00 | ||
| Combine Stage Group | 395 | 4007 | 0.001 ** | 11.942 | |
| ≤stage II | 212 (53.7%) | 1787 (44.6%) | 1.439 * [1.170–1.771] | ||
| >stage II | 183 (46.3%) | 2220 (55.4%) | 1.00 | ||
| Radiotherapy | 395 | 4007 | 0.013 * | 6.208 | |
| No | 279 (70.6%) | 2579 (64.4%) | 1.332 * [1.062–1.669] | ||
| Yes | 116 (29.4%) | 1428 (35.6%) | 1.00 | ||
| Chemotherapy | 395 | 4007 | <0.001 *** | 20.410 | |
| No | 190 (48.1%) | 1465 (36.6%) | 1.608 * [1.307–1.979] | ||
| Yes | 205 (51.9%) | 2542 (63.4%) | 1.00 | ||
| BMI | 395 | 4007 | 0.019 * | 5.474 | |
| <24 | 179 (45.3%) | 2063 (51.5%) | 1.00 | ||
| ≥24 | 216 (54.7%) | 1944 (48.5%) | 1.281 * [1.041–1.576] | ||
| Smoking Behavior | 395 | 4007 | <0.001 *** | 12.882 | |
| No | 229 (58.0%) | 2682 (66.9%) | 1.00 | ||
| Yes | 166 (42.0%) | 1325 (33.1%) | 1.467 * [1.189–1.811] | ||
| Drinking Behavior | 395 | 4007 | 0.001 ** | 10.224 | |
| No | 272 (68.9%) | 3050 (76.1%) | 1.00 | ||
| Yes | 123 (31.1%) | 957 (23.9%) | 1.441 * [1.151–1.805] | ||
| Carcinoembryonic Antigen (CEA) lab value | 395 | 4007 | 0.894 | 0.018 | |
| ≤050 | 265 (67.1%) | 2675 (66.8%) | 1.015 [0.815–1.265] | ||
| >051–100, 987 | 130 (32.9%) | 1332 (33.2%) | 1.00 |
| Rank | GainRatio * | InfoGain * | RF | C5.0 | MARS | Overall |
|---|---|---|---|---|---|---|
| 1 | Age at Diagnosis | Age at Diagnosis | Age at Diagnosis | Sex | Age at Diagnosis | Age at Diagnosis |
| 2 | Chemotherapy | Chemotherapy | Chemotherapy | Radiotherapy | Smoking Behavior | Chemotherapy |
| 3 | Smoking Behavior | Smoking Behavior | Smoking Behavior | Drinking Behavior | Chemotherapy | Smoking Behavior |
| 4 | Drinking Behavior | Sex | Sex | Combine stage group | Tumor Size | Combine Stage Group |
| 5 | Sex | Drinking Behavior | Drinking Behavior | Chemotherapy | Combine Stage Group | Sex |
| 6 | Combine Stage Group | Combine Stage Group | Combine Stage Group | Age at Diagnosis | Radiotherapy | Drinking Behavior |
| 7 | BMI | BMI | BMI | Tumor Size | BMI | Radiotherapy |
| 8 | Radiotherapy | Radiotherapy | Radiotherapy | BMI | Carcinoembryonic Antigen (CEA) Lab Value | BMI |
| 9 | Tumor Size | Tumor Size | Tumor Size | Carcinoembryonic Antigen (CEA) Lab Value | Drinking Behavior | Tumor Size |
| 10 | Carcinoembryonic Antigen (CEA) Lab Value | Carcinoembryonic Antigen (CEA) Lab Value | Carcinoembryonic Antigen (CEA) Lab Value | Smoking Behavior | Sex | Carcinoembryonic Antigen (CEA) Lab Value |
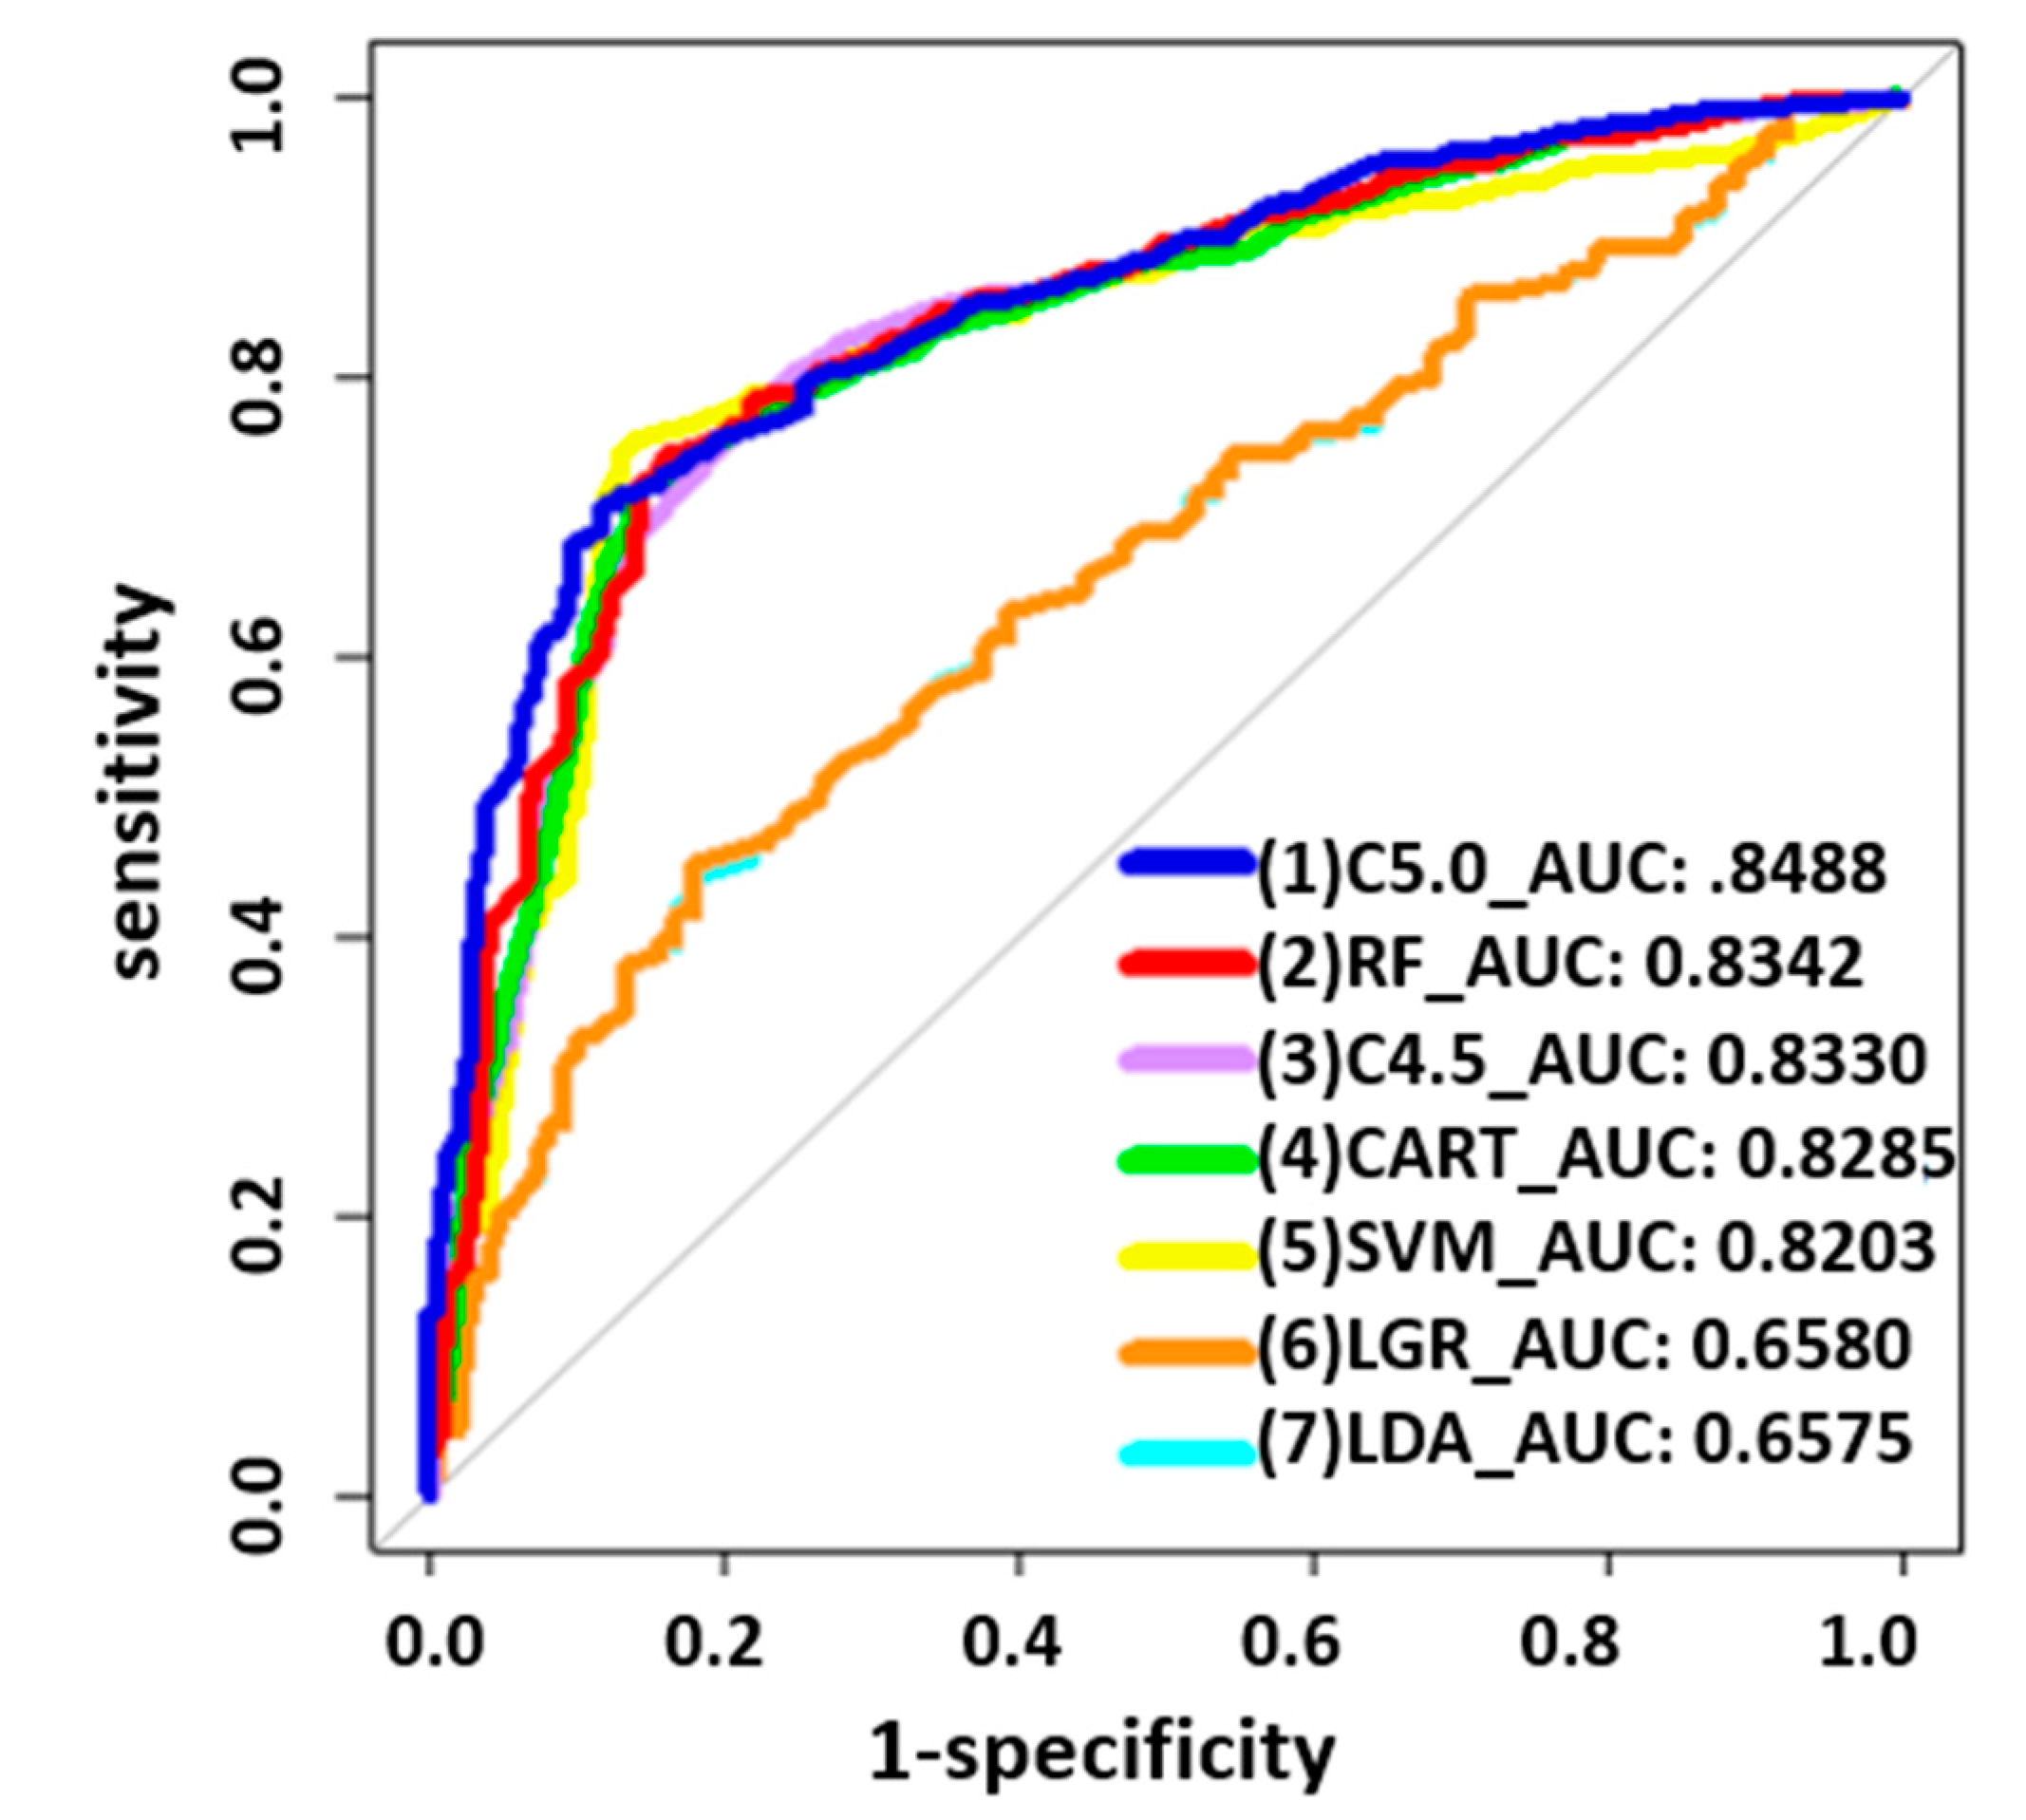
| Method | Specificity | Sensitivity | Accuracy | F1 Score | Precision(PPV) | NPV | AUC |
|---|---|---|---|---|---|---|---|
| C5.0 | 0.8812 | 0.7082 | 0.7941 | 0.7759 | 0.8579 | 0.9684 | 0.8488 |
| RF | 0.8377 | 0.7439 | 0.7905 | 0.7814 | 0.8228 | 0.9707 | 0.8342 |
| C4.5 | 0.7565 | 0.7997 | 0.7783 | 0.7840 | 0.7689 | 0.9746 | 0.8330 |
| CART | 0.8551 | 0.7225 | 0.7883 | 0.7745 | 0.8347 | 0.9690 | 0.8285 |
| SVM | 0.8623 | 0.7554 | 0.8085 | 0.7988 | 0.8475 | 0.9728 | 0.8203 |
| LGR | 0.8188 | 0.4521 | 0.6343 | 0.5544 | 0.7166 | 0.9381 | 0.6580 |
| LDA | 0.8188 | 0.4421 | 0.6292 | 0.5455 | 0.7120 | 0.9371 | 0.6575 |
| Risk Factors | With SPCs (%) | Without SPCs (%) | p-Value | χ2 | Odds Ratio |
|---|---|---|---|---|---|
| n (%) | 205 (7.5%) | 2542 (92.5%) | |||
| Sex | 205 | 2542 | 0.1 | 2.702 | |
| Male | 143 (69.8%) | 1628 (64.0%) | 1.295 [0.951–1.763] | ||
| Female | 62 (30.2%) | 914 (36.0%) | 1.00 | ||
| Age at Diagnosis | 205 | 2542 | 0.004 ** | 8.207 | |
| <65 years | 107 (52.2%) | 1584 (62.3%) | 1.00 | ||
| ≥65 years | 98 (47.8%) | 958 (37.7%) | 1.514 * [1.138–2.015] | ||
| Tumor size | 205 | 2542 | 0.831 | 0.046 | |
| <5 cm | 119 (58.0%) | 1495 (58.8%) | 1.00 | ||
| ≥5 cm | 86 (42.0%) | 1047 (41.2%) | 1.032 [0.773–1.377] | ||
| Combine Stage Group | 205 | 2542 | 0.397 | 0.718 | |
| ≤stage II | 52 (25.4%) | 579 (22.8%) | 1.152 [0.830–1.600] | ||
| >stage II | 153 (74.6%) | 1963 (77.2%) | 1.00 | ||
| Radiotherapy | 205 | 2542 | 0.302 | 1.065 | |
| No | 108 (52.7%) | 1244 (48.9%) | 1.162 [0.874–1.545] | ||
| Yes | 97 (47.3%) | 1298 (51.1%) | 1.00 | ||
| BMI | 205 | 2542 | 0.382 | 0.764 | |
| <24 | 101 (49.3%) | 1333 (52.4%) | 1.00 | ||
| ≥24 | 104 (50.7%) | 1209 (47.6%) | 1.135 [0.854–1.509] | ||
| Smoking Behavior | 205 | 2542 | 0.017 * | 5.695 | |
| No | 113 (55.1%) | 1614 (63.5%) | 1.00 | ||
| Yes | 92 (44.9%) | 928 (36.5%) | 1.416 * [1.063–1.886] | ||
| Drinking Behavior | 205 | 2542 | 0.014 * | 6.064 | |
| No | 134 (65.4%) | 1863 (73.3%) | 1.00 | ||
| Yes | 71 (34.6%) | 679 (26.7%) | 1.457 * [1.078–1.968] | ||
| Carcinoembryonic Antigen (CEA) Lab Value | 205 | 2542 | 0.475 | 0.511 | |
| ≤050 | 115 (56.1%) | 1491 (58.7%) | 1.00 | ||
| >051–100, 987 | 90 (43.9%) | 1051 (41.3%) | 1.110 [0.833–1.479] |
| Rules No. | Combinations of Condition Factors | SPCs/Observed (n) | Accuracy |
|---|---|---|---|
| 1 | Drinking Behavior (No) + CEA Lab Value (≤050 ng/mL) + Sex (Male) + Age at Diagnosis (<65 years) | 149/261 | 57.0% |
| 4 | Drinking Behavior (No) + CEA Lab Value (≤050 ng/mL) + Sex (Female) + Age at Diagnosis (≥65 years) | 114/175 | 65.1% |
| 6 | Drinking Behavior (No) + CEA Lab Value (>050 ng/mL) + Age at Diagnosis (≥65 years) + Sex (Male) | 84/141 | 59.5% |
| 9 | Drinking Behavior (Yes) + BMI (<24) + Sex (Male) + Age at Diagnosis (<65 years) + CEA Lab Value (>050 ng/mL) | 25/36 | 69.4% |
| 10 | Drinking Behavior (Yes) + BMI (<24) + Sex (Male) + Age at Diagnosis (≥65 years) + CEA Lab Value (≤050 ng/mL) | 31/45 | 68.8% |
| 12 | Drinking Behavior (Yes) + BMI (<24) + Sex (Female) | 7/9 | 77.7% |
| 13 | Drinking Behavior (Yes) + BMI (≥24) | 153/225 | 68.0% |
Disclaimer/Publisher’s Note: The statements, opinions and data contained in all publications are solely those of the individual author(s) and contributor(s) and not of MDPI and/or the editor(s). MDPI and/or the editor(s) disclaim responsibility for any injury to people or property resulting from any ideas, methods, instructions or products referred to in the content. |
© 2024 by the authors. Licensee MDPI, Basel, Switzerland. This article is an open access article distributed under the terms and conditions of the Creative Commons Attribution (CC BY) license (https://creativecommons.org/licenses/by/4.0/).
Share and Cite
Hsia, J.-Y.; Chang, C.-C.; Liu, C.-F.; Chou, C.-L.; Yang, C.-C. Longitudinal Risk Analysis of Second Primary Cancer after Curative Treatment in Patients with Rectal Cancer. Diagnostics 2024, 14, 1461. https://doi.org/10.3390/diagnostics14131461
Hsia J-Y, Chang C-C, Liu C-F, Chou C-L, Yang C-C. Longitudinal Risk Analysis of Second Primary Cancer after Curative Treatment in Patients with Rectal Cancer. Diagnostics. 2024; 14(13):1461. https://doi.org/10.3390/diagnostics14131461
Chicago/Turabian StyleHsia, Jiun-Yi, Chi-Chang Chang, Chung-Feng Liu, Chia-Lin Chou, and Ching-Chieh Yang. 2024. "Longitudinal Risk Analysis of Second Primary Cancer after Curative Treatment in Patients with Rectal Cancer" Diagnostics 14, no. 13: 1461. https://doi.org/10.3390/diagnostics14131461
APA StyleHsia, J.-Y., Chang, C.-C., Liu, C.-F., Chou, C.-L., & Yang, C.-C. (2024). Longitudinal Risk Analysis of Second Primary Cancer after Curative Treatment in Patients with Rectal Cancer. Diagnostics, 14(13), 1461. https://doi.org/10.3390/diagnostics14131461