Abstract
The Prognostic Nutritional Index (PNI) is widely recognized as a screening tool for nutrition. We retrospectively examined the impact of PNI in patients with chronic liver disease (CLD, n = 319, median age = 71 years, 153 hepatocellular carcinoma (HCC) patients) as an observational study. Factors associated with PNI < 40 were also examined. The PNI correlated well with the albumin–bilirubin (ALBI) score and ALBI grade. The 1-year cumulative overall survival rates in patients with PNI ≥ 40 (n = 225) and PNI < 40 (n = 94) were 93.2% and 65.5%, respectively (p < 0.0001). In patients with (p < 0.0001) and without (p < 0.0001) HCC, similar tendencies were found. In the multivariate analysis, hemoglobin (p = 0.00178), the presence of HCC (p = 0.0426), and ALBI score (p < 0.0001) were independent factors linked to PNI < 40. Receiver operating characteristic (ROC) curve analysis based on survival for the PNI yielded an area under the ROC curve of 0.79, with sensitivity of 0.80, specificity of 0.70, and an optimal cutoff point of 42.35. In conclusion, PNI can be a predictor of nutritional status in CLD patients. A PNI of <40 can be useful in predicting the prognosis of patients with CLD.
1. Introduction
Malnutrition is a condition in which the intake or absorption of nutrients essential for development and the prevention of disease is inadequate [1,2]. Compared to healthy individuals, patients with gastrointestinal diseases often have altered nutrient metabolism [3,4,5,6,7]. In particular, patients with chronic liver diseases (CLDs) frequently become malnourished [8]. More than 844 million people worldwide currently suffer from CLDs, and approximately 2 million CLD patients die annually [8]. The liver is an important organ in which the metabolism and biosynthesis of a multitude of proteins, carbohydrates, and fats take place. Thus, progressive liver disease often results in fat malabsorption, fat-soluble vitamin deficiencies, decreased levels of water-soluble vitamins, and altered micronutrient metabolism [9,10]. In particular, cirrhotic patients have a high rate of protein–energy malnutrition (PEM), sarcopenia, or decreased quality of life [9,10,11,12,13]. Among a cohort of Child–Pugh class A patients, the 1-year mortality rate for those who were malnourished was approximately 20%, but none of the patients who received adequate amounts of nutrition died within 1 year [14]. Malnutrition is known to have a significant impact on patient outcomes [14]. Early detection and treatment of malnutrition may be necessary to improve patient outcomes. It is therefore important to accurately assess the nutritional status of CLD patients.
In this study, we conducted a nutritional evaluation of CLD patients using the Prognostic Nutritional Index (PNI). PNI was first suggested to be a predictor of nutritional status and surgery-related risk by Buzby and colleagues in 1980 and confirmed by Onodera and colleagues in 1984 [15,16]. Since then, it has been further validated, with many recent studies having demonstrated that lower PNI is an independent adverse predictor for surgery-related complications and long-term clinical outcomes in various malignancies, such as gastric cancer, colorectal cancer, and esophageal cancer [17,18,19]. PNI is calculated from only two serum markers: the serum albumin level and lymphocyte count, which can be easily measured in clinical settings. Patients with PNI < 40 are defined as malnourished [16]. The impact of PNI has been previously reported in patients with HCC [20]. However, to our knowledge, little has been reported on the clinical implications of PNI in CLD patients without HCC. Identifying CLD patients at risk for severe malnutrition and providing early nutritional intervention targeting patients at high nutritional risk may improve their prognosis. This clinical research question seems to be worth clarifying the answer. That was the reason for the current analysis.
2. Patients and Methods
2.1. Patients
This study was a single-center observational study with a retrospective nature. Osaka Medical and Pharmaceutical University (OMPU) Hospital is currently one of the leading CLD high-volume facilities in the country. Data on patients with CLDs have been continuously accumulated in our database. Between May 2020 and May 2023, 319 Japanese CLD patients with calculated PNI admitted to OMPU Hospital were included in the database. Appropriate interventions were made for each condition in all patients. The baseline included variables were as listed in Table 1. Ethics approval was obtained from the Ethics Committee of OMPU Hospital (approval number: 2021-109, approval date: 25 November 2021; details are available on our website). Since this was a retrospective study, direct face-to-face informed consent from the patients with regard to the study was waived. The protocol of the current study strictly adhered to all contents of the 1975 Declaration of Helsinki.

Table 1.
Baseline features (n = 319).
2.2. PNI and Our Analysis
PNI can be calculated as follows: 10 × serum albumin (g/L) + 0.005 × lymphocyte count in the peripheral blood (mm3) [15,16]. As mentioned earlier, PNI in each patient was calculated. First, we examined the relationship between PNI and the ALBI score [21] for all cases, hepatocellular carcinoma (HCC) cases, and non-HCC cases. Next, PNI and the percentage of patients with PNI < 40 were compared according to the albumin–bilirubin (ALBI) grade or modified ALBI (mALBI) grade [21,22] in all cases, HCC cases, and non-HCC cases. Next, factors associated with PNI < 40 were investigated in uni- and multivariate analyses. Next, we performed a receiver operating characteristic (ROC) curve analysis of independent factors in the multivariate analysis for PNI < 40. Next, the overall survival (OS) ratio was compared, stratified by the baseline PNI. Finally, we performed an ROC curve analysis for PNI based on the prognosis.
2.3. Statistical Considerations
For two-group comparisons of continuous parameters, Student’s t test or the Mann–Whitney U test was applied as appropriate, and for multiple-group comparisons of continuous parameters, ANOVA or the Kruskal–Wallis test was applied as appropriate. For group comparisons of categorical parameters, the Pearson χ2 test was applied. Pearson’s correlation coefficient r was used for the correlation coefficient. For a comparison of survival, the Kaplan–Meier method was adopted and tested using the log-rank method. Details for continuous parameters are presented as the median (interquartile range, IQR) unless otherwise noted. Multivariate logistic regression analysis related to PNI < 40 was also performed to identify independent covariates. The significance level was set at 0.05 using JMP ver. 17 (SAS Institute Inc., Cary, NC, USA).
3. Results
3.1. Patient Baseline Characteristics
The baseline features for all study subjects (n = 319, 183 males and 136 females, median (IQR) age = 71 (63.0–78.0) years) are presented in Table 1. In terms of etiologies of CLD patients, alcohol, hepatitis B virus (HBV), hepatitis C virus (HCV), metabolic-dysfunction-associated steatotic liver disease (MASLD), and others were found in 39, 52, 73, 112, and 43 patients, respectively. HCC was seen in 153 cases (48.0%). The median (IQR) body mass index was 22.9 (20.8–25.6) kg/m2. The median (IQR) serum albumin level was 3.8 (3.3–4.1) g/dL. The median (IQR) ALBI score was −2.48 (−2.76–2.05). The ALBI grade observed was grade 1 in 122 patients, grade 2 in 176, and grade 3 in 21. The median (IQR) ALBI score was −2.48 (−2.76–2.05). Modified ALBI (mALBI [22]) grade 1 was seen in 122 patients, grade 2a was seen in 79, grade 2b was seen in 97 and grade 3 was seen in 21. The median (IQR) PNI was 44.2 (38.7–48.8). PNI < 40 was seen in 94 cases (29.5%).
3.2. The Relevance in PNI and the ALBI Score
PNI had a significant negative correlation with the ALBI score in all study subjects (r = −0.85, p < 0.0001) (Figure 1A). PNI also had a significant negative correlation with the ALBI score in HCC cases (r = −0.90, p < 0.0001) (Figure 1B) and in non-HCC cases (r = −0.82, p < 0.0001) (Figure 1C).
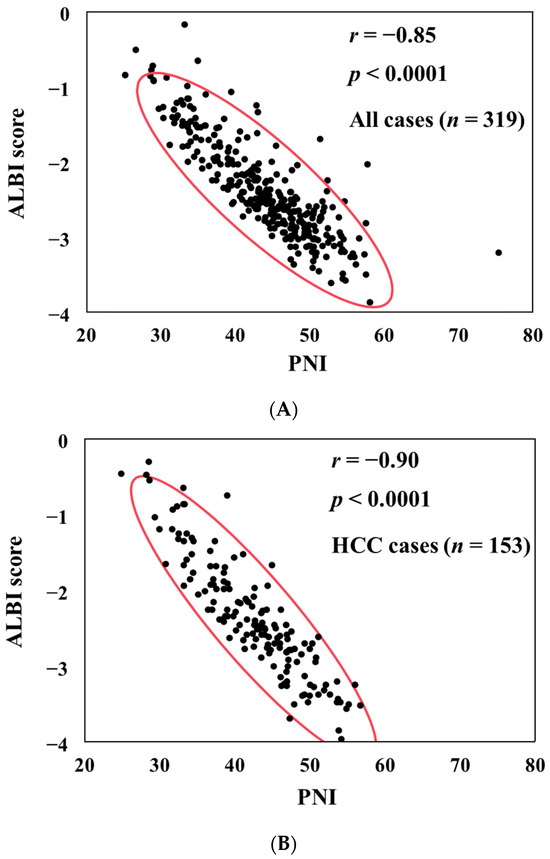
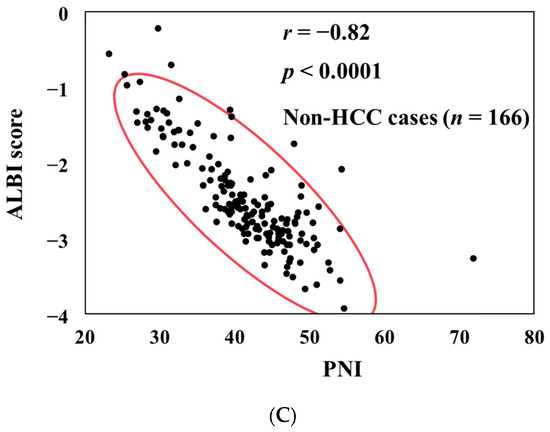
Figure 1.
The correlation between PNI and ALBI score for all cases (A), HCC cases (B), and non-HCC cases (C).
3.3. PNI According to ALBI Grade and mALBI Grade in All Cases
The median (IQR) PNI values in categories of ALBI grade 1 (n = 122), grade 2 (n = 176), and grade 3 (n = 21) were 49.61 (47.37–52.22) in grade 1, 41.58 (36.62–47.54) in grade 2, and 31.21 (27.06–32.44) in grade 3, (p values: ALBI grade 1 vs. 2, p < 0.0001; grade 1 vs. 3, p < 0.0001; grade 2 vs. 3, p < 0.0001; overall p < 0.0001) (Figure 2A). The median (IQR) PNI values in categories of mALBI grade 1 (n = 122), grade 2a (n = 79), grade 2b (n = 97), and grade 3 (n = 21) were 49.61 (47.37–52.22) in mALBI grade 1, 43.71 (42.26–46.11) in grade 2a, 37.06 (33.40–41.63) in grade 2b, and 31.21 (27.06–32.44) in grade 3 (p values: mALBI grade 1 vs. 2a, p < 0.0001; grade 1 vs. 2b, p < 0.0001; grade 1 vs. 3, p < 0.0001; grade 2a vs. 2b, p < 0.0001; grade 2a vs. 3, p < 0.0001; grade 2b vs. 3, p < 0.0001; overall p < 0.0001) [22] (Figure 2B).
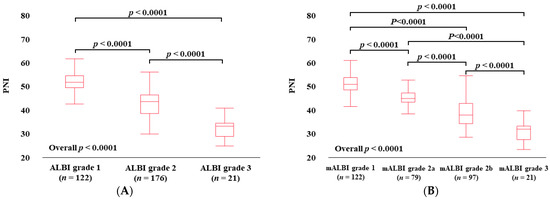
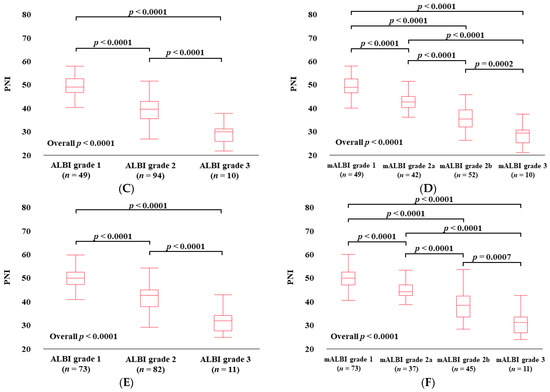
Figure 2.
PNI according to ALBI grade (A) and modified ALBI grade (B) for all cases. PNI according to ALBI grade (C) and modified ALBI grade (D) for HCC cases. PNI according to ALBI grade (E) and modified ALBI grade (F) for non-HCC cases.
3.4. PNI According to ALBI Grade and mALBI Grade in HCC Cases
The median (IQR) PNI values in categories of ALBI grade 1 (n = 49), grade 2 (n = 94), and grade 3 (n = 10) in HCC cases were 49.67 (47.45–53.17) in ALBI grade 1, 40.38 (36.55–43.87) in grade 2, and 30.89 (26.92–32.20) in grade 3 (p values: ALBI grade 1 vs. 2, p < 0.0001; grade 1 vs. 3, p < 0.0001; grade 2 vs. 3, p < 0.0001; overall p < 0.0001) (Figure 2C). The median (IQR) PNI values in categories of mALBI grade 1 (n = 49), grade 2a (n = 42), grade 2b (n = 52), and grade 3 (n = 10) in HCC cases were 49.67 (47.45–53.17) in mALBI grade 1, 43.69 (41.43–45.92) in grade 2a, 36.73 (33.39–40.52) in grade 2b, and 30.89 (26.92–32.20) in grade 3 (p values: mALBI grade 1 vs. 2a, p < 0.0001; grade 1 vs. 2b, p < 0.0001; grade 1 vs. 3, p < 0.0001; grade 2a vs. 2b, p < 0.0001; grade 2a vs. 3, p < 0.0001; grade 2b vs. 3, p = 0.0002; overall p < 0.0001) (Figure 2D).
3.5. PNI According to ALBI Grade and mALBI Grade after Excluding HCC Cases
The median (IQR) PNI values in categories of ALBI grade 1 (n = 73), grade 2 (n = 82), and grade 3 (n = 11) in non-HCC cases were 49.55 (46.87–51.98) in ALBI grade 1, 42.18 (37.43–44.49) in grade 2, and 31.52 (27.15–33.69) in grade 3 (p values: ALBI grade 1 vs. 2, p < 0.0001; grade 1 vs. 3, p < 0.0001; grade 2 vs. 3, p < 0.0001; overall p < 0.0001) (Figure 2E). The median (IQR) PNI values in categories of mALBI grade 1 (n = 73), grade 2a (n = 37), grade 2b (n = 45), and grade 3 (n = 11) in non-HCC cases were 49.55 (46.87–51.98) in mALBI grade 1, 43.91 (42.46–46.80) in grade 2a, 38.41 (33.73–42.28) in grade 2b, and 31.52 (27.15–33.69) in grade 3 (p values: mALBI grade 1 vs. 2a, p < 0.0001; grade 1 vs. 2b, p < 0.0001; grade 1 vs. 3, p < 0.0001; grade 2a vs. 2b, p < 0.0001; grade 2a vs. 3, p < 0.0001; grade 2b vs. 3, p = 0.0007; overall p < 0.0001) (Figure 2F).
3.6. Patient Frequency with PNI < 40 According to ALBI Grade and mALBI Grade among All Cases
The percentages of patients with PNI < 40 in categories of ALBI grade 1, grade 2, and grade 3 among all cases were 0% (0/122) in ALBI grade 1, 42.1% (74/176) in grade 2, and 95.2% (20/21) in grade 3 (p values: ALBI grade 1 vs. 2, p < 0.0001; grade 1 vs. 3, p < 0.0001; grade 2 vs. 3, p < 0.0001; overall p < 0.0001) (Figure 3A).
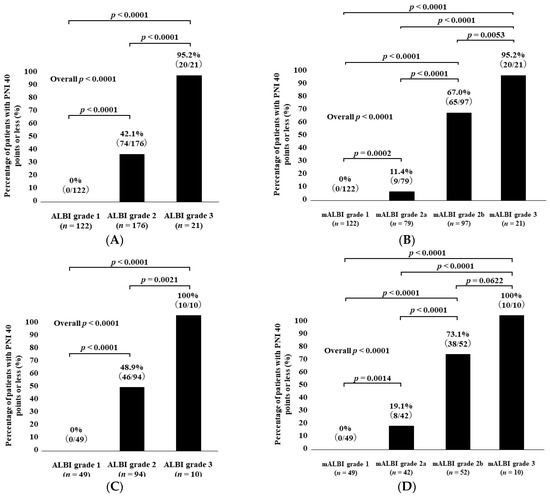
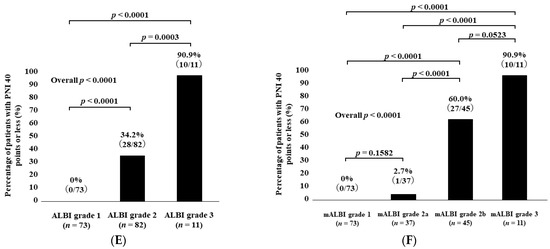
Figure 3.
Percentage of patients with PNI < 40 according to ALBI grade (A) and modified ALBI grade (B) for all cases. Percentage of patients with PNI < 40 according to ALBI grade (C) and modified ALBI grade (D) for HCC cases. Percentage of patients with PNI < 40 according to ALBI grade (E) and modified ALBI grade (F) for non-HCC cases.
The percentages of patients with PNI < 40 in categories of mALBI grade 1, grade 2a, grade 2b, and grade 3 among all cases were 0% (0/122) in mALBI grade 1, 11.4% (9/79) in grade 2a, 67.0% (65/97) in grade 2b, and 95.2% (20/21) in grade 3 (p values: mALBI grade 1 vs. 2a, p = 0.0002; grade 1 vs. 2b, p < 0.0001; grade 1 vs. 3, p < 0.0001; grade 2a vs. 2b, p < 0.0001; grade 2a vs. 3, p < 0.0001; grade 2b vs. 3, p = 0.0053; overall p < 0.0001) (Figure 3B).
3.7. Patient Frequency with PNI < 40 According to ALBI Grade and mALBI Grade among HCC Cases
The percentages of patients with PNI < 40 in categories of ALBI grade 1, grade 2, and grade 3 among the HCC cases were 0% (0/49) in ALBI grade 1, 48.9% (46/94) in grade 2, and 100% (10/10) in grade 3 (p values: ALBI grade 1 vs. 2, p < 0.0001; grade 1 vs. 3, p < 0.0001; grade 2 vs. 3, p = 0.0021; overall p < 0.0001) (Figure 3C).
The percentages of patients with PNI < 40 in categories of mALBI grade 1, grade 2a, grade 2b, and grade 3 among the HCC cases were 0% (0/49) in mALBI grade 1, 19.1% (8/42) in grade 2a, 73.1% (38/52) in grade 2b, and 100% (10/10) in grade 3 (p values: mALBI grade 1 vs. 2a, p = 0.0014; grade 1 vs. 2b, p < 0.0001; grade 1 vs. 3, p < 0.0001; grade 2a vs. 2b, p < 0.0001; grade 2a vs. 3, p < 0.0001; grade 2b vs. 3, p = 0.0622; overall p < 0.0001) (Figure 3D).
3.8. Patient Frequency with PNI < 40 According to ALBI Grade and mALBI Grade after Excluding HCC Cases
The percentages of patients with PNI < 40 in categories of ALBI grade 1, grade 2, and grade 3 among the non-HCC cases were 0% (0/73) in ALBI grade 1, 34.2% (28/82) in grade 2, and 90.9% (10/11) in grade 3 (p values: ALBI grade 1 vs. 2, p < 0.0001; grade 1 vs. 3, p < 0.0001; grade 2 vs. 3, p = 0.0003; overall p < 0.0001) (Figure 3E).
The percentages of patients with PNI < 40 in categories of mALBI grade 1, grade 2a, grade 2b, and grade 3 among the non-HCC cases were 0% (0/73) in mALBI grade 1, 2.7% (1/37) in grade 2a, 60.0% (27/45) in grade 2b, and 90.9% (10/11) in grade 3 (p values: mALBI grade 1 vs. 2a, p = 0.1582; grade 1 vs. 2b, p < 0.0001; grade 1 vs. 3, p < 0.0001; grade 2a vs. 2b, p < 0.0001; grade 2a vs. 3, p < 0.0001; grade 2b vs. 3, p = 0.0523; overall p < 0.0001) (Figure 3F).
3.9. Uni- and Multivariate Analyses of Covariates Associated with PNI < 40
In the univariate analysis, age (p = 0.0107), hemoglobin (Hb, p < 0.0001), C-reactive protein (p < 0.0001), prothrombin time (p < 0.0001), platelet count (p = 0.0002), estimated glomerular filtration rate (p < 0.0001), presence of HCC (p = 0.0072), and ALBI score (p < 0.0001) were significant factors related to PNI < 40 (Table 2). Hb (p = 0.0017), HCC (p = 0.0426), and ALBI score (p < 0.0001) were independent factors related to PNI < 40 in the multivariate analysis (Table 3).
Table 2.
Univariate analysis.
Table 3.
Multivariate analysis.
3.10. ROC Analysis
An ROC analysis of independent continuous covariates in the multivariate analysis for PNI < 40 was performed. The corresponding area under the ROC curve (AUC), sensitivity, specificity, and best reference point for Hb and ALBI score are demonstrated in Table 4. ALBI score involved the highest AUC for PNI < 40 (AUC = 0.96), followed by Hb (AUC = 0.76).
Table 4.
Receiver operating characteristic curve analysis of independent parameters for PNI < 40.
3.11. Cumulative OS Rate Stratified by Baseline PNI
The median follow-up interval was 524 days. Within the follow-up period, 55 patients (17.2%) died (all were liver-disease-related). The 1-year cumulative OS rate for all study subjects was 84.9%. The 1-year cumulative OS rates among patients with PNI ≥ 40 (n = 225) and PNI < 40 (n = 94) were 93.2% and 65.5%, respectively (p < 0.0001, Figure 4A). Among the HCC cases, the 1-year cumulative OS rate was 77.1%. The 1-year cumulative OS rates among HCC patients with PNI ≥ 40 (n = 97) and PNI < 40 (n = 56) were 89.0% and 66.7%, respectively (p < 0.0001, Figure 4B). After exclusion of 153 HCC cases, the 1-year cumulative OS rate for all cases was 88.0%. The 1-year cumulative OS rates among non-HCC patients with PNI ≥ 40 (n = 128) and PNI < 40 (n = 38) were 96.4% and 63.6%, respectively (p < 0.0001, Figure 4C). Among alcoholic cases (n = 39), the 1-year cumulative OS rate was 81.8%. The 1-year cumulative OS rates in alcoholic patients with PNI ≥ 40 (n = 21) and PNI < 40 (n = 18) were 94.1% and 68.3%, respectively (p = 0.0821, Figure 4D). Among HBV cases (n = 52), the 1-year cumulative OS rate was 82.9%. The 1-year cumulative OS rates among HBV patients with PNI ≥ 40 (n = 41) and PNI < 40 (n = 11) were 88.5% and 63.6%, respectively (p = 0.0011, Figure 4E). Among HCV cases (n = 73), the 1-year cumulative OS rate was 83.3%. The 1-year cumulative OS rates among HCV patients with PNI ≥ 40 (n = 53) and PNI < 40 (n = 20) were 85.3% and 78.4%, respectively (p = 0.0869, Figure 4F). Among MASLD cases (n = 112), the 1-year cumulative OS rate was 84.4%. The 1-year cumulative OS rates among MASLD patients with PNI ≥ 40 (n = 75) and PNI < 40 (n = 37) were 98.5% and 56.4%, respectively (p < 0.0001, Figure 4G).
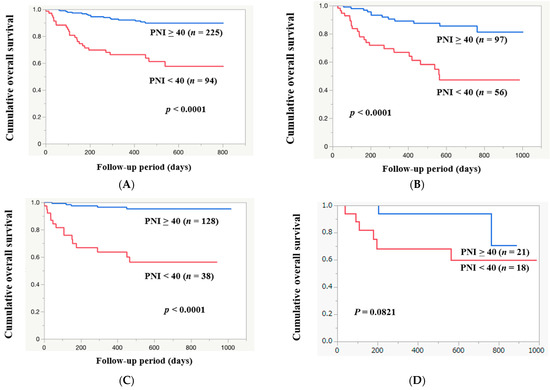
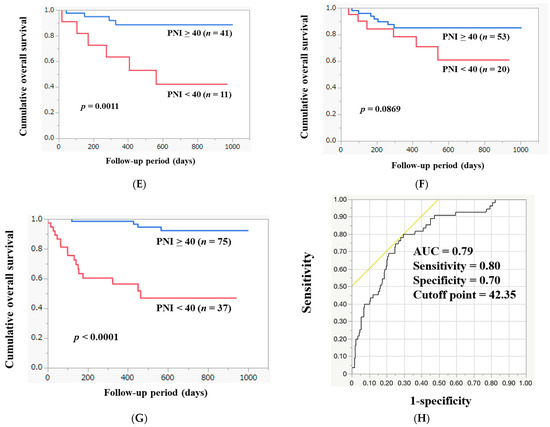
Figure 4.
The cumulative OS rates among patients with PNI ≥ 40 and PNI < 40 in all cases (A), in HCC cases (B), in non-HCC cases (C), in alcoholic cases (D), in HBV cases (E), in HCV cases (F), and in MASLD cases (G). (H) ROC analysis based on the prognosis for PNI.
3.12. ROC Analysis Based on Death or Survival for PNI
In the ROC analysis based on death or survival for PNI, the AUC was 0.79 (Figure 4H). The sensitivity and specificity were 0.80 and 0.70, respectively, with an optimal cutoff point of 42.35.
4. Discussion
In this study, PNI was found to be a predictor of nutritional status in patients with CLD. A PNI value of <40 may be useful in predicting prognosis in patients with CLD. These results are important because PNI may allow for early intervention in nutritional therapy for CLD patients. Early nutritional therapy may contribute to a better prognosis.
Patients with advanced chronic disease are often malnourished and are not able to obtain necessary nutrients through oral intake alone. Inadequate intake and malabsorption in the gastrointestinal tract can lead to poor body composition and biological function [8,23]. Liver disease is no exception, and nutritional status has been recognized as a predictor of prognosis for patients with advanced liver disease [8,24,25,26]. However, nutritional assessment is often neglected in the routine care of CLD patients [27]. Unfortunately, the reality is that nutritional problems in CLD patients are often underestimated, and adequate nutritional assessment is not performed. As a result, nutritional therapy interventions for patients with CLD are often underutilized [27]. Based on this background, it is desirable to assess nutritional status in patients with CLD.
Metabolism 2006 guidelines recommend the use of subjective global assessment (SGA) to identify CLD patients at risk for malnutrition [28]. SGA is a bedside assessment tool to collect information on food intake, weight changes, and gastrointestinal symptoms; it also includes tests for subcutaneous fat loss, muscle weakness, ascites, and edema [8,29]. While SGA is appropriate as a stand-alone nutritional assessment tool, several studies have reported that SGA can underestimate the disease severity and frequency of malnutrition in patients with the early stages of the disease [8,30]. In the dual-energy X-ray absorptiometry method, a living body is irradiated with X-rays of two different energies, and body composition components are determined using the attenuation rate of the irradiated radiation as it passes through the body [28]. Although this provides accurate information, it is not widely used due to its technical complexity and higher cost [8,29]. Currently, there are many challenges with tools used to assess the nutritional status of CLD patients. PNI is a simple, objective indicator of inflammation and nutritional status, calculated from only serum albumin and lymphocyte counts [15,16,31]. In recent studies, PNI has also been significantly correlated with prognosis and nutritional status in a variety of diseases [31]. PNI may be useful in the nutritional assessment of patients with CLD. In the current study, we examined the influence of PNI in patients with CLD. The results of our study presented that PNI correlated strongly with ALBI score (r = −0.85) for all study subjects. A similar strong correlation with ALBI score was observed in HCC patients (r = −0.90) and non-HCC patients (r = −0.82). A comparison of PNI by ALBI grade or mALBI grade in patients with CLD showed a trend of decreasing PNI with worsening liver function. Thus, lower PNI can be associated with liver function. In our data, the percentages of patients with PNI < 40 in groups of ALBI grade 1, grade 2, and grade 3 among all study subjects were 0% (0/122) in ALBI grade 1, 42.1% (74/176) in grade 2, and 95.2% (20/21) in grade 3 (overall p < 0.0001). Identical tendencies were observed among HCC and non-HCC patients. PNI thus appears to be robustly associated with hepatic reserve capacity, with or without HCC. In our multivariate analysis, Hb and the presence of HCC, in addition to ALBI score, were significant covariates related to PNI. These results indicate that Hb and the presence of HCC, besides ALBI score, can be reliable markers for malnutrition in CLD patients. First, in terms of Hb, malnutrition is actually a known common cause of anemia, especially in certain clinical conditions such as older age [32,33]. Second, in terms of comorbid malignancies, previous studies have shown that impaired nutritional status frequently occurs in HCC patients. Impaired nutritional status may also be associated with unfavorable outcome in patients with HCC [34,35,36,37]. In terms of survival, the 1-year cumulative OS rates for patients with PNI ≥ 40 and PNI < 40 were 93.2% and 65.5%, respectively (p < 0.0001). In HCC cases and non-HCC cases, similar tendencies were seen. ROC analysis based on death or survival for PNI yielded an AUC of 0.79; the corresponding sensitivity (%) and specificity (%) were 80% and 70%, respectively, and the most suitable reference value for PNI was 42.35, which is close to the consensus value of PNI 40 [16]. Considering the favorable results in ROC analyses for PNI, PNI may be a useful prognostic factor even in patients with CLD.
It must be stated that this study has several limitations. First, causality can be neither confirmed nor negated due to the observational study design. Second, this study was conducted with a Japanese population at a single institution and was retrospective by its nature. We have not studied non-Japanese ethnic groups. Additionally, in terms of survival analysis, various interventions for background CLD were given during the course of the follow-up period, which may have affected the prognosis and introduced bias. Despite these study limitations, the results of the current study indicate that PNI correlates well with ALBI score, and a lower PNI value may be a prognostic factor in patients with CLD.
5. Conclusions
PNI may be a useful tool for assessing liver function for CLD patients. A PNI score of <40 is helpful for the prediction of prognosis in patients with CLD.
Author Contributions
Data collection, all authors; methodology, M.M., K.U. and H.N.; formal analysis, M.M. and H.N.; writing—original draft, M.M. and H.N.; writing—review and editing, all authors; supervision, H.N. All authors have read and agreed to the published version of the manuscript.
Funding
This research received no external funding.
Institutional Review Board Statement
We obtained ethical approval for the study from the ethics committee of OPMU Hospital (approval no. 2021-109), and the protocol strictly observed all regulations of the Declaration of Helsinki.
Informed Consent Statement
Due to the retrospective nature of this study, the requirement for informed consent from the patients was waived by the ethics committee of our hospital.
Data Availability Statement
The data presented in this study are not publicly available due to privacy or ethical restrictions.
Acknowledgments
The authors gratefully thank all medical staff in our department for their significant help.
Conflicts of Interest
The authors declare no conflicts of interest.
Abbreviations
| CLD | chronic liver disease |
| PEM | protein–energy malnutrition |
| OMPU | Osaka Medical and Pharmaceutical University |
| IQR | interquartile range |
| PNI | Prognostic Nutrition Index |
| ALBI | albumin–bilirubin |
| mALBI | modified ALBI |
| ROC | receiver operating characteristic |
| OS | overall survival |
| HCC | hepatocellular carcinoma |
| AUC | area under the ROC curve |
| HBV | hepatitis B virus |
| HCV | hepatitis C virus |
| MASLD | metabolic-dysfunction-associated steatotic liver disease |
| SGA | subjective global assessment |
References
- Phillips, W.; Doley, J.; Boi, K. Malnutrition definitions in clinical practice: To be E43 or not to be? Health Inf. Manag. 2020, 49, 74–79. [Google Scholar] [CrossRef] [PubMed]
- Siddiqui, A.T.S.; Parkash, O.; Hashmi, S.A. Malnutrition and liver disease in a developing country. World J. Gastroenterol. 2021, 27, 4985–4998. [Google Scholar] [CrossRef] [PubMed]
- Shaw, C. Management of diet in gastrointestinal cancer. Proc. Nutr. Soc. 2021, 80, 65–72. [Google Scholar] [CrossRef] [PubMed]
- Matsui, M.; Nishikawa, H.; Goto, M.; Asai, A.; Ushiro, K.; Ogura, T.; Takeuchi, T.; Nakamura, S.; Kakimoto, K.; Miyazaki, T.; et al. Prognostic Impact of the SARC-F Score in Gastrointestinal Advanced Cancers. Cancers 2022, 14, 10. [Google Scholar] [CrossRef] [PubMed]
- Ikegami, T.; Nishikawa, H.; Goto, M.; Matsui, M.; Asai, A.; Ushiro, K.; Ogura, T.; Takeuchi, T.; Nakamura, S.; Kakimoto, K.; et al. The Relationship between the SARC-F Score and the Controlling Nutritional Status Score in Gastrointestinal Diseases. J. Clin. Med. 2022, 11, 582. [Google Scholar] [CrossRef] [PubMed]
- Ushiro, K.; Nishikawa, H.; Matsui, M.; Ogura, T.; Takeuchi, T.; Goto, M.; Nakamura, S.; Kakimoto, K.; Miyazaki, T.; Fukunishi, S.; et al. Comparison of SARC-F Score among Gastrointestinal Diseases. J. Clin. Med. 2021, 10, 4099. [Google Scholar] [CrossRef] [PubMed]
- Asaishi, K.; Matsui, M.; Nishikawa, H.; Goto, M.; Asai, A.; Ushiro, K.; Ogura, T.; Takeuchi, T.; Nakamura, S.; Kakimoto, K.; et al. Grip Strength in Patients with Gastrointestinal Diseases. J. Clin. Med. 2022, 11, 2079. [Google Scholar] [CrossRef] [PubMed]
- Cheung, K.; Lee, S.S.; Raman, M. Prevalence and Mechanisms of Malnutrition in Patients with Advanced Liver Disease, and Nutrition Management Strategies. Clin. Gastroenterol. Hepatol. 2012, 10, 117–125. [Google Scholar] [CrossRef]
- Shergill, R.; Syed, W.; Rizvi, S.A.; Singh, I. Nutritional Support in Chronic Liver Disease and Cirrhotics. World J. Hepatol. 2018, 10, 685–694. [Google Scholar] [CrossRef]
- Dominika, J.M.; Anna, G.; Karolina, K.S.; Joanna, H.Z.; Dominika, M.M.; Katarzyna, J.M.; Ewa, S. Nutritional Support for Liver Diseases. Nutrients 2023, 15, 3640. [Google Scholar]
- Nishikawa, H.; Yoh, K.; Enomoto, H.; Iwata, Y.; Kishino, K.; Shimono, Y.; Hasegawa, K.; Nakano, C.; Takata, R.; Nishimura, T.; et al. Factors Associated With Protein-energy Malnutrition in Chronic Liver Disease. Medicine 2016, 95, e2442. [Google Scholar] [CrossRef] [PubMed]
- Moriwaki, H.; Miwa, Y.; Tajika, M.; Kato, M.; Fukushima, H.; Shiraki, M. Branched-chain amino acids as a protein- and energy-source in liver cirrhosis. Biochem. Biophys. Res. Commun. 2004, 313, 405–409. [Google Scholar] [CrossRef] [PubMed]
- Hanai, T.; Shiraki, M.; Nishimura, K.; Ohnishi, S.; Imai, K.; Suetsugu, A.; Takai, K.; Shimizu, M.; Moriwaki, H. Sarcopenia impairs prognosis of patients with liver cirrhosis. Nutrition 2015, 31, 193–199. [Google Scholar] [CrossRef] [PubMed]
- Alvares-da-Silva, M.R.; Reverbel-da, S.T. Comparison between handgrip strength, subjective global assessment, and prognostic nutritional index in assessing malnutrition and predicting clinical outcome in cirrhotic outpatients. Nutrition 2005, 21, 113–117. [Google Scholar] [CrossRef] [PubMed]
- Buzby, G.P.; Mullen, J.L.; Matthews, D.C.; Hobbs, C.L.; Rosato, E.F. Prognostic nutritional index in gastrointestinal surgery. Am. J. Surg. 1980, 139, 160–167. [Google Scholar] [CrossRef]
- Onodera, T.; Goseki, N.; Kosaki, G. Prognostic nutritional index in gastrointestinal surgery of malnourished cancer patients. Nihon Geka Gakkai Zasshi 1984, 85, 1001–1005. [Google Scholar] [PubMed]
- Nozoe, T.; Kimura, Y.; Ishida, M.; Saeki, H.; Korenaga, D.; Sugimachi, K. Correlation of pre-operative nutritional condition with post-operative complications in surgical treatment for esophageal carcinoma. Eur. J. Surg. Oncol. 2002, 28, 396–400. [Google Scholar] [CrossRef] [PubMed]
- Nozoe, T.; Kohno, M.; Iguchi, T.; Mori, E.; Maeda, T.; Matsukuma, A.; Ezaki, T. The prognostic nutritional index can be a prognostic indicator in colorectal carcinoma. Surg. Today 2012, 42, 532–535. [Google Scholar] [CrossRef]
- Watanabe, M.; Iwatsuki, M.; Iwagami, S.; Ishimoto, T.; Baba, Y.; Baba, H. Prognostic nutritional index predicts outcomes of gastrectomy in the elderly. World J. Surg. 2012, 36, 1632–1639. [Google Scholar] [CrossRef]
- Pinato, D.J.; North, B.V.; Sharma, R. A novel, externally validated inflammation-based prognostic algorithm in hepatocellular carcinoma: The prognostic nutritional index (PNI). Br J Cancer. Br. J. Cancer 2012, 106, 1439–1445. [Google Scholar] [CrossRef]
- Johnson, P.J.; Berhane, S.; Kagebayashi, C.; Satomura, S.; Teng, M.; Reeves, H.L.; O’Beirne, J.; Fox, R.; Skowron-ska, A.; Palmer, D.; et al. Assessment of liver function in patients with hepatocellular carcinoma: A new evidence-based approach-the ALBI grade. J. Clin. Oncol. 2015, 33, 550–558. [Google Scholar] [CrossRef] [PubMed]
- Zhong, C.R.; Qiu, J.L.; Yuan, Y.C.; Qiu, Z.Y.; Li, K.; Wang, C.W.; Shi, Y.X.; Li, K.R.; Lin, Z.; Huang, Z.K.; et al. A detailed assessment of liver function in patients with hepatocellular carcinoma via the modified albumin-bilirubin (mALBI) grade. Am. J. Cancer Res. 2022, 12, 2711–2720. [Google Scholar] [PubMed]
- Jensen, G.L.; Mirtallo, J.; Compher, C.; Dhaliwal, R.; Forbes, A.; Grijalba, R.F.; Hardy, G.; Kondrup, J.; Labadarios, D.; Nyulasi, I.; et al. Adult starvation and disease-related malnutrition: A proposal for etiology-based diagnosis in the clinical practice setting from the International Consensus Guideline Committee. JPEN J. Parenter. Enter. Nutr. 2010, 34, 156–159. [Google Scholar] [CrossRef] [PubMed]
- Merli, M.; Riggio, O.; Dally, L. Does malnutrition affect survival in cirrhosis? Hepatology 1996, 23, 1041–1046. [Google Scholar] [CrossRef] [PubMed]
- Tsiaousi, E.T.; Hatzitolios, A.I.; Trygonis, S.K.; Savopoulos, C.G. Malnutrition in end stage liver disease: Recommendation and nutritional support. J. Gastroenterol. Hepatol. 2008, 23, 527–533. [Google Scholar] [CrossRef] [PubMed]
- Hirsch, S.; de la Maza, M.P.; Gattás, V.; Barrera, G.; Petermann, M.; Gotteland, M.; Muñoz, C.; Lopez, M.; Bunout, D. Nutritional support in alcoholic cirrhotic patients improves host defenses. J. Am. Coll. Nutr. 1999, 18, 434–441. [Google Scholar] [CrossRef] [PubMed]
- Neil D Shah, N.D.; Barritt, A.S., 4th. Nutrition as Therapy in Liver Disease. Clin. Ther. 2022, 44, 682–696. [Google Scholar] [CrossRef] [PubMed]
- Plauth, M.; Cabré, E.; Riggio, O.; Assis-Camilo, M.; Pirlich, M.; Kondrup, J.; Ferenci, P.; Holm, E.; Dahl, S.V.; Müller, M.J.; et al. European Society for Parenteral and Enteral Nutrition guidelines on enteral nutrition: Liver disease. Clin. Nutr. 2006, 25, 285–294. [Google Scholar] [CrossRef]
- Figueiredo, F.A.; Perez, R.M.; Freitas, M.M.; Kondo, M. Comparison of three methods of nutritional assessment in liver cirrhosis: Subjective global assessment, traditional nutritional parameters, and body composition analysis. J. Gastroenterol. 2006, 41, 476–482. [Google Scholar] [CrossRef]
- Taniguchi, E.; Kawaguchi, T.; Itou, M.; Oriishi, T.; Ibi, R.; Torii, M.; Yoshida, K.; Adachi, Y.; Otsuka, M.; Uchida, Y.; et al. Subjective global assessment is not sufficient to screen patients with defective hepatic metabolism. Nutrition 2011, 27, 282–286. [Google Scholar] [CrossRef]
- Xie, Y.; He, C.; Wang, W. Prognostic nutritional index: A potential biomarker for predicting the prognosis of decompensated liver cirrhosis. Front. Nutr. 2022, 9, 1092059. [Google Scholar] [CrossRef] [PubMed]
- Lonardo, M.S.; Cacciapuoti, N.; Chiurazzi, M.; Lauro, M.D.; Guida, B.; Damiano, S.; Cataldi, M. Combined use of handgrip strength and hemoglobin as markers of undernutrition in patients with stage 3–5 chronic kidney disease. Nutr. Metab. 2023, 33, 2169–2178. [Google Scholar] [CrossRef] [PubMed]
- Bianchi, V.E. Role of nutrition on anemia in elderly. Clin. Nutr. ESPEN 2016, 11, e1–e11. [Google Scholar] [CrossRef] [PubMed]
- van Dijk, A.M.; Coppens, B.J.P.; van Beers, M.A.; Bruins Slot, A.S.; Verstraete, C.J.R.; de Bruijne, J.; Vleggaar, F.P.; van Erpecum, K.J. Nutritional status in patients with hepatocellular carcinoma: Potential relevance for clinical outcome. Eur. J. Intern. Med. 2022, 104, 80–88. [Google Scholar] [CrossRef] [PubMed]
- Chang, K.V.; Chen, J.D.; Wu, W.T.; Huang, K.C.; Hsu, C.T.; Han, D.S. Association between loss of skeletal muscle mass and mortality and tumor recurrence in hepatocellular carcinoma: A systematic review and meta-analysis. Liver Cancer 2018, 7, 90–103. [Google Scholar] [CrossRef]
- Badran, H.; Elsabaawy, M.M.; Ragab, A.; Aly, R.A.; Alsebaey, A.; Sabry, A. Baseline sarcopenia is associated with lack of response to therapy, liver decompensation and high mortality in hepatocellular carcinoma patients. Asian Pac. J. Cancer Prev. 2020, 21, 3285–3290. [Google Scholar] [CrossRef]
- Zhang, G.; Meng, S.; Li, R.; Ye, J.; Zhao, L. Clinical significance of sarcopenia in the treatment of patients with primary hepatic malignancies, a systematic review and meta-analysis. Oncotarget 2017, 60, 102474–102485. [Google Scholar] [CrossRef]
Disclaimer/Publisher’s Note: The statements, opinions and data contained in all publications are solely those of the individual author(s) and contributor(s) and not of MDPI and/or the editor(s). MDPI and/or the editor(s) disclaim responsibility for any injury to people or property resulting from any ideas, methods, instructions or products referred to in the content. |
© 2023 by the authors. Licensee MDPI, Basel, Switzerland. This article is an open access article distributed under the terms and conditions of the Creative Commons Attribution (CC BY) license (https://creativecommons.org/licenses/by/4.0/).