
Patello-Femoral Pain Syndrome: Magnetic Resonance Imaging versus Ultrasound
 ,
, 

 ,
,
Abstract
1. Introduction
2. Materials and Methods
2.1. Physiatric Tests
- -
- Movie Theater Sign: consists of anterior pain of the knee when standing after a prolonged period of sitting;
- -
- -
- Palpation of the margins and facet joints of the patellae (71–75% of subjects with this sign have PFPS);
- -
- Patellar Apprehension Sign;
- -
- Grind test (Clarke’s sign or Zohler’s sign): Patient is in a supine or long sitting position with the involved knee extended. The physician applies pressure with the hand superior to the patella while the patient gradually contracts the quadriceps muscle. The test is positive with the presence of pain in the patello-femoral joint [1];
- -
- Stair test: consists of pain triggered by walking up and down stairs.
2.2. Ultrasound
2.3. MRI
2.4. Statistical Analysis
3. Results
4. Discussion
- -
- The sample volume of patients is small;
- -
- US examination fails to fully evaluate the patello-femoral joint because of the bony interface of the patella itself;
- -
- Currently, the US exam can be performed in a static phase;
- -
- While using both the imaging methods we could not discriminate whether the PFPS is primary or secondary to other pathologies.
5. Conclusions
Author Contributions
Funding
Informed Consent Statement
Conflicts of Interest
References
- Crossley, K.M.; Stefanik, J.J.; Selfe, J.; Collins, N.J.; Davis, I.S.; Powers, C.M.; McConnell, J.; Vicenzino, B.; Bazett-Jones, D.M.; Esculier, J.-F.; et al. 2016 Patellofemoral pain consensus statement from the 4th International Patellofemoral Pain Research Retreat, Manchester. Part 1: Terminology, definitions, clinical examination, natural history, patellofemoral osteoarthritis and patient-reported outcome measures. Br. J. Sports Med. Publ. 2016, 50, 839–843. [Google Scholar]
- Crossley, K.M.; van Middelkoop, M.; Callaghan, M.J.; Collins, N.J.; Rathleff, M.S.; Barton, C.J. 2016 Patellofemoral pain consensus statement from the 4th International Patellofemoral Pain Research Retreat, Manchester. Part 2: Recommended physical interventions (exercise, taping, bracing, foot orthoses and combined interventions). Br. J. Sports Med. 2016, 50, 844–852. [Google Scholar] [CrossRef]
- Grelsamer Ronald, P.; McConnell, J. La Rotula. Approccio D’equipè; Albasini, A., Ed.; Galimberti, L., Translator; Elsevier: Milano, Italy, 1998. [Google Scholar]
- Dorey, C.; Williams, J.M. Strengthening the hip muscles in individuals with patellofemoral pain: What can be learned from the literature? Phys. Ther. Rev. 2015, 20, 63–72. [Google Scholar] [CrossRef]
- Dutton, R.A.; Khadavi, M.J.; Fredericson, M. Update on Rehabilitation of Patellofemoral Pain. Curr. Sports Med. Rep. 2014, 13, 172–178. [Google Scholar] [CrossRef] [PubMed]
- Werner, S. Anterior knee pain: An update of physical therapy. Knee Surg. Sports Traumatol. Arthrosc. 2014, 22, 2286–2294. [Google Scholar] [CrossRef]
- Rixe, J.A.; Glick, J.E.; Brady, J.; Olympia, R.P. A review of the Management of Patellofemoral Pain Syndrome. Phys. Sportsmed. 2013, 41, 19–28. [Google Scholar] [CrossRef]
- Petersen, W.; Ellermann, A.; Gösele-Koppenburg, A.; Best, R.; Rembitzki, I.V.; Bruggemann, G.P.; Liebau, C. Patellofemoral pain syndrome. Knee Surg. Sports Traumatol. Arthrosc. 2014, 22, 2264–2274. [Google Scholar] [CrossRef]
- Rothermich, M.A.; Glaviano, N.R.; Li, J.; Hart, J.M. Patellofemoral pain: Epidemiology, pathophysiology, and treatment options. Clin. Sports Med. 2015, 34, 313–327. [Google Scholar] [CrossRef]
- Clijsen, R.; Fuchs, J.; Taeymans, J. Effectiveness of exercise therapy in treatment of patients with patellofemoral pain syndrome: Systematic review and meta-analysis. Phys. Ther. 2014, 94, 1697–1708. [Google Scholar] [CrossRef]
- Crossley, K.M.; Callaghan, M.J.; Linschoten, R.V. Patellofemoral pain. Br. J. Sports Med. 2016, 50, 247–250. [Google Scholar] [CrossRef]
- Hrubes, M.; Nicola, T.L. Rehabilitation of the Patellofemoral Joint. Clin. Sports Med. 2014, 33, 553–566. [Google Scholar] [CrossRef]
- Elias, D.A.; White, L.M. Imaging of patellofemoral disorders. Clin. Radiol. 2004, 59, 543–557. [Google Scholar] [CrossRef] [PubMed]
- Gulati, A.; McElrath, C.; Wadhwa, V.; Shah, J.P.; Chhabra, A. Current clinical, radiological and treatment perspectives of patellofemoral pain syndrome. Br. J. Radiol. 2018, 91, 20170456. [Google Scholar] [CrossRef] [PubMed]
- Thomas, S.; Rupiper, D.; Stacy, G.S. Imaging of the patellofemoral joint. Clin. Sports Med. 2014, 33, 413–436. [Google Scholar] [CrossRef] [PubMed]
- Aly, T. Diagnostic accuracy of ultrasonography in the assessment of anterior knee pain. Insights Imaging 2020, 11, 107. [Google Scholar] [CrossRef]
- Martino, F.; De Serio, A.; Macarini, L.; Rizzo, A.; Laforgia, R.; Rotondo, A.; Angelelli, G. Ultrasonography versus computed tomography in evaluation of the femoral trochlear groove morphology: A pilot study on healthy, young volunteers. Eur. Radiol. 1998, 8, 244–247. [Google Scholar] [CrossRef]
- Lapègue, F.; Ponsot, A.; Barcelo, C.; Fourati, M.; Labarre, D.; Vial, J.; Chiavassa, H.; Railhac, J.J.; Sans, N. Approche échographique du syndrome femoro-patellaire. Actual. En. Echogr. De L‘Appar. Locomoteur. 2011, 8, 219–234. [Google Scholar]
- Doucette, S.A.; Goble, E.M. The effect of exercise on patellar tracking in lateral patellar compression syndrome. Am. J. Sports Med. 1992, 20, 434–440. [Google Scholar] [CrossRef]
- Tria, A.J.; Palumbo, R.C.; Alicea, J.A. Conservative care for patellofemoral pain. Orthop. Clin. N. Am. 1992, 23, 545–554. [Google Scholar] [CrossRef]
- Powers, C.M. Rehabilitation of patellofemoral joint disorders: A critical review. J. Orthop. Sports Phys. 1998, 28, 345–354. [Google Scholar] [CrossRef]
- McConnell, J. The physical therapist’s approach to patellofemoral disorders. Clin. Sports Med. 2002, 21, 363–387. [Google Scholar] [CrossRef] [PubMed]
- Dejour, D. Imagerie de la Fémoro-Patellaire; 85° SOFCOT: Paris, France, 2010. [Google Scholar]
- Brushøj, C.; Hölmich, P.; Nielsen, M.B.; Albrecht-Beste, E. Acute patellofemoral pain: Aggravating activities, clinical examination, MRI and ultrasound findings. Br. J. Sports Med. 2008, 42, 64–67; discussion 67. [Google Scholar] [CrossRef] [PubMed]
- Fulkerson, J.P. The etiology of patellofemoral pain in young, active patients: A prospective study. Clin. Orthop. Relat. Res. 1983, 179, 129–133. [Google Scholar] [CrossRef]
- Bump, J.M.; Lewis, L. Patello Femoral Syndrome; StatPearls Publishing: Treasure Island, FL, USA, 2023. [Google Scholar]
- Coupal, T.M.; Munk, P.L.; Ouellette, H.A.; Al-Shikarchv, H.; Mallinson, P.I.; Choudur, H. Popping the cap: The constellation of MRI findings in patellofemoral syndrome. Br. J. Radiol. 2018, 91, 20170770. [Google Scholar] [CrossRef] [PubMed]
- Schoots, E.J.M.; Tak, I.J.R.; Veenstra, B.J.; Krebbers, Y.M.J.; Bax, J.G. Ultrasound characteristics of the lateral retinaculum in 10 patients with Patellofemoral pain syndrome compared to healthy controls. J. Bodyw. Mov. Ther. 2013, 17, 523–529. [Google Scholar] [CrossRef] [PubMed]
- Kwan, L.Y.A.; Killingback, A.; Adds, P.J. Ultrasound Measurement of Lateral Patellar Displacement: A Cadaveric Validation Study. Int. J. Sports Phys. Ther. 2022, 17, 1113–1118. [Google Scholar] [CrossRef]
- Dorotka, R.; Jimenez-boj, E.; Kypta, A.; Kollar, A. The patellofemoral pain syndrome in recruits undergoing military training: A prospective 2-year follow-up study. Mil. Med. 2003, 168, 337–340. [Google Scholar] [CrossRef]
- Earl, A.; Hoch, A. A proximal strengthening program improves pain, function, and biomechanics in women with patellofemoral pain syndrome. Am. J. Sports Med. 2011, 39, 154–163. [Google Scholar] [CrossRef]
- Wilson, T. The measurement of patellar alignment in patellofemoral pain syndrome: Are we confusing assumptions with evidence? J. Orthop. Sports Phys. 2007, 37, 330–341. [Google Scholar] [CrossRef]
- Muhle, C.; Brossmann, J.; Heller, M. Kinematic CT and MR imaging of the patellofemoral joint. Eur. Radiol. 1999, 9, 508–518. [Google Scholar] [CrossRef]
- Van Kampen, A.; Huiskes, R. The three-dimensional tracking pattern of the human patella. J. Orthop. Res. 1990, 8, 372–382. [Google Scholar] [CrossRef] [PubMed]
- Elson, D.W.; Jones, S.; Caplan, N.; St Clair Gibson, A.; Stewart, S.; Kader, D.F. Clinically insignificant association between anterior knee pain and patellofemoral lesions which are found incidentally. Knee 2013, 20, 471–475. [Google Scholar] [CrossRef] [PubMed]
- Nunes, G.; Stapait, E.L.; Kirsten, M.H.; de Noronha, M.; Santos, G.M. Clinical test for diagnosis of patellofemoral pain syndrome: Systematic review with meta-analysis. Phys. Sports 2013, 14, 54–59. [Google Scholar] [CrossRef]
- Cook, C.; Mabry, L.; Reiman, M.; Hegedus, E. Best tests/clinical findings for screening and diagnosis of patellofemoral pain syndrome: A systematic review. Physiotherapy 2012, 98, 93–100. [Google Scholar] [CrossRef] [PubMed]
- Wallis, J.A.; Roddy, L.; Bottrell, J.; Parslow, S.; Taylor, N.F. A Systematic Review of Clinical Practice Guidelines for Physical Therapist Management of Patellofemoral Pain. Phys. Ther. 2021, 101, pzab021. [Google Scholar] [CrossRef]


| THICKNESS RENITACLES | MRI M (IQR) | US M (IQR) | |
|---|---|---|---|
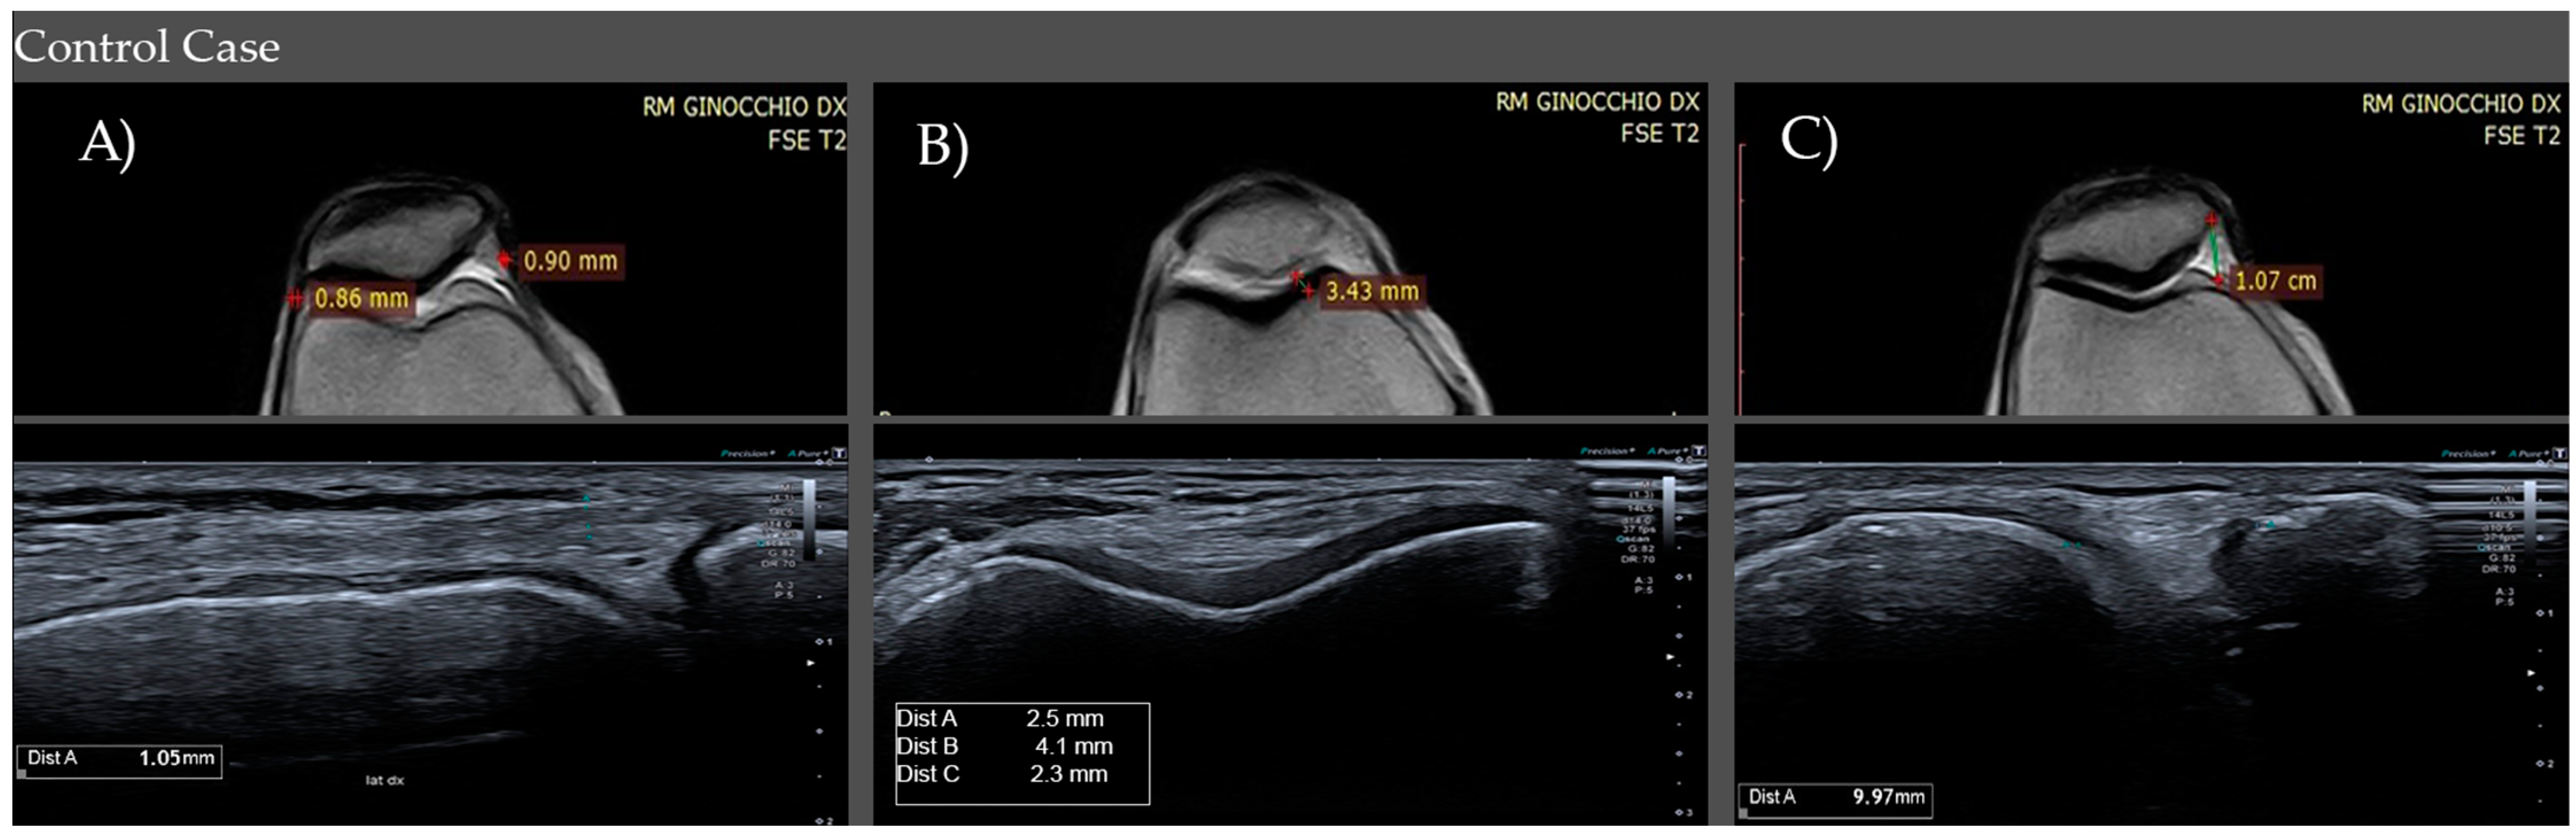
| CONTROLS | Medial Retinaculum | 0.9–1.0 mm (IQR) (M1) | 0.9–1.1 mm (IQR) (M1) |
| Lateral Retinaculum | 0.7–1.0 mm (IQR) (M0.9) | 0.9–1 mm (IQR) (M1) | |
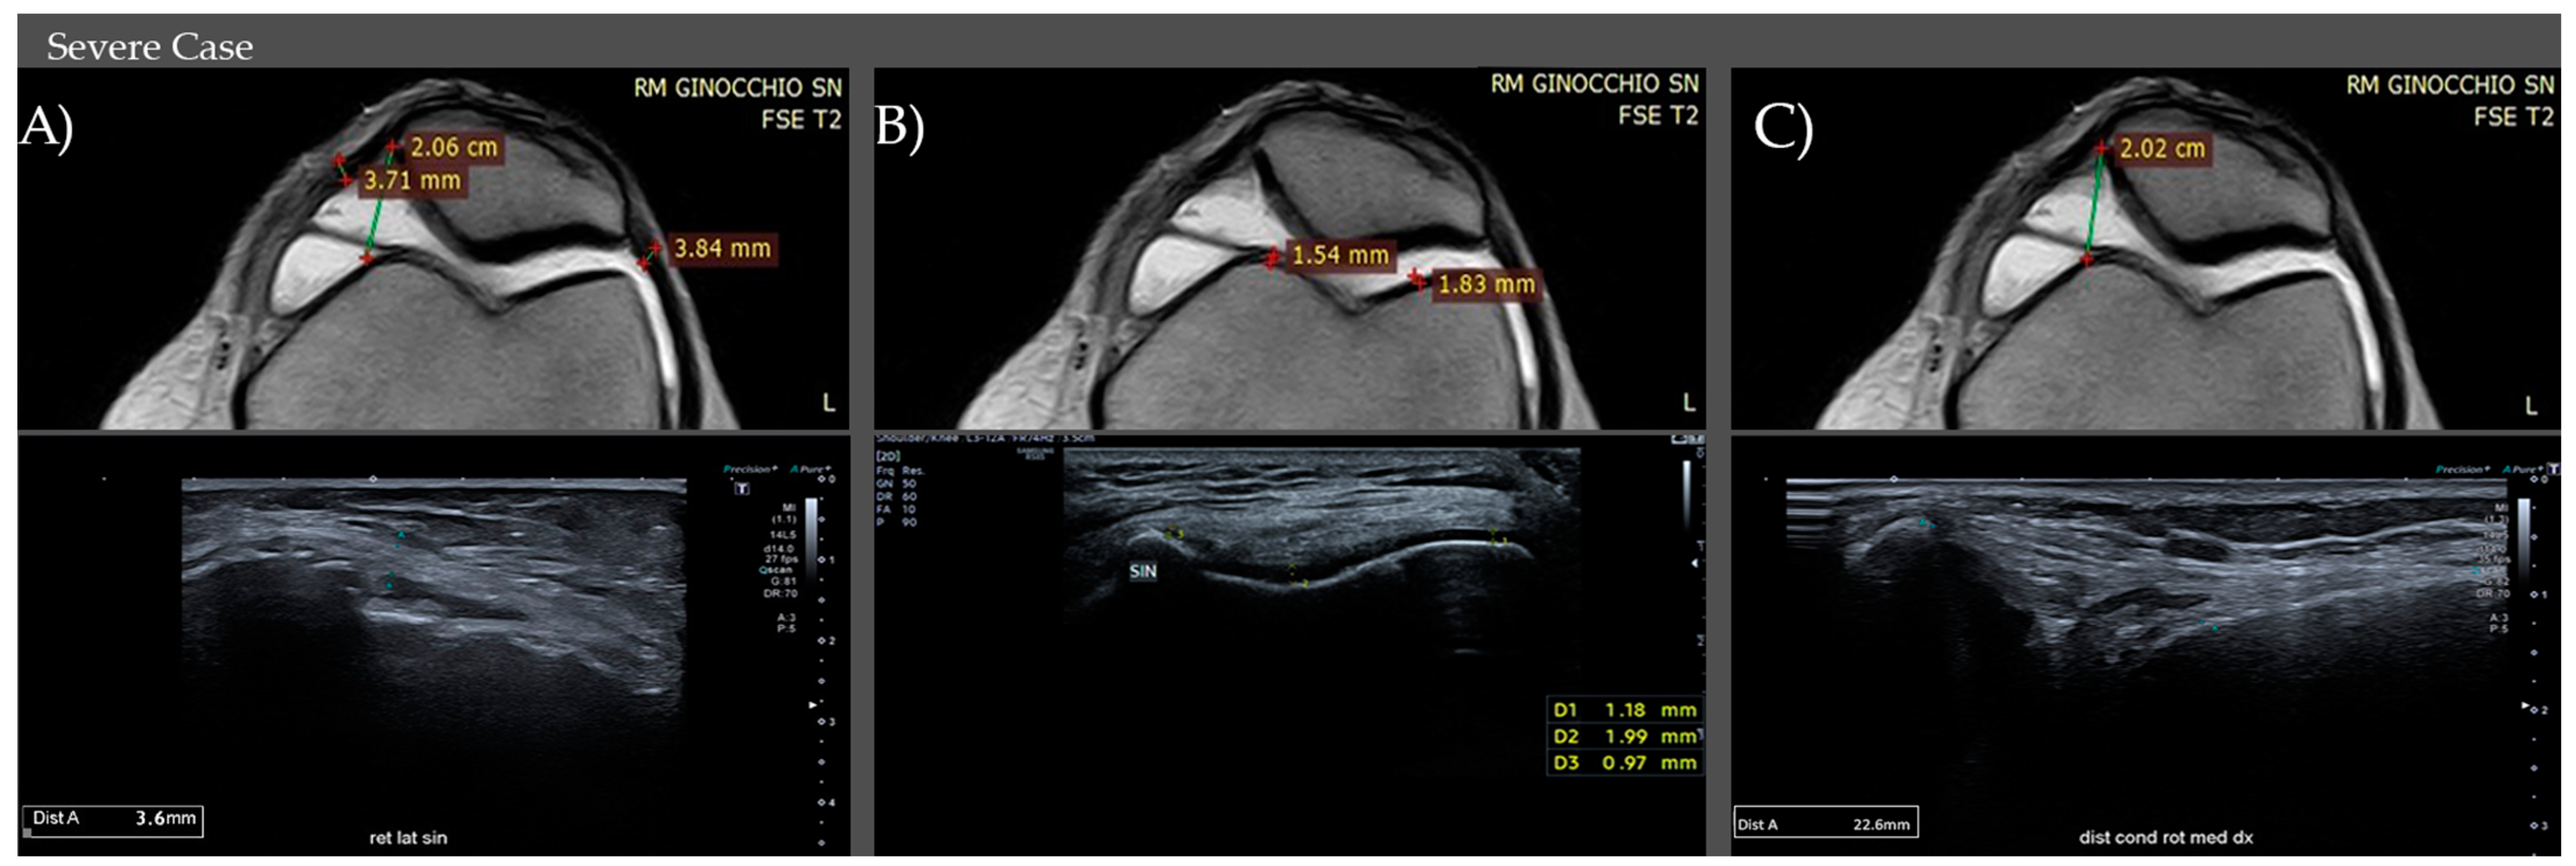
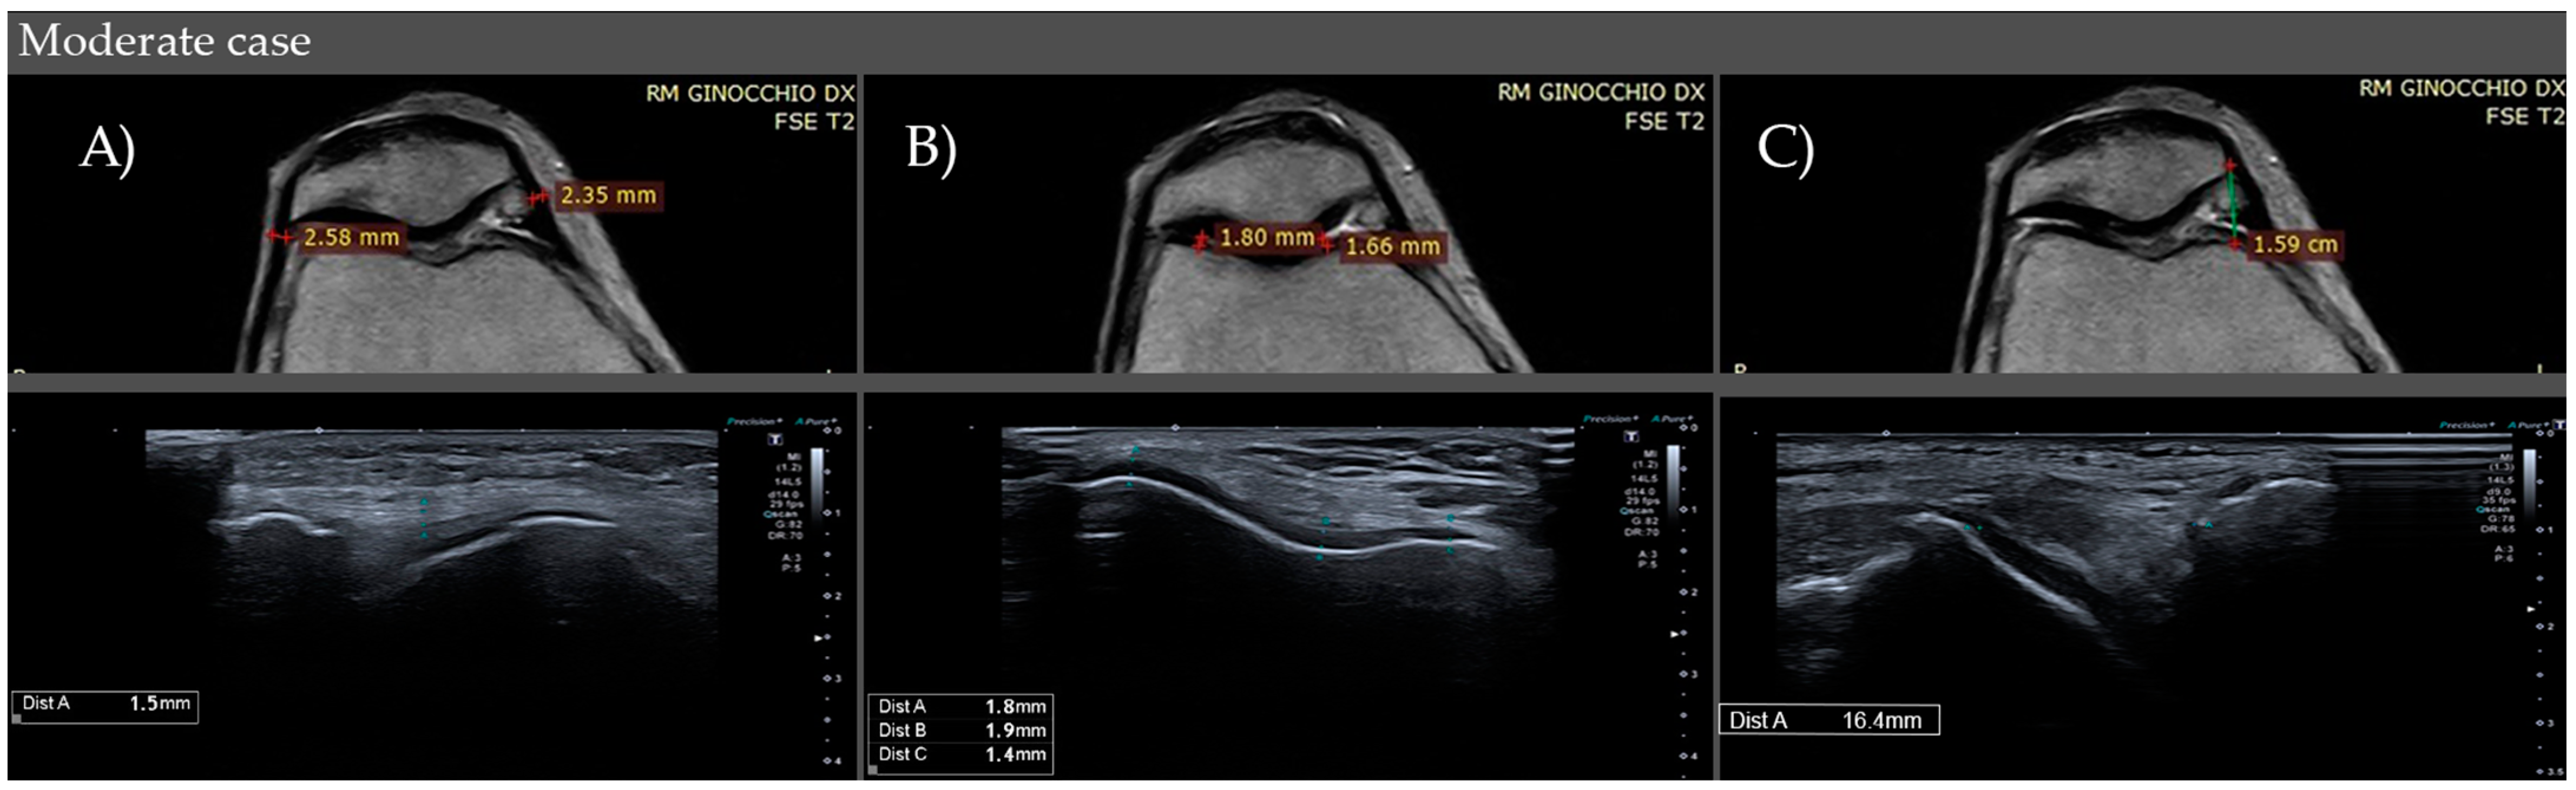
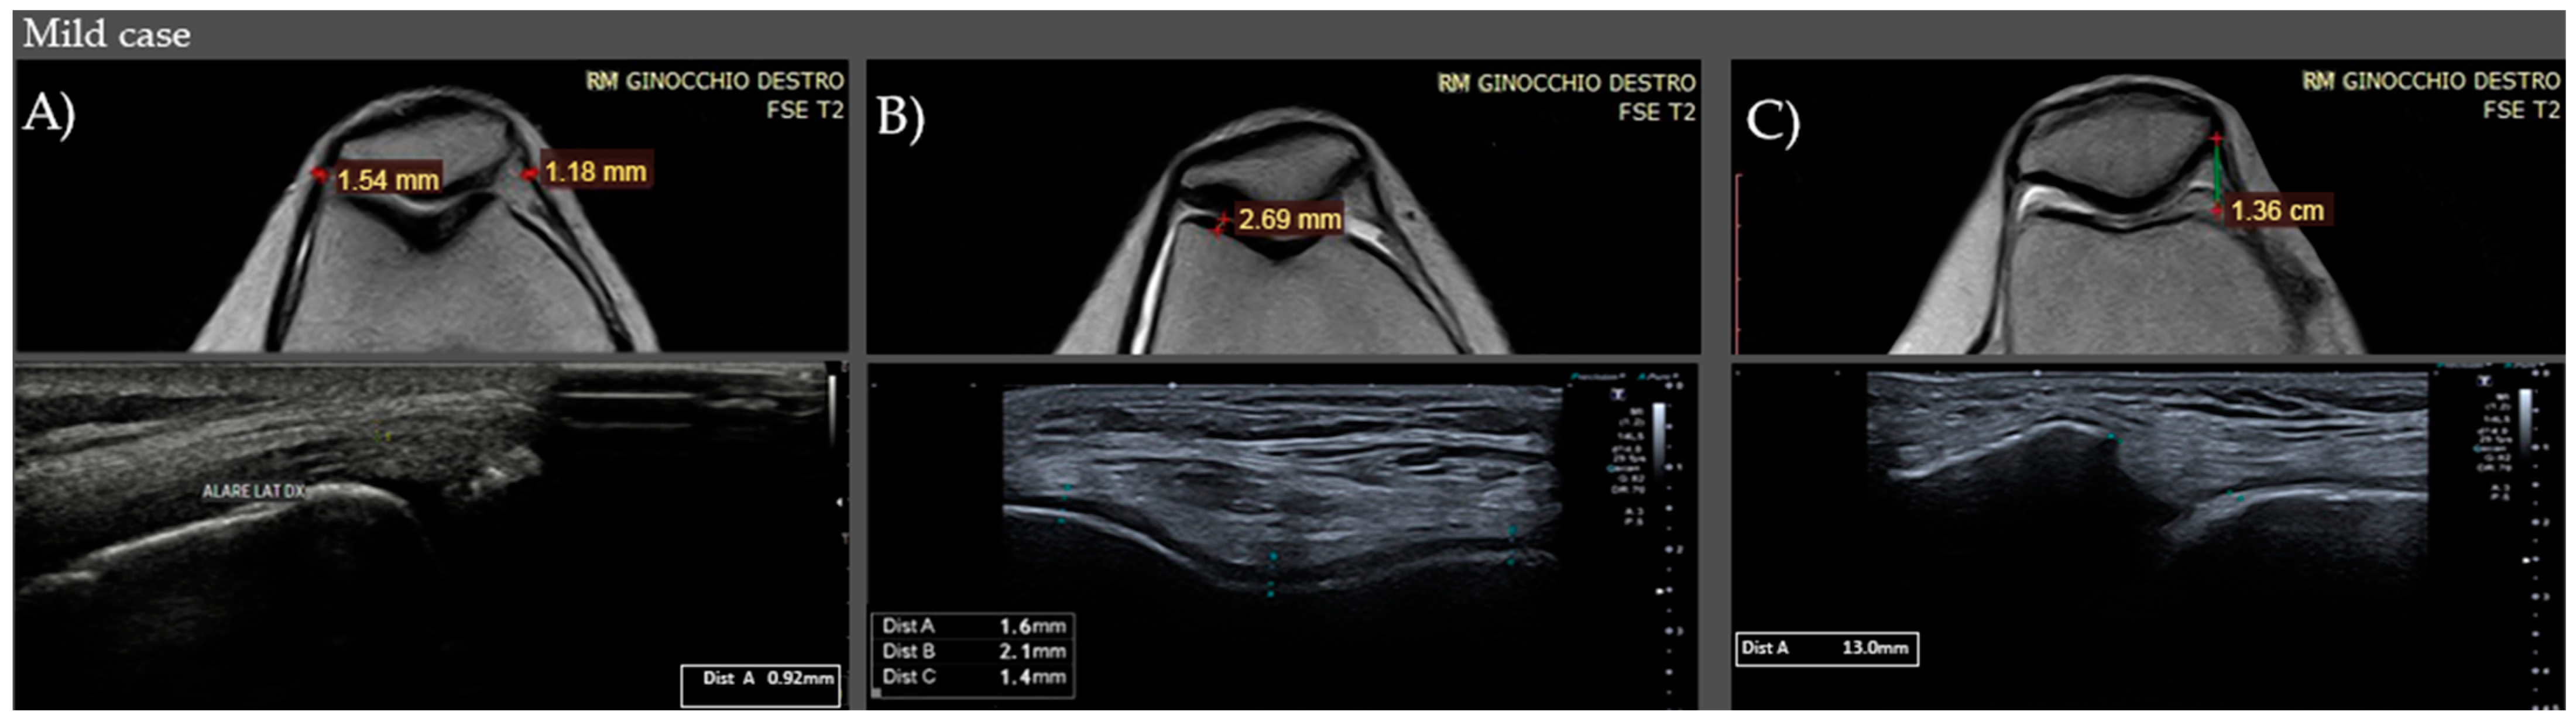
| CASES | Medial Retinaculum | 1.3–2.6 (IQR) (M2.1) Mild: <1.3 mm Moderate: 1.3–2.6 mm Severe: >2.6 mm | 1.5–2.8 (IQR) (M2.3) Mild: <1.5 mm Moderate: 1.5–2.8 mm Severe: >2.8 mm |
| Lateral Retinaculum | 1.2–2.5 (IQR) (M0.9) Mild: <1.2 mm Moderate: 1.2–2.5 mm Severe: >2.5 mm | 1.3–2.5 (IQR) (M2.2) Mild: <1.3 mm Moderate: 1.3–2.5 mm Severe: >2.5 mm | |
| THICKNESS CARTILAGES | MRI M (IQR) | US M (IQR) | |
| CONTROLS | Medial Thickness | 2.8–4.7 mm (IQR) (M4) | 2.9–4.5 mm (IQR) (M3.8) |
| Lateral Thickness | 3.3–5.1 mm (IQR) (M4.45) | 3.0–4.8 mm (IQR) (M4.2) | |
| CASES | Medial Thickness | 1.5–2.3 (IQR) (M1.8) Mild: >2.3 mm Moderate: 1.5–2.3 mm Severe: <1.5 mm | 1.2–2.1 (IQR) (M1.55) Mild: >2.1 mm Moderate: 1.2–2.1 mm Severe: <1.2 mm |
| Lateral Thickness | 1.8–2.65 (IQR) (M2.3) Mild: >2.6 mm Moderate: 1.8–2.6 mm Severe: <1.8 mm | 1.65–2.5 (IQR) (M2) Mild: >2.5 mm Moderate: 1.6–2.5 mm Severe: <1.6 mm | |
| PATELLO-FEMORAL DISTANCE | RMI M (IQR) | US M (IQR) | |
| CONTROLS | Medial Distance | 8.0–10 mm (IQR) (M9) | 8.0–10 mm (IQR) (M10) |
| CASES | Lateral Distance | 13.5–18 (IQR) (M16) Mild: <13.5 mm Moderate: 13.5–18 mm Severe: >18 mm | 14–18 (IQR) (M16) Mild: <14 mm Moderate: 14–18 mm Severe: >18 mm |
| (A) | |||
| RENITACLES | Mean Values | St Deviation | |
| Medial Retinaculum p < 0.001 | CONTROLS | MRI 0.995 US 1.05 | MRI 0.1708951 US 0.4893153 |
| CASES | MRI 1.984 US 2.241667 | MRI 0.671581 US 0.811212 | |
| Lateral Retinaculum p < 0.001 | CONTROLS | MRI 0.8675 US 1.03 | MRI 0.143915 US 0.5823857 |
| CASES | MRI 1.855 US 2.016167 | MRI 0.6176568 US 0.6705325 | |
| (B) | |||
| THICKNESS MEDIAL RETINACULUM | Mean Value | St Deviation | |
| CASES p < 0.001 | MRI | 1.984 | 0.671581 |
| US | 2.241667 | 0.811212 | |
| CONTROLS p = 0.4205 | MRI | 0.995 | 0.1708951 |
| US | 1.0575 | 0.4893153 | |
| THICKNESS LATERAL RETINACULUM | Mean Value | St Deviation | |
| CASES p < 0.001 | MRI | 1.855 | 0.617 |
| US | 2.016167 | 0.670 | |
| CONTROLS p = 0.0735 | MRI | 0.86 | 0.82 |
| US | 1.03 | 0.84 | |
| THICKNESS CARTILAGES | Mean Value | St Deviation | |
|---|---|---|---|
| Medial Cartilage p < 0.001 | CONTROLS | MRI 3.8375 US 3.5625 | MRI 0.883956 US 0.159031 |
| CASES | MRI 1.793833 US 1.626667 | MRI 0.5065774 US 1.491565 | |
| Lateral Cartilage p < 0.001 | CONTROLS | MRI 4.3075 US 3.9575 | MRI 0.8398374 US 1.059726 |
| CASES | MRI 2.225 US 2.0575 | MRI 1.4735531 US 1.4787718 | |
| (A) | |||
| PATELLO-FEMORAL DISTANCE | Mean Value | St Deviation | |
| MEDIAL DISTANCE | CONTROLS | MRI 8.9 US 9.205128 | MRI 1.598076 US 1.360717 |
| CASES | MRI 15.91667 US 16.23333 | MRI 2.726466 US 2.726932 | |
| (B) | |||
| MEDIAL PATELLO-FEMORAL DISTANCE | Mean Value | St Standard | |
| CONTROLS p < 0.0001 | MRI | 8.89 | 1.61 |
| US | 9.20 | 1.36 | |
| CASES p < 0.0658 | MRI | 15.91 | 2.72 |
| US | 16.2 | 2.72 | |
| KOOS | |
| Controls | 0.8–0.87 (IQR) (M0.84) |
| Cases | 0.37–0.68 (IQR) (M0.52) |
| SYMPTOMS STIFFNESS | |
| Controls | 0.89–0.93 (IQR) (M0.93) |
| Cases | 0.37–0.70 (IQR) (M0.58) |
| FUNCTION, DAILY LIVING | |
| Controls | 0.79–0.85 (IQR) (M0.82) |
| Cases | 0.37–0.66 (IQR) (M0.54) |
| FUNCTION SPORTS AND RECREATIONAL ACTIVITY | |
| Controls | 0.75–0.75 (IQR)(M0.75) |
| Cases | 0.38–0.60 (IQR) (M0.50) |
| QUALITY OF LIFE | |
| Controls | 0.75–0.88 (IQR) (M0.88) |
| Cases | 0.16–0.54 (IQR) (M0.45) |
| Mean Value | St Deviation | |
|---|---|---|
| KOOS | ||
| Controls | 0.84475 | 0.0725714 |
| Cases | 0.5095 | 0.165666 |
| SYMPTOMS STIFFNESS | ||
| Controls | 0.89675 | 0.0663861 |
| Cases | 0.5433333 | 0.1829946 |
| FUNCTION, DAILY LIVING | ||
| Controls | 0.8085 | 0865448 |
| Cases | 0.528 | 1471515 |
| FUNCTION SPORTS AND RECREATIONAL ACTIVITY | ||
| Controls | 0.7823077 | 0.0703548 |
| Cases | 0.4583333 | 0.180011 |
| QUALITY OF LIFE | ||
| Controls | 0.8148718 | 0.0879555 |
| Cases | 0.4003333 | 0.2148627 |
| VAS | ||
| Controls | 0.94825 | 0.90437 |
| Cases | 6.366667 | 1.850 |
| MEDIAL PATELLO-FEMORAL DISTANCE | ||
|---|---|---|
| p < 0.001 | US | MRI |
| VAS | 0.9873 | 0.9746 |
| SYMPTOMS STIFFNESS | −0.9552 | −0.9649 |
| KOOS | −0.9814 | −0.9649 |
| FUNCTION, DAILY LIVING | −0.9252 | −0.9042 |
| QUALITY OF LIFE | −0.9471 | −0.9191 |
| FUNCTION SPORTS AND RECREATIONAL ACTIVITY | −0.8266 | −0.8340 |
Disclaimer/Publisher’s Note: The statements, opinions and data contained in all publications are solely those of the individual author(s) and contributor(s) and not of MDPI and/or the editor(s). MDPI and/or the editor(s) disclaim responsibility for any injury to people or property resulting from any ideas, methods, instructions or products referred to in the content. |
© 2023 by the authors. Licensee MDPI, Basel, Switzerland. This article is an open access article distributed under the terms and conditions of the Creative Commons Attribution (CC BY) license (https://creativecommons.org/licenses/by/4.0/).
Share and Cite
Pacini, P.; Martino, M.; Giuliani, L.; Santilli, G.; Agostini, F.; Del Gaudio, G.; Bernetti, A.; Mangone, M.; Paoloni, M.; Toscano, M.; et al. Patello-Femoral Pain Syndrome: Magnetic Resonance Imaging versus Ultrasound. Diagnostics 2023, 13, 1496. https://doi.org/10.3390/diagnostics13081496
Pacini P, Martino M, Giuliani L, Santilli G, Agostini F, Del Gaudio G, Bernetti A, Mangone M, Paoloni M, Toscano M, et al. Patello-Femoral Pain Syndrome: Magnetic Resonance Imaging versus Ultrasound. Diagnostics. 2023; 13(8):1496. https://doi.org/10.3390/diagnostics13081496
Chicago/Turabian StylePacini, Patrizia, Milvia Martino, Luca Giuliani, Gabriele Santilli, Francesco Agostini, Giovanni Del Gaudio, Andrea Bernetti, Massimiliano Mangone, Marco Paoloni, Martina Toscano, and et al. 2023. "Patello-Femoral Pain Syndrome: Magnetic Resonance Imaging versus Ultrasound" Diagnostics 13, no. 8: 1496. https://doi.org/10.3390/diagnostics13081496
APA StylePacini, P., Martino, M., Giuliani, L., Santilli, G., Agostini, F., Del Gaudio, G., Bernetti, A., Mangone, M., Paoloni, M., Toscano, M., De Vito, C., Ottonello, C., Santilli, V., & Cantisani, V. (2023). Patello-Femoral Pain Syndrome: Magnetic Resonance Imaging versus Ultrasound. Diagnostics, 13(8), 1496. https://doi.org/10.3390/diagnostics13081496