1. Introduction
Coronavirus disease 19 (COVID-19), one of the deadliest pandemics in the history of mankind, has swept through almost all the countries in the world [
1]. Coronavirus has infected over 676 million people and killed over 6.88 million as of 17 March 2023, as indicated in the COVID-19 map of Johns Hopkins University. Unfortunately, the virus is still evolving, and new variants continue to emerge worldwide. Multiple nations, including Australia, Bangladesh, Denmark, India, Japan, and the United States, detected a novel immune-evasive COVID-19 strain (XBB) in August 2022, which is causing outbreaks in various nations. This shows that COVID-19 is still a threat, and there is a need for suitable techniques that can be used to tackle this pandemic.
Recently, computer-aided diagnosis technologies have become a fundamental part of routine clinical practice. These tools can be utilized to aid physicians in accurately diagnosing COVID-19 patients. Convolutional neural networks (CNNs) are one of the effective deep learning (DL) algorithms for building improved medical imaging systems. However, they are unable to handle input transformations effectively. In addition, CNNs must be trained on massive or augmented datasets to generate superior results. A capsule neural network (CapsNet) is a recent deep learning (DL) algorithm proposed by Hinton et al. [
2]. CapsNets are resistant to image rotations and transformations [
2], and they can produce excellent results when trained on small datasets [
1,
3].
This study proposes a CapsNet model for COVID-19 diagnosis using CT and X-ray images. This study also evaluates the robustness of CapsNets for image rotations and transformations. The main contributions of this study are as follows:
This study proposes an improved CapsNet technique for COVID-19 diagnosis (named CapsNetCovid). The proposed model was trained and evaluated on 14,000 CT images and 15,153 X-ray images. The results show that the proposed technique achieved good results for both CT and X-ray datasets. The full results are presented and discussed in
Section 4.
As noted by the researchers that developed CapsNets [
2], one of the key advantages of CapsNets over CNNs is its robustness to image rotations and affine transformations. To the best of the authors’ knowledge, no study has presented a performance analysis of CapsNet on different image rotations and transformations. This study presents a performance analysis of CapsNets on standard CT and X-ray images and their corresponding augmented variants. The analysis is presented for both binary classification and multi-class classification. The objective of the analysis is to evaluate the robustness of CapsNets to affine transformations.
To the best of the authors’ knowledge, no study has compared CapsNets and other CNN-based techniques in terms of their ability to recognize randomly transformed and rotated images. This study presents a comparative analysis between CapsNet, CNN, and two state-of-the-art CNN models, namely DenseNet121 and ResNet50. The comparative analysis is presented for both CT and X-ray images. The analysis compares the ability of CapsNet, CNN, DenseNet121, and ResNet50 to correctly identify randomly transformed and rotated CT and X-ray images without using data augmentation techniques.
This paper is organized as follows. A detailed review of related studies is presented in
Section 2, and in
Section 3, the methodology used in this study is presented. Furthermore, the dataset details and performance metrics used for evaluation are presented in
Section 3. The results are presented and discussed in
Section 4. The paper is finally concluded in
Section 5.
2. Related Studies
Many DL-based COVID-19 diagnosis methods have been developed by different researchers, and most of them have produced promising results. AbouEl-Magd et al. [
4] proposed a CNN-based COVID-19 diagnosis technique using VGG16 and a capsule neural network (CapsNet). The Synthetic Minority Oversampling Technique (SMOTE) [
5] was used to generate new synthetic samples for their unbalanced dataset. Moreover, the Gaussian optimization technique was used to optimize the parameters for the CapsNet. Four different experiments were performed in the study. In the first two experiments, the CapsNet was evaluated on unbalanced datasets, as well as on balanced datasets based on class weights. In addition, the CapsNet was evaluated on a SMOTE-based balanced dataset. Finally, CapsNet was evaluated on a balanced dataset using the optimized parameters. The CapsNet model that was trained on the SMOTE-based balanced dataset produced the best classification accuracy and F1-scores of 96.73% and 97.08%, respectively.
Saif et al. [
6] developed a modified CapsNet framework for COVID-19 diagnosis. The framework consists of three sets of convolution blocks concatenated in parallel. Each convolutional block consists of different filter sizes. Concatenating the convolutional blocks of different filter sizes helps to integrate discriminative coarse spatial features into the network. The proposed architecture handles images of large spatial resolution by using an extended number of capsule layers and routing numbers. The concatenated feature set is fed into the CapsNet. The CapsNet uses a concatenation technique in the capsule layers, in which the output of two higher-layer capsules is concatenated. The concatenated connections between the capsule layers helps to capture underlying complex features from specific regions in an image. Moreover, the concatenated connections strengthen the coupling coefficient and improves the learning ability of the capsule layers. It also increases the model’s ability to extract complex features from images with large spatial dimensions. The authors also used a pre-trained model to finetune the network’s performance. The proposed framework was tested on three different datasets, and it achieved classification accuracies of 96.0%, 96.8%, and 95.9% without finetuning. The technique also produced classification accuracies of 98.3%, 99.0%, and 98.9% for the three datasets with finetuning.
Toraman et al. [
7] introduced a novel CapsNet architecture for COVID-19 diagnosis from X-ray images. The architecture is composed of five convolution layers, and each layer consist of 16, 32-, 64-, 128-, and 256-layer kernels. A large number of convolutional layers was added to provide effective feature maps to the primary layer of the CapsNet. The kernel size of the first three layers is 5 × 5, while the kernel size of the fourth layer is 9 × 9. The fifth layer is a primary capsule layer, consisting of 32 capsules, and each has a kernel size of 9 × 9. The proposed architecture was evaluated on a dataset consisting of 231 X-ray images of COVID-19 [
8], 1050 X-ray images of no findings [
9], and 1050 X-ray images of pneumonia [
9]. The technique produced a classification accuracy of 84.22% and 97.24% for multi-class and binary classification, respectively.
Tiwari et al. [
10] designed a hybrid framework for COVID-19 diagnosis (called VGG-CapsNet). The framework consists of CapsNet and VGG16. The input images are fed into the VGG16 pre-trained network to extract feature maps. The extracted feature maps are then fed into the CapsNet for classification. The proposed technique was evaluated on a dataset containing 219, 1345, and 1341 radiography images of COVID-19, pneumonia, and normal conditions, respectively [
11]. The proposed technique was evaluated for multi-class classification and binary classification. The proposed hybrid model was also compared with the standard CapsNet model (called CNN-CapsNet). The framework achieved 97% for binary classification and 92% for multi-class classification. The results also show that the proposed hybrid framework outperforms the standard CapsNet by 2% for binary classification and by 1% for multi-class classification.
Afshar et al. [
12] proposed a CapsNet-based framework for COVID-19 diagnosis. The framework consists of four convolutional layers and three capsule layers. The first convolutional layer is followed by a batch normalization layer, while the second convolutional layer is followed by an average pooling layer. The features from the fourth convolutional layer are reshaped and fed into the CapsNet. The dataset used to evaluate the framework is imbalanced; the number of positive cases is lower than the number of negative cases. Therefore, the loss function of the network is modified, such that more weight is assigned to the positive samples. The weights are determined using a formula specified in [
12]. The framework was evaluated by first pre-training it on a dataset containing 94,323 frontal view of chest X-ray images. The pre-trained network was then finetuned on a dataset containing 358 CXR COVID-19 images, 8,066 8,066 normal images, and 5538 non-COVID-19 images. The framework achieved an accuracy, sensitivity, specificity, and AUC of 95.7%, 90%, 95.8%, and 0.97, respectively.
Heidarian et al. [
13] proposed a fully automated two-stage framework for COVID-19 diagnosis using CapsNet and CT images, called COVID-FACT. At the first stage, COVID-FACT uses U-Net architecture to detect infected slices from a 3D volumetric CT scan. The infected slices are classified in the second stage. Two variants of the framework were developed in the study. Whole CT images are used as inputs to the first variant, while the segmented lung region is used as an input to the second variant. COVID-FACT was trained on a dataset containing 171, 60, and 76 COVID-19, community-acquired pneumonia (CAP), and normal volumetric CT images, respectively. Experiments shows that the two variants produced the same classification accuracy of 90.82%. However, the variant that was trained on the segmented lung regions improved the sensitivity and AUC of the model by over 1.83% and 0.03, respectively.
Quan et al. [
14] designed a COVID-19 diagnosis method using DenseNet121 and CapsNet. They also introduced a dataset pre-processing technique that reduces the impact of dataset heterogeneity on the performance of a network. Data augmentation was also used to generate more datasets. The proposed framework uses a segmentation network, namely TernausNet [
15], to segment or extract the lung contour from X-ray images. The segmented lung contours are then fed into DenseNet121 for feature extraction. The extracted features are fed into CapsNet for classification. The segmentation network was trained on the Montgomery County Chest X-ray Database [
16], containing 80 and 50 normal and tuberculosis X-ray images, respectively. The classification network was trained on a dataset from three sources. The dataset contains 781, 2917, 2884, and 2850 COVID-19, normal, pneumonia (virus), and pneumonia (bacteria) X-ray images, respectively. The framework achieved a classification accuracy, sensitivity, and F1-score of 90.7%, 96%, and 90.9%, respectively.
Qi et al. [
17] developed a fully automated pipeline for classifying COVID-19 from CAP using CT images. The pipeline consists of four modules. The first module uses LinkNet [
18] to segment the lungs from CT images, and the second module uses CapsNet to select slices with lesions. The third module uses ResNet50 and CapsNet for slice-level prediction, and the fourth module uses DensNet121 and CapsNet for patient-level prediction. The pipeline was trained on a dataset containing 161 CT images with COVID-19 and 100 CT images with CAP. The CapsNet with ResNet50 achieved a classification accuracy and AUC of 92.5% and 0.933, respectively, for the slice-level prediction. The CapsNet with DenseNet121 achieved a better classification accuracy and AUC of 97.1% and 0.992, respectively, for slice-level prediction. The pipeline achieved an accuracy of 100% for patient-level prediction.
Attallah [
19] proposed a CNN-based technique for COVID-19 diagnosis called RADIC. RADIC is divided into four stages. In the first stage, four radiomics methods are used to analyze CT and X-ray images, including gray-level run-length matrix (GLRLM), gray-level covariance matrix (GLCM), discrete wavelet transform (DWT), and dual-tree complex wavelet transform (DTCWT). The output of the analysis was then converted to heatmap images. In the second stage, the heatmap images are used to train three CNN models, including MobileNet, DenseNet201, and Darknet53. After training, deep features were extracted from the batch normalization layers of the three models. Furthermore, the complexity of the extracted features was reduced using the fast Walsh–Hadamard transform (FWHT). The reduced features from the three CNN models were combined using discrete cosine transform. Finally, the combined features were used to train different classification models, including linear support vector machine (L-SVM), quadratic-SVM, linear discriminant analysis (LDA), and ensemble subspace discriminant (ESD). The technique was evaluated on a CT and X-ray dataset, and it produced 99.4% and 99% on the two datasets.
Mercaldo et al. [
20] designed a DL technique for COVID-19 diagnosis using VGG16. They added one more fully connected layer to the VGG16 and trained the added layer on a dataset containing 18,000 CT images. The model achieved an accuracy of 95%. In another study, Shah et al. [
21] designed a CNN-based technique for COVID-19 diagnosis. They evaluated the model on 738 CT images, and it produced a classification accuracy of 82.1%. They also compared the performance of the proposed model to DenseNet169, VGG16, ResNet50, InceptionV3, and VGG19. The comparison shows that VGG-19 outperformed the other techniques, achieving an accuracy of 94.52%.
Attallah and Samir [
22] designed a DL-based pipeline for COVID-19 diagnosis using a multilevel discrete wavelet decomposition (DWT) and three ResNet models. DWT was used to analyze CT scans and generate heatmap images. The heatmap images were used to train three ResNet models. After training, spectral–temporal features were extracted from the three ResNet models, including ResNet50, ResNet101, and ResNet18. Furthermore, the same ResNet models were trained on the original CT images and some spatial features were extracted from the models after training. Furthermore, the spatial features were combined with the spectral–temporal features, and the combined feature dimension was reduced. Finally, the reduced features were used to train three SVM models. The technique was evaluated on two datasets, which achieved a classification accuracy of 99.33% and 99.7%.
Attallah [
23] proposed a framework for COVID-19 diagnosis using texture-based radiomic images. The author trained three ResNet models (ResNet18, ResNet50, and ResNet101) on two types of texture-based radiomic images. The first set of images were generated by discrete wavelet transform, while the second set were generated by gray-level covariance matrix. After training, some texture-based radiomic features were extracted from the trained models and combined using discrete cosine transform. The fused features were used to train three SVM algorithms. The technique was evaluated on a dataset consisting of 2482 COVID-19 normal CT images, and it achieved a classification accuracy of 99.60%. Zhao et al. [
24] designed a technique for COVID-19 diagnosis using a modified version of the ResNet model. In the modified model, the authors substituted group normalization for batch normalization and performed a weight standardization for all the convolutional layers. The model was evaluated on a dataset containing 194,922 images, and it achieved a classification accuracy of 99.2%.
Shankar and Perumal [
25] proposed a novel technique for COVID-19 diagnosis. This technique is divided into three stages. In the first stage, Gaussian filtering is used for smoothening and noise removal from the images. Furthermore, the proposed fusion model is used to extract a different set of features from the processed images. It extracts handcrafted features using the local binary pattern model and DL features using the InceptionV3 model. Furthermore, the extracted features were fused and trained on the multilayer perceptron classifier. The technique was evaluated on an X-ray dataset consisting of 27 normal, 220 COVID-19, 11 SARS, and 15 Pneumocystis images, and it produced a classification accuracy of 94.08%. In another study, Marios et al. [
26] presented an analysis of five DL algorithms for COVID-19 diagnosis using ResNet50, ResNet101, DenseNet121, DenseNet169, and InceptionV3. The models were trained on a dataset consisting 11,956 COVID-19 X-ray images, 10,701 normal images, and 11,263 pneumonia images. The results show that ResNet101 achieved the best classification accuracy of 96%. Attallah [
27] proposed a CNN-based method for COVID-19 diagnosis using spectral–temporal images. This method is divided into three stages. In the first stage, multilevel discrete wavelet transform (DWT) is used to analyze CT images and extract spectral–temporal images. The extracted images were then used to train three ResNet models. After training, deep features were extracted and fused together. The dimension of the fused features was reduced and used to train SVM. The technique was evaluated on a dataset consisting of CT images, and it produced satisfactory accuracy. A summary of the literature review is presented in
Table 1.
Limitations of Existing COVID-19 Diagnosis Models
As shown in the summary and in a literature survey written in [
28,
29], COVID-19 diagnosis models have some shortcomings. Tracking people that are infected with COVID-19 is a challenging task. Moreover, identifying patients infected with COVID-19 beforehand is impossible because COVID-19 has an incubation period of 14 days. Furthermore, some of the datasets used for training lacks quality, as some of them are available in an unstructured format. In addition, some of the datasets are too clean, lacking representation of real-world datasets [
28]. Moreover, the generalization performance of some of the proposed models is not good due to overfitting. Furthermore, most studies do not explore the use of unsupervised ML algorithms for COVID-19 diagnosis, such as principal component analysis (PCA) and cluster analysis [
29]. Most studies also focus on DL algorithms, such as CNN, while few studies explored CapsNet. Furthermore, to the best of the authors’ knowledge, no study presented a performance analysis of CapsNet on images of different rotations and transformations. Moreover, existing studies did not compare CapsNet and other CNN-based techniques in terms of their ability to recognize randomly transformed and rotated images. This is quite necessary, as one of the core advantages of CapsNet over CNN is its resistance to image rotations and transformations [
2], as well as its ability to produce excellent results when trained on small datasets. This study aims to bridge some of the highlighted gaps. The main contributions of this study are highlighted in
Section 1.
Table 1.
Summary of related studies.
Table 1.
Summary of related studies.
| Ref. | Method | Dataset | Performance |
|---|
| AbouEl-Magd et al. [4] | VGG16, CapsNet, SMOTE, and Gaussian optimization algorithm. | SIRM Dataset consisting of 219 COVID-19 chest X-ray images, 1341 standard images, and 1345 viral pneumonia images. | Classification accuracy of 96.58% and F1-score of 97.08%. |
| Saif et al. [6] | CapsNet, concatenation of parallel convolutional blocks of different filter sizes, concatenation of capsule layers. | POCUS dataset consisting of 64 videos [30]. A second dataset consisting of 1142 COVID-19 sample, 1332 normal images, and 1355 viral pneumonia images from different sources. A third dataset consisting of 230 COVID-19 images, 1064 normal images, and 1036 viral pneumonia images from different sources. | Classification accuracy of 98.3%, 99.0%, and 98.9%. |
| Toraman et al. [7] | Introduced a novel CapsNet architecture for COVID-19 diagnosis. | Dataset consist of 231 COVID-19 X-ray images [8], 1050 no findings images [9], and 1050 pneumonia images [9]. | Classification accuracy of 84.22% and 97.24% for multi-class and binary class, respectively. |
| Tiwari et al. [10] | Proposed a hybrid technique for COVID-19 diagnosis. The framework consists of CapsNet and VGG16. | Dataset consist of 219, 1345, and 1341 radiography images of COVID-19, pneumonia, and normal conditions, respectively [11]. | Classification accuracy of 97% for binary classification and 92% for multi-class classification. |
| Afshar et al. [12] | Designed a CapsNet framework. No data augmentation was used. Data imbalance technique was introduced. | Dataset consist of 358 CXR COVID-19 images, 8,066 8,066 normal, and 5538 non-COVID-19 images. | Accuracy, sensitivity, specificity, and AUC of 95.7%, 90%, 95.8%, and 0.97, respectively. |
| Heidarian et al. [13] | Designed a two-stage framework for COVID-19 diagnosis using CapsNet and volumetric CT images. Infected slices of CT images are detected in the first stage, and the images are classified in the second stage. | Dataset consist of 171, 60, and 76 COVID-19, CAP, and normal volumetric CT images, respectively. | Accuracy, sensitivity, specificity, and AUC of 90.82%, 94.55%, 86.04%, and 0.98, respectively. |
| Quan et al. [14] | Proposed a DL-based framework for COVID-19 diagnosis using DenseNet121 and CapsNet. The framework uses TernausNet for segmentation, DenseNet121 for feature extraction, and CapsNet for classification. | Dataset contains 781, 2917, 2884, and 2850 COVID-19, normal, pneumonia (virus), and pneumonia (bacteria) X-ray images. | Accuracy, sensitivity, and F1-score of 90.7%, 96%, and 90.9%, respectively. |
| Qi et al. [17] | Proposed a four-module pipeline for COVID-19 diagnosis. The first two modules are used for lung segmentation and selection of slices with lesions. The last two modules use CapsNet, ResNet50, and DenseNet121 for slice-level and patient-level prediction. | Dataset contains 161 CT images with COVID-19 and 100 CT images with CAP. | Classification accuracy and AUC of 97.1% and 0.992, respectively, for slice-level prediction. Classification accuracy of 100% for patient-level prediction. |
| Attallah [19] | Designed a novel method for building classification models for CT and X-ray images. The method uses four radiomic methods, three DL models, one feature reduction technique (FWHT), and one feature combination technique (FWHT). | Two datasets were used in the study. Dataset 1 consists of 1230 non-COVID-19 and 1252 COVID-19 CT scans. Dataset 2 consist of 1784 COVID-19 X-ray images, 1754 healthy X-ray scans, and 1345 X-Ray scans of people with pneumonia. | The technique was evaluated on a CT and X-ray dataset, and it produced 99.4% and 99% on the two datasets. |
| Mercaldo et al. [20] | VGG16. | Dataset consists of 18,000 CT images. | Classification accuracy of 95%. |
| Shah et al. [21] | DenseNet169, VGG16, ResNet50, InceptionV3, and VGG19. | Dataset consists of 738 CT images. | Classification accuracy of 94.52%. |
| Attallah and Samir [22] | ResNet50, ResNet101, ResNet18, DWT, and SVM. | Dataset 1 consist of 5152 normal 3D CT scans and 6012 COVID-19 images. Dataset 2 consist of 1252 COVID-19 and 1230 non-COVID-19 CT images. | The technique was evaluated on two datasets, and it achieved a classification accuracy of 99.33% and 99.7%, respectively. |
| Attallah [23] | ResNet50, ResNet101, ResNet18, discrete wavelet transform, and gray-level covariance matrix. | Dataset consist of 1252 COVID-19 and 1230 non-COVID-19 CT images. | Classification accuracy of 99.60%. |
| Zhao et al. [24] | Modified ResNet architecture | 194,922 CT images. | Classification accuracy: 99.2% |
| Shankar and Perumal [25] | Gaussian filtering, local binary pattern model, InceptionV3, MLP classifier. | X-ray dataset consisting of 27 normal, 220 COVID-19, 11 SARS, and 15 Pneumocystis X-ray images. | Classification accuracy: 94.08% |
| Marios et al. [26] | Performance analysis of ResNet50, ResNet101, DenseNet121, DenseNet169, and InceptionV3. | 11,956 COVID-19, 10,701 normal, and 11,263 pneumonia X-ray images. | ResNet101 achieved the best classification accuracy of 96%. |
3. Methodology
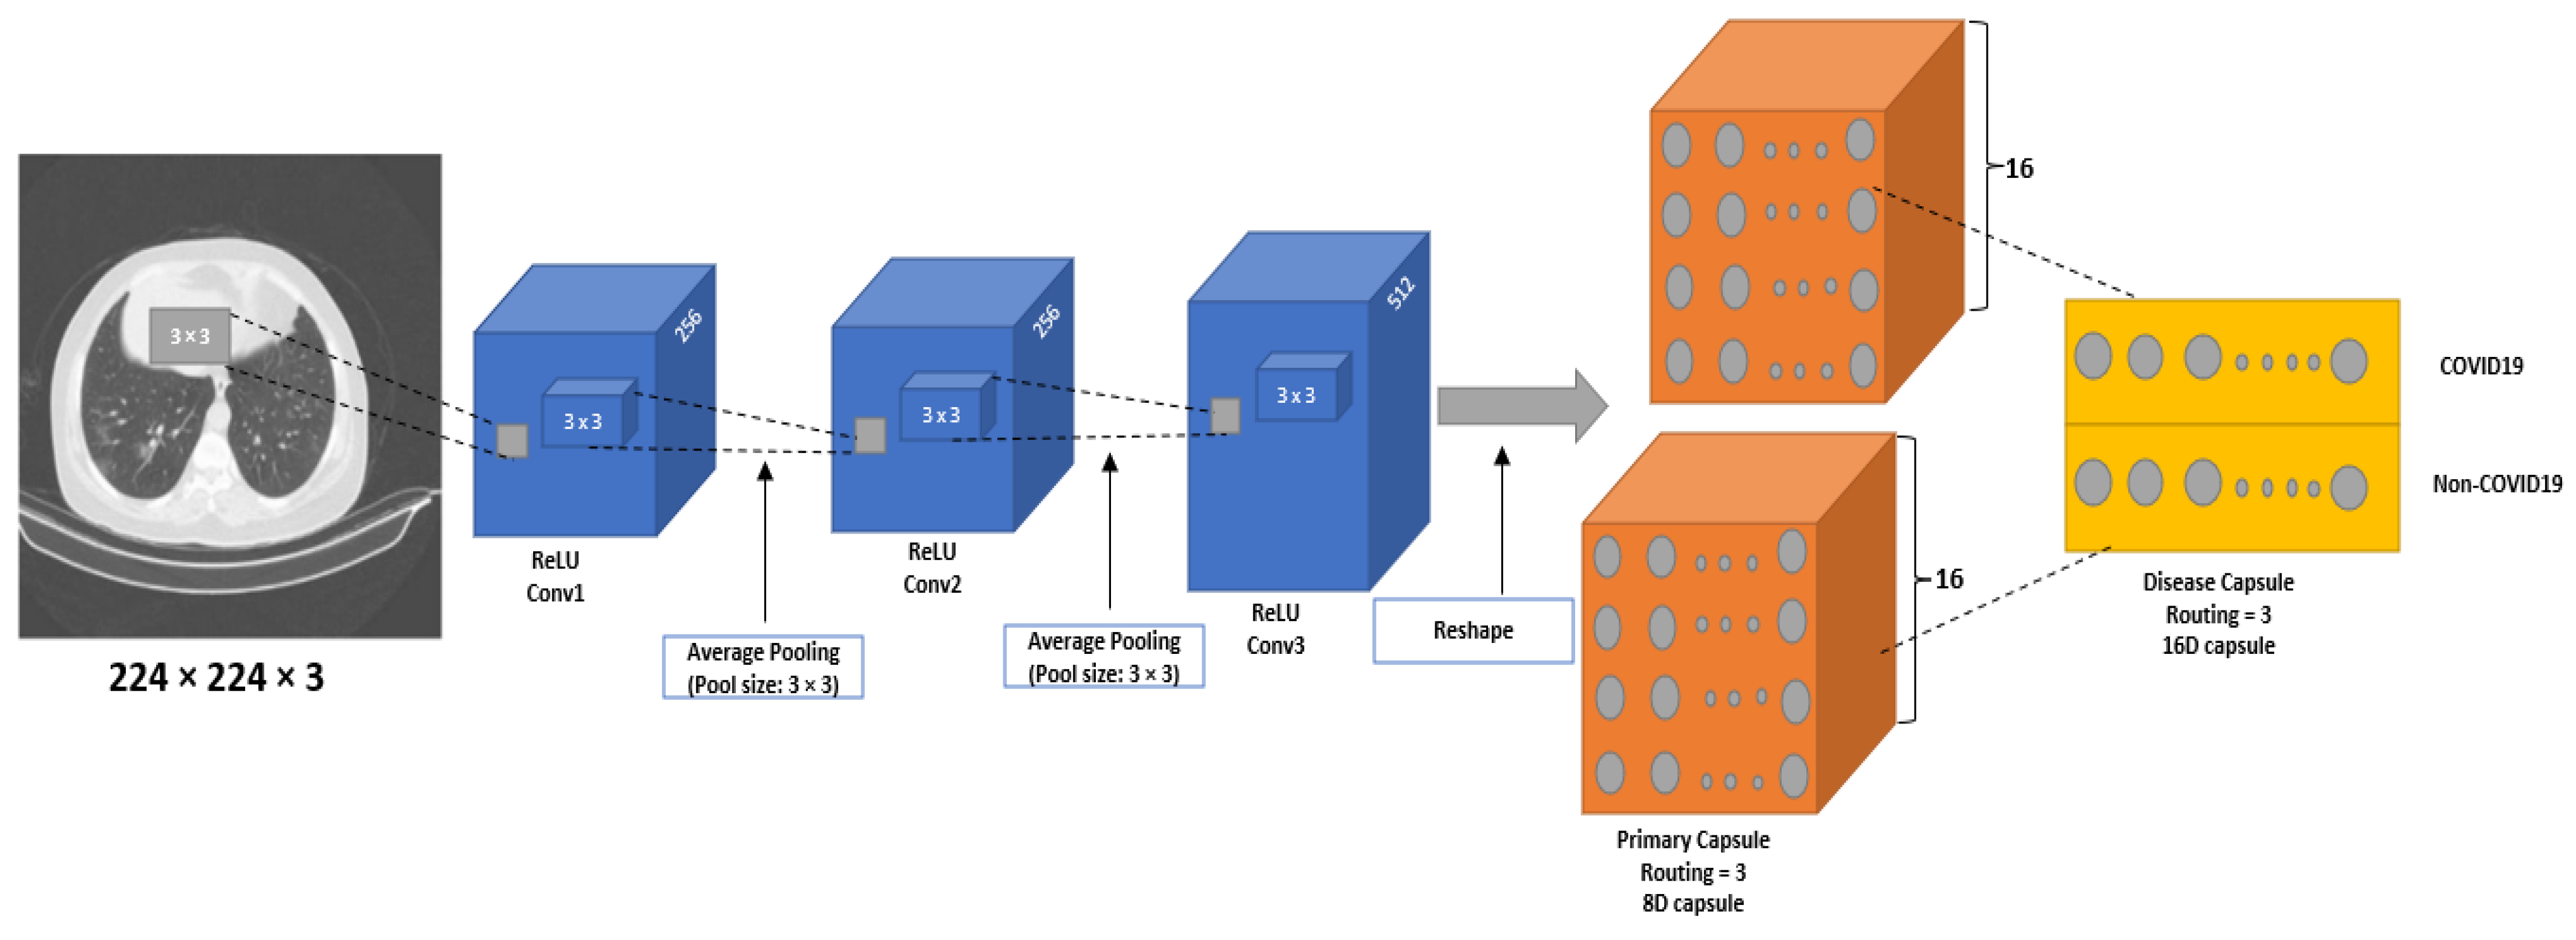
This study proposes a CapsNet architecture for COVID-19 diagnosis (CapsNetCovid). The architecture is shown in
Figure 1. The same model was used for the CT and X-ray images. The model consists of convolutional layer, primary capsule layer, and digit capsule layer. The convolutional layer is used to extract features from images, the primary capsule layer is used to learn different image parts and features of an image (such as orientation, size, pose, texture, etc.) and the spatial relationships between the parts. The digit capsule layer is used to perform the final classification.
Specifically, the proposed model consists of three convolutional layers, sixteen primary capsule layers, and one digit capsule layer. Three convolutional layers were added to the network after performing experiments with different number of layers, kernels, and filter sizes. The convolutional layers help to extract effective and informed features for the primary capsule. The first and second convolutional layer consists of 256 kernels of size 3 × 3 with a stride of 1. The third convolutional layer consist of 512 kernels of size 3 × 3 with a stride of 2. The ReLU activation function is used for all the layers. The ReLU activation function is used to introduce non-linearity to the model and handle the vanishing gradient problem.
Initially, images are passed through the three convolutional layers. The images are resized to 224 × 224 after experimenting with different image sizes. The output from the convolutional layer is passed to 16 primary capsule layers, where each capsule contains 8D vectors. The capsule layer applies convolutional operation with 9 × 9 kernel, and then squash the output to obtain a capsule. The output of the capsule layer is passed to a digit layer, containing 16D vectors per class. The layer is used to classify the CT images into two classes (COVID-19 and normal) and the X-ray images into three classes (COVID-19, normal, and pneumonia).
Another CNN model was designed in this study for the purpose of comparison. The CNN model consists of two convolutional layers, one fully connected layer, and one output layer. The proposed architecture was also compared with DenseNet121 and ResNet50. The output of DenseNet121 and ResNet50 was passed through two fully connected layers, and one output layer. The output layer consists of two neurons for the binary classification, and three neurons for the multi-class classification. The pooling and dropout layer was also used to improve the computation speed and prevent overfitting. Note that only the added layers were finetuned. The number of layers and parameters for the CapsNet model, CNN model, and the two pre-trained models were selected after performing the series of experiments. More information about the parameters is presented in
Table 2,
Table 3 and
Table 4.
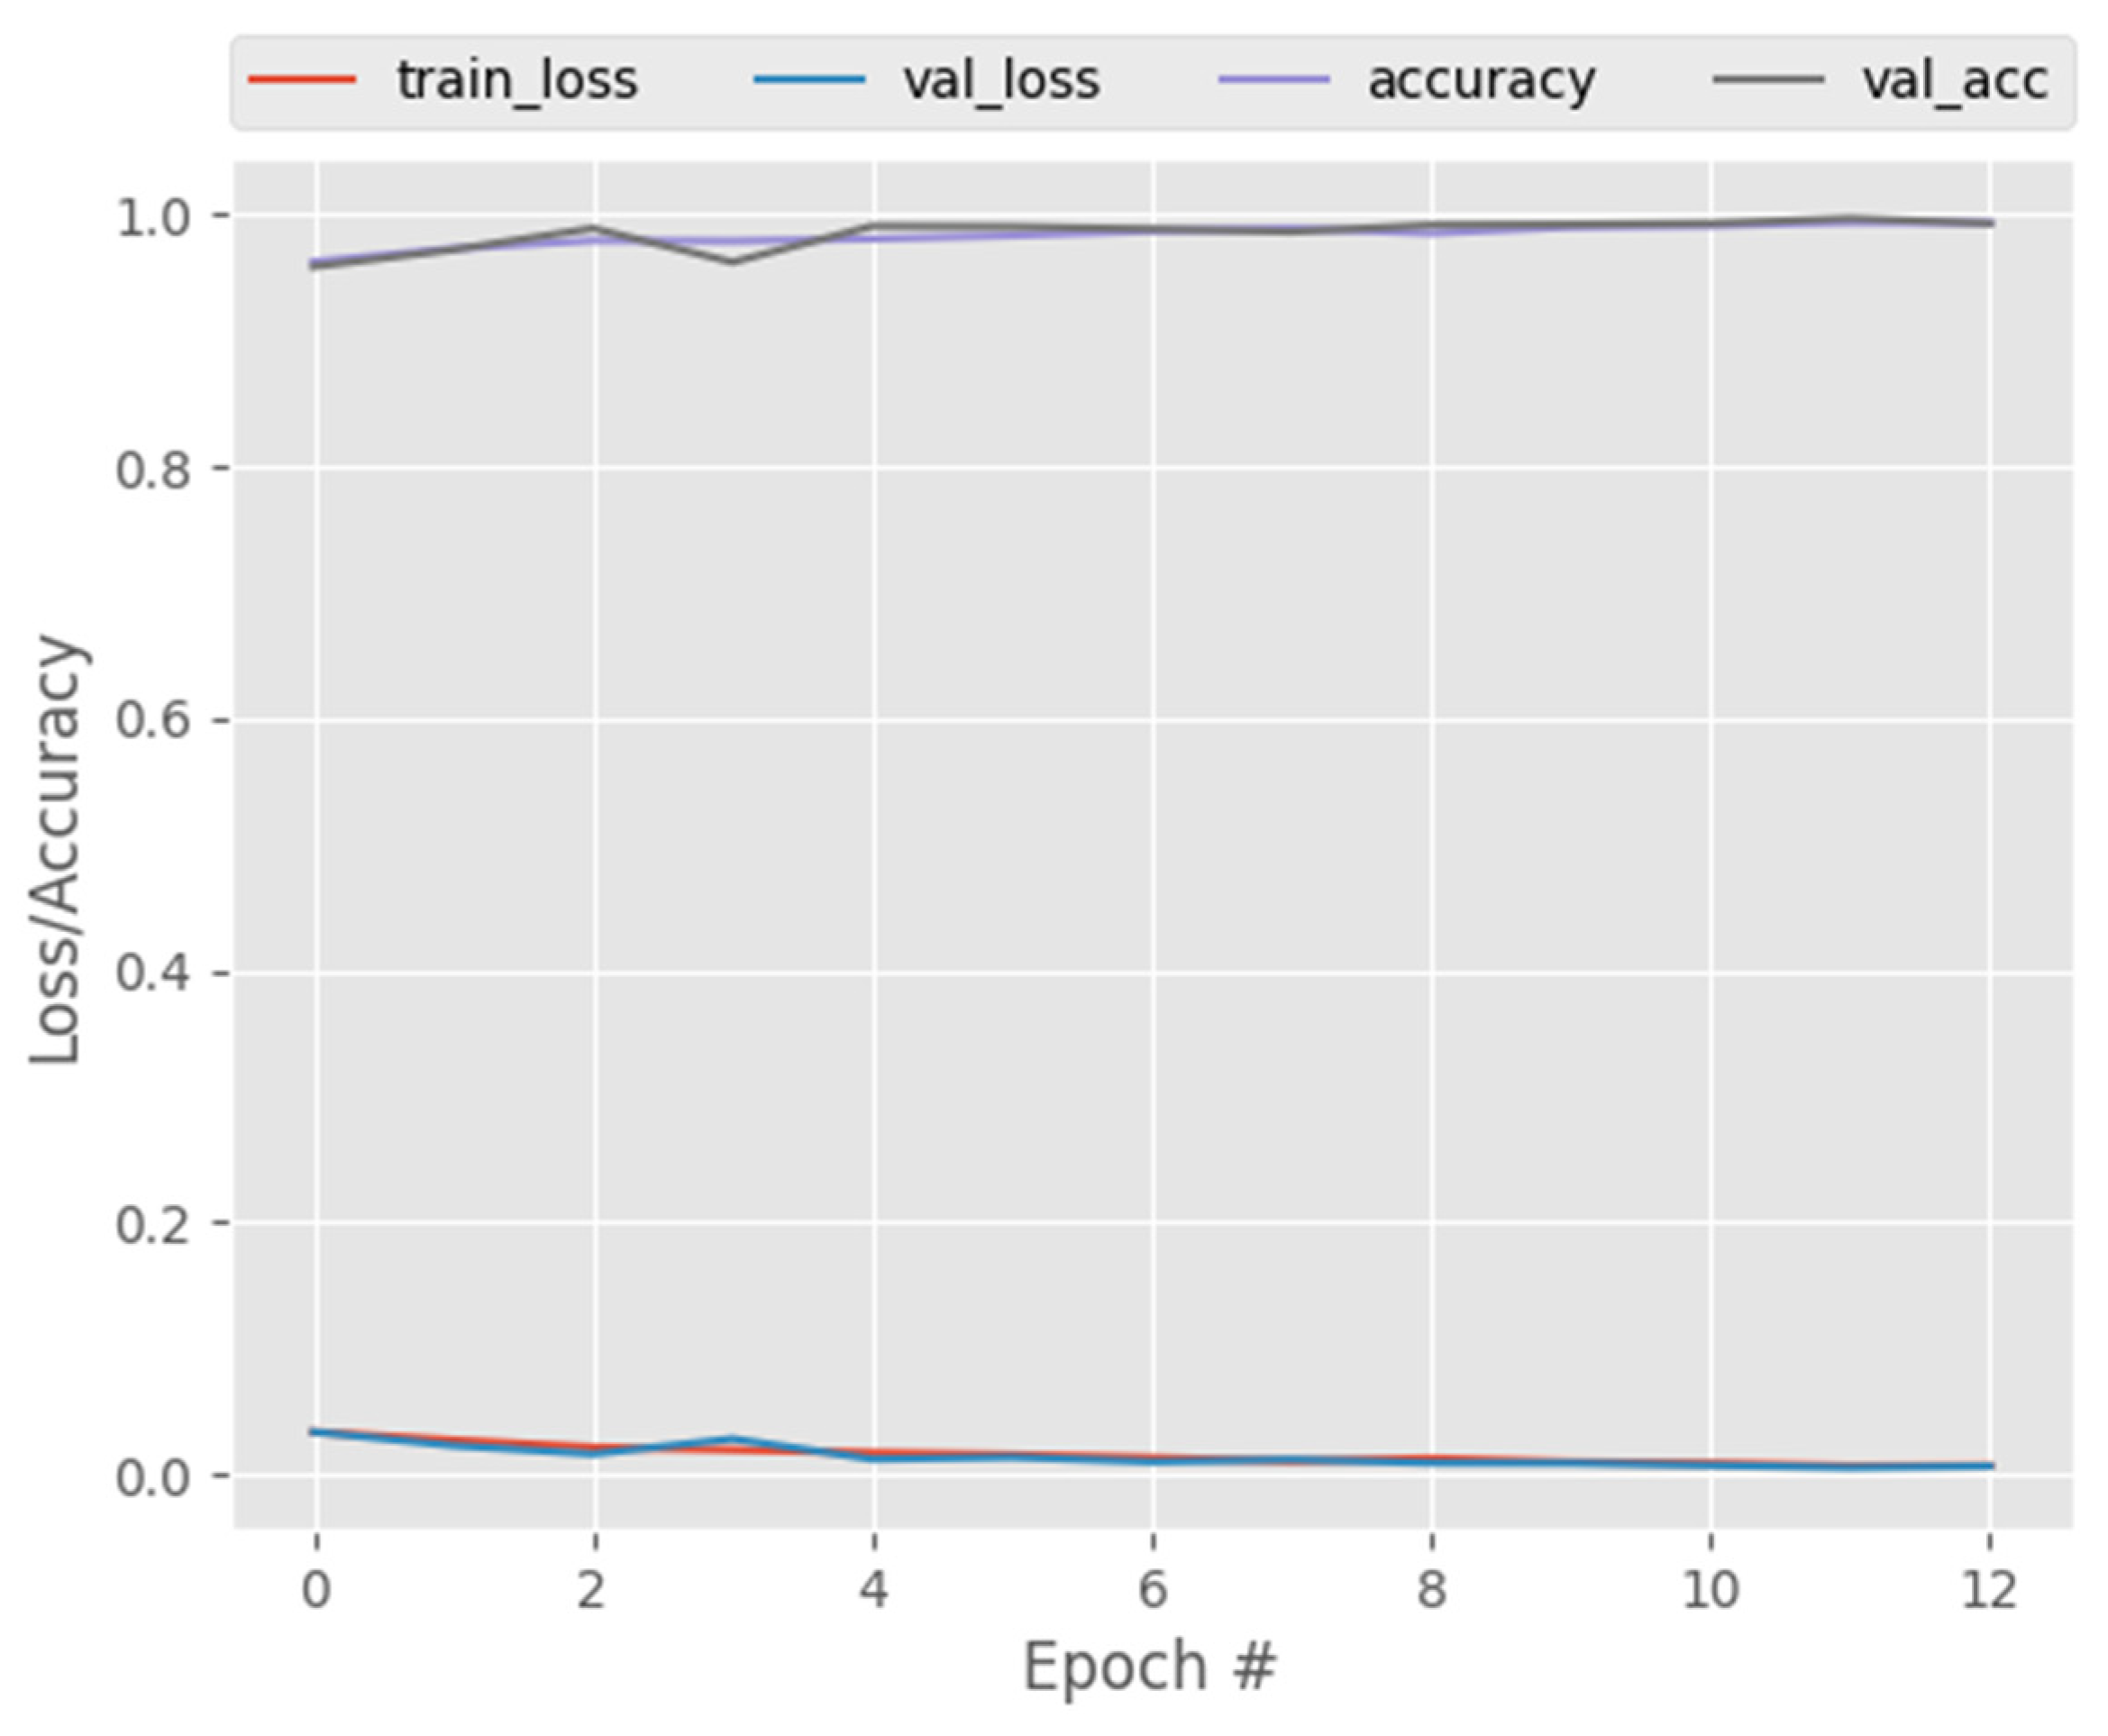
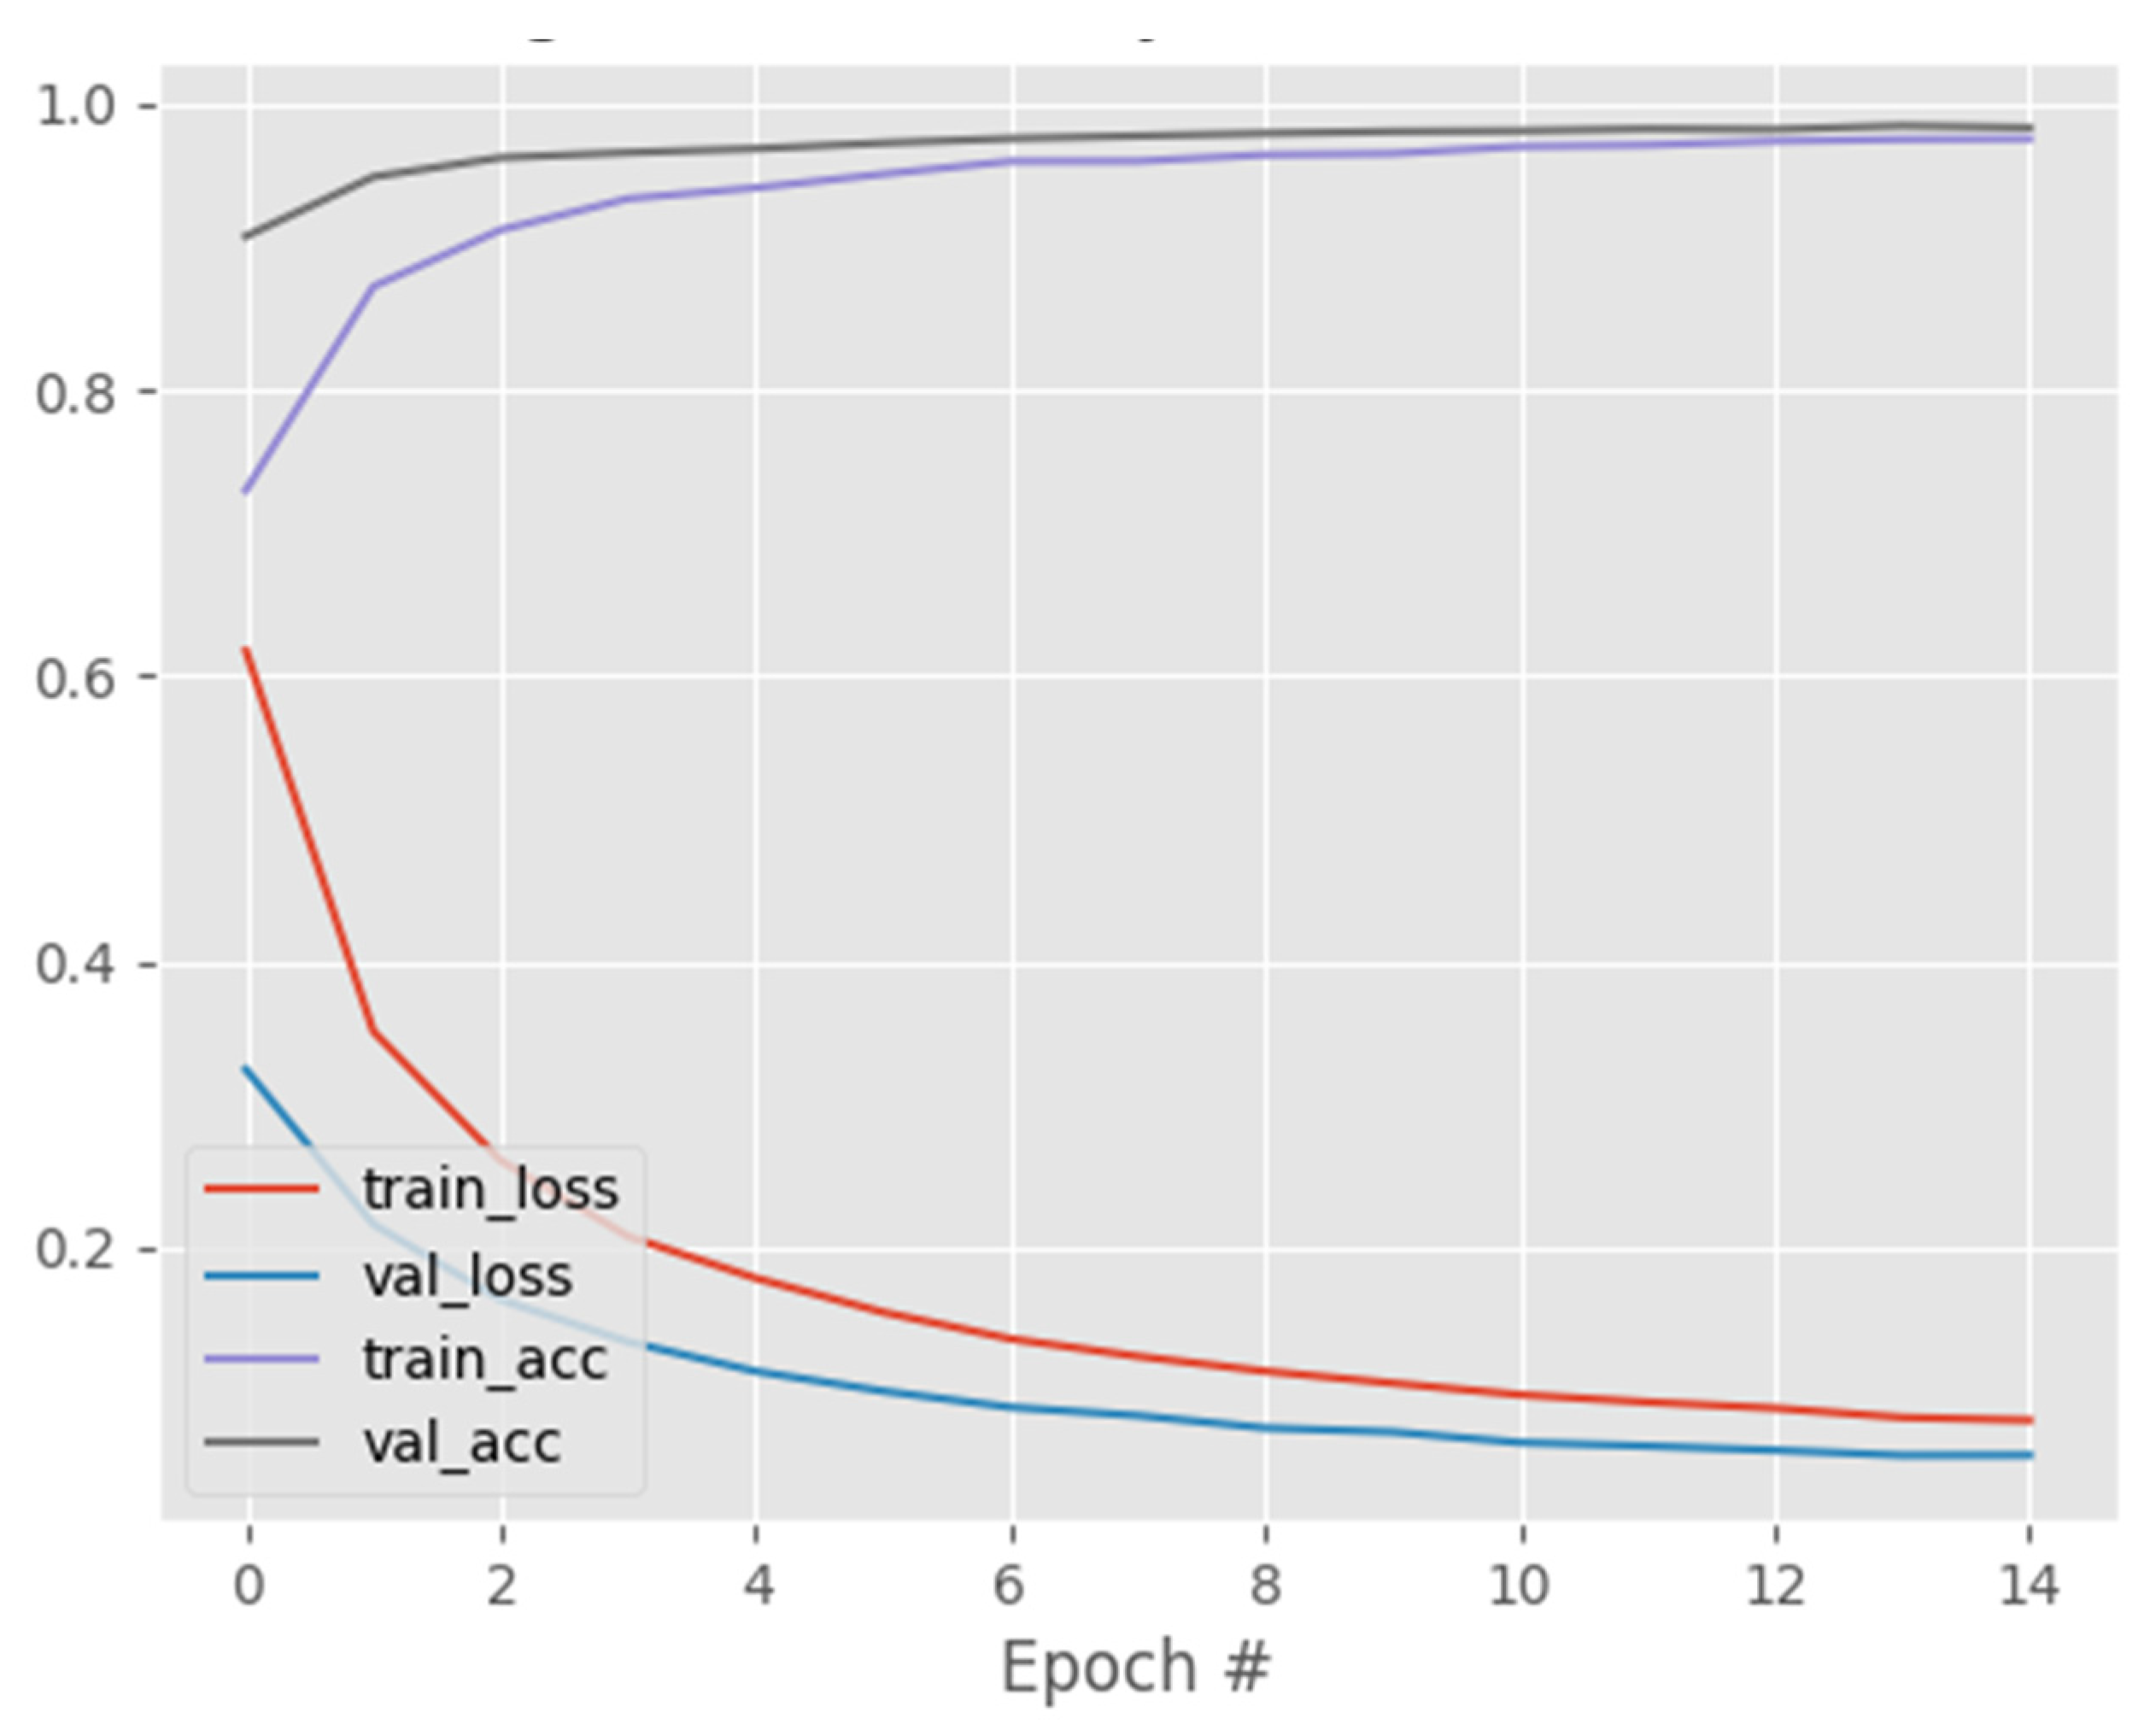
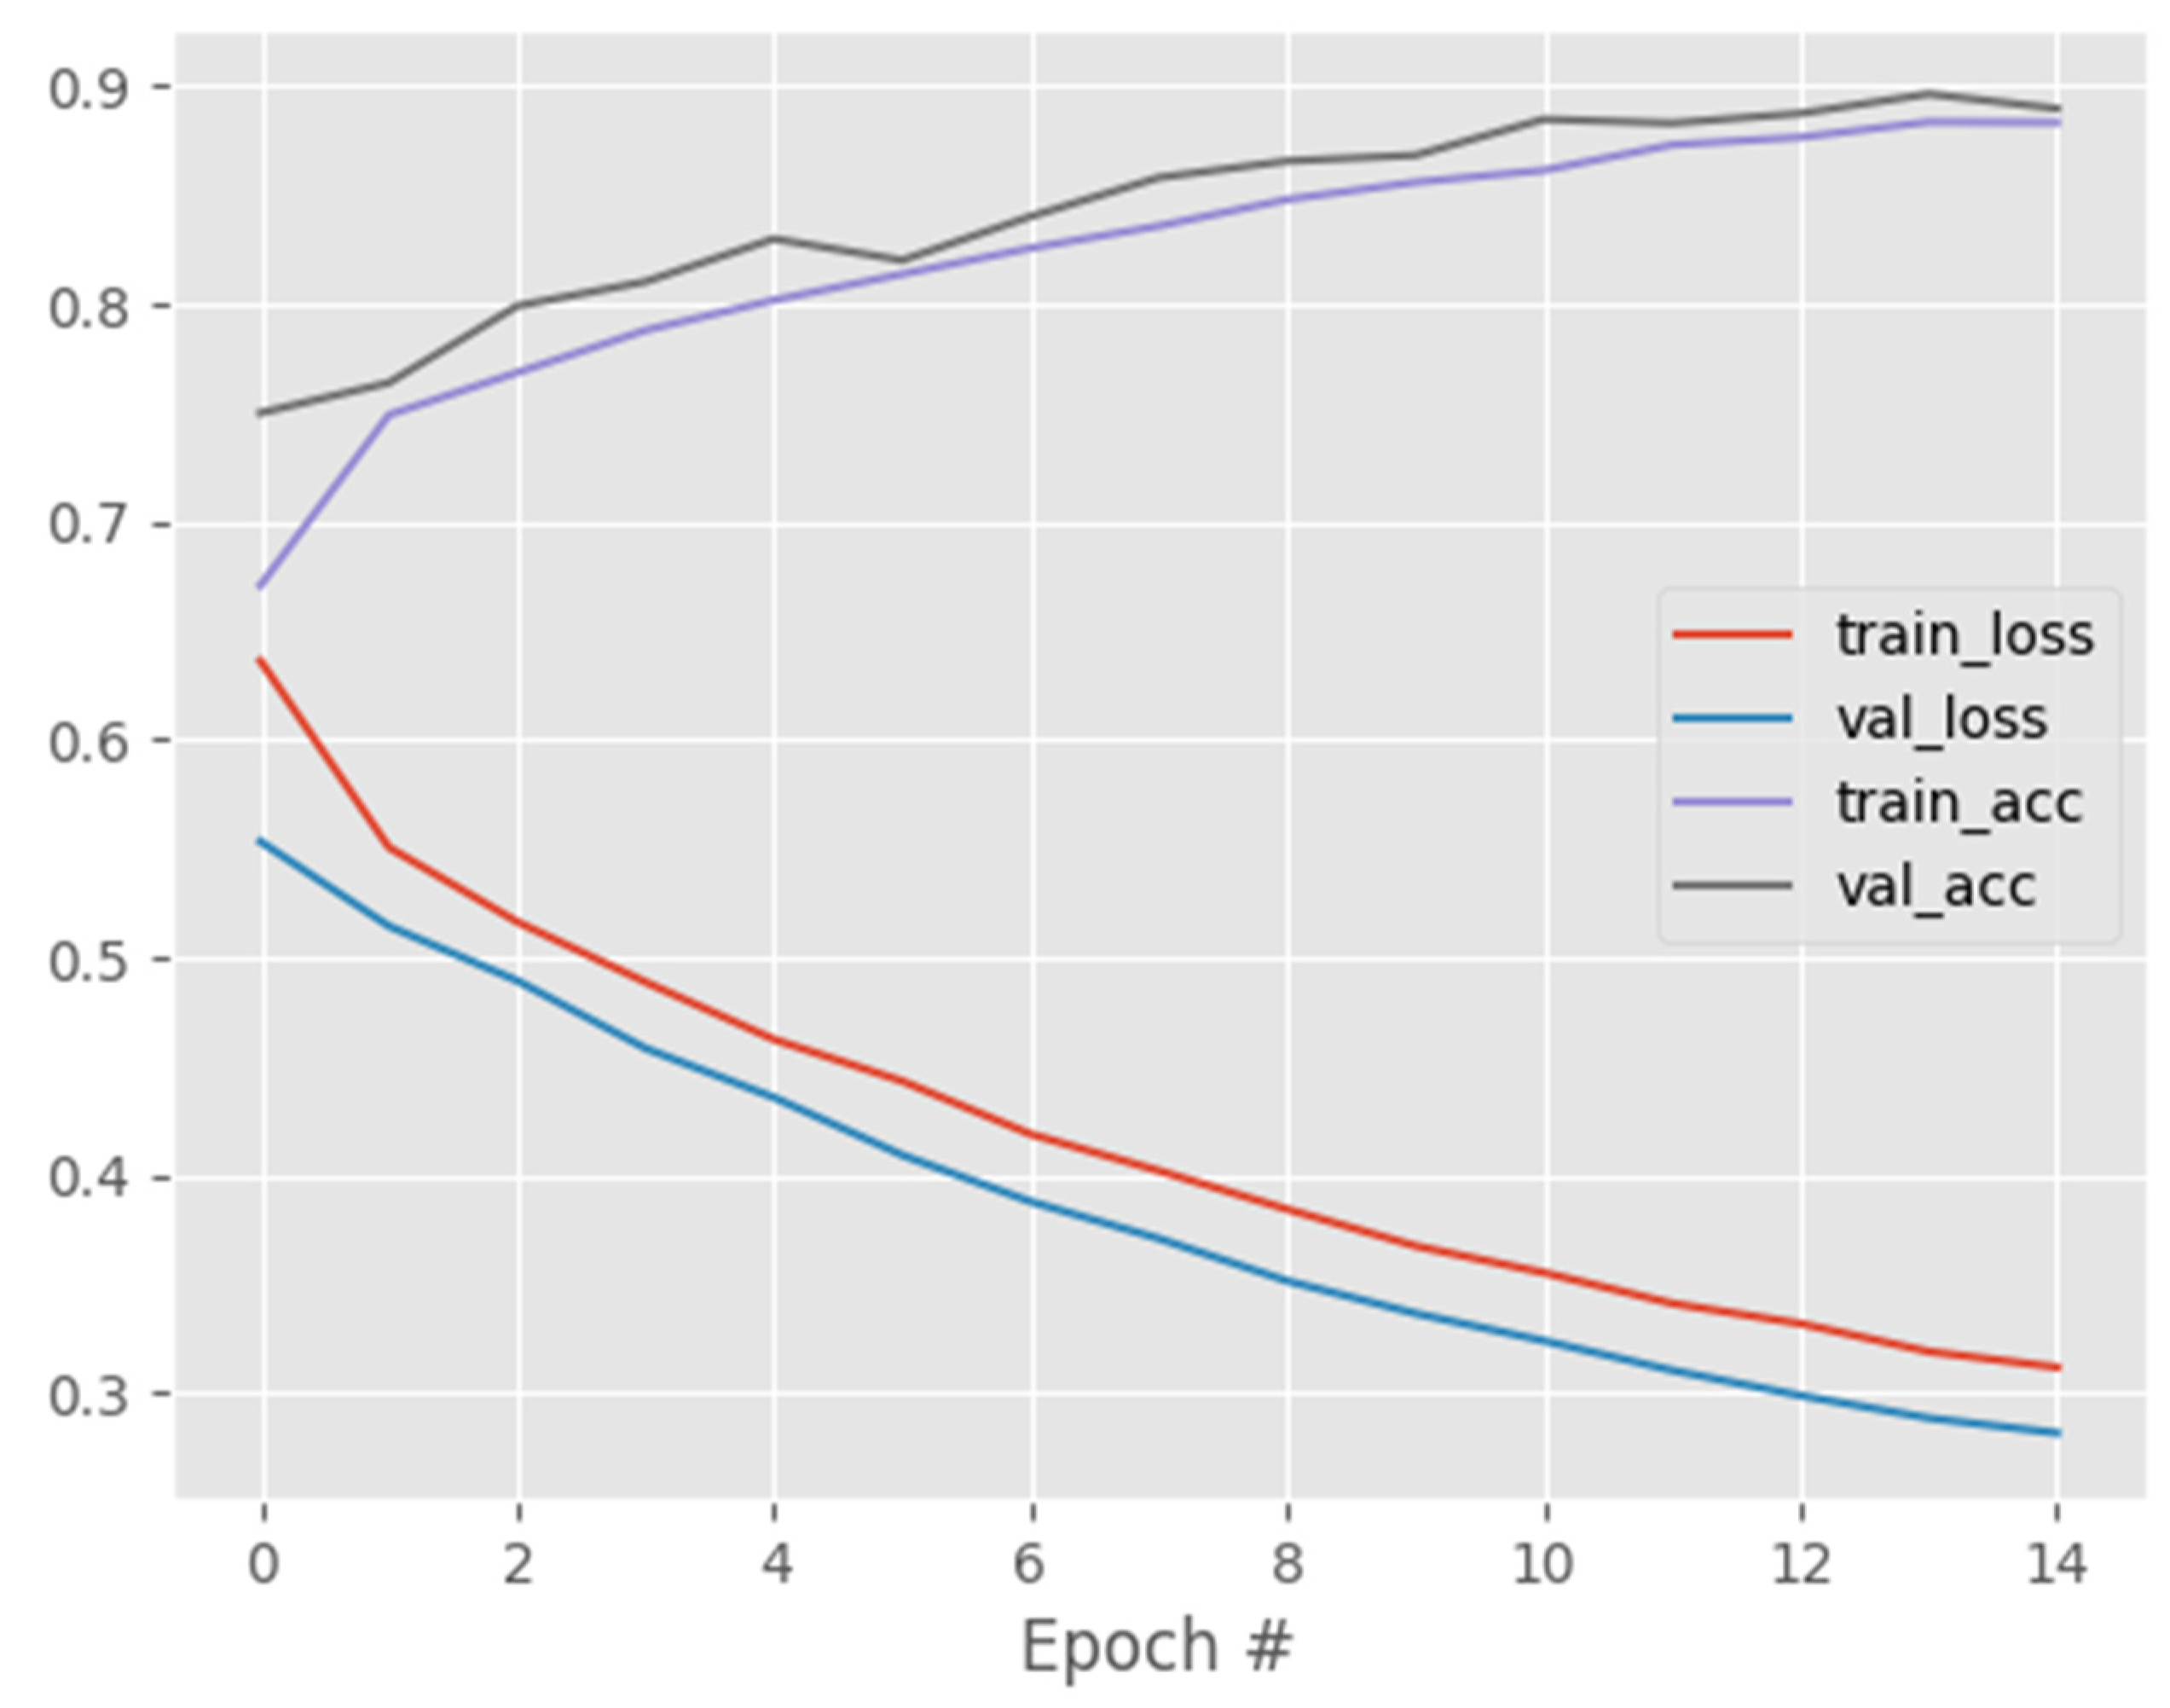
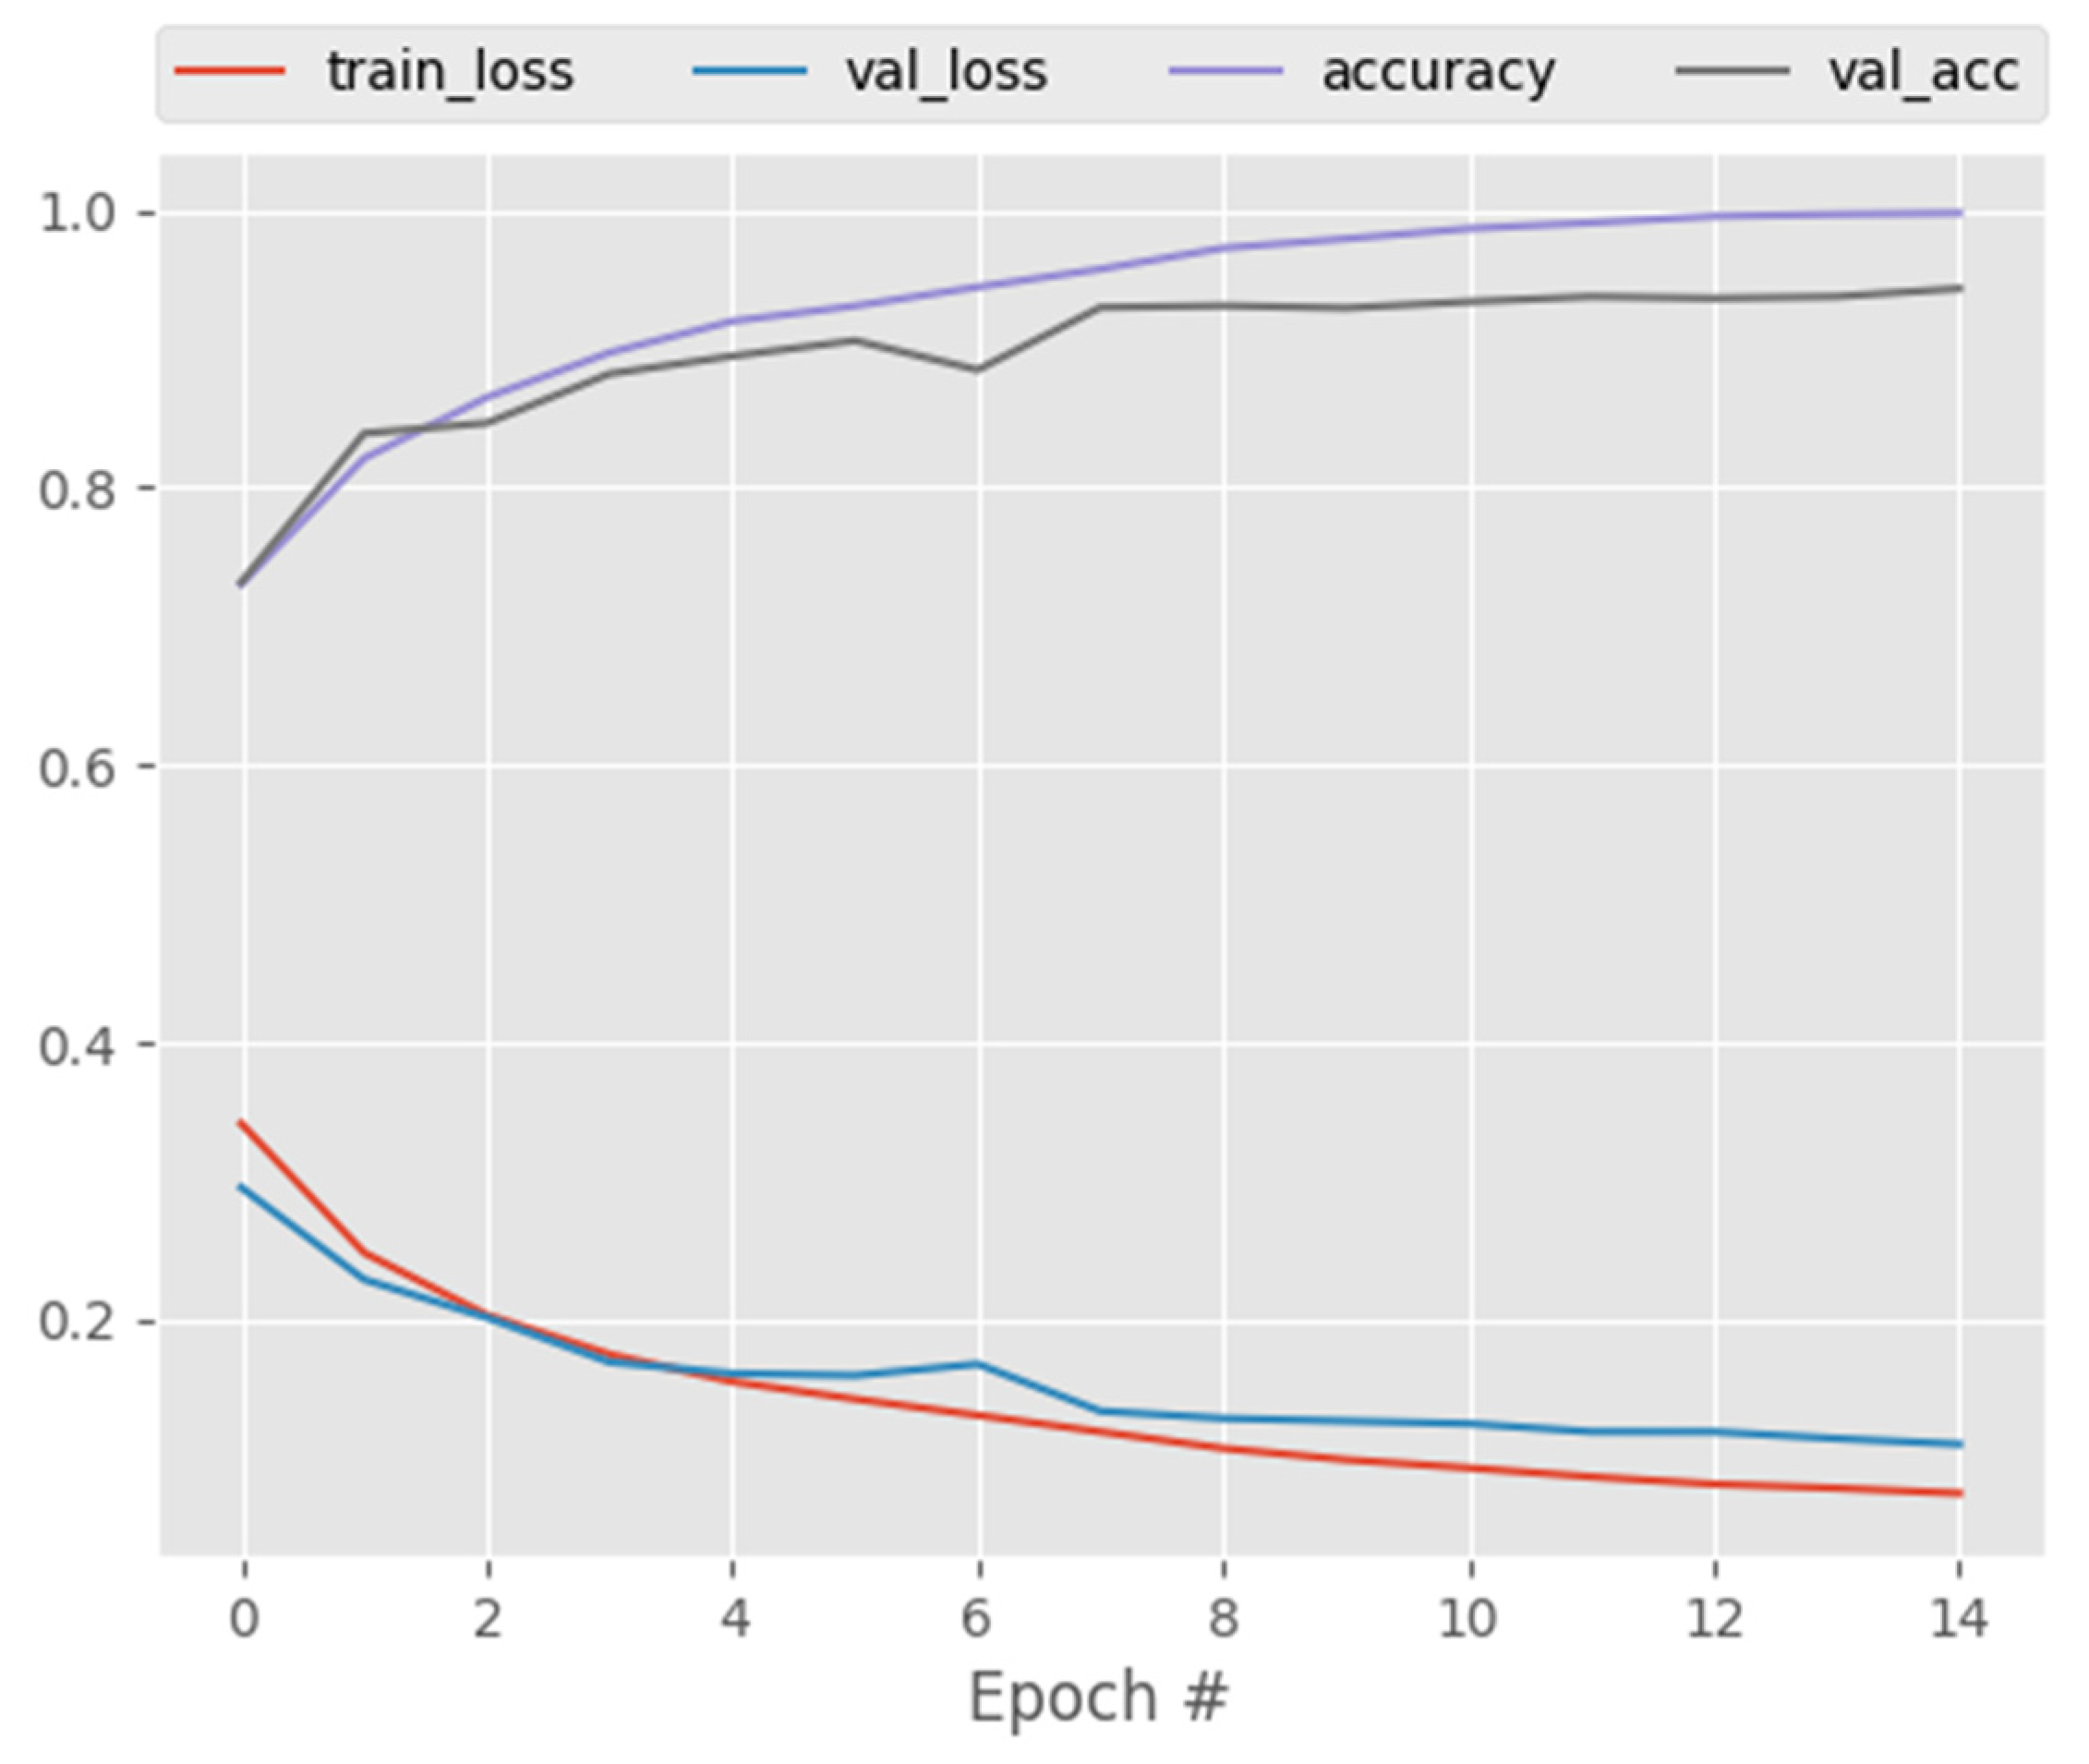
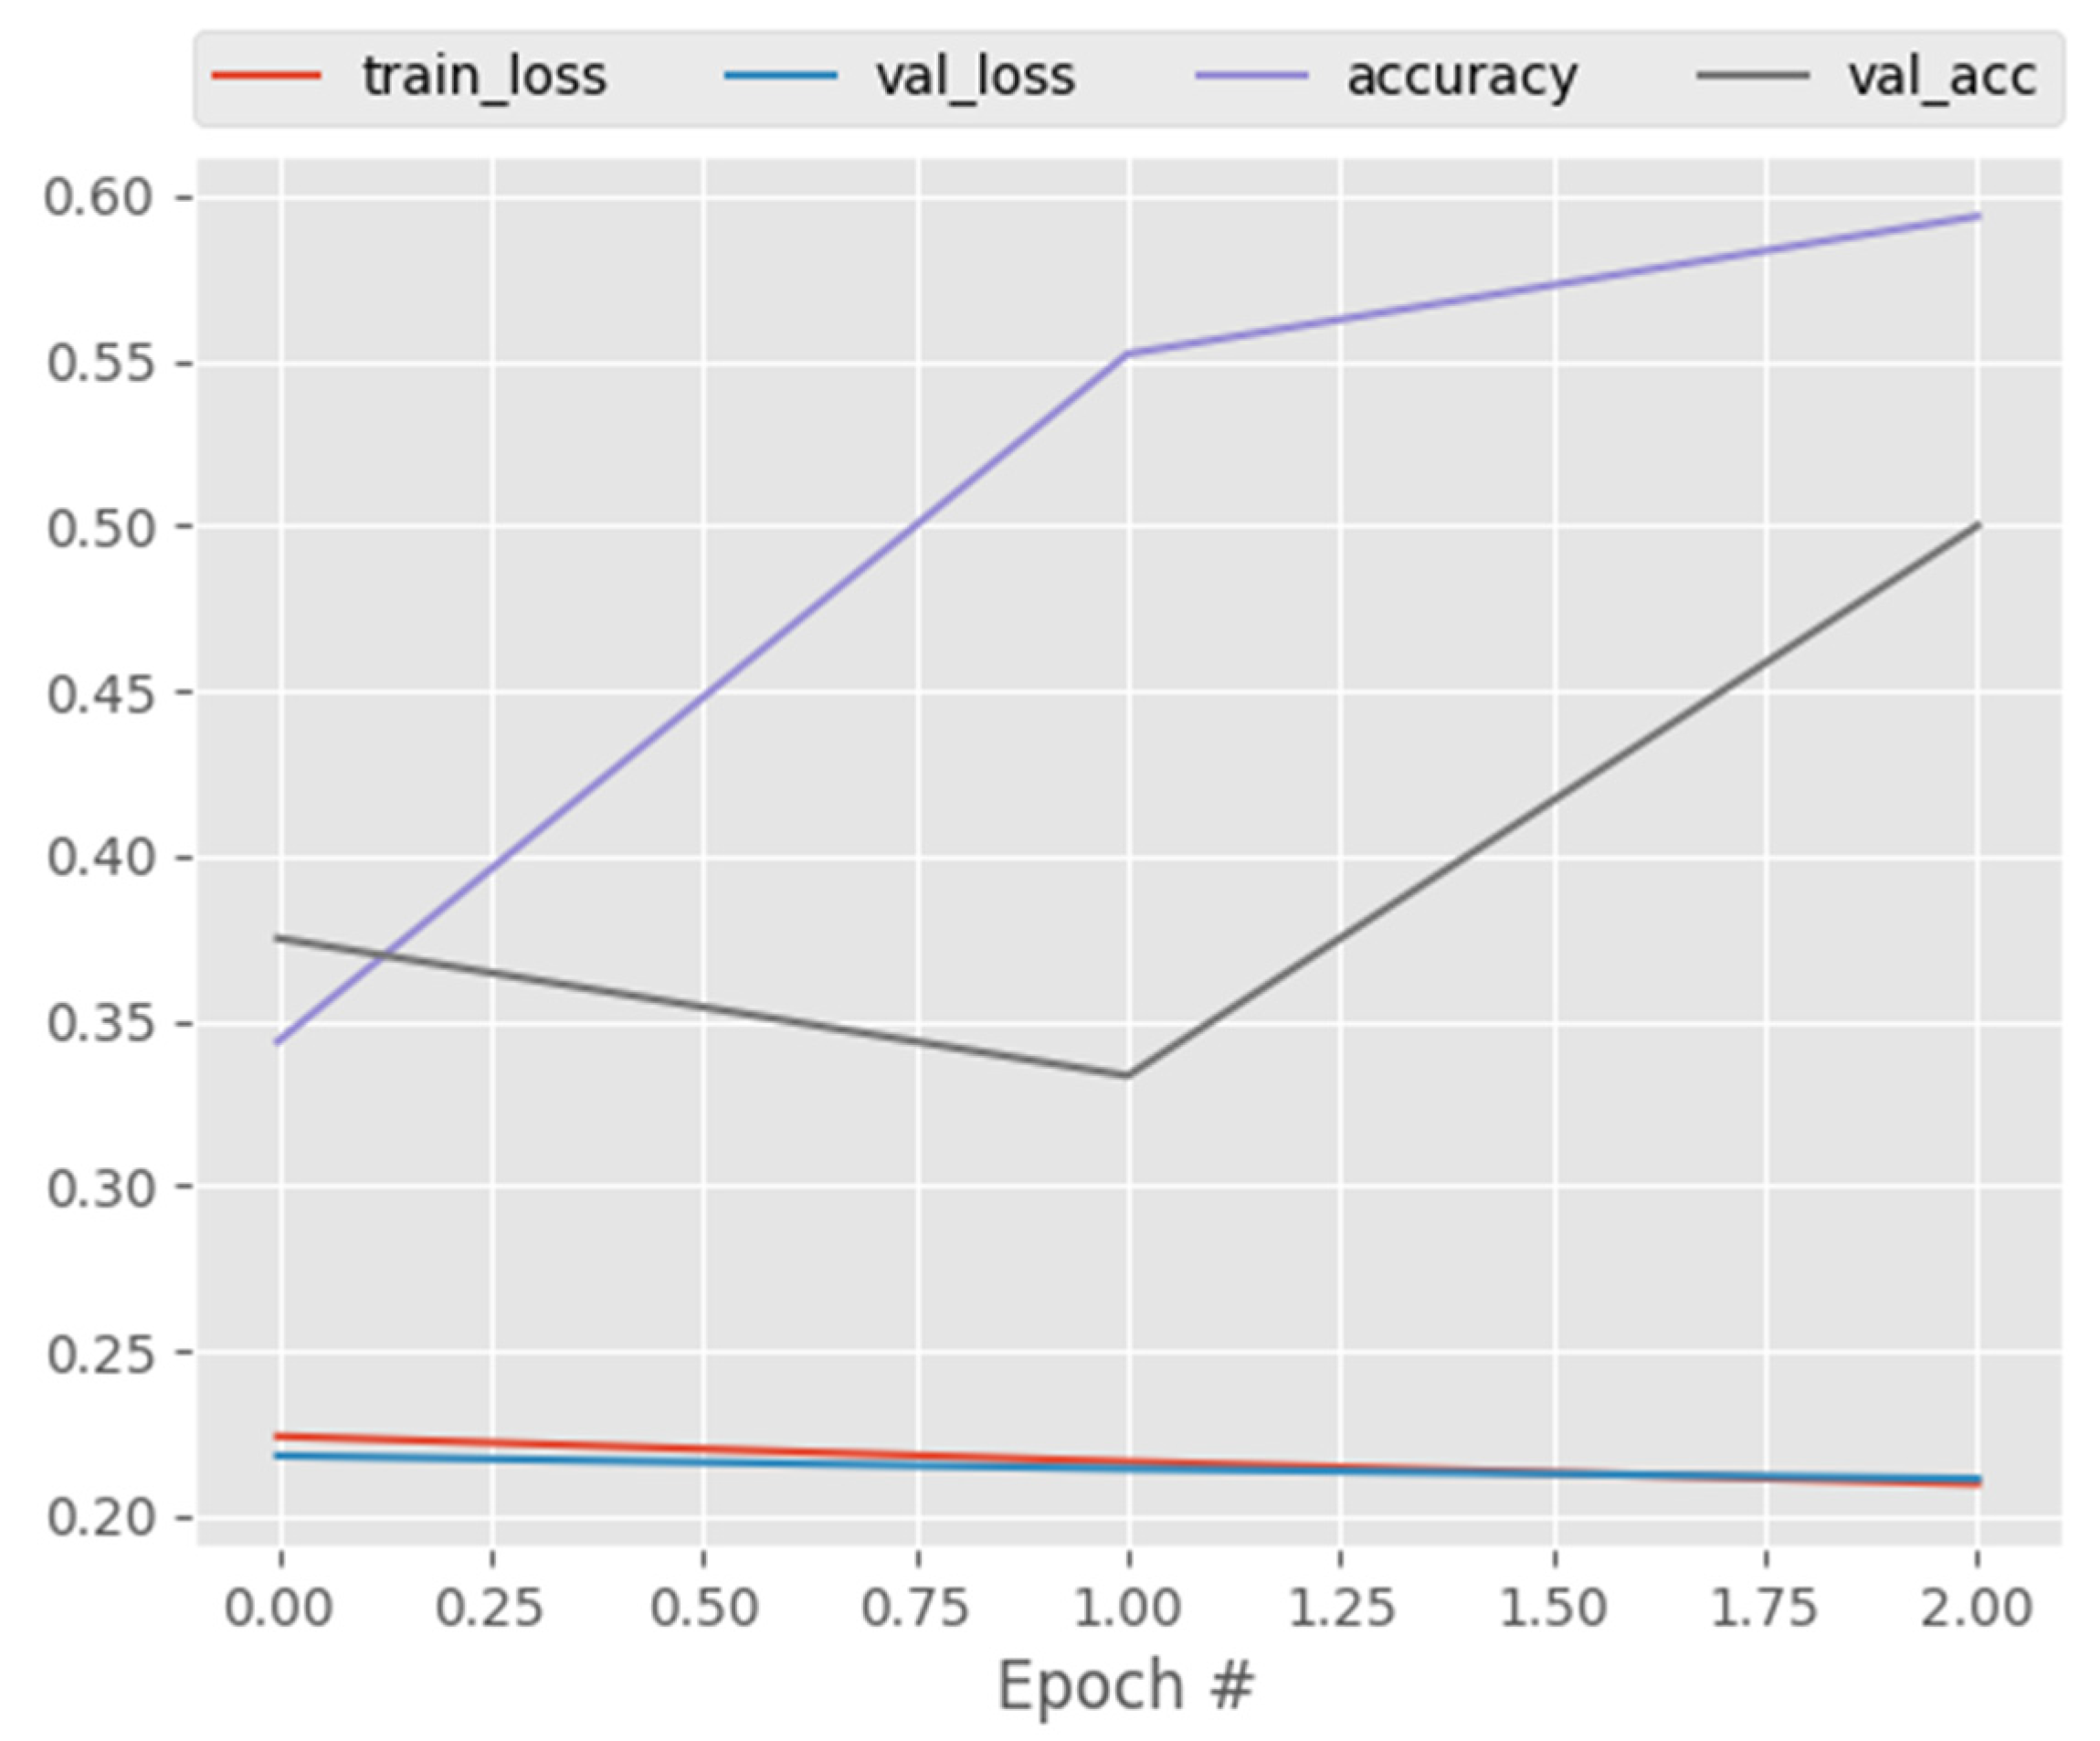
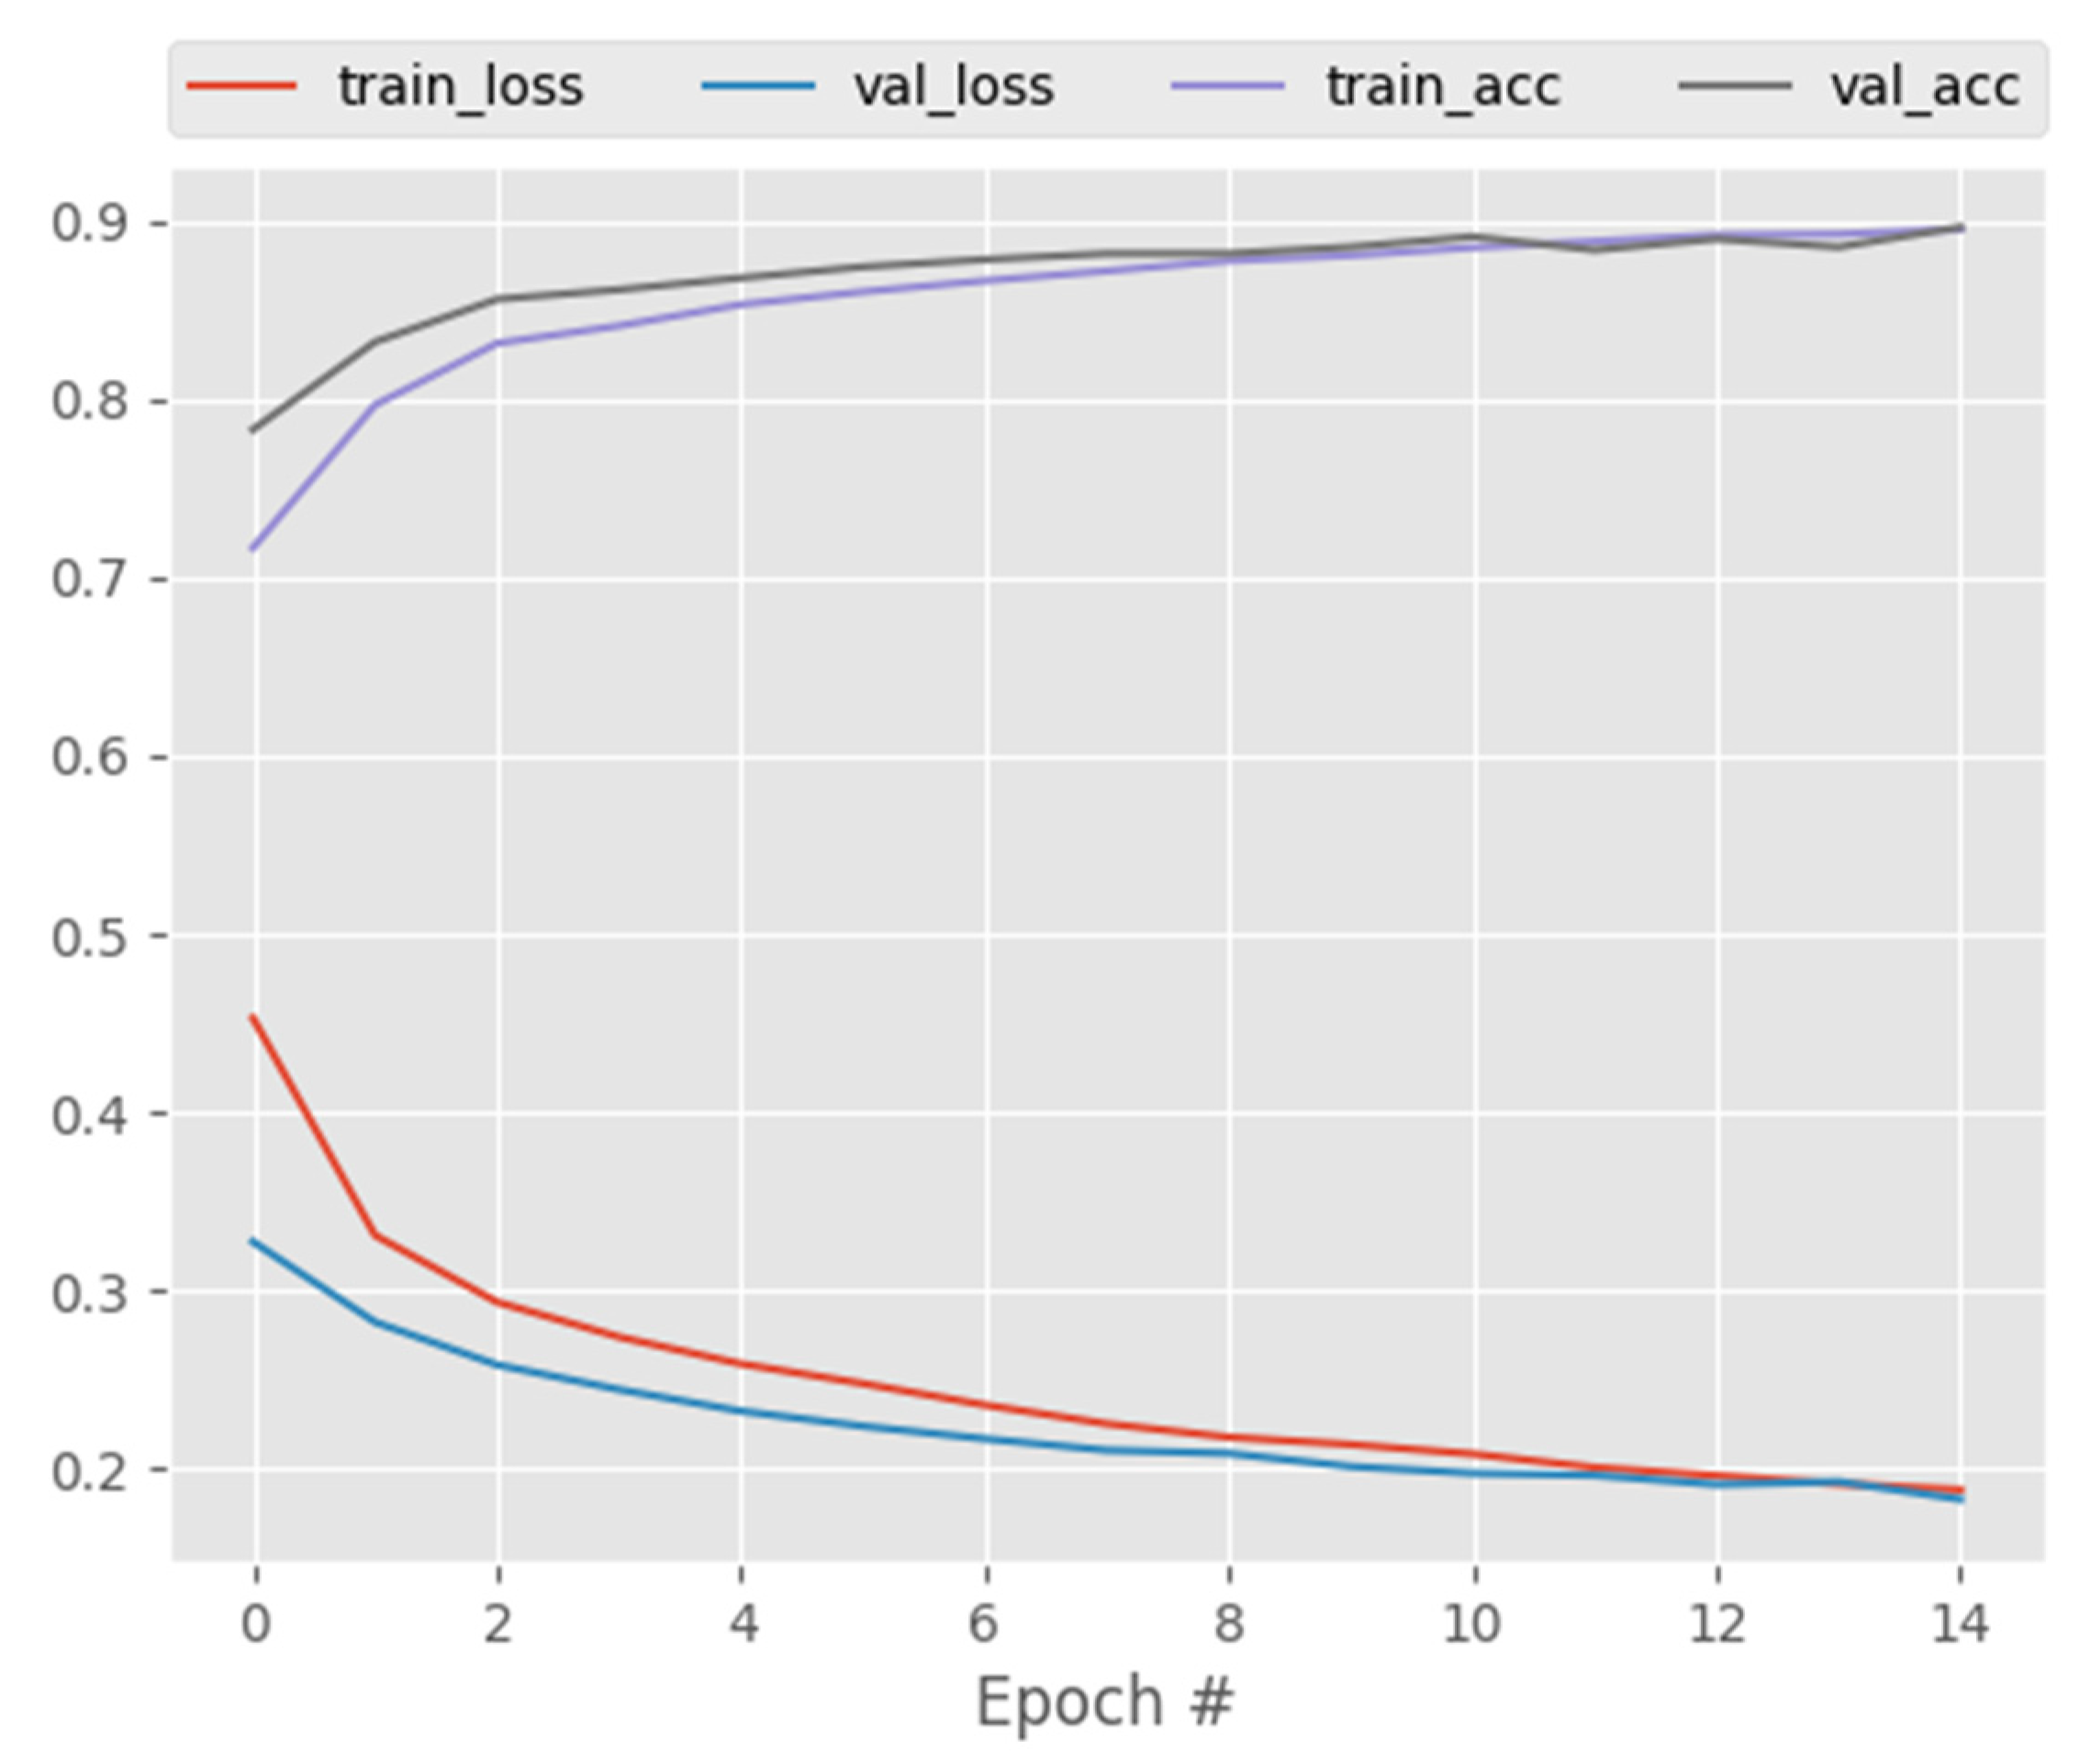
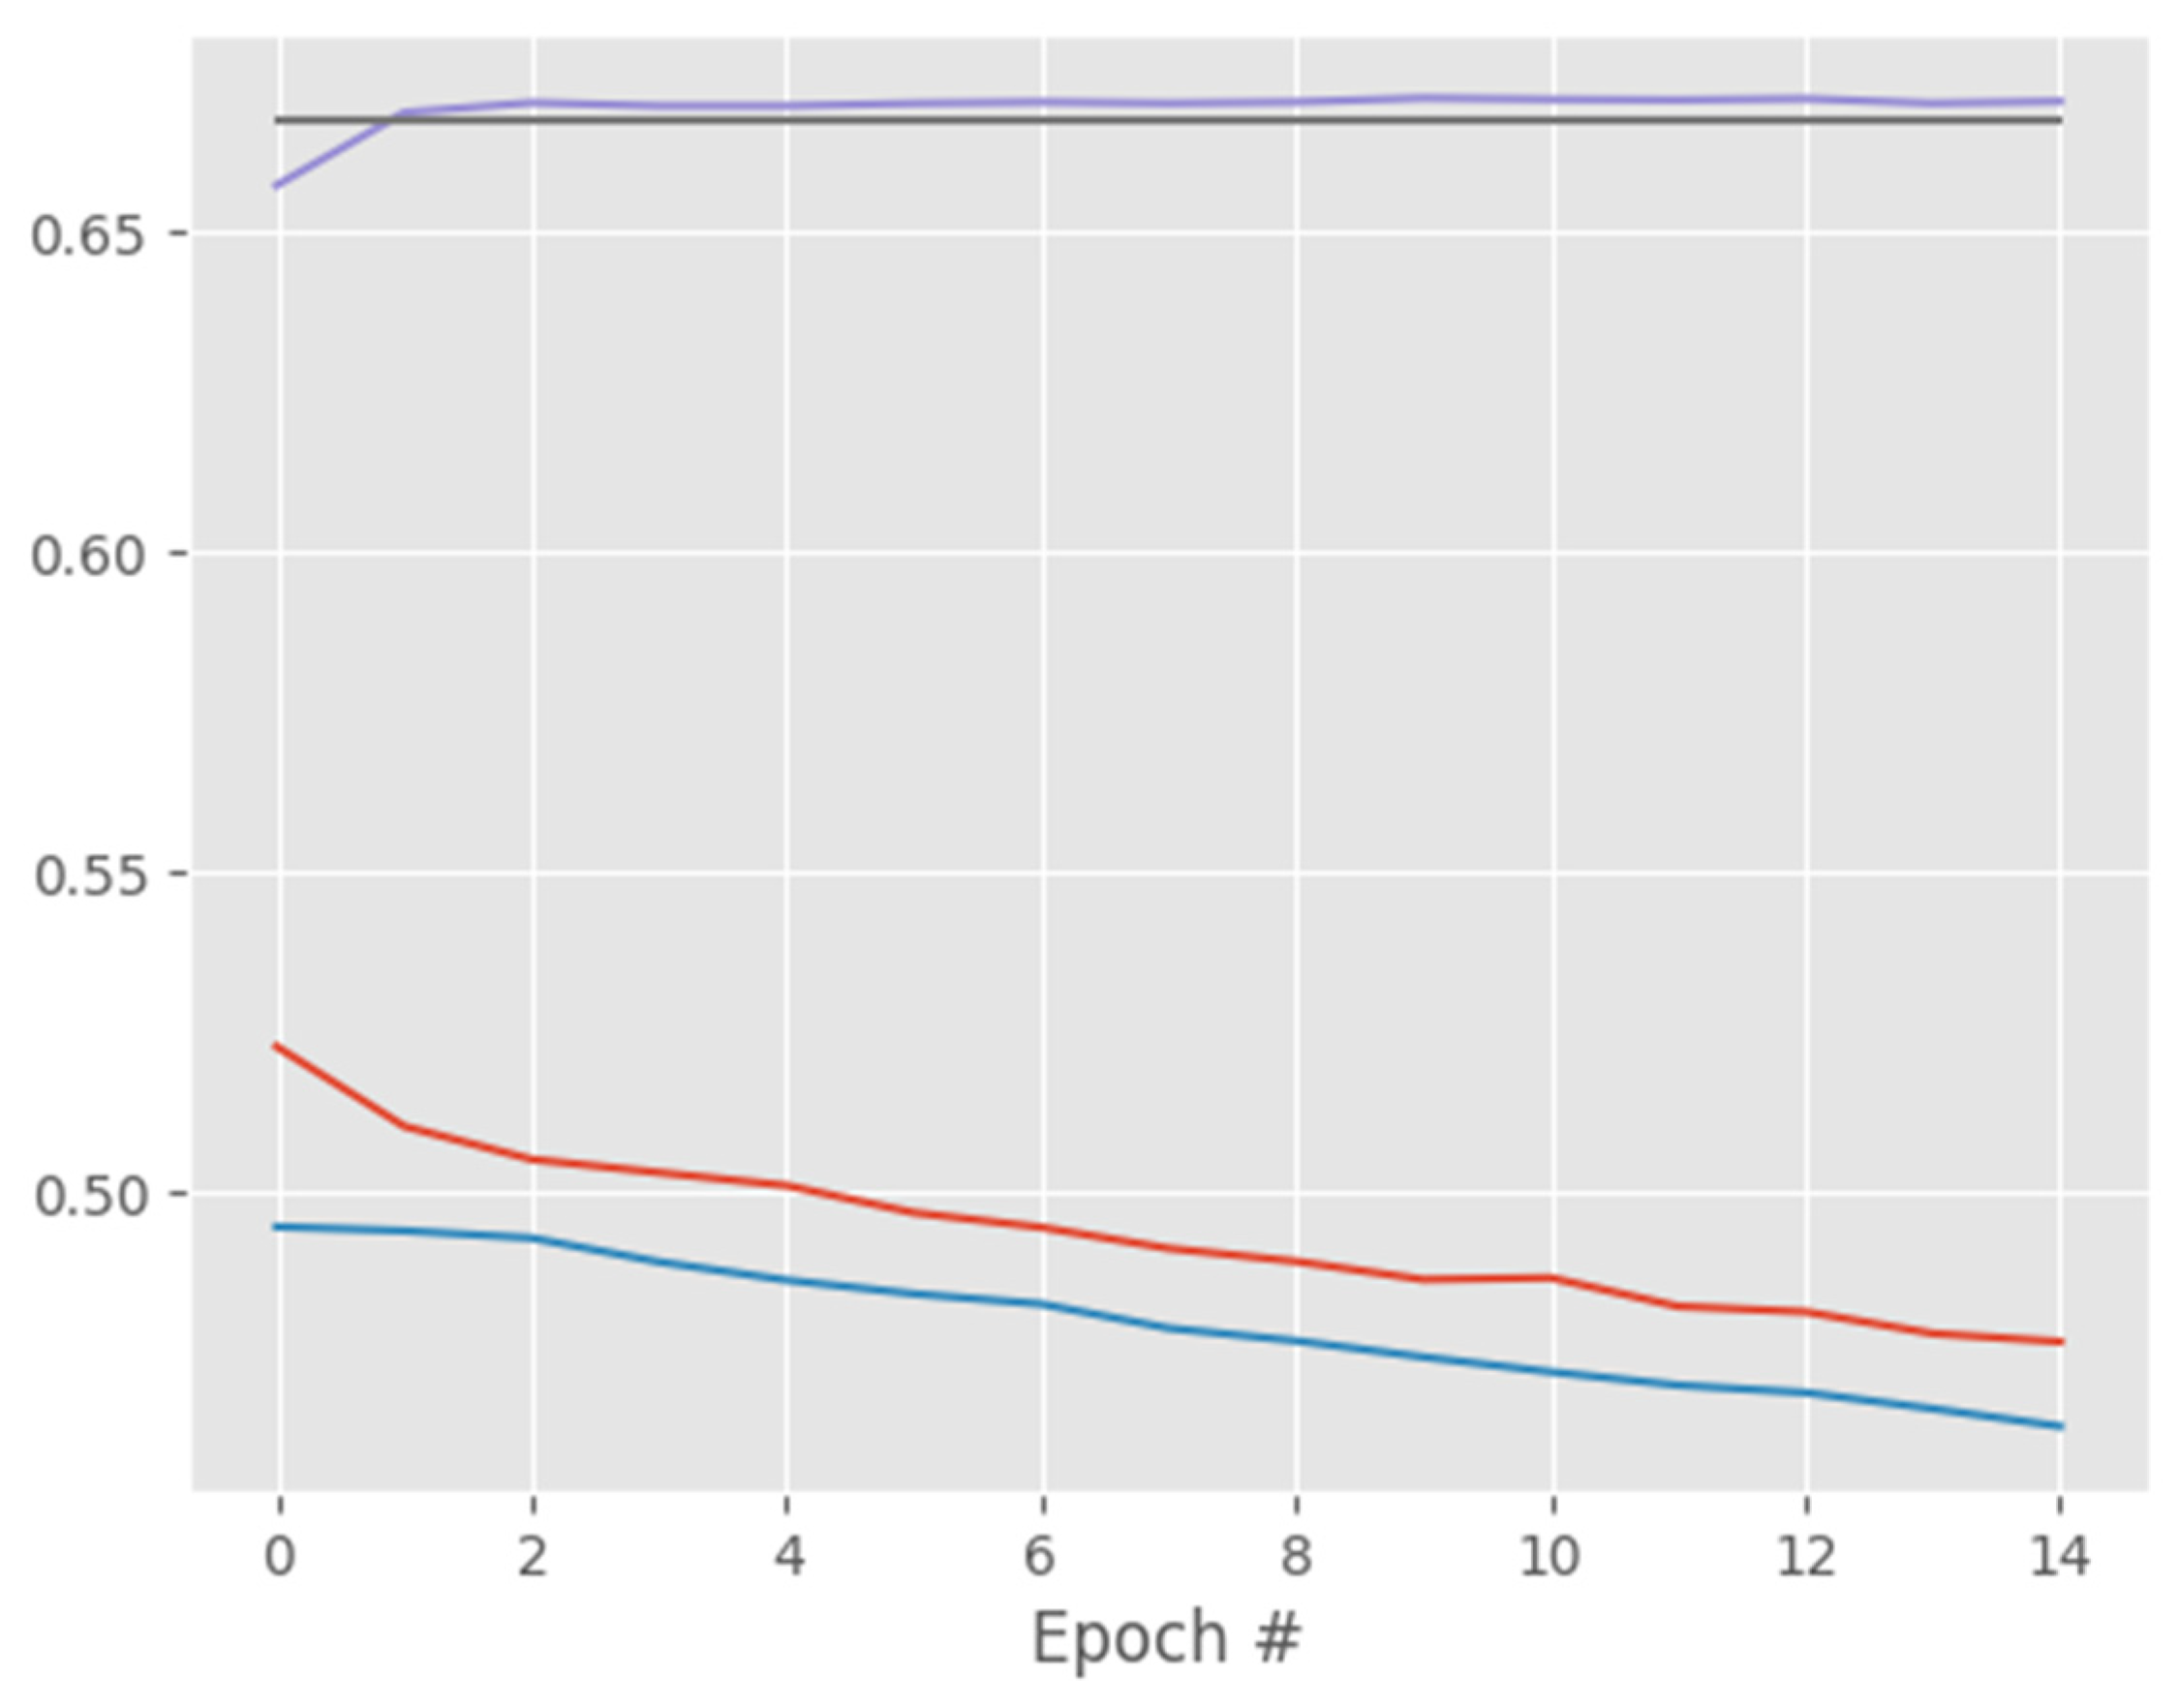
Different experiments were performed to evaluate the efficacy of CapsNetCovid. Firstly, CapsNetCovid was trained on 80% of the dataset and evaluated on the remaining 20%. Twenty percent of the training set was reserved for validation. After training, the trained CapsNetCovid was saved and used in the subsequent experiments. During the other experiments, the saved CapsNet model was evaluated on the eight augmented datasets. Note that the augmented datasets were not used to train CapsNetCovid; they were only used to evaluate the pre-trained CapsNetCovid. We did this to assess CapsNetCovid’s ability to distinguish precisely between standard, flipped, shifted, and rotated images. Additionally, we wanted to evaluate the CapsNet’s ability to recognize augmented images, even if it was not exposed to such images during training. The same procedure was carried out for CNN, DenseNet121, and ResNet50. The models were trained, validated, and tested on the original datasets. After training, their trained weights were saved and evaluated on the eight augmented datasets.
3.1. Dataset
Two types of datasets are used in this study. The first dataset type consists of standard images, while the second dataset type consists of augmented/transformed images. Standard images/datasets in this study refers to images/datasets that are not transformed (rotated or shifted).
3.1.1. Standard Dataset
Two datasets with standard images were used in this study. The first dataset was obtained from different sources, including China National Center for Bio-information [
31], National Institutes of Health Intramural Targeted Anti-COVID-19 [
32], Negin Radiology Medical Center [
33], Union Hospital and Liyuan Hospital of Huazhong University of Science and Technology [
34], COVID-19 CT Lung and Infection Segmentation initiative [
35], and the Radiopaedia collection [
36]. The dataset (called COVID-Net CT-2) was created by Gunraj et al. [
37]. Readers are referred to [
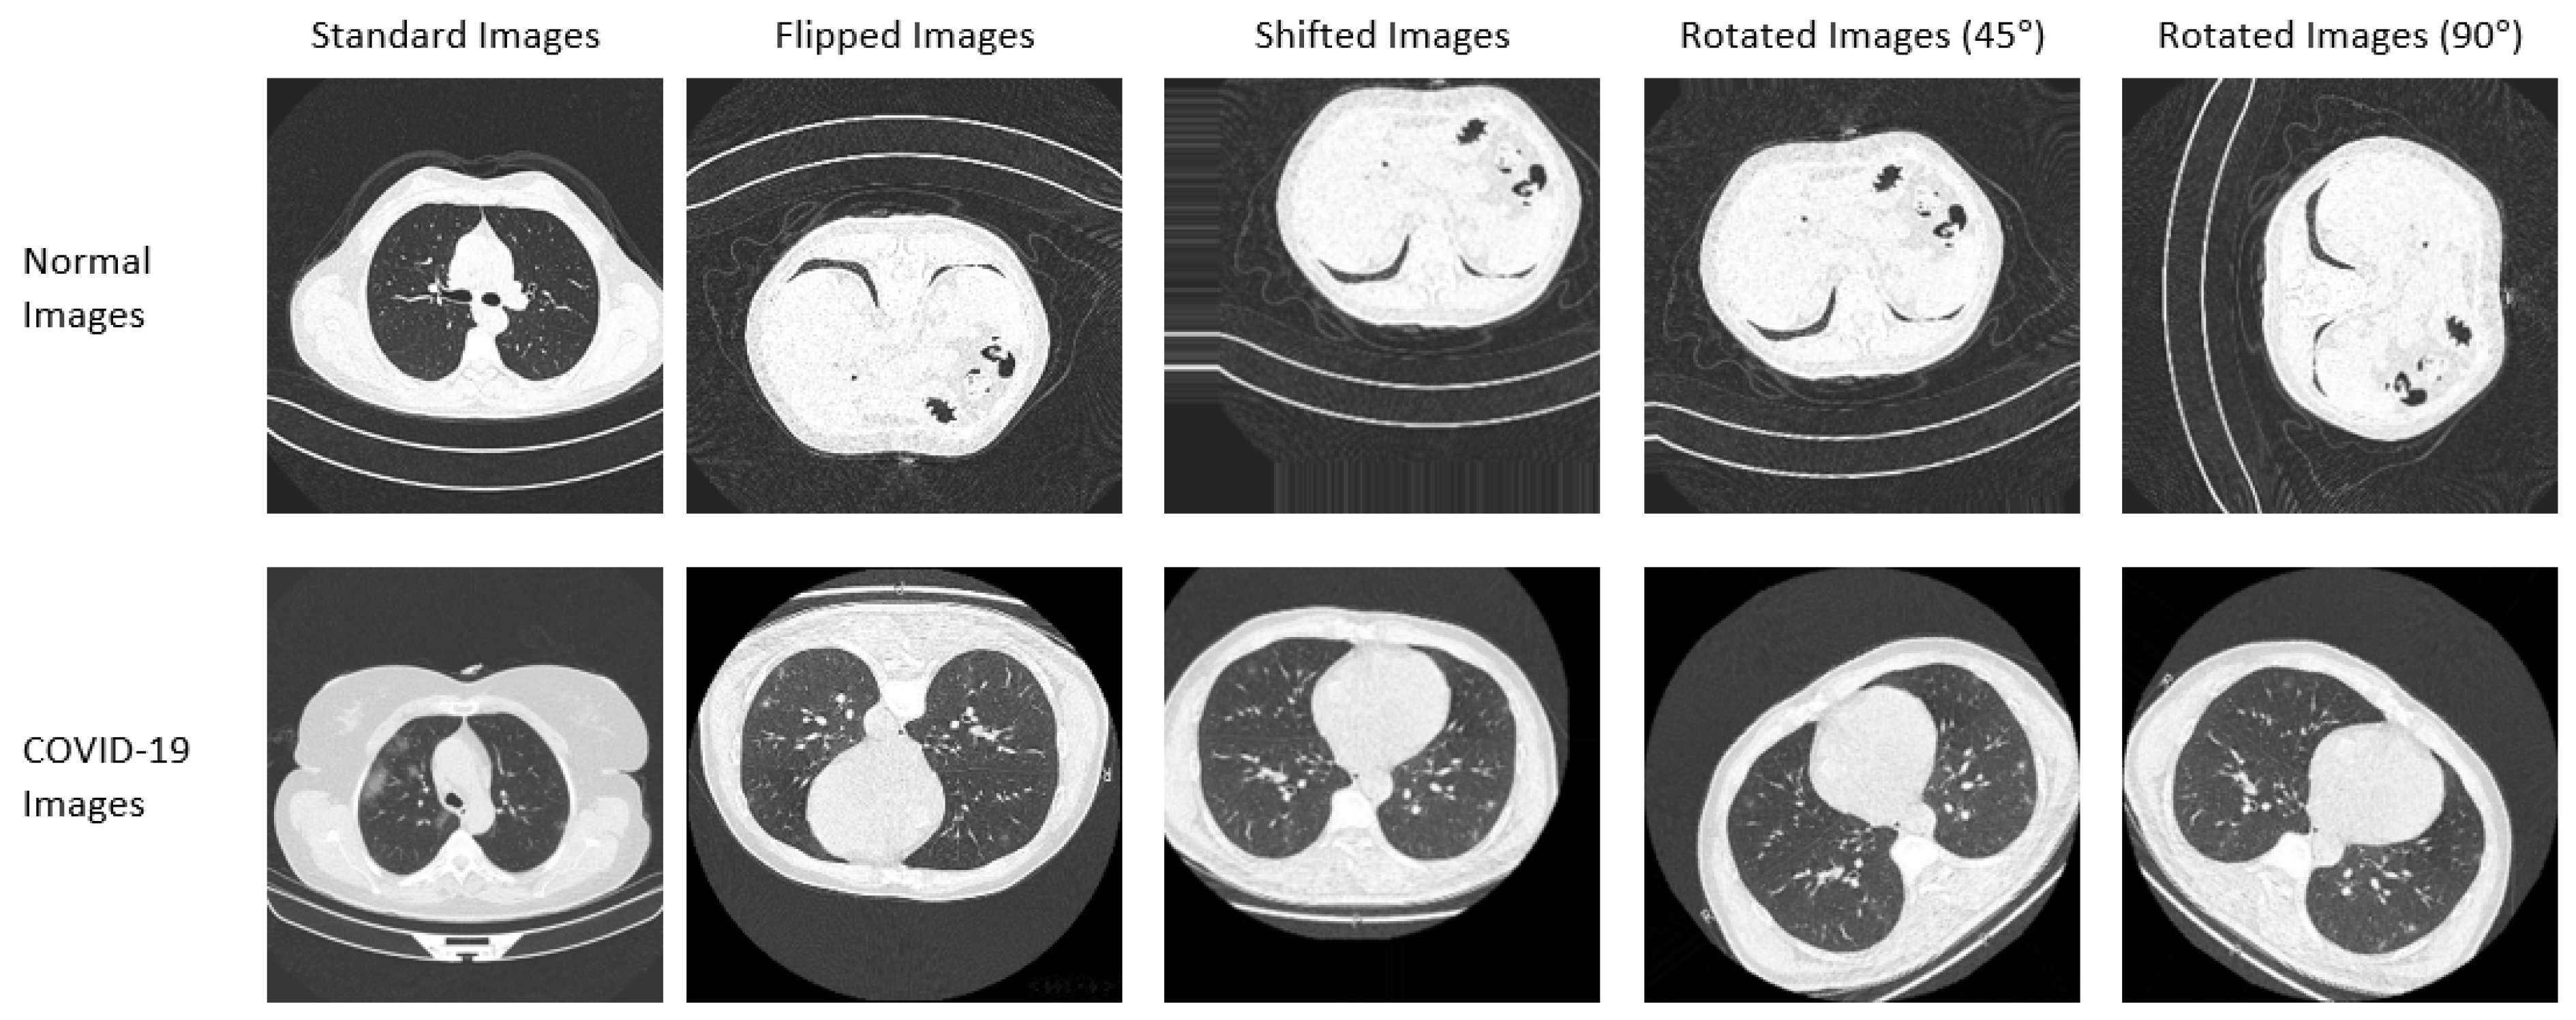
37] for more information on the dataset. A subset of the COVID-Net CT-2 dataset is used in this study. Samples of the dataset are shown in
Figure 2. The dataset consists of 14,000 CT images (9000 COVID-19 images and 5000 non-COVID-19 images). The second dataset was created by some researchers at the university of Qatar [
38,
39]. The dataset consists of 3616 COVID-19 X-ray images, 10,192 normal X-ray images, and 1345 pneumonia X-ray images. The dataset is publicly available and it can be downloaded from [
40].
3.1.2. Augmented Datasets
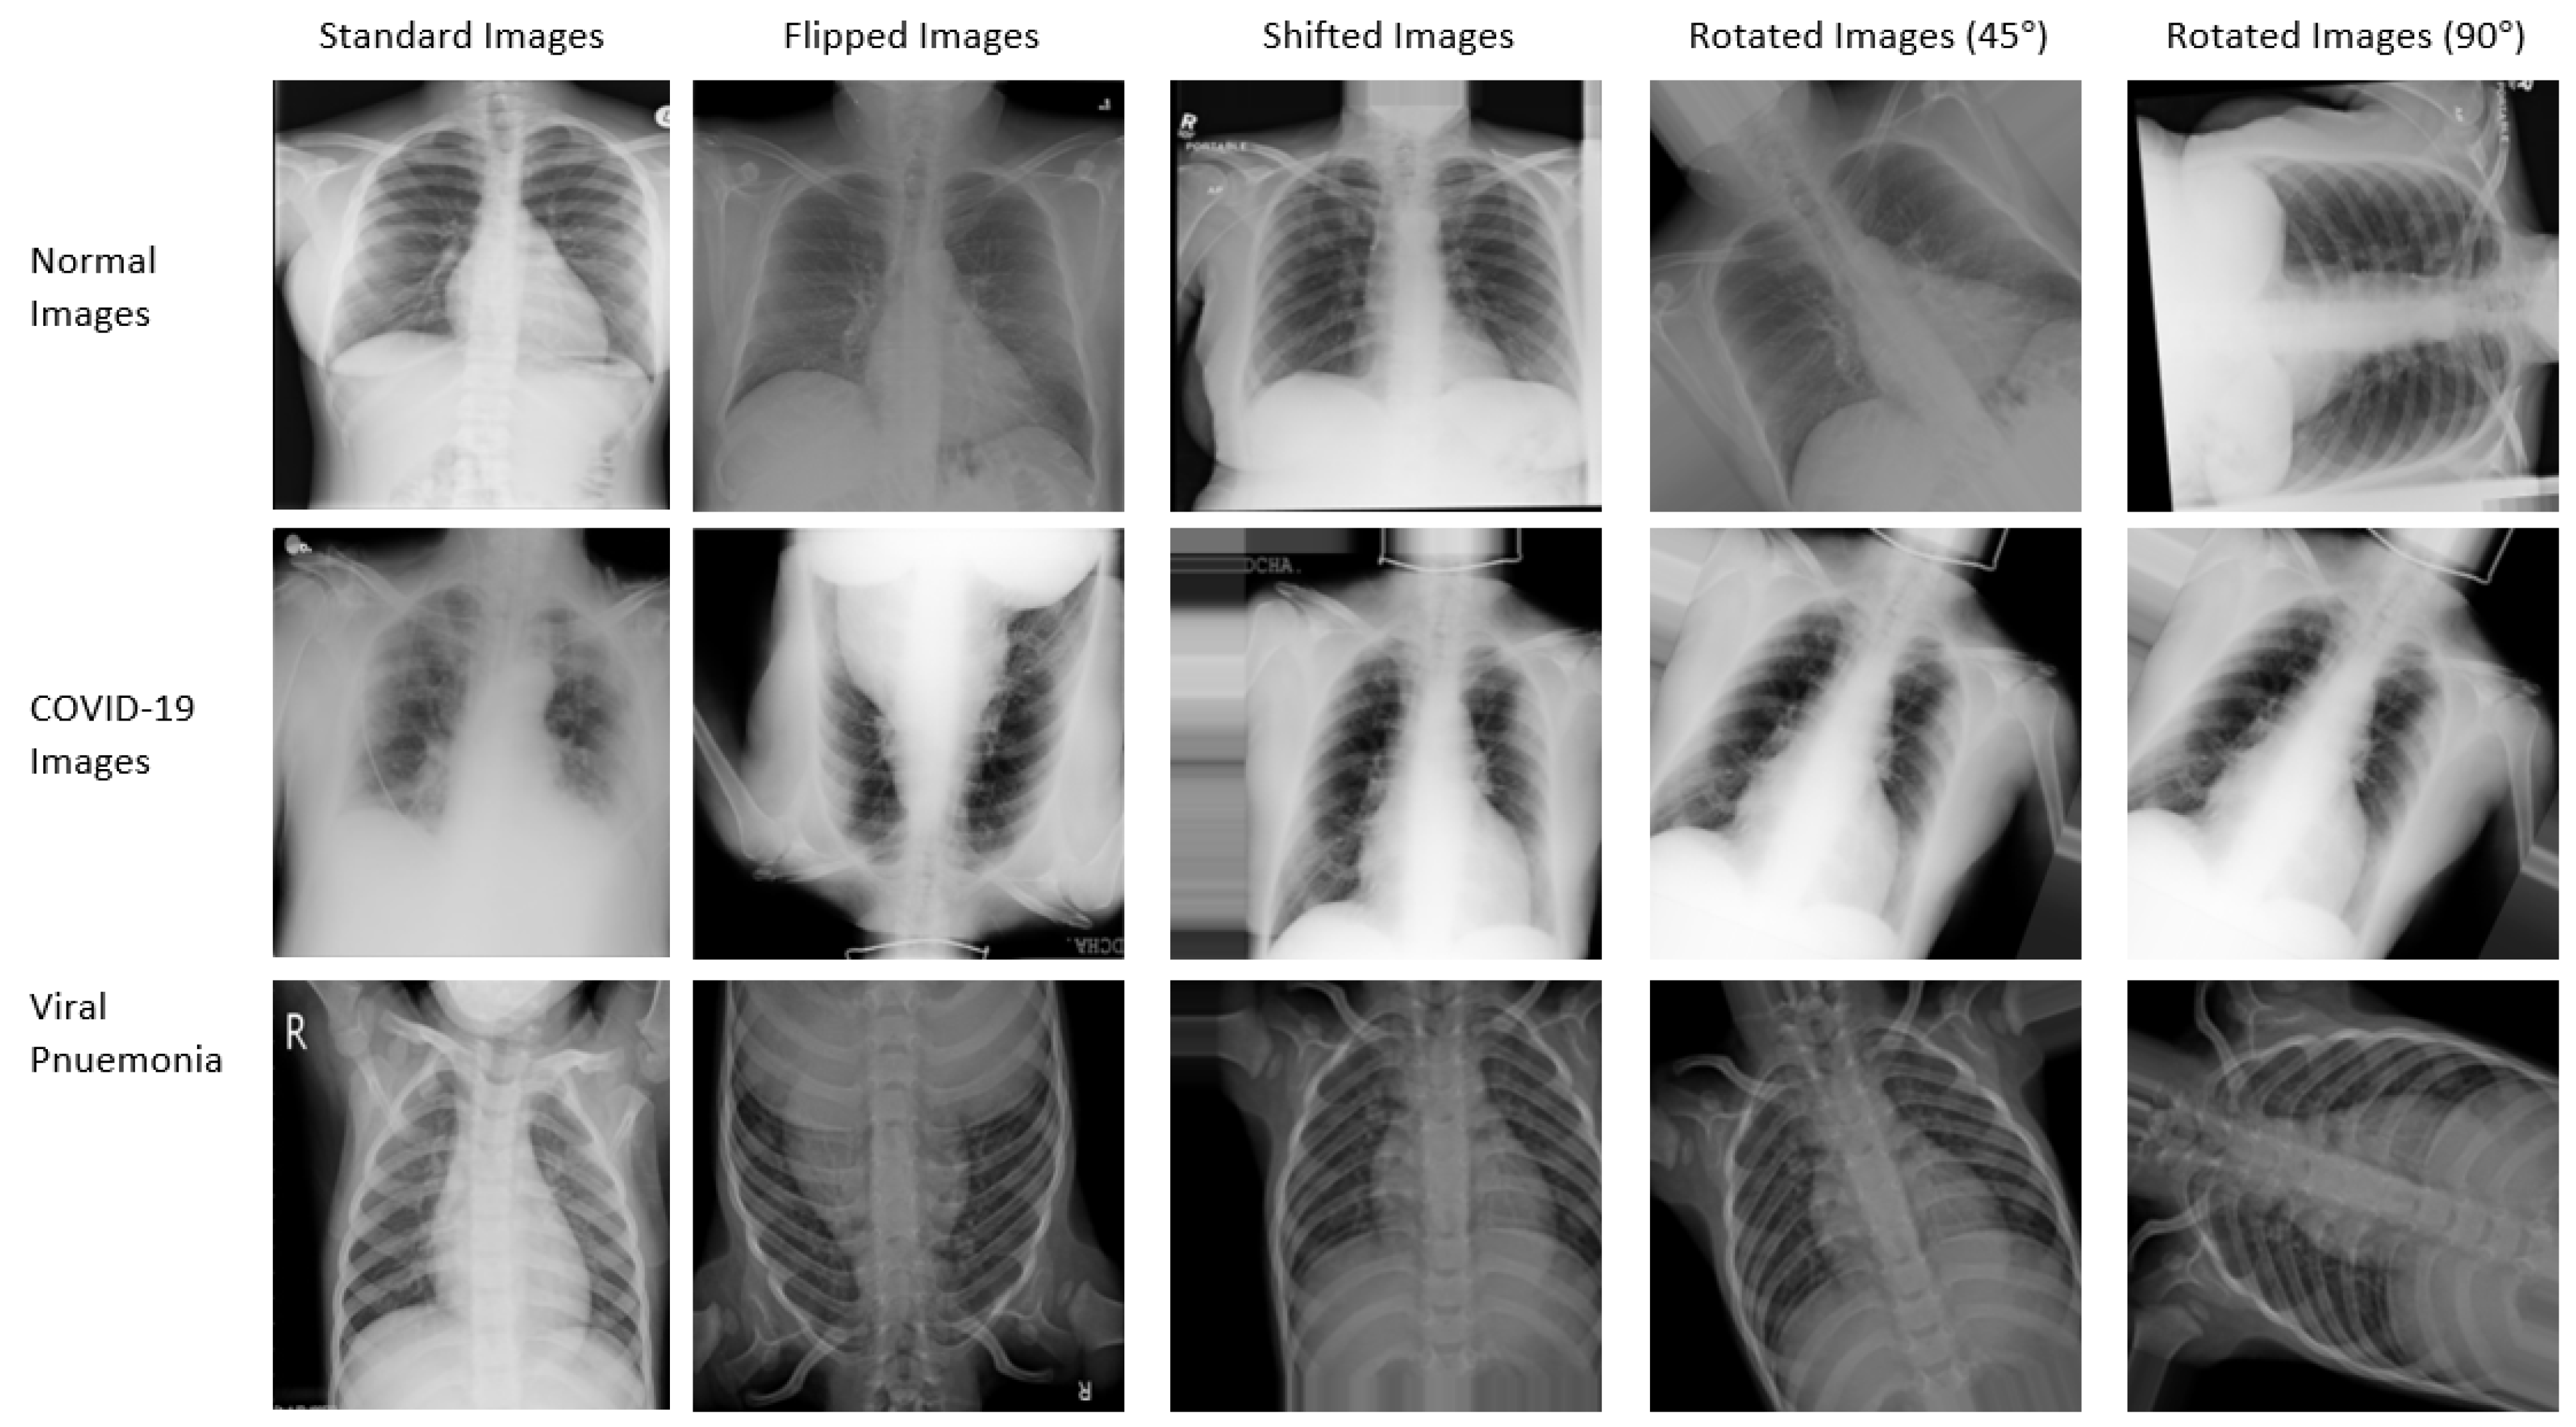
Eight new augmented datasets were generated from the original CT and X-ray datasets. The Keras ImageDataGenerator class was used to generate the augmented datasets. The first four augmented datasets consist of 14,000 randomly flipped CT images, 14,000 randomly shifted CT images, 14,000 CT images rotated randomly by 45 degrees, and 14,000 CT images rotated randomly by 90 degrees. The last four augmented datasets consist of 15,153 randomly flipped X-ray images, 15,153 randomly shifted X-ray images, 15,153 X-ray images rotated randomly by 45 degrees, and 15,153 X-ray images rotated randomly by 90 degrees. More details on the dataset are provided in
Table 5. Additionally, the samples from the CT and X-ray standard and augmented dataset are shown in
Figure 2 and
Figure 3, respectively.
During the pre-processing stage, the images’ pixel values were converted to the range 0 to 1 by dividing them by 255. This value was used because 255 is the maximum possible pixel value for an image. The images were also resized to 224 × 224 and used as inputs to the CapsNet model. Eighty percent of the dataset was used for training, while the remaining twenty percent was used to test the model. During training, 20 percent of the training images was used to validate the training performance. All the experiments were conducted on a computer cluster. The cluster computer had the following specifications: 2 × Intel Xeon E5-2697A v4 processors with 512 GB of 2.4 GHz DDR4 memory.
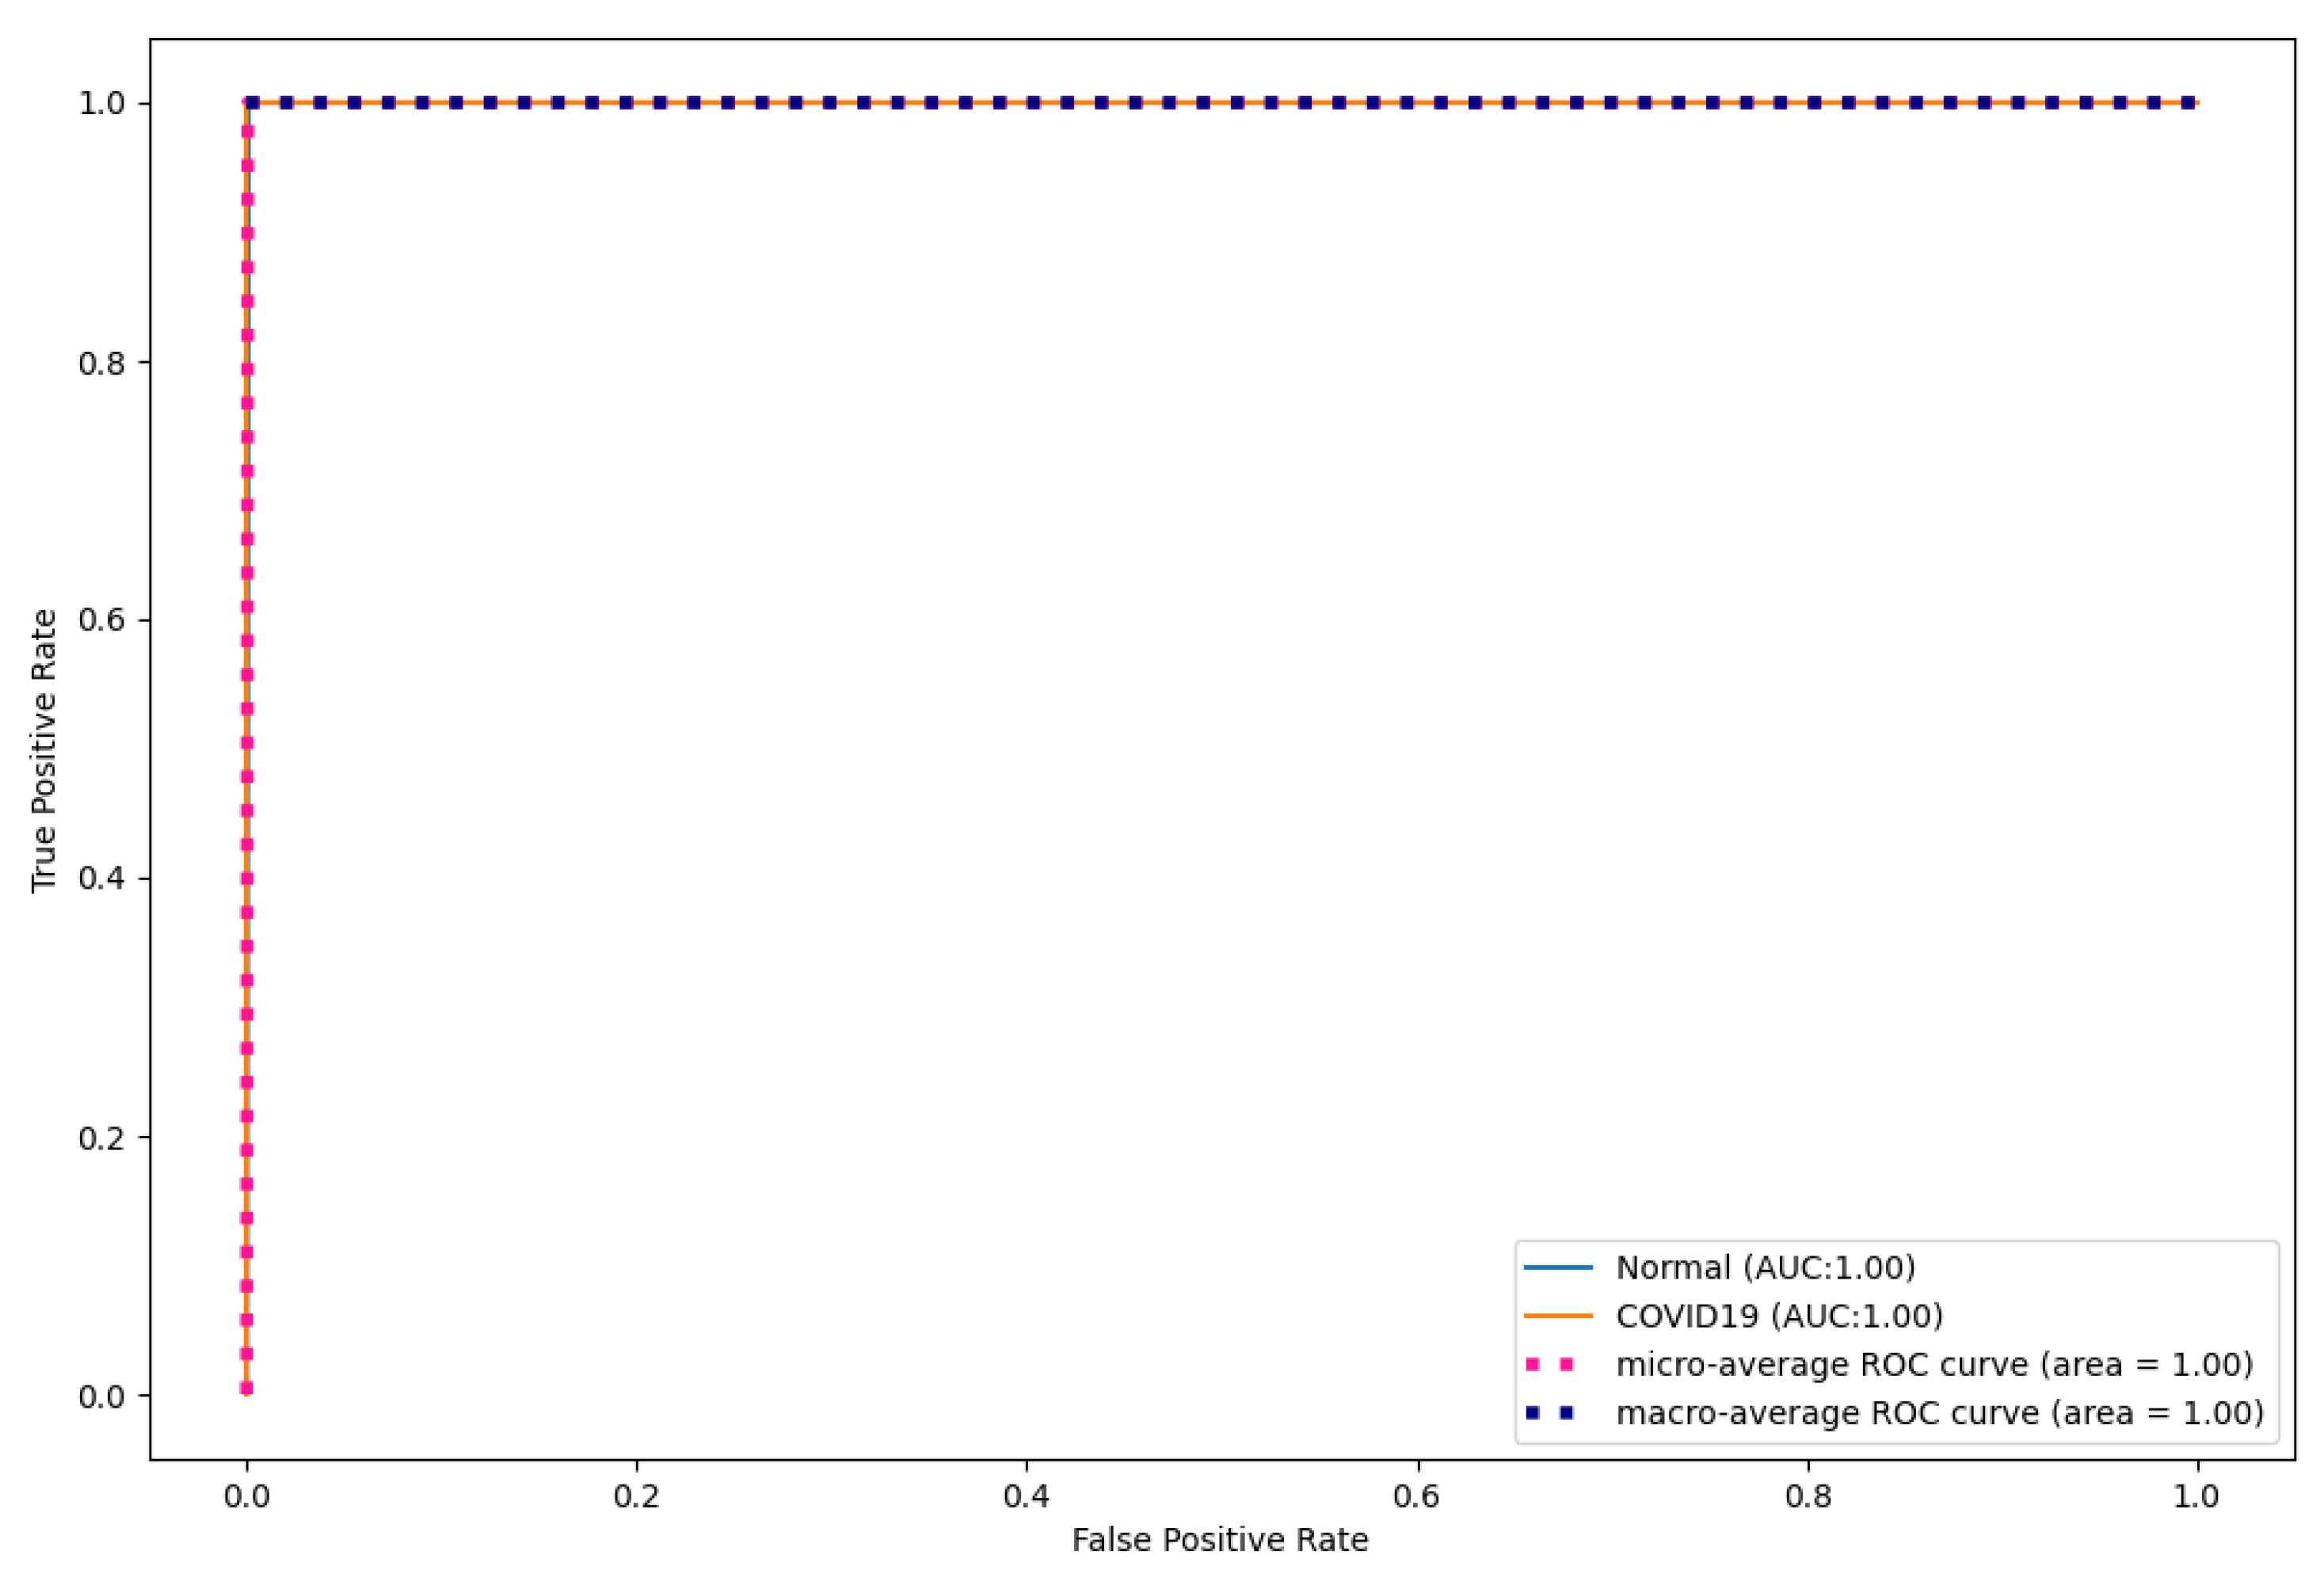
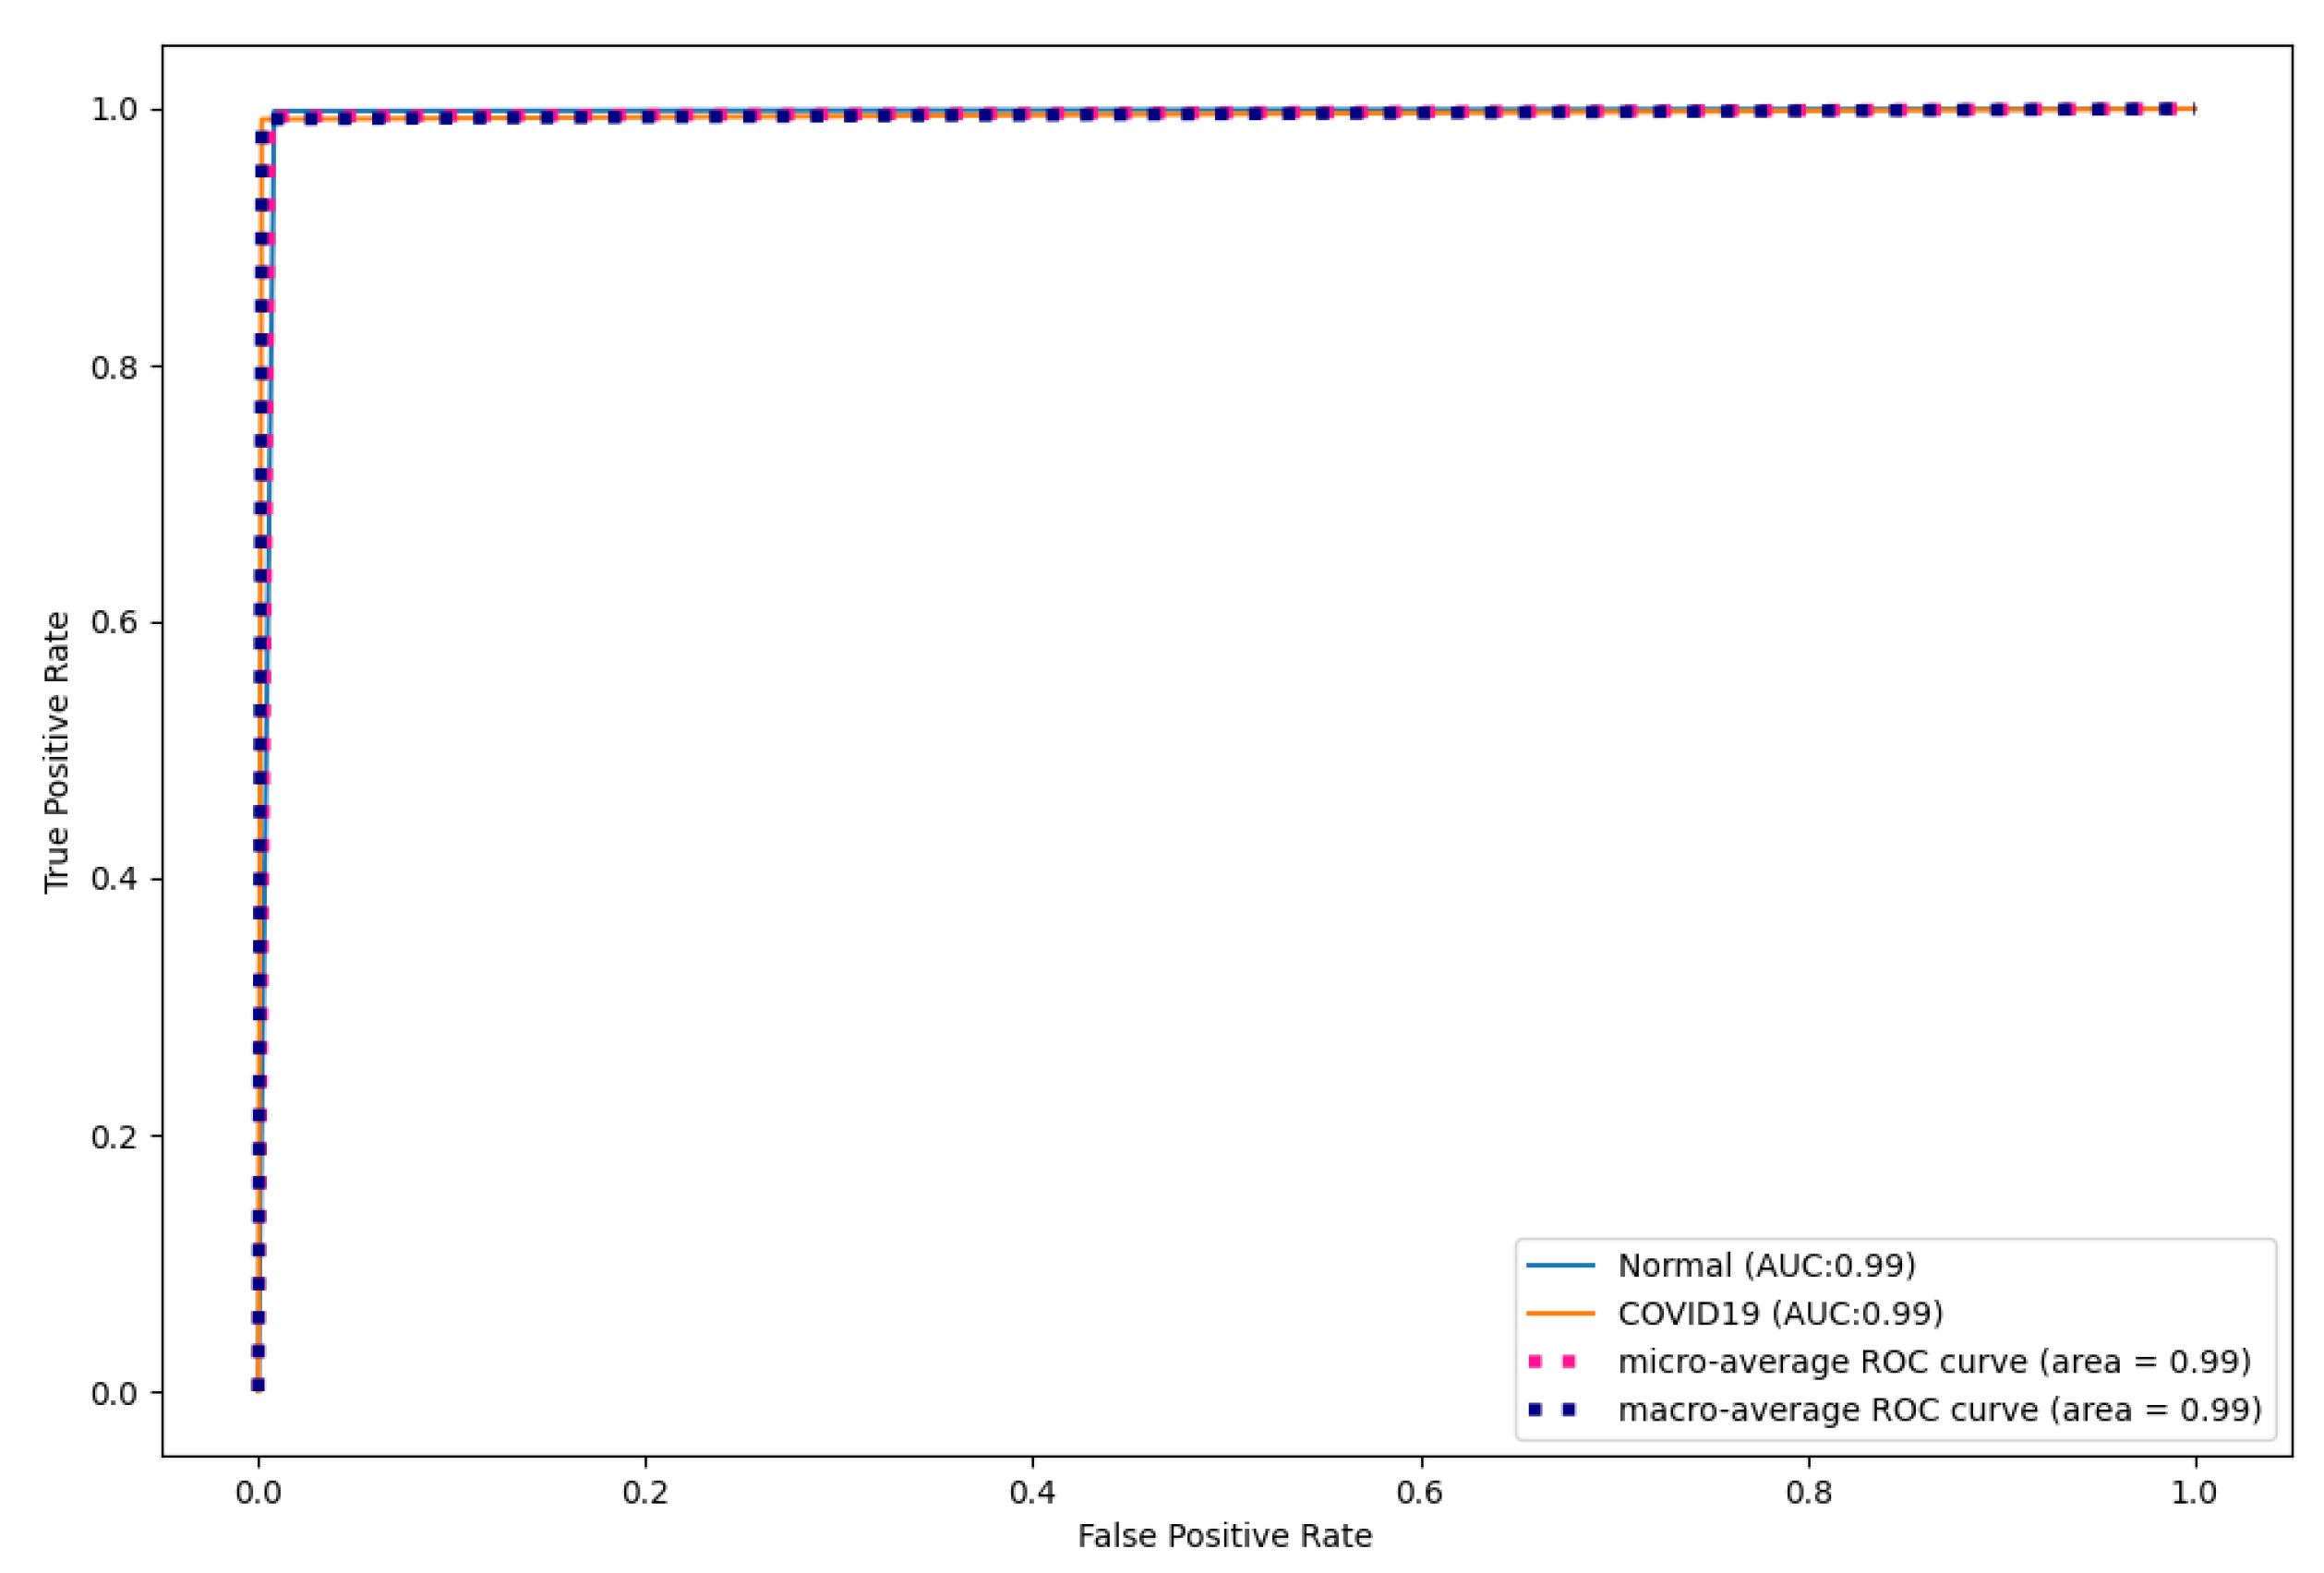
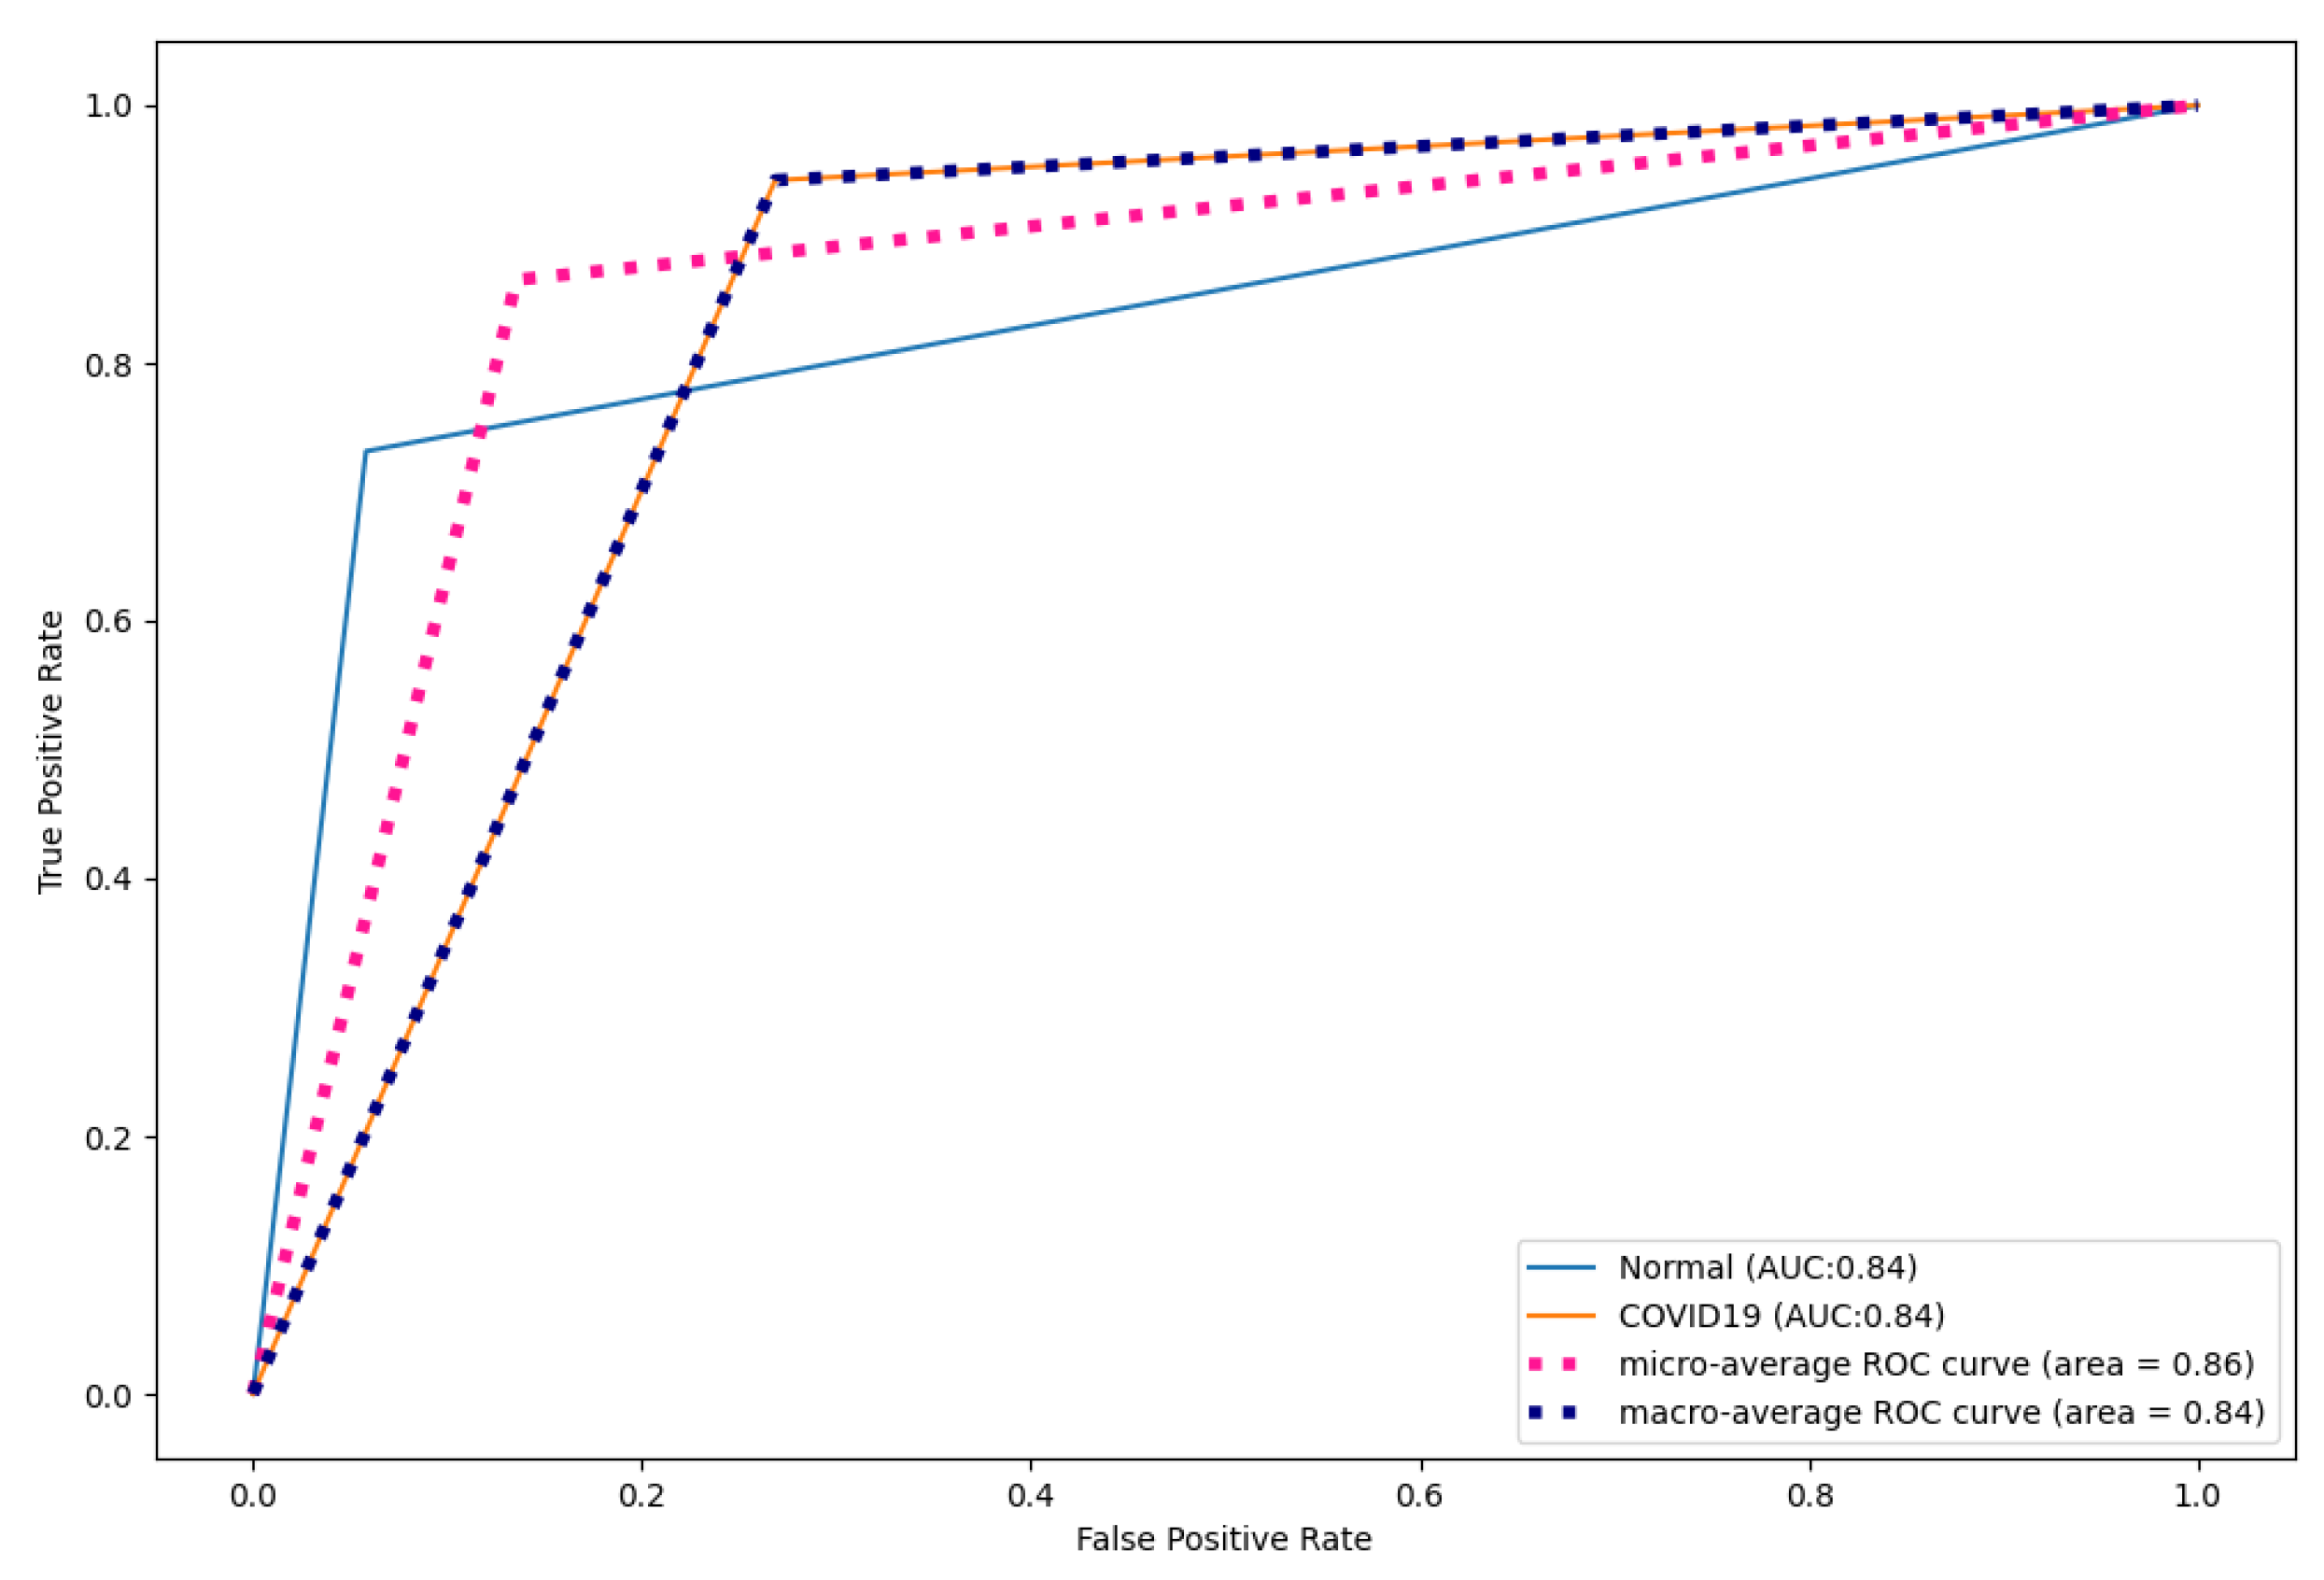
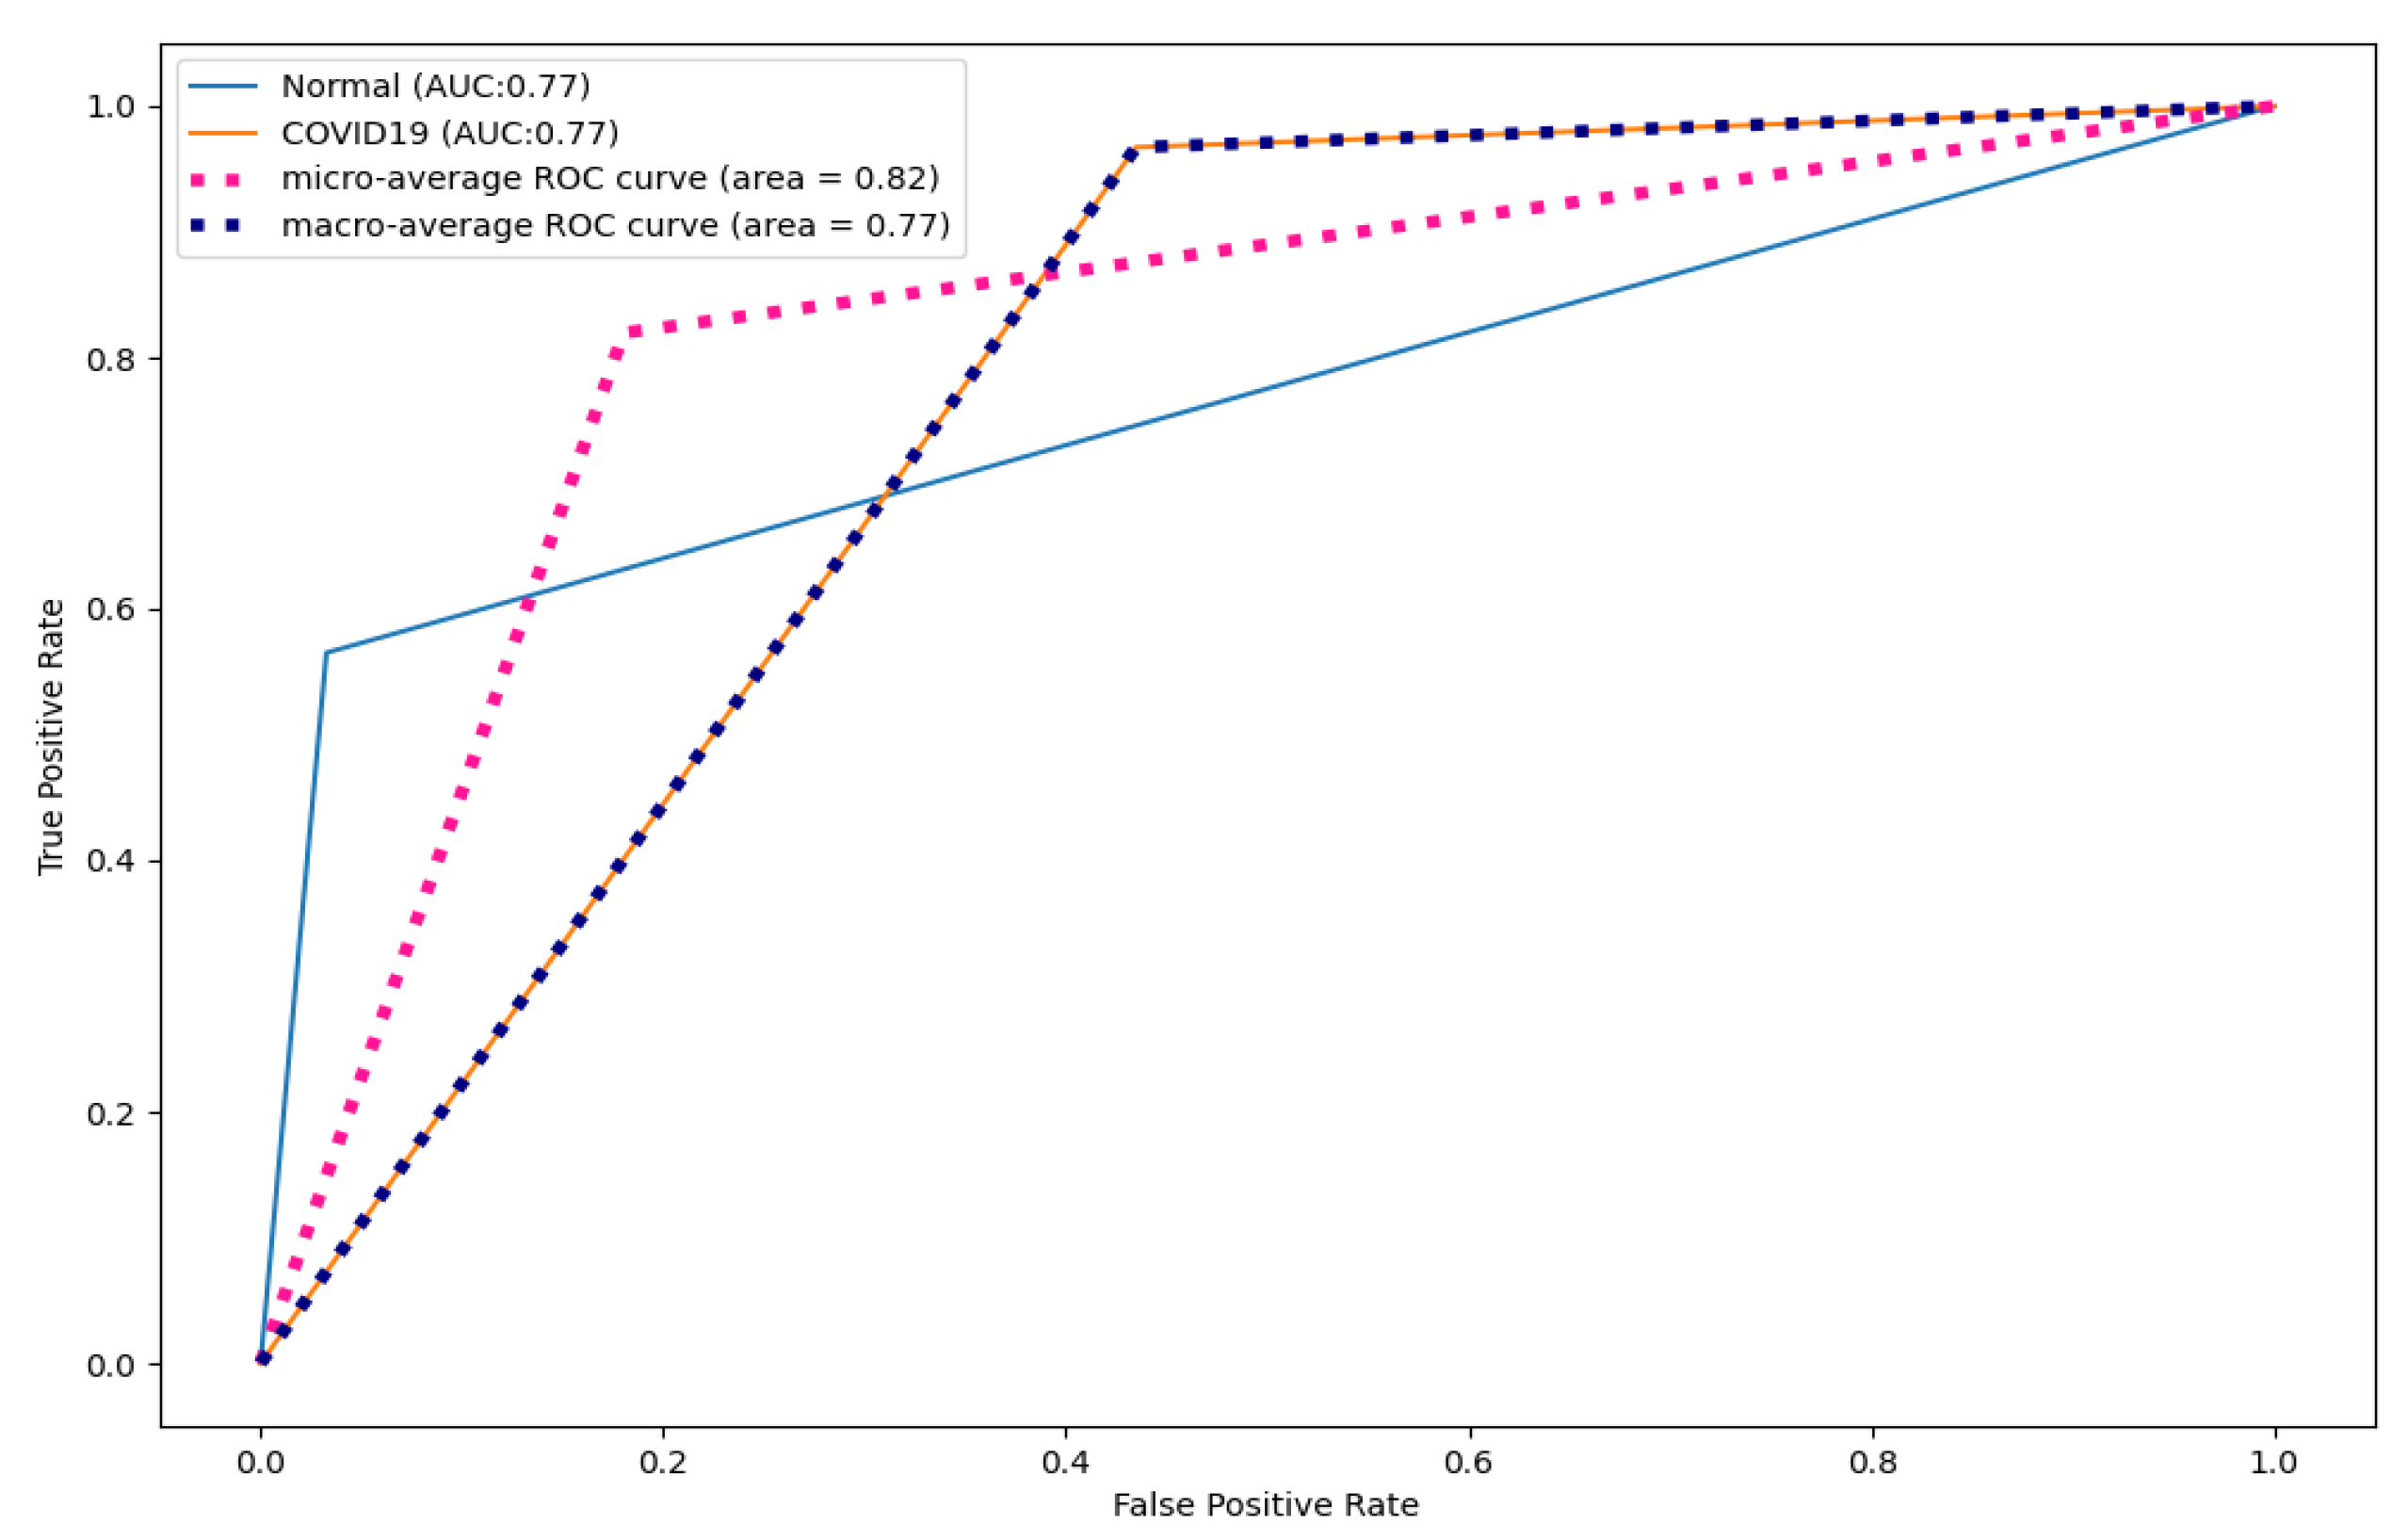
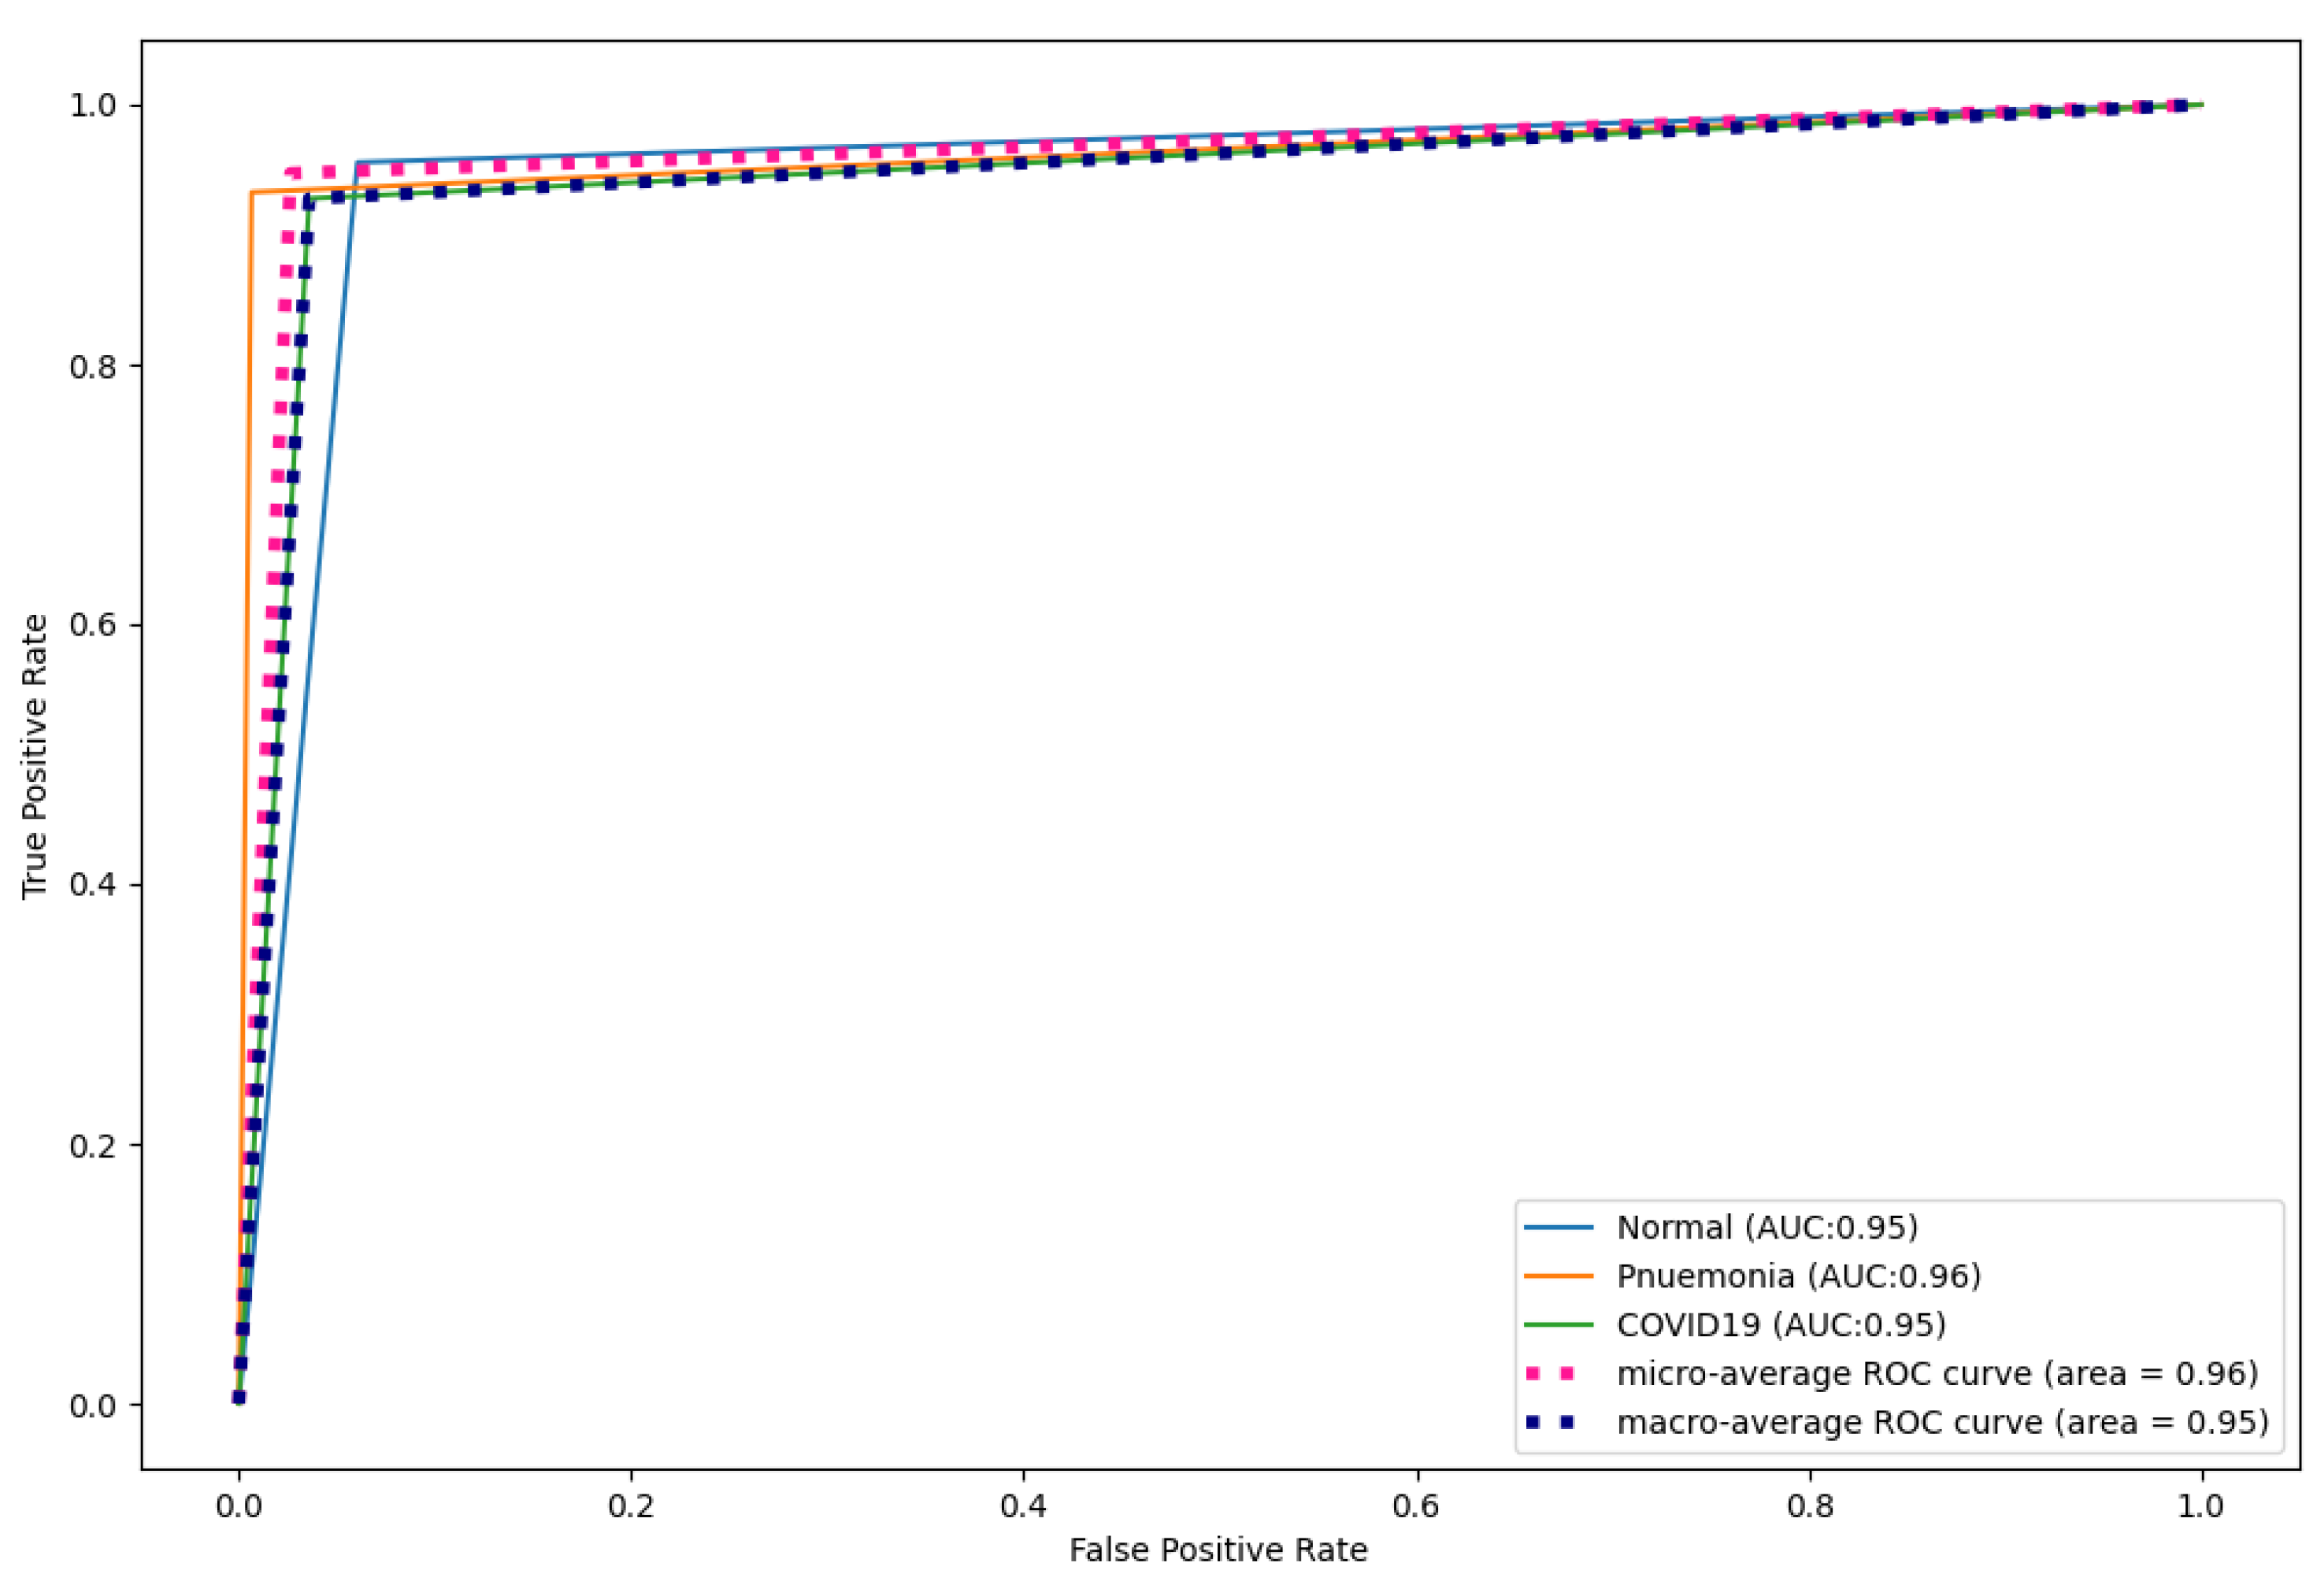
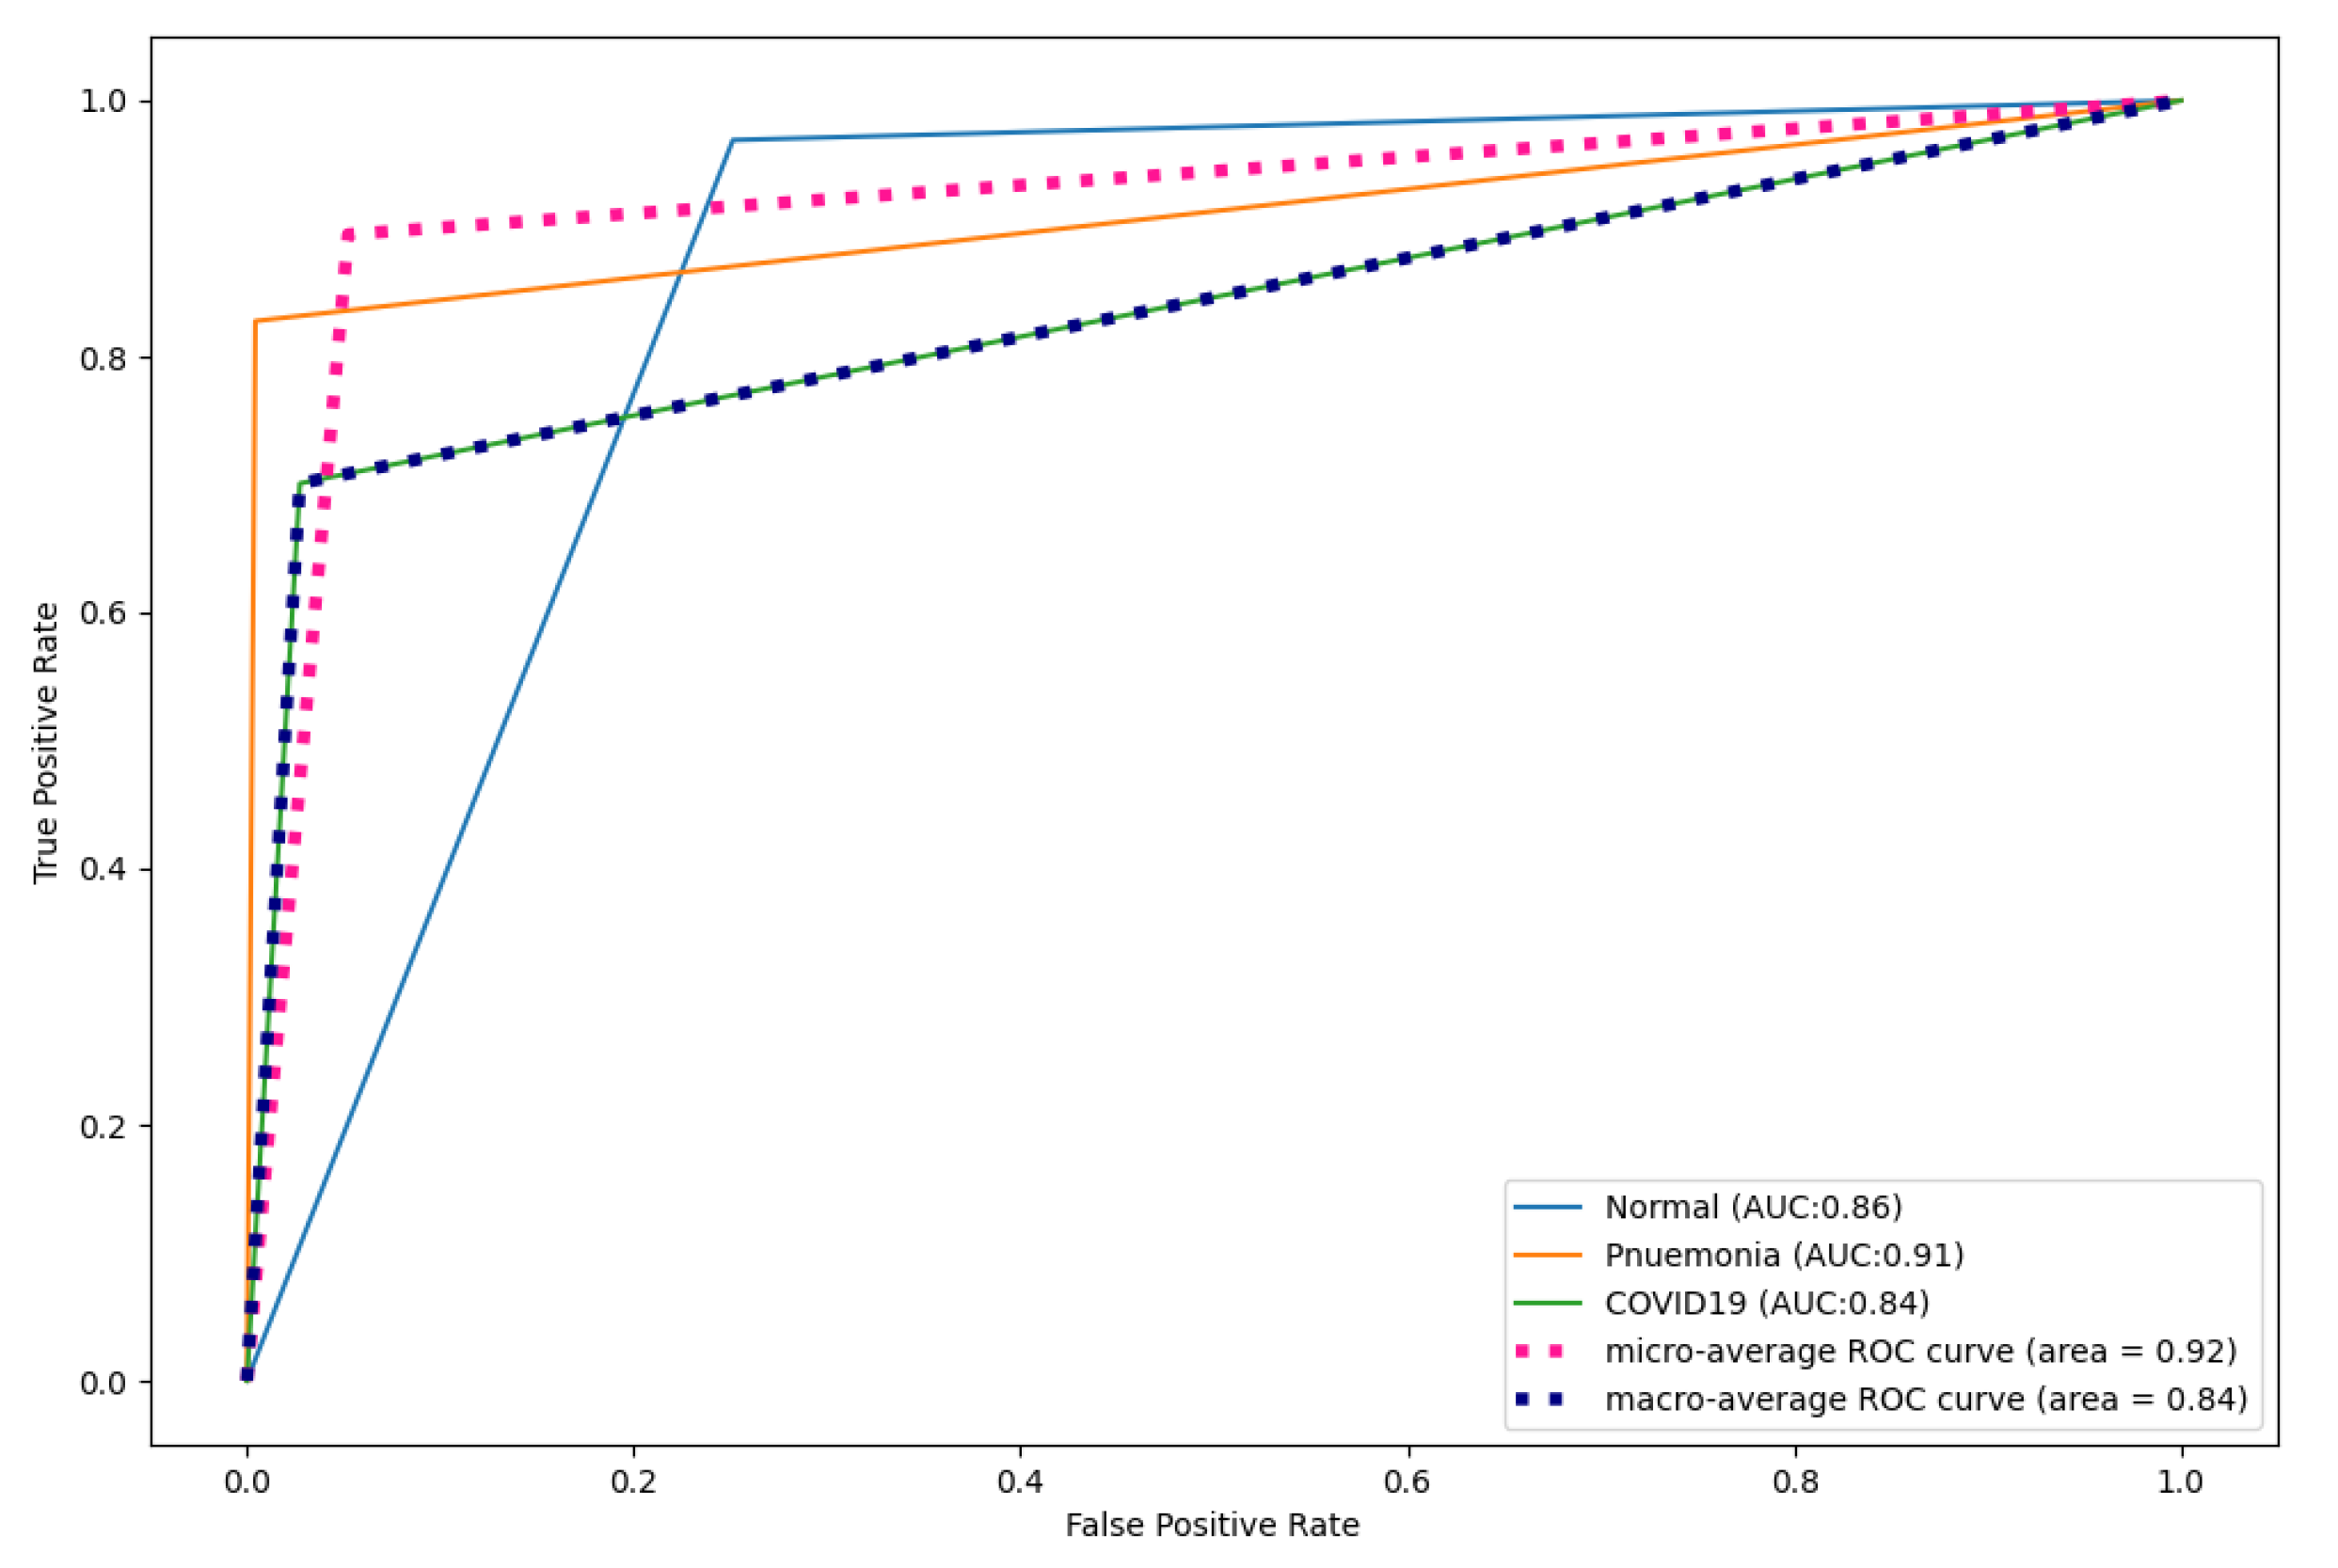
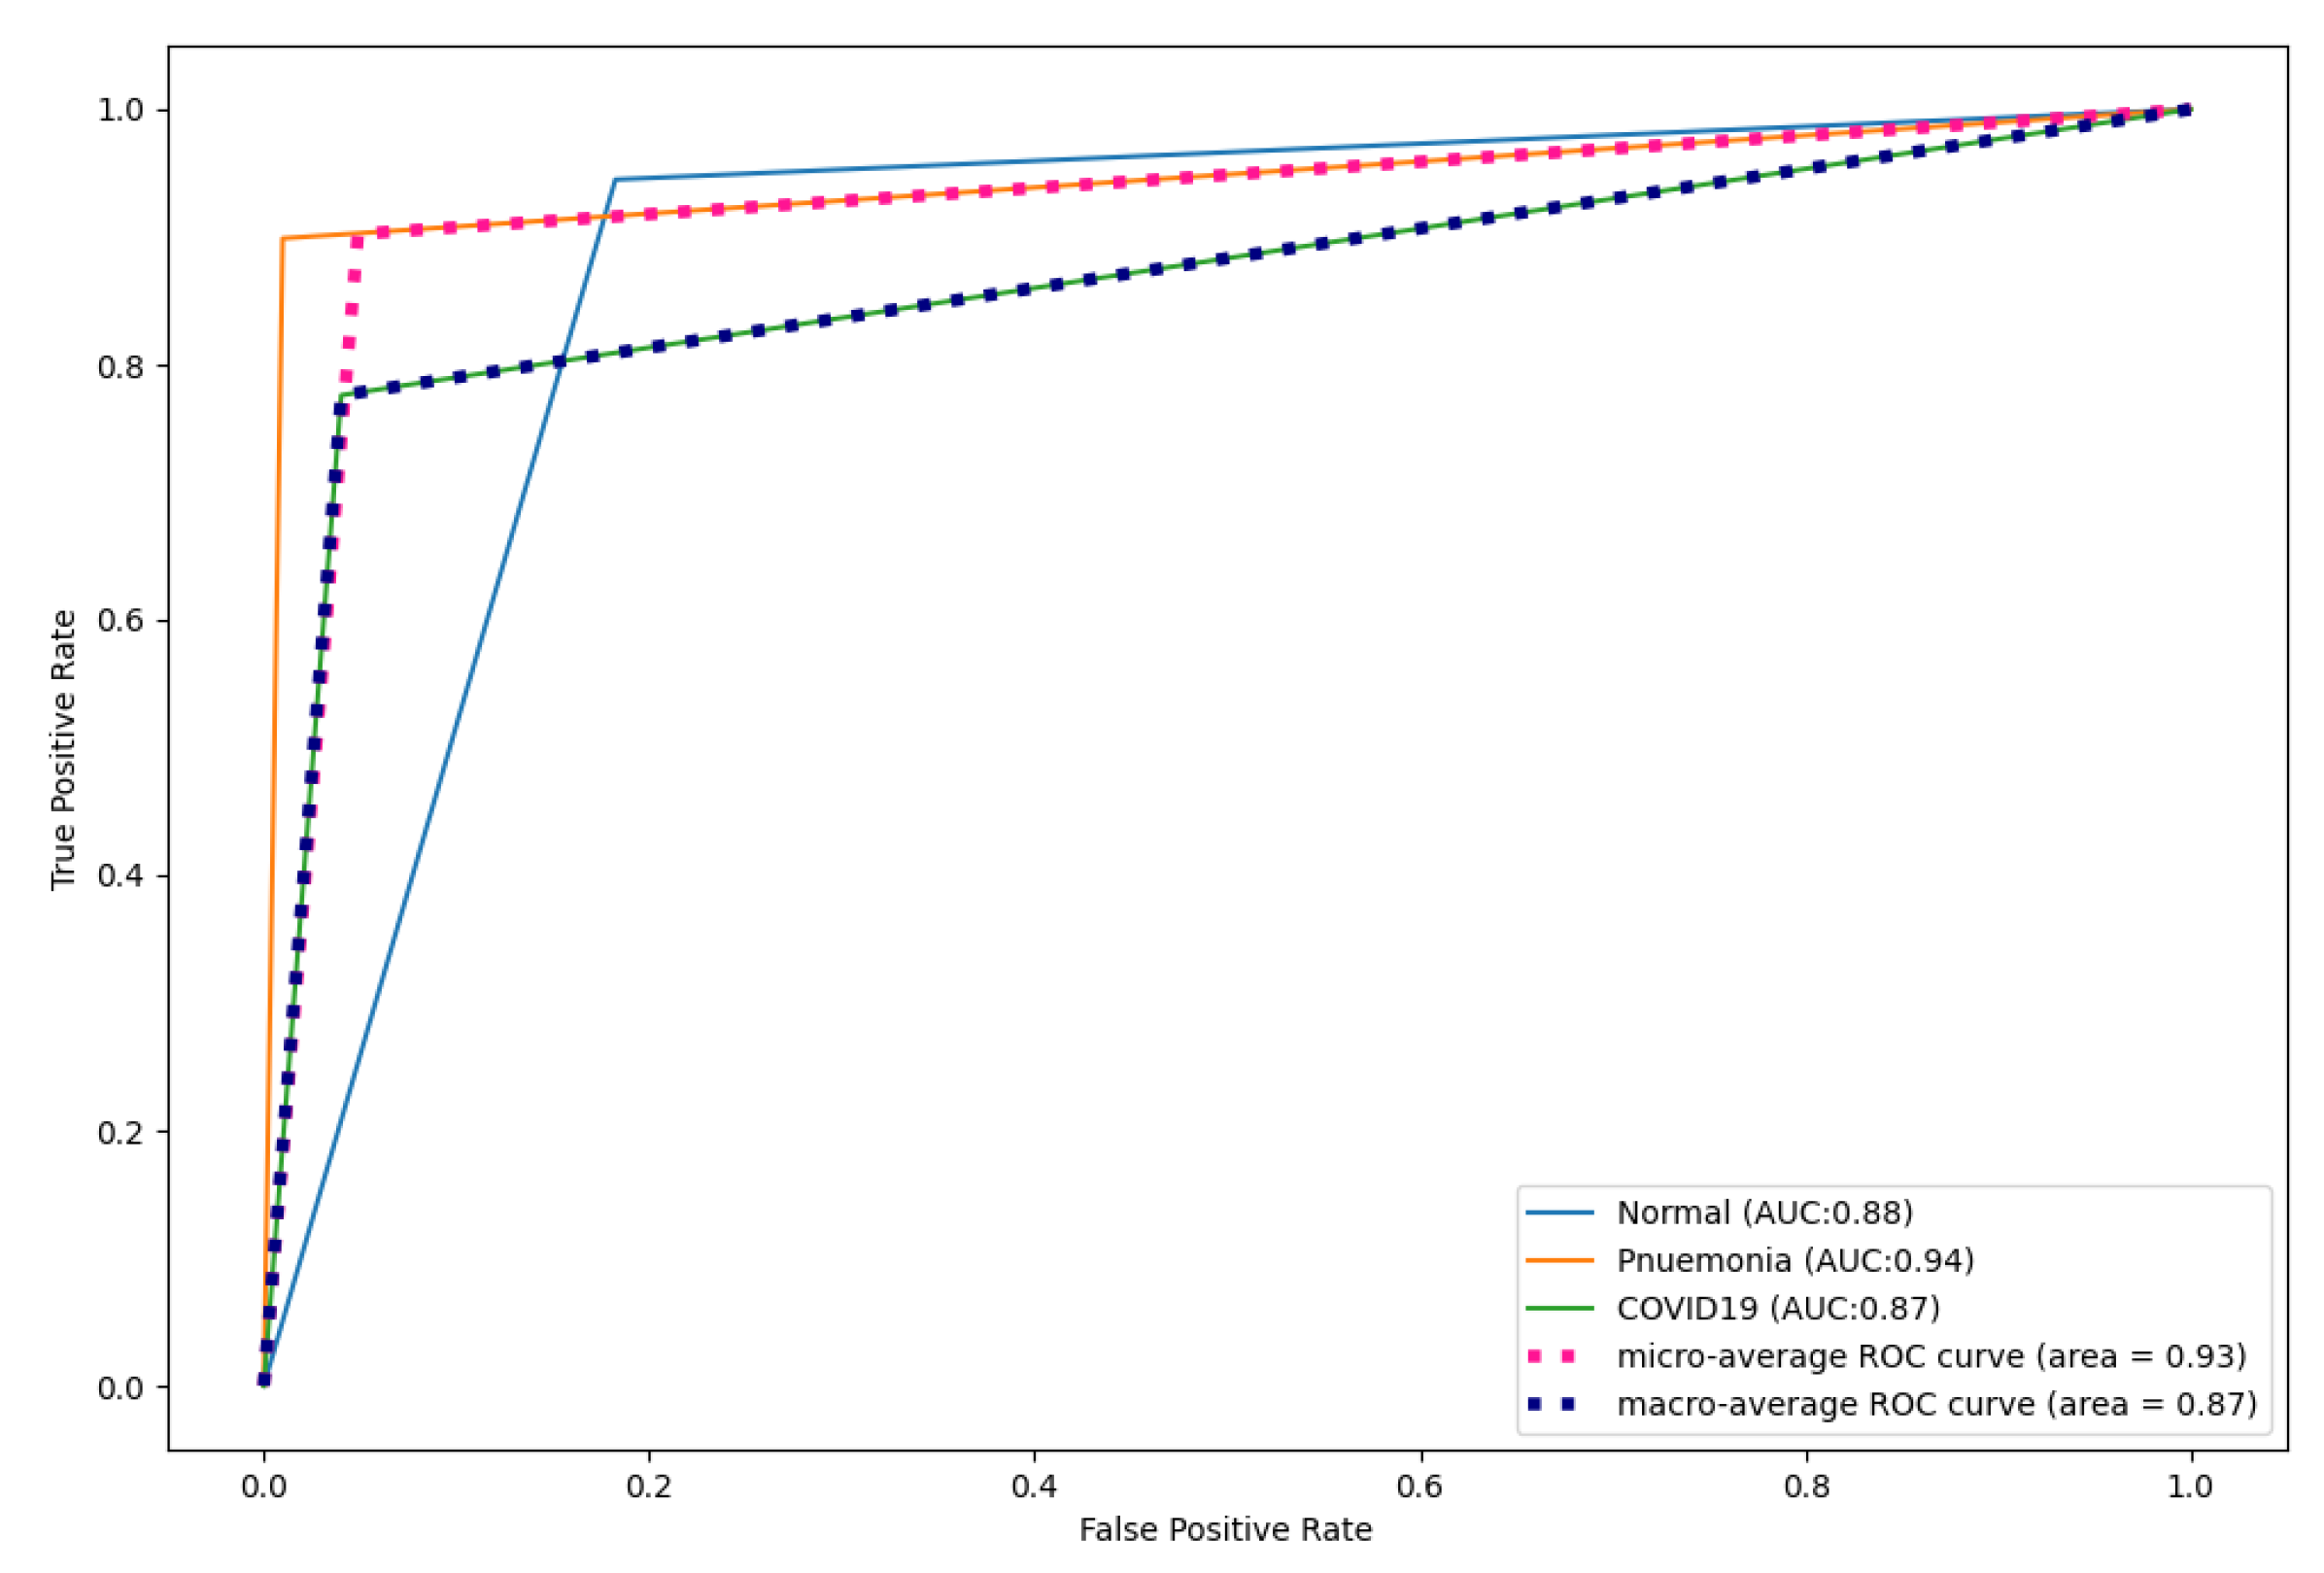
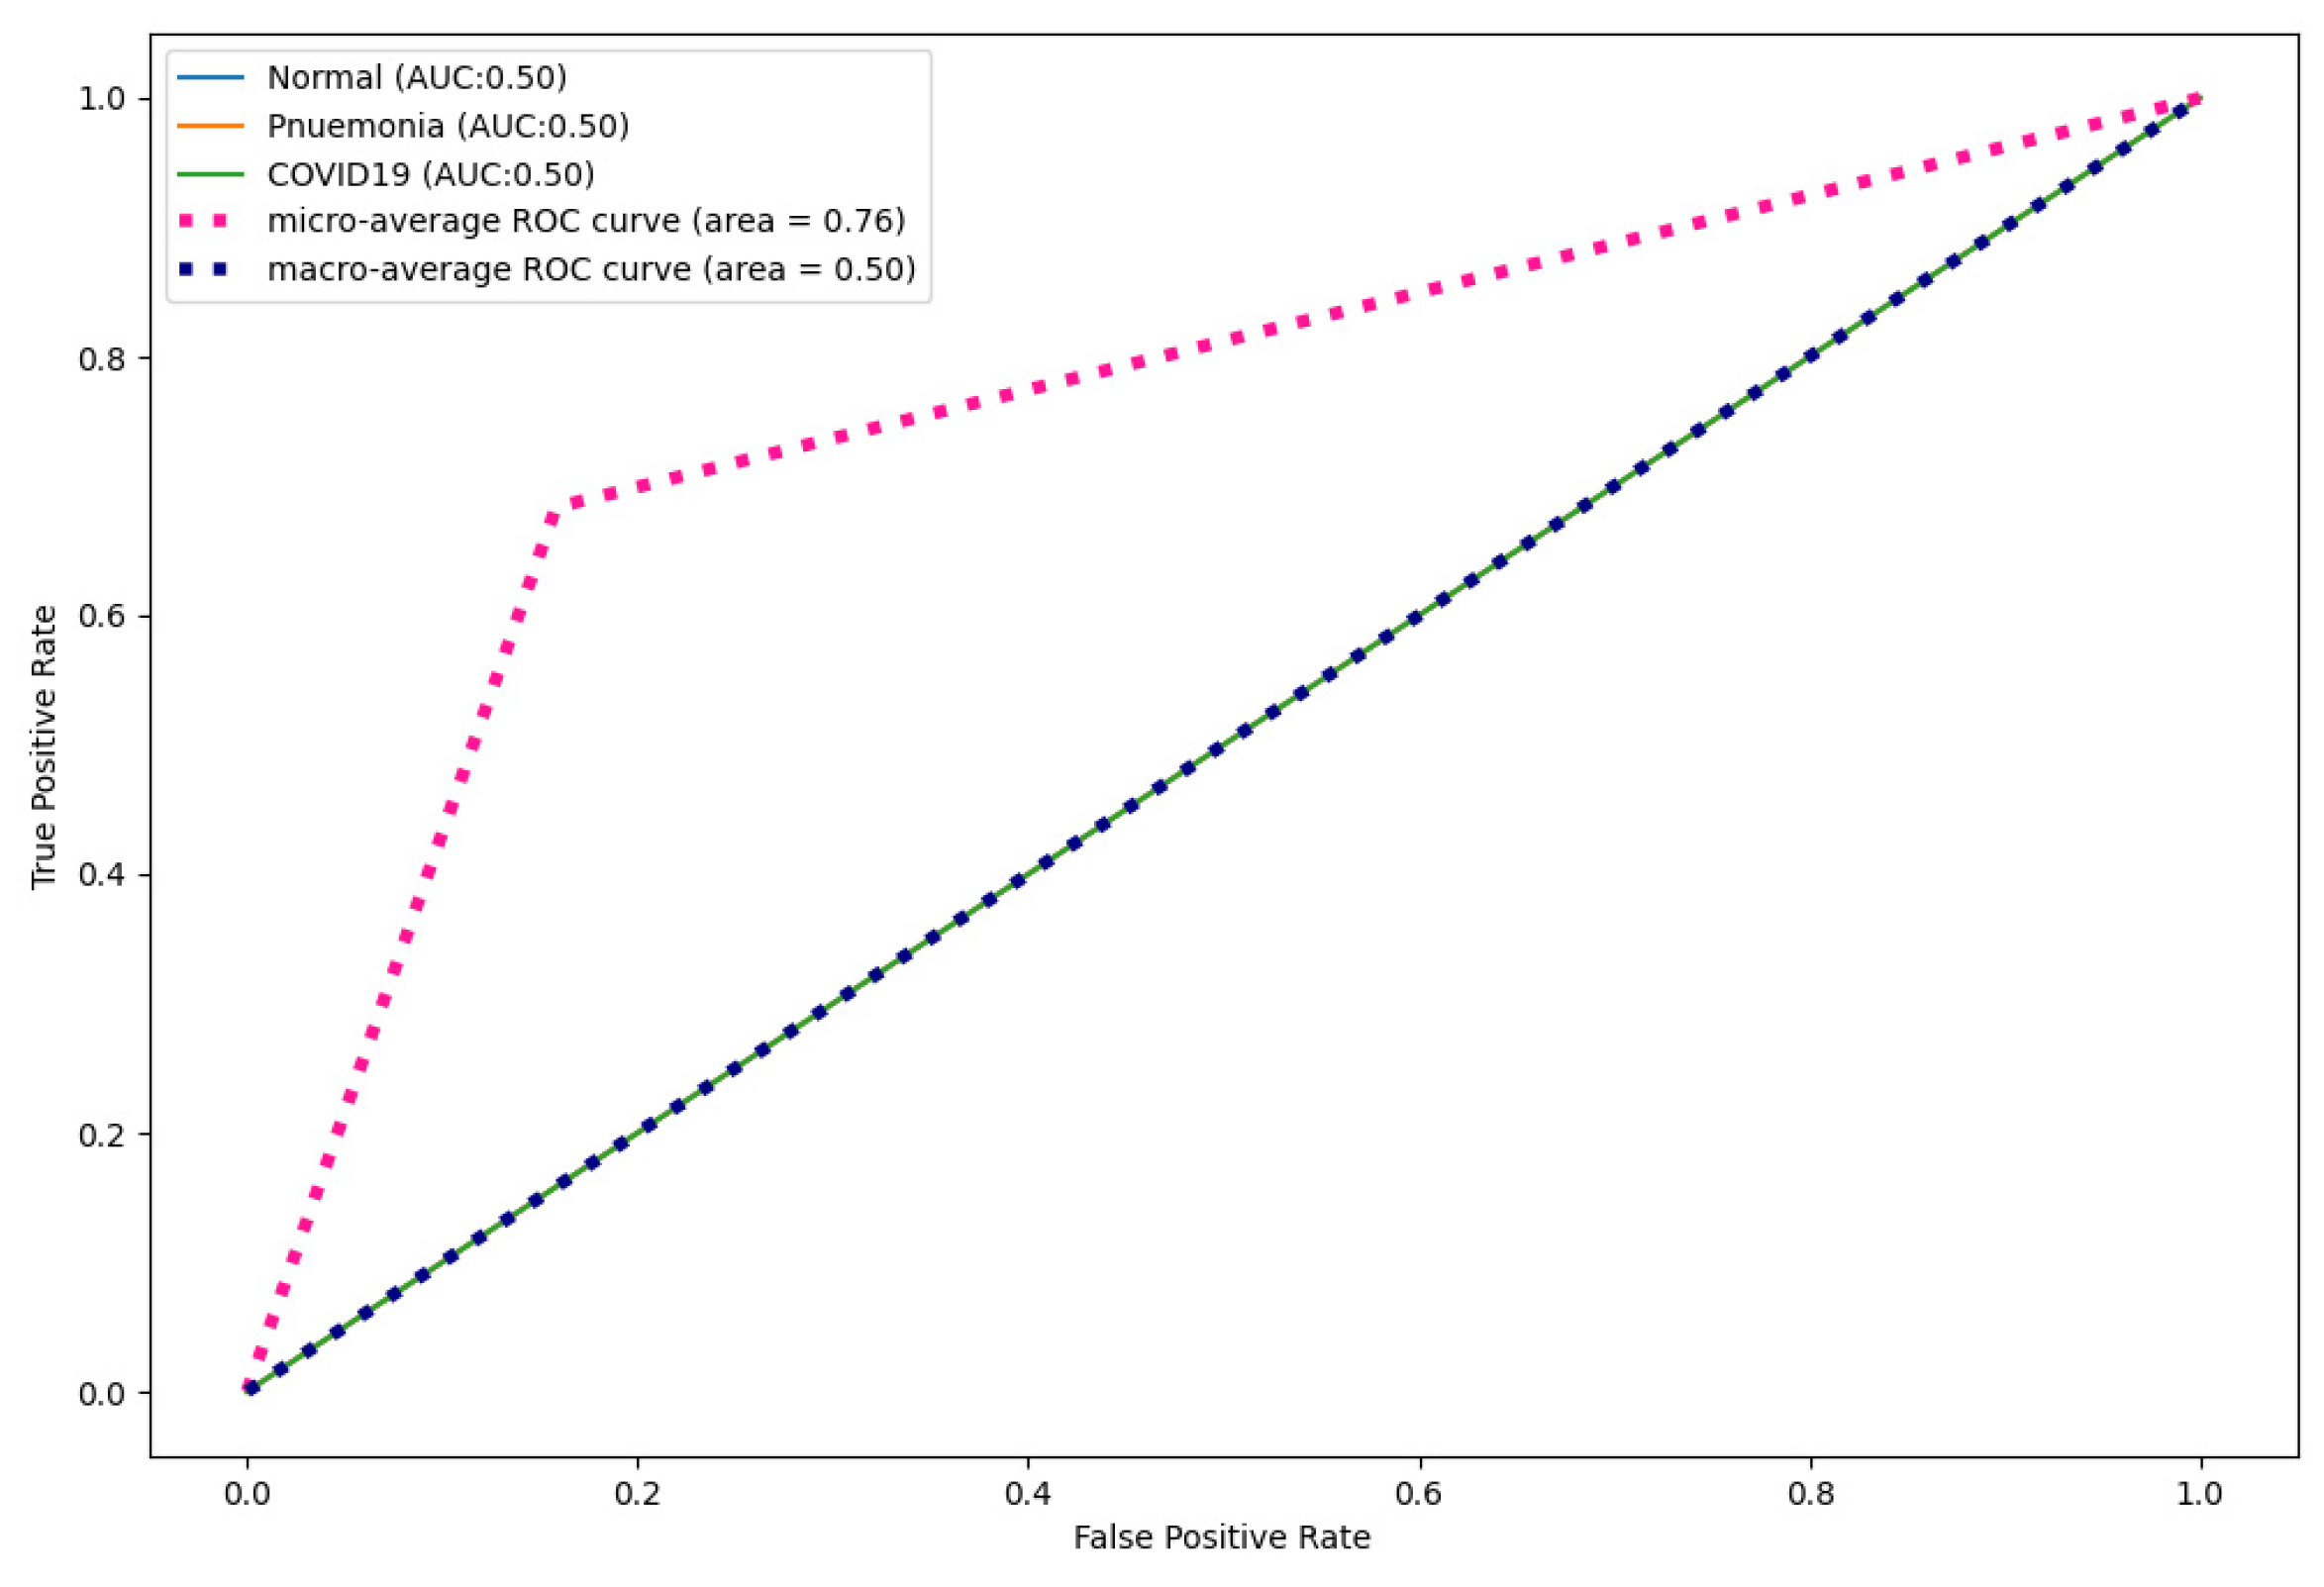
3.2. Performance Measures
Five performance measures 3454 used to evaluate the performance of the models, namely accuracy, precision, sensitivity, F1-score, and area under the ROC curve (AUC-ROC). The performance metrics can be calculated using Equations (1)–(4). The five metrics are influenced by the number of true negatives (
TNs), true positives (
TPs), false negatives (
FNs), and false positives (
FNs).
AUC-ROC is a measure showing the efficacy of a model in separating different classes. A high AUC indicates that the model is performing well, while a low AUC indicates otherwise.
5. Conclusions
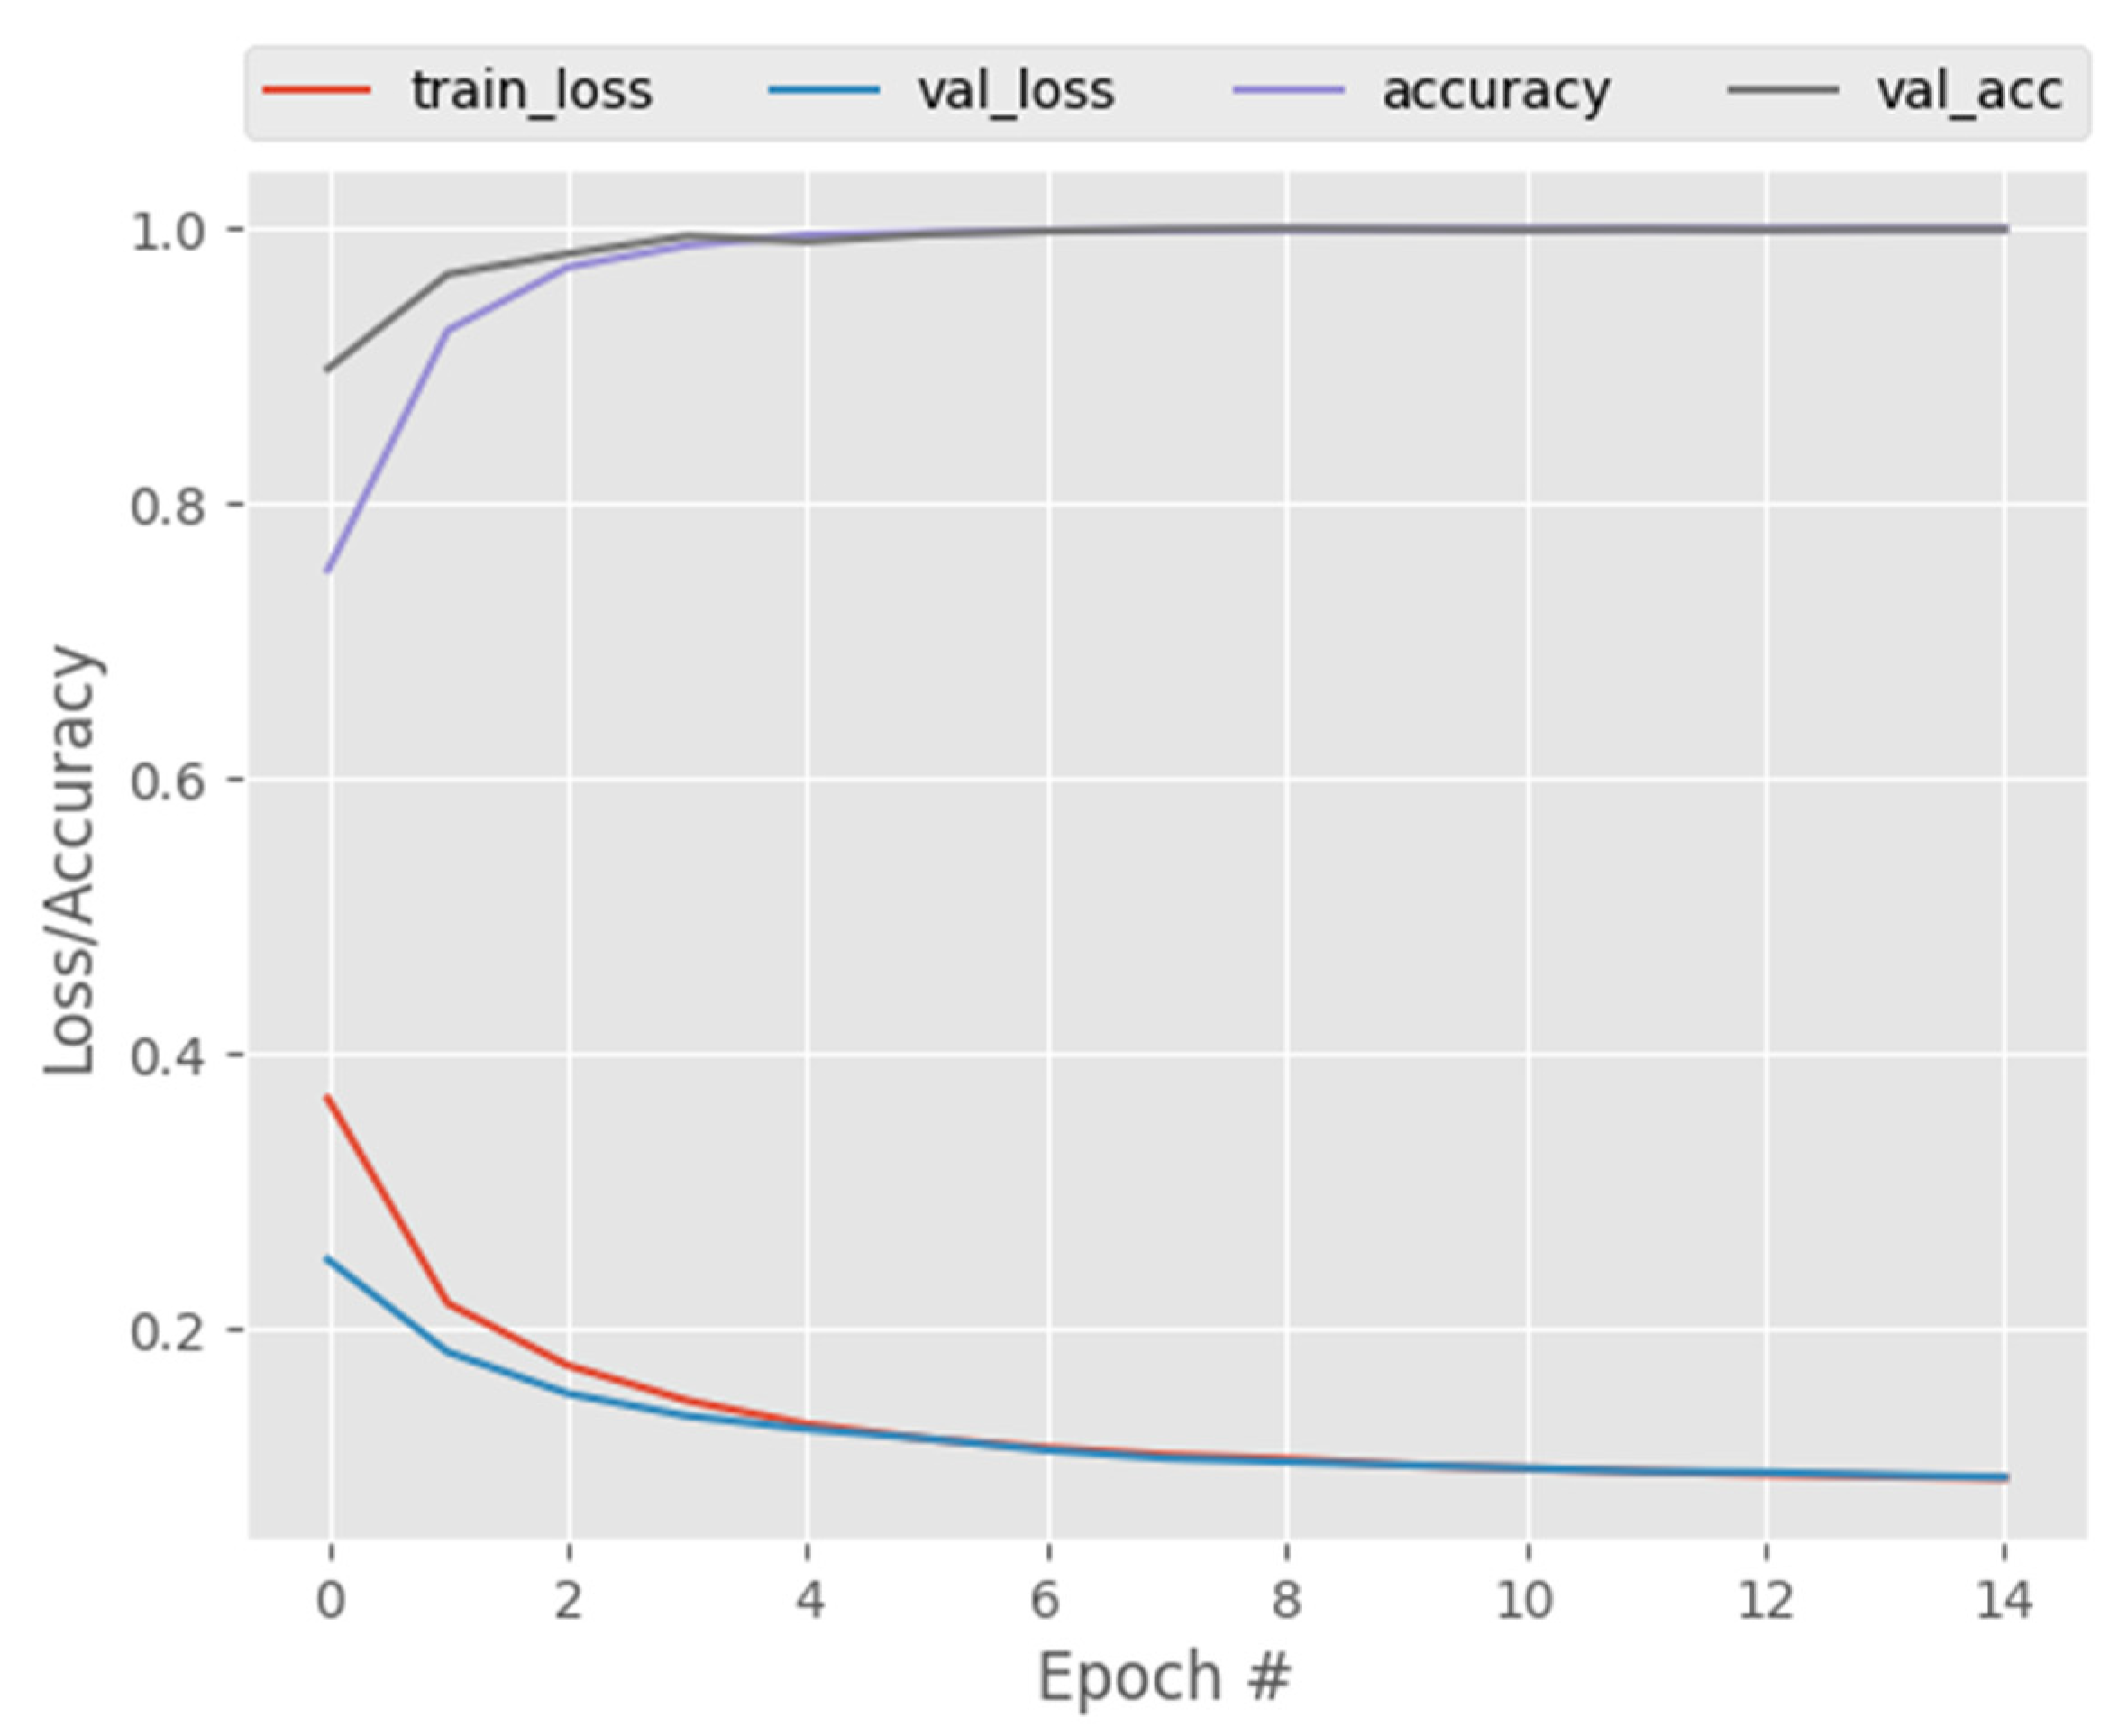
The COVID-19 pandemic remains a threat, with multiple waves causing significant damage to the health of millions of people around the world. This study developed a CapsNet model (named CapsNetCovid) for COVID-19 diagnosis using CT and X-ray images. The model achieved a classification accuracy, precision, sensitivity and F1-score of 99.929%, 99.887%, 100%, and 99.319%, respectively, for CT images. Moreover, it achieved a classification accuracy, precision, sensitivity, and F1-score of 94.721%, 93.864%, 92.947%, and 93.386%, respectively, for the X-ray dataset. CapsNetCovid was compared with a CNN model designed for the purpose of comparison, and it outperformed the model on both standard and augmented CT and X-ray images. CapsNetCovid was also compared with two state-of-the-art pre-trained models, namely DenseNet121 and ResNet50. CapsNetCovid outperformed the two models for the standard CT and X-ray image dataset.
Moreover, the results show that CapsNetCovid is more resistant to image rotations and affine transformations than CNN, DenseNet121 and ResNet50 for CT and X-Ray images. Furthermore, the results show that the CapsNet is more resistant to image rotations and transformations for binary classification than multi-class classification. Furthermore, the results show that the CapsNet performs better when applied to randomly rotated and flipped images compared to shifted images. The results also suggest that data augmentation can be used to improve the performance of the CapsNet for multi-class classification. Data augmentation can also be used to improve the overall generalization performance of the CapsNet. Future research can focus on improving the generalization performance of the CapsNet and the robustness of the CapsNet for image rotations and transformations, especially for multi-class classification problems.


