

Serum Ferritin Levels in Severe Obstructive Sleep Apnea

 , , and
Abstract
1. Introduction
2. Methods
2.1. Study Participants and Data Collection
- − AHI-apnea–hypopnea index: apneas and hypopneas/h;
- − AI-apnea index: apneic events/h;
- − ARI-arousal index: arousal/h);
- − HI-hypopnea index: hypopnea events/h;
- − ODI-oxygen desaturation index: oxygen desaturation events (≥4%)/h;
- − Percentage of N3 sleep (slow-wave sleep);
- − Percentage of REM sleep;
- − PLM-total number of periodic limb movements;
- − SI-snoring index: snoring events/h;
- − TST-total sleep time in minutes; and
- − t90-percentage of oxygen desaturation lower than 90%.
- (1)
- all male and female patients with AHI <15/h (“none/mild”);
- (2)
- all male and female patients with AHI 15–30/h (“moderate”);
- (3)
- all male and female patients with AHI >30/h (“severe”).
2.2. Statistical Analysis
2.3. Ethical Statement
3. Results
3.1. The Study Population
3.2. Between Group Comparison of Polysomnographic Parameters
3.3. Ferritin, C-Reactive Protein, and Hemoglobin Serum Levels
4. Discussion
5. Conclusions
Author Contributions
Funding
Institutional Review Board Statement
Informed Consent Statement
Data Availability Statement
Conflicts of Interest
References
- Franklin, K.A.; Lindberg, E. Obstructive Sleep Apnea Is a Common Disorder in the Population—A Review on the Epidemiology of Sleep Apnea. J. Thorac. Dis. 2015, 7, 1311–1322. [Google Scholar]
- Eckert, D.J.; White, D.P.; Jordan, A.S.; Malhotra, A.; Wellman, A. Defining phenotypic causes of obstructive sleep apnea. Identification of novel therapeutic targets. Am. J. Respir. Crit. Care Med. 2013, 188, 996–1004. [Google Scholar] [CrossRef] [PubMed]
- Malhotra, A.; White, D.P. Obstructive sleep Apnoea. Lancet 2002, 360, 237–245. [Google Scholar] [CrossRef]
- Redline, S.; Kump, K.; Tishler, P.V.; Browner, I.; Ferrette, V. Gender differences in sleep disordered breathing in a community-based sample. Am. J. Respir. Crit. Care Med. 1994, 149, 722–726. [Google Scholar] [CrossRef]
- Young, T.; Palta, M.; Dempsey, J.; Skatrud, J.; Weber, S.; Badr, S. The Occurrence of Sleep-Disordered Breathing among Middle-Aged Adults. N. Engl. J. Med. 1993, 328, 1230–1235. [Google Scholar] [CrossRef]
- Bahr, K.; Bopp, M.; Kewader, W.; Dootz, H.; Döge, J.; Huppertz, T.; Simon, P.; Prokosch-Willing, V.; Matthias, C.; Gouveris, H. Obstructive sleep apnea as a risk factor for primary open angle glaucoma and ocular hypertension in a monocentric pilot study. Respir. Res. 2020, 21, 258. [Google Scholar] [CrossRef]
- Bahr, K.; Simon, P.; Leggewie, B.; Gouveris, H.; Schattenberg, J. The Snoring Index Identifies Risk of Non-Alcoholic Fatty Liver Disease in Patients with Obstructive Sleep Apnea Syndrome. Biology 2021, 11, 10. [Google Scholar] [CrossRef] [PubMed]
- Huppertz, T.; Horstmann, V.; Scharnow, C.; Ruckes, C.; Bahr, K.; Matthias, C.; Gouveris, H. Osa in Patients with Head and Neck Cancer Is Associated with Cancer Size and Oncologic Outcome. Eur. Arch. Otorhinolaryngol. 2021, 278, 2485–2491. [Google Scholar] [CrossRef] [PubMed]
- Loke, Y.K.; Brown, J.W.; Kwok, C.S.; Niruban, A.; Myint, P.K. Association of Obstructive Sleep Apnea with Risk of Serious Cardiovascular Events: A Systematic Review and Meta-Analysis. Circ. Cardiovasc. Qual. Outcomes 2012, 5, 720–728. [Google Scholar] [CrossRef]
- Marin, J.M.; Carrizo, S.J.; Vicente, E.; Agusti, A.G. Long-Term Cardiovascular Outcomes in Men with Obstructive Sleep Apnoea-Hypopnoea with or without Treatment with Continuous Positive Airway Pressure: An Observational Study. Lancet 2005, 365, 1046–1053. [Google Scholar] [CrossRef]
- Peppard, P.E.; Young, T.; Palta, M.; Skatrud, J. Prospective Study of the Association between Sleep-Disordered Breathing and Hypertension. N. Engl. J. Med. 2000, 342, 1378–1384. [Google Scholar] [CrossRef] [PubMed]
- Seifen, C.; Pordzik, J.; Ludwig, K.; Bahr, K.; Schupp, C.; Matthias, C.; Simon, P.; Gouveris, H. Obstructive Sleep Apnea Disrupts Glycemic Control in Obese Individuals. Medicina 2022, 58, 1602. [Google Scholar] [CrossRef]
- Wang, W.; Knovich, M.A.; Coffman, L.G.; Torti, F.M.; Torti, S.V. Serum ferritin: Past, present and future. Biochim. Biophys. Acta 2010, 1800, 760–769. [Google Scholar] [CrossRef] [PubMed]
- Kim, M.K.; Baek, K.H.; Song, K.-H.; Kang, M.I.; Choi, J.H.; Bae, J.C.; Park, C.-Y.; Lee, W.-Y.; Oh, K.W. Increased serum ferritin predicts the development of hypertension among middle-aged men. Am. J. Hypertens. 2012, 25, 492–497. [Google Scholar] [CrossRef] [PubMed]
- Salonen, J.T.; Tuomainen, T.-P.; Nyyssönen, K.; Lakka, H.-M.; Punnonen, K. Relation between iron stores and non-insulin dependent diabetes in men: Case-control study. Br. Med. J. 1998, 317, 727–730. [Google Scholar] [CrossRef] [PubMed]
- Zhou, Y.; Liu, T.; Tian, C.; Kang, P.; Jia, C. Association of serum ferritin with coronary artery disease. Clin. Biochem. 2012, 45, 1336–1341. [Google Scholar] [CrossRef]
- Lee, B.-K.; Kim, Y.; Kim, Y.-I. Association of serum ferritin with metabolic syndrome and diabetes mellitus in the South Korean general population according to the Korean National Health and Nutrition Examination Survey 2008. Metabolism 2011, 60, 1416–1424. [Google Scholar] [CrossRef]
- Kell, D.B.; Pretorius, E. Serum ferritin is an important inflammatory disease marker, as it is mainly a leakage product from damaged cells. Metallomics 2014, 6, 748–773. [Google Scholar] [CrossRef]
- Taylor, M.D.; Allada, V.; Moritz, M.L.; Nowalk, A.J.; Sindhi, R.; Aneja, R.K.; Torok, K.; Morowitz, M.J.; Michaels, M.; Carcillo, J.A. Use of C-Reactive Protein and Ferritin Biomarkers in Daily Pediatric Practice. Pediatr. Rev. 2020, 41, 172–183. [Google Scholar] [CrossRef]
- Abbaspour, N.; Hurrell, R.; Kelishadi, R. Review on iron and its importance for human health. J. Res. Med. Sci. 2014, 19, 164–174. [Google Scholar]
- Koperdanova, M.; Cullis, J.O. Interpreting raised serum ferritin levels. Br. Med. J. 2015, 351, h3692–h3695. [Google Scholar] [CrossRef]
- American Academy of Sleep Medicine. The International Classification of Sleep Disorders, 3rd ed.; American Academy of Sleep Medicine: Darien, IL, USA, 2014. [Google Scholar]
- O’Brien, L.M.; Koo, J.; Fan, L.; Owusu, J.T.; Chotinaiwattarakul, W.; Felt, B.T.; Chervin, R.D. Iron stores, periodic leg movements, and sleepiness in obstructive sleep apnea. J. Clin. Sleep Med. 2009, 5, 525–531. [Google Scholar] [CrossRef] [PubMed]
- Hoffstein, V.; Herridge, M.; Mateika, S.; Redline, S.; Strohl, K.P. Hematocrit Levels in Sleep Apnea. Chest 1994, 106, 787–791. [Google Scholar] [CrossRef]
- Ming, X.; Li, Z.; Yang, X.; Cai, W.; Wang, G.; Yang, M.; Pan, D.; Yuan, Y.; Chen, X. Serum transferrin level is associated with the severity of obstructive sleep apnea independently of obesity: A propensity score-match observational study. Obes. Facts 2022, 15, 487–497. [Google Scholar] [CrossRef] [PubMed]
- Thorarinsdottir, E.H.; Arnardottir, E.S.; Benediktsdottir, B.; Janson, C.; Olafsson, I.; Pack, A.I.; Gislason, T.; Keenan, B.T. Serum ferritin and obstructive sleep apnea—Epidemiological study. Sleep Breath. 2017, 22, 663–672. [Google Scholar] [CrossRef] [PubMed]
- Abakay, O.; Abakay, A.; Palanci, Y.; Yuksel, H.; Sen, H.S.; Evliya, O.; Tanrikulu, A.C. Relationship between hepcidin levels and periodic limb movement disorder in patients with obstructive sleep apnea syndrome. Sleep Breath. 2014, 19, 459–466. [Google Scholar] [CrossRef]
- Ahmed, R.I.; Hendy, R.M.; Ahmed, M.I.; Ali, S.A.; AboOmira, M.H.; Shaban, M.M. Periodic limb movement index and severity of obstructive sleep apnea. Egypt. J. Bronchol. 2022, 16, 35. [Google Scholar] [CrossRef]
- Simakajornboon, N.; Gozal, D.; Vlasic, V.; Mack, C.; Sharon, D.; McGinley, B.M. Periodic Limb Movements in Sleep and Iron Status in Children. Sleep 2003, 26, 735–738. [Google Scholar] [CrossRef]
- Patel, A.K.; Reddy, V.; Shumway, K.R.; Araujo, J.F. Physiology, Sleep Stages. In StatPearls [Internet]; StatPearls Publishing: Treasure Island, FL, USA, 2022. [Google Scholar]
- Halasz, P.; Terzano, M.; Parrino, L.; Bodizs, R. The nature of arousal in sleep. J. Sleep Res. 2004, 13, 1–23. [Google Scholar] [CrossRef]
- Youssef, J.; Singh, K.; Huntington, N.; Becker, R.; Kothare, S. Relationship of Serum Ferritin Levels to Sleep Fragmentation and Periodic Limb Movements of Sleep on Polysomnography in Autism Spectrum Disorders. Pediatr. Neurol. 2013, 49, 274–278. [Google Scholar] [CrossRef]
- Gouveris, H.; Bahr, K.; Jahn, C.; Matthias, C.; Simon, P. The Apnea–Hypopnea Index Underestimates Systemic Inflammation in Women with Sleep-Disordered Breathing. J. Women’s Health 2018, 27, 920–926. [Google Scholar] [CrossRef] [PubMed]
- Oshaug, A.; Bugge, K.H.; Bjønnes, C.H.; Borch-Iohnsen, B.; Neslein, I.L. Associations between serum ferritin and cardiovascular risk factors in healthy young men. A cross sectional study. Eur. J. Clin. Nutr. 1995, 49, 430–438. [Google Scholar] [PubMed]


| None/Mild | Moderate | Severe | Between Group Comparison (p-Value) | |
|---|---|---|---|---|
| Number of patients | 30 | 31 | 29 | not significant |
| Number of female patients (%) | 8 (26.7) | 7 (22.6) | 2 (6.9) | not significant |
| Age in years (±SD) | 42.11 ± 12.99 | 44.21 ± 11.48 | 48.06 ± 6.92 | not significant |
| BMI in kg/m2 (IQR) | 25 (23–27.3) | 28 (26–30) | 30 (26.5–32.5) | p < 0.05 for none/mild vs. moderate, p < 0.001 for none/mild vs. severe |
| None/Mild | Moderate | Severe | Between Group Comparison (p-Value) | |
|---|---|---|---|---|
| AHI in n/h (IQR) | 9.3 (6.2–12.7) | 23.5 (18.4–26.9) | 42.5 (33.5–62.3) | p < 0.001 for all groups |
| AI in n/h (IQR) | 1.8 (0.6–3.7) | 4.8 (1.9–10.1) | 19.3 (11.8–42.3) | p < 0.01 for none/mild vs. moderate, p < 0.001 for all other groups |
| HI in n/h (±SD) | 6.7 ± 3.3 | 15.9 ± 5.3 | 21.6 ± 12.8 | p < 0.05 for moderate vs. severe, p < 0.001 for all other groups |
| SI in n/h (IQR) | 42 (5.2–125.5) | 112.8 (34.2–296.2) | 264.4 (133.1–416.2) | p < 0.001 for none/mild vs. severe |
| ODI in n/h (IQR) | 7 (4.2–11.6) | 19.5 (14.3–23.8) | 37.6 (28.7–61.7) | p < 0.001 for all groups |
| t90 in % (IQR) | 0 (0–0.2) | 0.5 (0.1–1) | 3.1 (0.8–10.9) | p < 0.05 for none/mild vs. moderate, p < 0.01 for moderate vs. severe, p < 0.001 for none/mild vs. severe |
| PLM in total (IQR) | 15 (5–49) | 25 (8.4–129) | 78 (14.5–191.5) | p < 0.05 for none/mild vs. severe |
| TST in min (IQR) | 374.6 (322.5–399.5) | 370.9 (333.6–420.4) | 368.2 (326.6–396.1) | not significant |
| N3 sleep in % (±SD) | 18.9 ± 8.9 | 18.5 ± 9.6 | 12 ± 6 | p < 0.01 for none/mild vs. severe, p < 0.01 for moderate vs. severe |
| REM sleep in % (±SD) | 17.3 ± 5.5 | 18.9 ± 5.1 | 16.1 ± 6.4 | not significant |
| ARI in n/h (IQR) | 10.8 (7.5–15.8) | 13.1 (10.2–18.2) | 21.6 (16.1–29.5) | p < 0.001 for none/mild vs. severe, p < 0.01 for moderate vs. severe |
| None/Mild | Moderate | Severe | Between Group Comparison (p-Value) | |
|---|---|---|---|---|
| Serum ferritin level in ng/mL (IQR) | 111 (41.8–167) | 121 (93–184) | 154 (81.5–244) | not significant |
| Serum CRP level in mg/L (IQR) | 1 (0.7–2) | 1.5 (0.6–2.8) | 1.4 (0.9–2.3) | not significant |
| Serum hemoglobin level in g/dL (±SD) | 14.8 ± 1.2 | 15 ± 1.2 | 15.1 ± 1.2 | not significant |
| x | y | Estimate | Standard Error | t-Value | r | p-Value |
|---|---|---|---|---|---|---|
| Age | Log10 AHI | 0.0090 | 0.0033 | 2.6856 | 0.2767 | 0.0087 |
| Log10 BMI | Log10 AHI | 1.2309 | 0.4758 | 2.5869 | 0.2673 | 0.0113 |
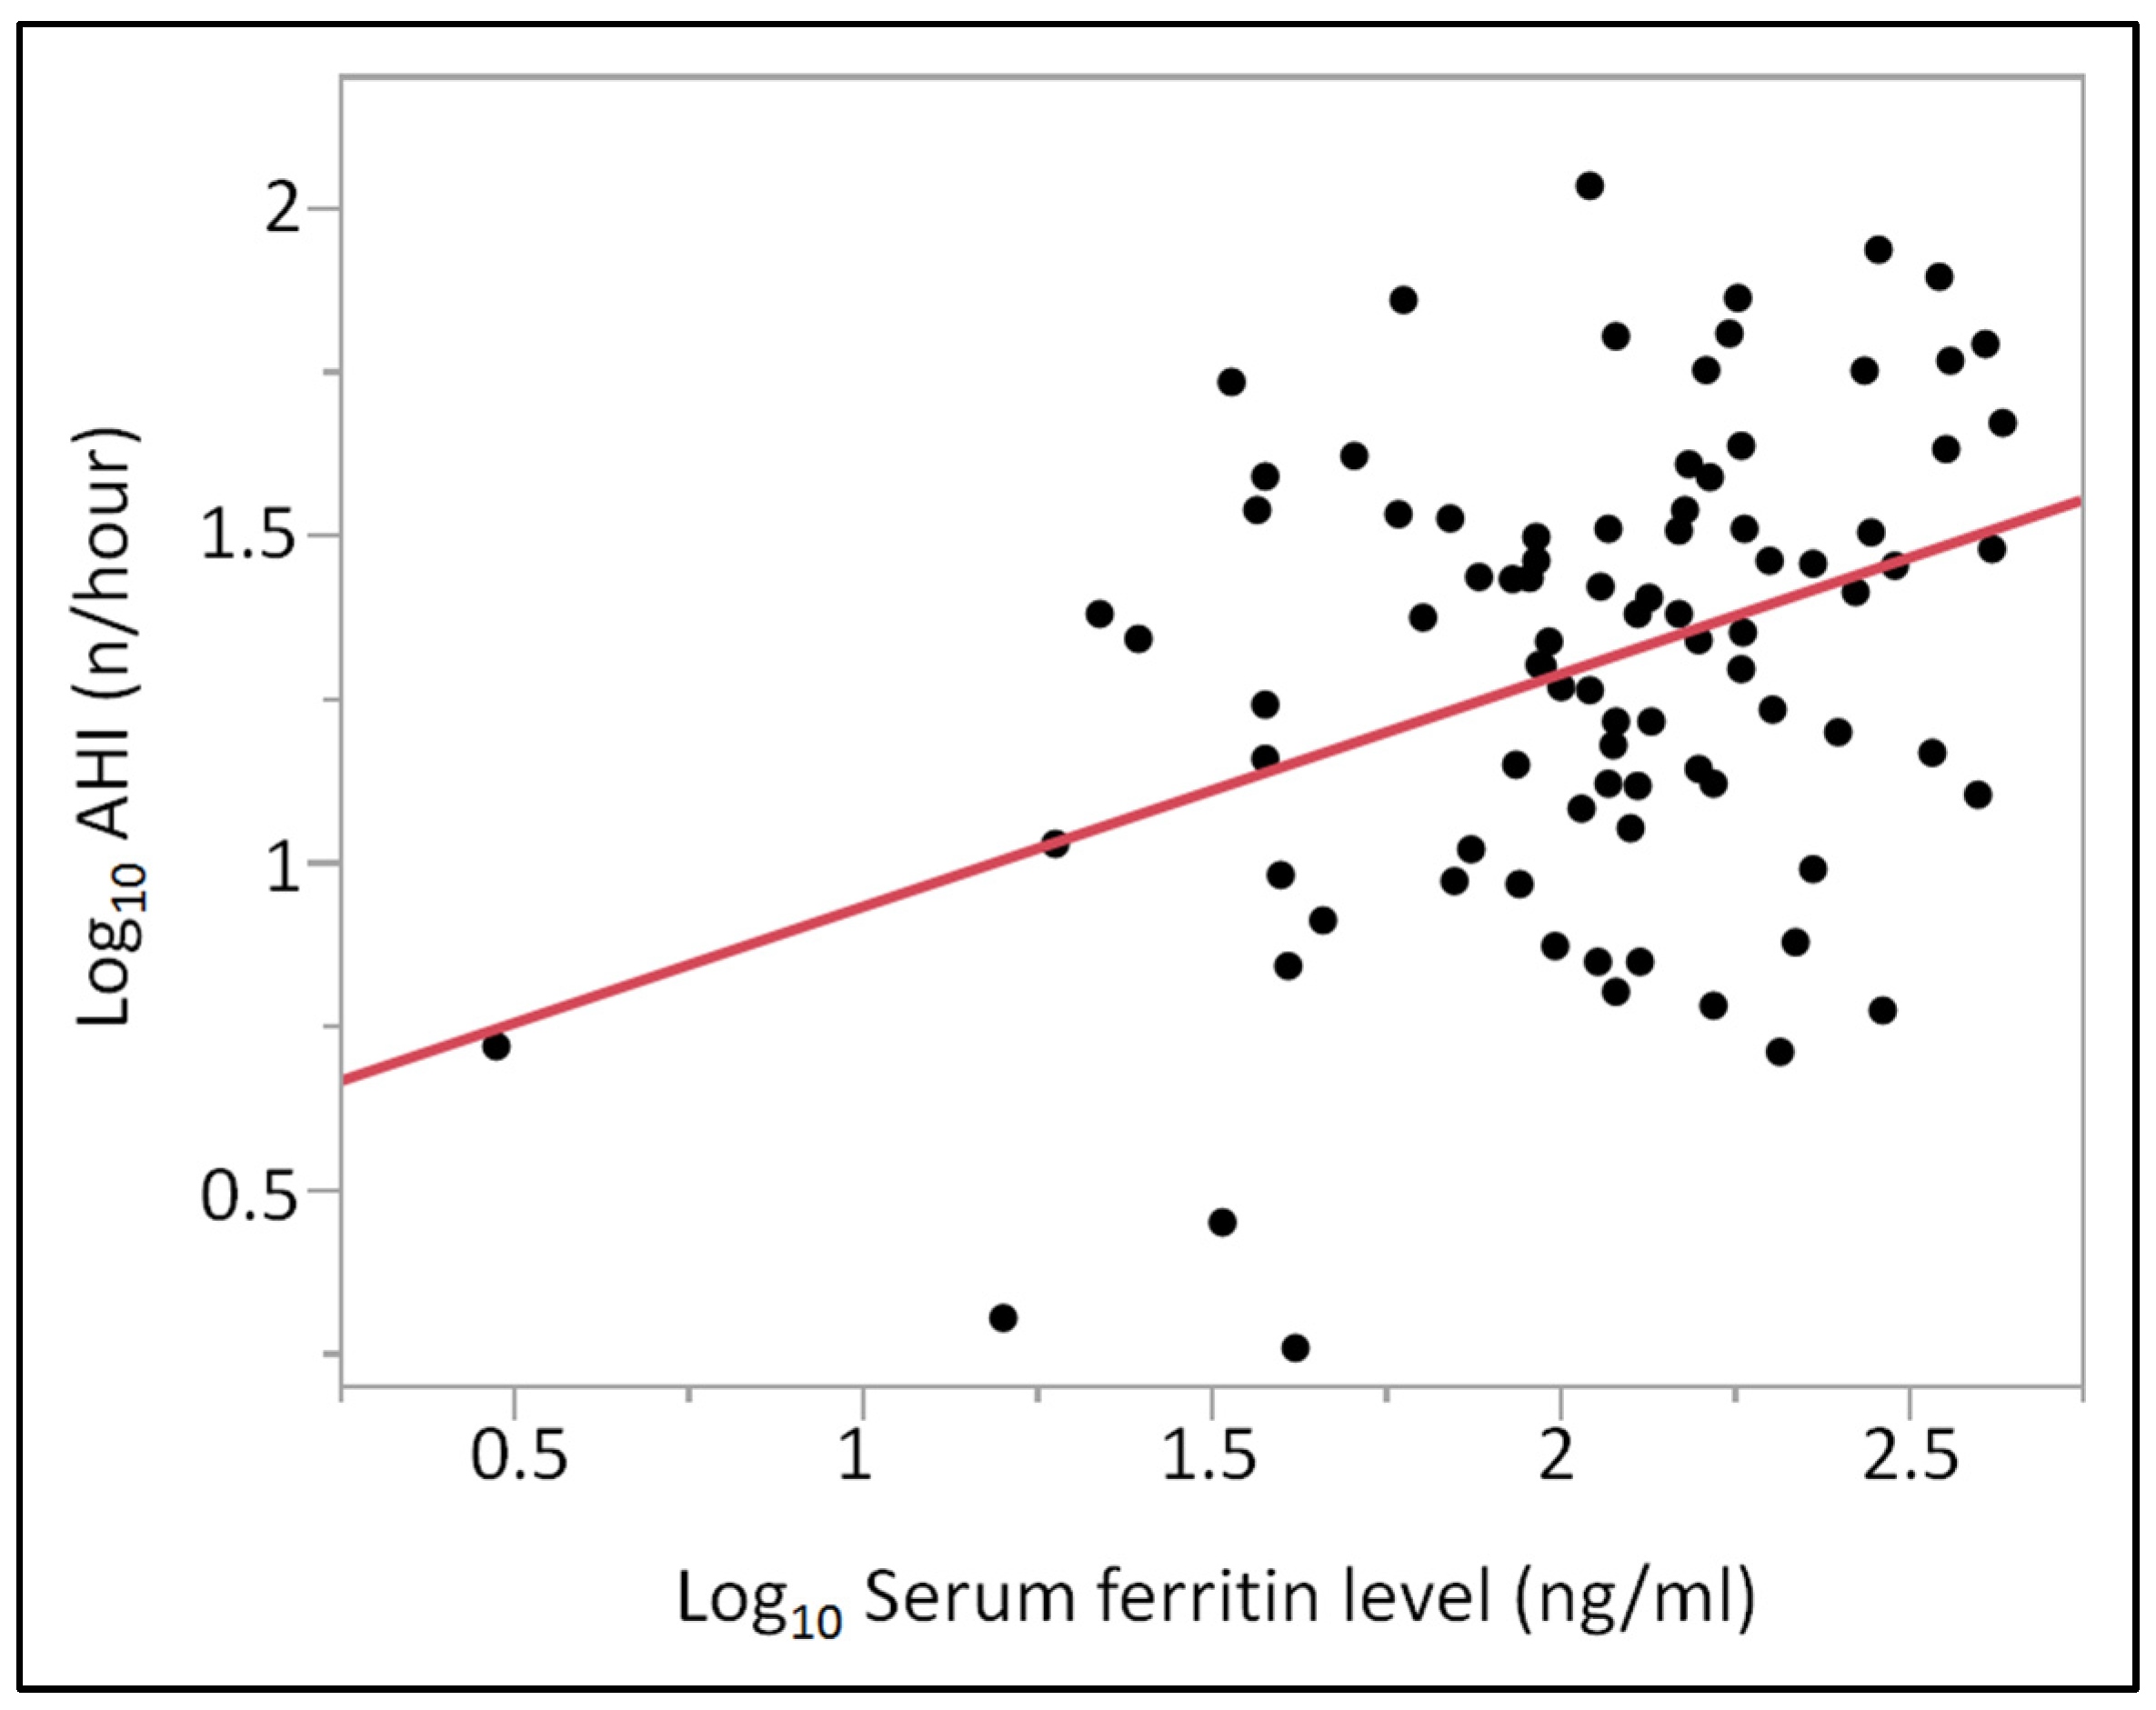
| Log10 Ferritin | Log10 AHI | 0.3507 | 0.1098 | 3.1943 | 0.3240 | 0.0020 |
| Log10 CRP | Log10 AHI | 0.2152 | 0.1008 | 2.1345 | 0.2231 | 0.0356 |
| Log10 Ferritin (adjusted for age) | Log10 AHI | 0.2987 | 0.0987 | 3.0274 | 0.3639 | 0.0032 |
Disclaimer/Publisher’s Note: The statements, opinions and data contained in all publications are solely those of the individual author(s) and contributor(s) and not of MDPI and/or the editor(s). MDPI and/or the editor(s) disclaim responsibility for any injury to people or property resulting from any ideas, methods, instructions or products referred to in the content. |
© 2023 by the authors. Licensee MDPI, Basel, Switzerland. This article is an open access article distributed under the terms and conditions of the Creative Commons Attribution (CC BY) license (https://creativecommons.org/licenses/by/4.0/).
Share and Cite
Seifen, C.; Pordzik, J.; Huppertz, T.; Hackenberg, B.; Schupp, C.; Matthias, C.; Simon, P.; Gouveris, H. Serum Ferritin Levels in Severe Obstructive Sleep Apnea. Diagnostics 2023, 13, 1154. https://doi.org/10.3390/diagnostics13061154
Seifen C, Pordzik J, Huppertz T, Hackenberg B, Schupp C, Matthias C, Simon P, Gouveris H. Serum Ferritin Levels in Severe Obstructive Sleep Apnea. Diagnostics. 2023; 13(6):1154. https://doi.org/10.3390/diagnostics13061154
Chicago/Turabian StyleSeifen, Christopher, Johannes Pordzik, Tilman Huppertz, Berit Hackenberg, Cornelia Schupp, Christoph Matthias, Perikles Simon, and Haralampos Gouveris. 2023. "Serum Ferritin Levels in Severe Obstructive Sleep Apnea" Diagnostics 13, no. 6: 1154. https://doi.org/10.3390/diagnostics13061154
APA StyleSeifen, C., Pordzik, J., Huppertz, T., Hackenberg, B., Schupp, C., Matthias, C., Simon, P., & Gouveris, H. (2023). Serum Ferritin Levels in Severe Obstructive Sleep Apnea. Diagnostics, 13(6), 1154. https://doi.org/10.3390/diagnostics13061154