
Undernutrition Scored Using the CONUT Score with Hypoglycemic Status in ICU-Admitted Elderly Patients with Sepsis Shows Increased ICU Mortality


Abstract
1. Introduction
2. Materials and Methods
2.1. CONUT Score
2.2. Statistical Analyses
3. Results
4. Discussion
Supplementary Materials
Author Contributions
Funding
Institutional Review Board Statement
Informed Consent Statement
Data Availability Statement
Conflicts of Interest
References
- Lew, C.C.H.; Yandell, R.; Fraser, R.J.L.; Chua, A.P.; Chong, M.F.F.; Miller, M. Association Between Malnutrition and Clinical Outcomes in the Intensive Care Unit: A Systematic Review. JPEN J. Parenter. Enter. Nutr. 2017, 41, 744–758. [Google Scholar] [CrossRef] [PubMed]
- Singer, P.; Blaser, A.R.; Berger, M.M.; Alhazzani, W.; Calder, P.C.; Casaer, M.P.; Hiesmayr, M.; Mayer, K.; Montejo, J.C.; Pichard, C.; et al. ESPEN Guideline on Clinical Nutrition in the Intensive Care Unit. Clin. Nutr. 2019, 38, 48–79. [Google Scholar] [CrossRef] [PubMed]
- Berkman, P.; Merdler, C.; Yust, I. Hypoglycemia as a Manifestation of Sepsis in an Elderly Patient. J. Am. Geriatr. Soc. 1985, 33, 644–645. [Google Scholar] [CrossRef] [PubMed]
- Bellomo, R.; Egi, M. Hypoglycemia in Sepsis: Biomarker, Mediator, or Both? Crit. Care Med. 2011, 39, 2367–2369. [Google Scholar] [CrossRef] [PubMed]
- Ssekitoleko, R.; Jacob, S.T.; Banura, P.; Pinkerton, R.; Meya, D.B.; Reynolds, S.J.; Kenya-Mugisha, N.; Mayanja-Kizza, H.; Muhindo, R.; Bhagani, S.; et al. Hypoglycemia at Admission Is Associated with in Hospital Mortality in Ugandan Patients with Severe Sepsis. Crit. Care Med. 2011, 39, 2271–2276. [Google Scholar] [CrossRef] [PubMed]
- Egi, M.; Bellomo, R.; Stachowski, E.; French, C.J.; Hart, G.K.; Taori, G.; Hegarty, C.; Bailey, M. Hypoglycemia and Outcome in Critically Ill Patients. Mayo Clin. Proc. 2010, 85, 217–224. [Google Scholar] [CrossRef] [PubMed]
- Furukawa, M.; Kinoshita, K.; Yamaguchi, J.; Hori, S.; Sakurai, A. Sepsis Patients with Complication of Hypoglycemia and Hypoalbuminemia Are an Early and Easy Identification of High Mortality Risk. Intern. Emerg. Med. 2019, 14, 539–548. [Google Scholar] [CrossRef]
- Cederholm, T.; Jensen, G.L.; Correia, M.I.T.D.; Gonzalez, M.C.; Fukushima, R.; Higashiguchi, T.; Baptista, G.; Barazzoni, R.; Blaauw, R.; Coats, A.J.S.; et al. GLIM Criteria for the Diagnosis of Malnutrition—A Consensus Report from the Global Clinical Nutrition Community. J. Cachexia Sarcopenia Muscle. 2019, 10, 207–217. [Google Scholar] [CrossRef]
- Hiesmayr, M.; Schindler, K.; Pernicka, E.; Schuh, C.; Schoeniger-Hekele, A.; Bauer, P.; Laviano, A.; Lovell, A.D.; Mouhieddine, M.; Schuetz, T.; et al. Decreased Food Intake Is a Risk Factor for Mortality in Hospitalised Patients: The Nutrition Day Survey 2006. Clin. Nutr. 2009, 28, 484–491. [Google Scholar] [CrossRef]
- Heyland, D.K.; Dhaliwal, R.; Jiang, X.; Day, A.G. Identifying Critically Ill Patients Who Benefit the Most from Nutrition Therapy: The Development and Initial Validation of a Novel Risk Assessment Tool. Crit. Care. 2011, 15, R268. [Google Scholar] [CrossRef]
- González-Madroño, A.; Mancha, A.; Rodríguez, F.J.; Culebras, J.; de Ulibarri, J.I. Confirming the Validity of the CONUT System for Early Detection and Monitoring of Clinical Undernutrition: Comparison with Two Logistic Regression Models Developed Using SGA as the Gold Standard. Nutr. Hosp. 2012, 27, 564–571. [Google Scholar] [CrossRef] [PubMed]
- Marcason, W. Should Albumin and Prealbumin Be Used as Indicators for Malnutrition? J. Acad. Nutr. Diet. 2017, 117, 1144. [Google Scholar] [CrossRef] [PubMed]
- Agnello, L.; Giglio, R.V.; Bivona, G.; Scazzone, C.; Gambino, C.M.; Iacona, A.; Ciaccio, A.M.; Lo Sasso, B.; Ciaccio, M. The Value of a Complete Blood Count (CBC) for Sepsis Diagnosis and Prognosis. Diagnostics 2021, 11, 1881. [Google Scholar] [CrossRef]
- Hofmaenner, D.A.; Kleyman, A.; Press, A.; Bauer, M.; Singer, M. The Many Roles of Cholesterol in Sepsis: A Review. Am. J. Respir. Crit. Care Med. 2022, 205, 388–396. [Google Scholar] [CrossRef] [PubMed]
- Yamaguchi, J.; Nagase, M.; Yamamoto, Y.; Sakurai, A.; Kubo, A.; Mitsuhashi, H.; Matsuoka, M.; Ihara, S.; Kinoshita, K. Increased Oxidative Stress and Renal Injury in Patients with Sepsis. J. Clin. Biochem. Nutr. 2018, 63, 137–143. [Google Scholar] [CrossRef] [PubMed]
- Yamaguchi, J.; Kinoshita, K.; Ihara, S.; Furukawa, M.; Sakurai, A. The Clinical Significance of Low Serum Arachidonic Acid in Sepsis Patients with Hypoalbuminemia. Intern. Med. 2018, 57, 1833–1840. [Google Scholar] [CrossRef]
- Singer, M.; Deutschman, C.S.; Seymour, C.W.; Shankar-Hari, M.; Annane, D.; Bauer, M.; Bellomo, R.; Bernard, G.R.; Chiche, J.D.; Coopersmith, C.M.; et al. The Third International Consensus Definitions for Sepsis and Septic Shock (Sepsis-3). JAMA 2016, 315, 801–810. [Google Scholar] [CrossRef]
- Knaus, W.A.; Draper, E.A.; Wagner, D.P.; Zimmerman, J.E. Apache II: A Severity of Disease Classification System. Crit. Care Med. 1985, 13, 818–829. [Google Scholar] [CrossRef]
- Vincent, J.L.; Moreno, R.; Takala, J.; Willatts, S.; De Mendonça, A.; Bruining, H.; Reinhart, C.K.; Suter, P.M.; Thijs, L.G. The SOFA (Sepsis-Related Organ Failure Assessment) Score to Describe Organ Dysfunction/Failure. On Behalf of the Working Group on Sepsis-Related Problems of the European Society of Intensive Care Medicine. Intensive Care Med. 1996, 22, 707–710. [Google Scholar] [CrossRef]
- van den Berghe, G.; Wouters, P.; Weekers, F.; Verwaest, C.; Bruyninckx, F.; Schetz, M.; Vlasselaers, D.; Ferdinande, P.; Lauwers, P.; Bouillon, R. Intensive Insulin Therapy in Critically Ill Patients. N. Engl. J. Med. 2001, 345, 1359–1367. [Google Scholar] [CrossRef]
- Committee of the Japan Diabetes Society on the Diagnostic Criteria of Diabetes Mellitus; Seino, Y.; Nanjo, K.; Tajima, N.; Kadowaki, T.; Kashiwagi, A.; Araki, E.; Ito, C.; Inagaki, N.; Iwamoto, Y.; et al. Report of the Committee on the Classification and Diagnostic Criteria of Diabetes Mellitus. J. Diabetes Investig. 2010, 1, 212–228. [Google Scholar] [CrossRef] [PubMed]
- Mitani, A.; Iwai, T.; Shichinohe, T.; Takeda, H.; Kumagai, S.; Nishida, M.; Sugita, J.; Teshima, T. The Combined Usage of the Global Leadership Initiative on Malnutrition Criteria and Controlling Nutrition Status Score in Acute Care Hospitals. Ann. Nutr. Metab. 2021, 77, 178–184. [Google Scholar] [CrossRef]
- Maldonado, G.; Greenland, S. Simulation Study of Confounder-Selection Strategies. Am. J. Epidemiol. 1993, 138, 923–936. [Google Scholar] [CrossRef] [PubMed]
- Glantz, S.A.; Slinker, B.R. Primer of Applied Regression and Analysis of Variance; McGraw-Hill: New York, NY, USA, 1990. [Google Scholar]
- Giner, M.; Laviano, A.; Meguid, M.M.; Gleason, J.R. In 1995 a Correlation Between Malnutrition and Poor Outcome in Critically Ill Patients Still Exists. Nutrition 1996, 12, 23–29. [Google Scholar] [CrossRef]
- Seymour, C.W.; Liu, V.X.; Iwashyna, T.J.; Brunkhorst, F.M.; Rea, T.D.; Scherag, A.; Rubenfeld, G.; Kahn, J.M.; Shankar-Hari, M.; Singer, M.; et al. Assessment of Clinical Criteria for Sepsis: For the Third International Consensus Definitions for Sepsis and Septic Shock (Sepsis-3). JAMA 2016, 315, 762–774. [Google Scholar] [CrossRef] [PubMed]
- Godinez-Vidal, A.R.; Guzmán-Valencia, E.; De León-Rendón, J.L.; González-Calatayud, M.; López-Romero, S.C.; Gracida-Mancilla, N.I. Comparison Between the Body Mass Index and the Controlling Nutritional Status to Determine the Severity in Patients with Abdominal Sepsis. Cir. Cir. 2019, 87, 605–610. [Google Scholar] [CrossRef]
- Lang, C.H.; Dobrescu, C. Sepsis-Induced Increases in Glucose Uptake by Macrophage-Rich Tissues Persist during Hypoglycemia. Metabolism 1991, 40, 585–593. [Google Scholar] [CrossRef]
- Maitra, S.R.; Wojnar, M.M.; Lang, C.H. Alterations in Tissue Glucose Uptake during the Hyperglycemic and Hypoglycemic Phases of Sepsis. Shock 2000, 13, 379–385. [Google Scholar] [CrossRef]
- Clemens, M.G.; Chaudry, I.H.; McDermott, P.H.; Baue, A.E. Regulation of Glucose Production from Lactate in Experimental Sepsis. Am. J. Physiol. 1983, 244, R794–R800. [Google Scholar] [CrossRef]
- Stegenga, M.E.; Vincent, J.L.; Vail, G.M.; Xie, J.; Haney, D.J.; Williams, M.D.; Bernard, G.R.; van der Poll, T. Diabetes Does Not Alter Mortality or Hemostatic and Inflammatory Responses in Patients with Severe Sepsis. Crit. Care Med. 2010, 38, 539–545. [Google Scholar] [CrossRef]
- Schuetz, P.; Jones, A.E.; Howell, M.D.; Trzeciak, S.; Ngo, L.; Younger, J.G.; Aird, W.; Shapiro, N.I. Diabetes Is Not Associated with Increased Mortality in Emergency Department Patients with Sepsis. Ann. Emerg. Med. 2011, 58, 438–444. [Google Scholar] [CrossRef] [PubMed]
- van Vught, L.A.; Holman, R.; de Jonge, E.; de Keizer, N.F.; van der Poll, T. Diabetes Is Not Associated with Increased 90-Day Mortality Risk in Critically Ill Patients with Sepsis. Crit. Care Med. 2017, 45, e1026–e1035. [Google Scholar] [CrossRef] [PubMed]


| All (n = 307) | Survivors (n = 244) | Non-Survivors (n= 63) | p-Value * | |
|---|---|---|---|---|
| (A) Parameters | ||||
| Age | 74.7 ± 14.4 [21–99] | 74.7 ± 14.1 [21–99] | 74.9 ± 15.7 [24–98] | 0.547 |
| Sex (M:F) | 121:186 | 149:95 | 37:26 | 0.735 |
| APACHE II score | 24.7 ± 7.52 [2–43] | 23.9 ± 7.47 | 27.5 ± 7.06 | 0.001 |
| Ratio of septic shock (%) | 152/301 (50.5%) | 103/240 (42.9%) | 49/61 (80.3%) | <0.0001 |
| SOFA score | 8.1 ± 3.3 [0–19] | 7.6 ± 3.1 | 10.0 ± 3.3 | <0.0001 |
| WBC (×103/µL) | 12.8 ± 8.17 | 13.0 ± 8.1 | 12.2 ± 8.3 | 0.503 |
| Hemoglobin (g/dL) | 11.9 ± 3.0 | 11.9 ± 2.9 | 12.0 ± 3.1 | 0.802 |
| Hematocrit (%) | 37.2 ± 23.1 | 37.5 ± 25.4 | 36.5 ± 9.12 | 0.848 |
| Platelet (×104/µL) | 196.5 ± 112 | 205 ± 112 | 165 ± 107 | 0.002 |
| Albumin (g/dL) | 2.82 ± 0.75 | 2.91 ± 0.74 | 2.48 ± 0.72 | <0.0001 |
| T. bilirubin (mg/dL) | 1.19 ± 1.92 | 0.97 ± 0.91 | 2.03 ± 3.74 | 0.003 |
| AST | 144 ± 404 | 134 ± 420 | 183 ± 332 | 0.002 |
| ALT | 85 ± 331 | 83 ± 354 | 92 ± 221 | 0.165 |
| Na | 139 ± 11 | 140 ± 8.51 | 136 ± 17.9 | 0.101 |
| K | 4.47 ± 1.04 | 4.46 ± 1.03 | 4.49 ± 1.09 | 0.546 |
| BUN | 51.4 ± 42.6 | 50.3 ± 43.2 | 55.5 ± 40.4 | 0.091 |
| Creatinine (mg/dL) | 2.18 ± 2.50 | 2.13 ± 2.66 | 2.37 ± 1.76 | 0.011 |
| Lactate (mmol/L) | 4.92 ± 4.4 | 4.10 ± 3.50 | 8.05 ± 5.87 | <0.0001 |
| HCO3- (mmol/L) | 19.2 ± 7.21 | 20.1 ± 7.01 | 15.9 ± 7.05 | <0.0001 |
| CRP (mg/dL) | 14.3 ± 12.7 | 13.8 ± 12.6 | 16.4 ± 12.8 | 0.108 |
| AT3 | 74.0 ± 21.5 | 76.7 ± 16.9 | 63.7 ± 31.9 | <0.0001 |
| UA | 7.9 ± 4.2 | 7.80 ± 4.23 | 8.27 ± 4.17 | 0.273 |
| (B) Nutritional status | ||||
| BMI | 20.7 ± 7.8 | 20.6 ± 4.8 | 19.7 ± 4.3 | 0.198 |
| CONUT score | 6.9 ± 3.2 | 6.5 ± 3.1 | 8.3 ± 3.0 | <0.0001 |
| Lymphocyte count | 92 ± 1021 [30–9120] | 950 ± 1037 | 796 ± 957 | 0.061 |
| T-Cho (mg/dL) | 150.1 ± 70.5 [38–853] | 150.9 ± 54.7 | 147.3 ± 114 | 0.026 |
| Normal category | 13/252 (5.2%) | 12/204 (5.9%) | 1/48 (2.1%) | 0.253 |
| Light category | 56/252 (22.2%) | 49/204 (24.0%) | 7/48 (14.6%) | 0.197 |
| Moderate category | 97252 (38.5%) | 81/204 (39.7%) | 16/48 (33.3%) | 0.45 |
| Severe category | 86/252 (34.1%) | 62/204 (30.4%) | 24/48 (50.0%) | 0.004 |
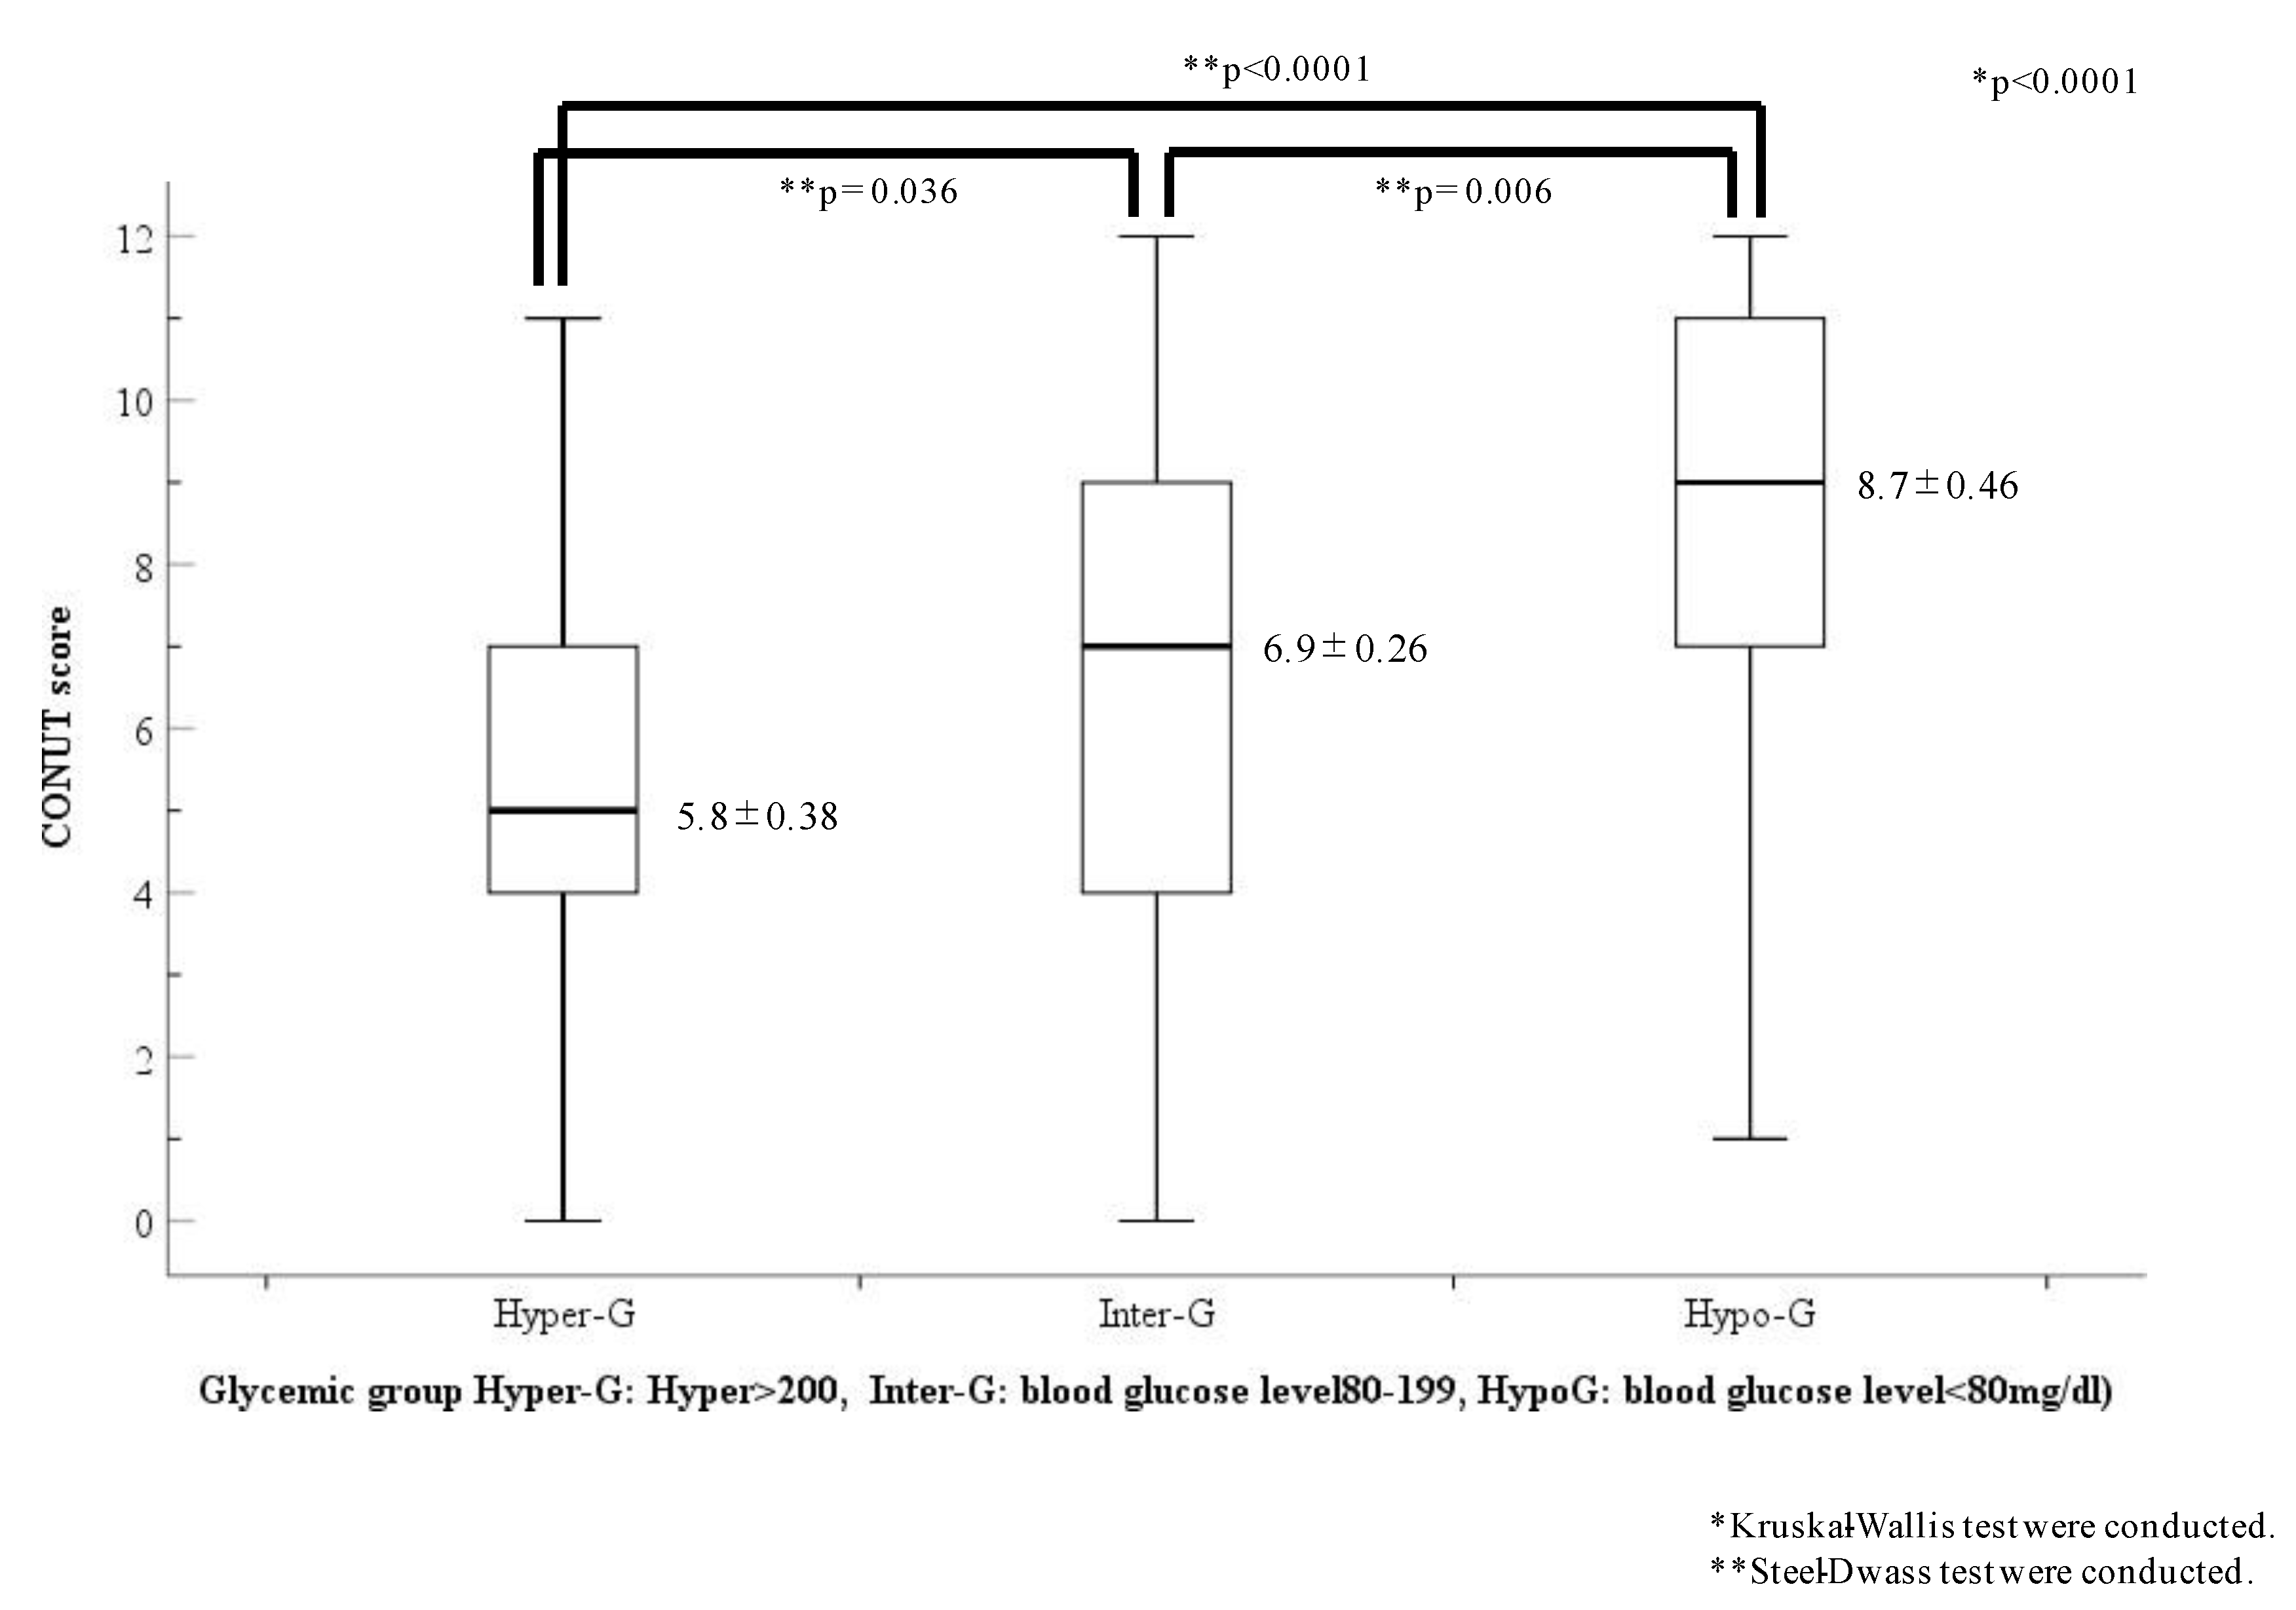
| (C) Glycemic groups | ||||
| Hypo-G | 46/304 (15.1%) | 26/243 (10.7%) | 20/61 (31.7%) | <0.0001 |
| Inter-G | 183/304 (60.2%) | 156/243 (64.2%) | 27/61 (44.3%) | <0.0001 |
| Hyper-G | 75/304 (24.7%) | 61/243 (25.1%) | 14/61 (23.0%) | <0.0001 |
| Hypo-A | 143/305 (53.1%) | 105/242 (43.4%) | 38/63 (60.3%) | 0.303 |
| (D) Glycemic status | ||||
| BG (mg/dL) | 176 ± 161 | 183 ± 158 | 147 ± 168.3 | 0.003 |
| HbA1c (NGSP (%)) | 6.1 ± 1.21 | 6.11 ± 1.13 | 5.98 ± 1.48 | 0.117 |
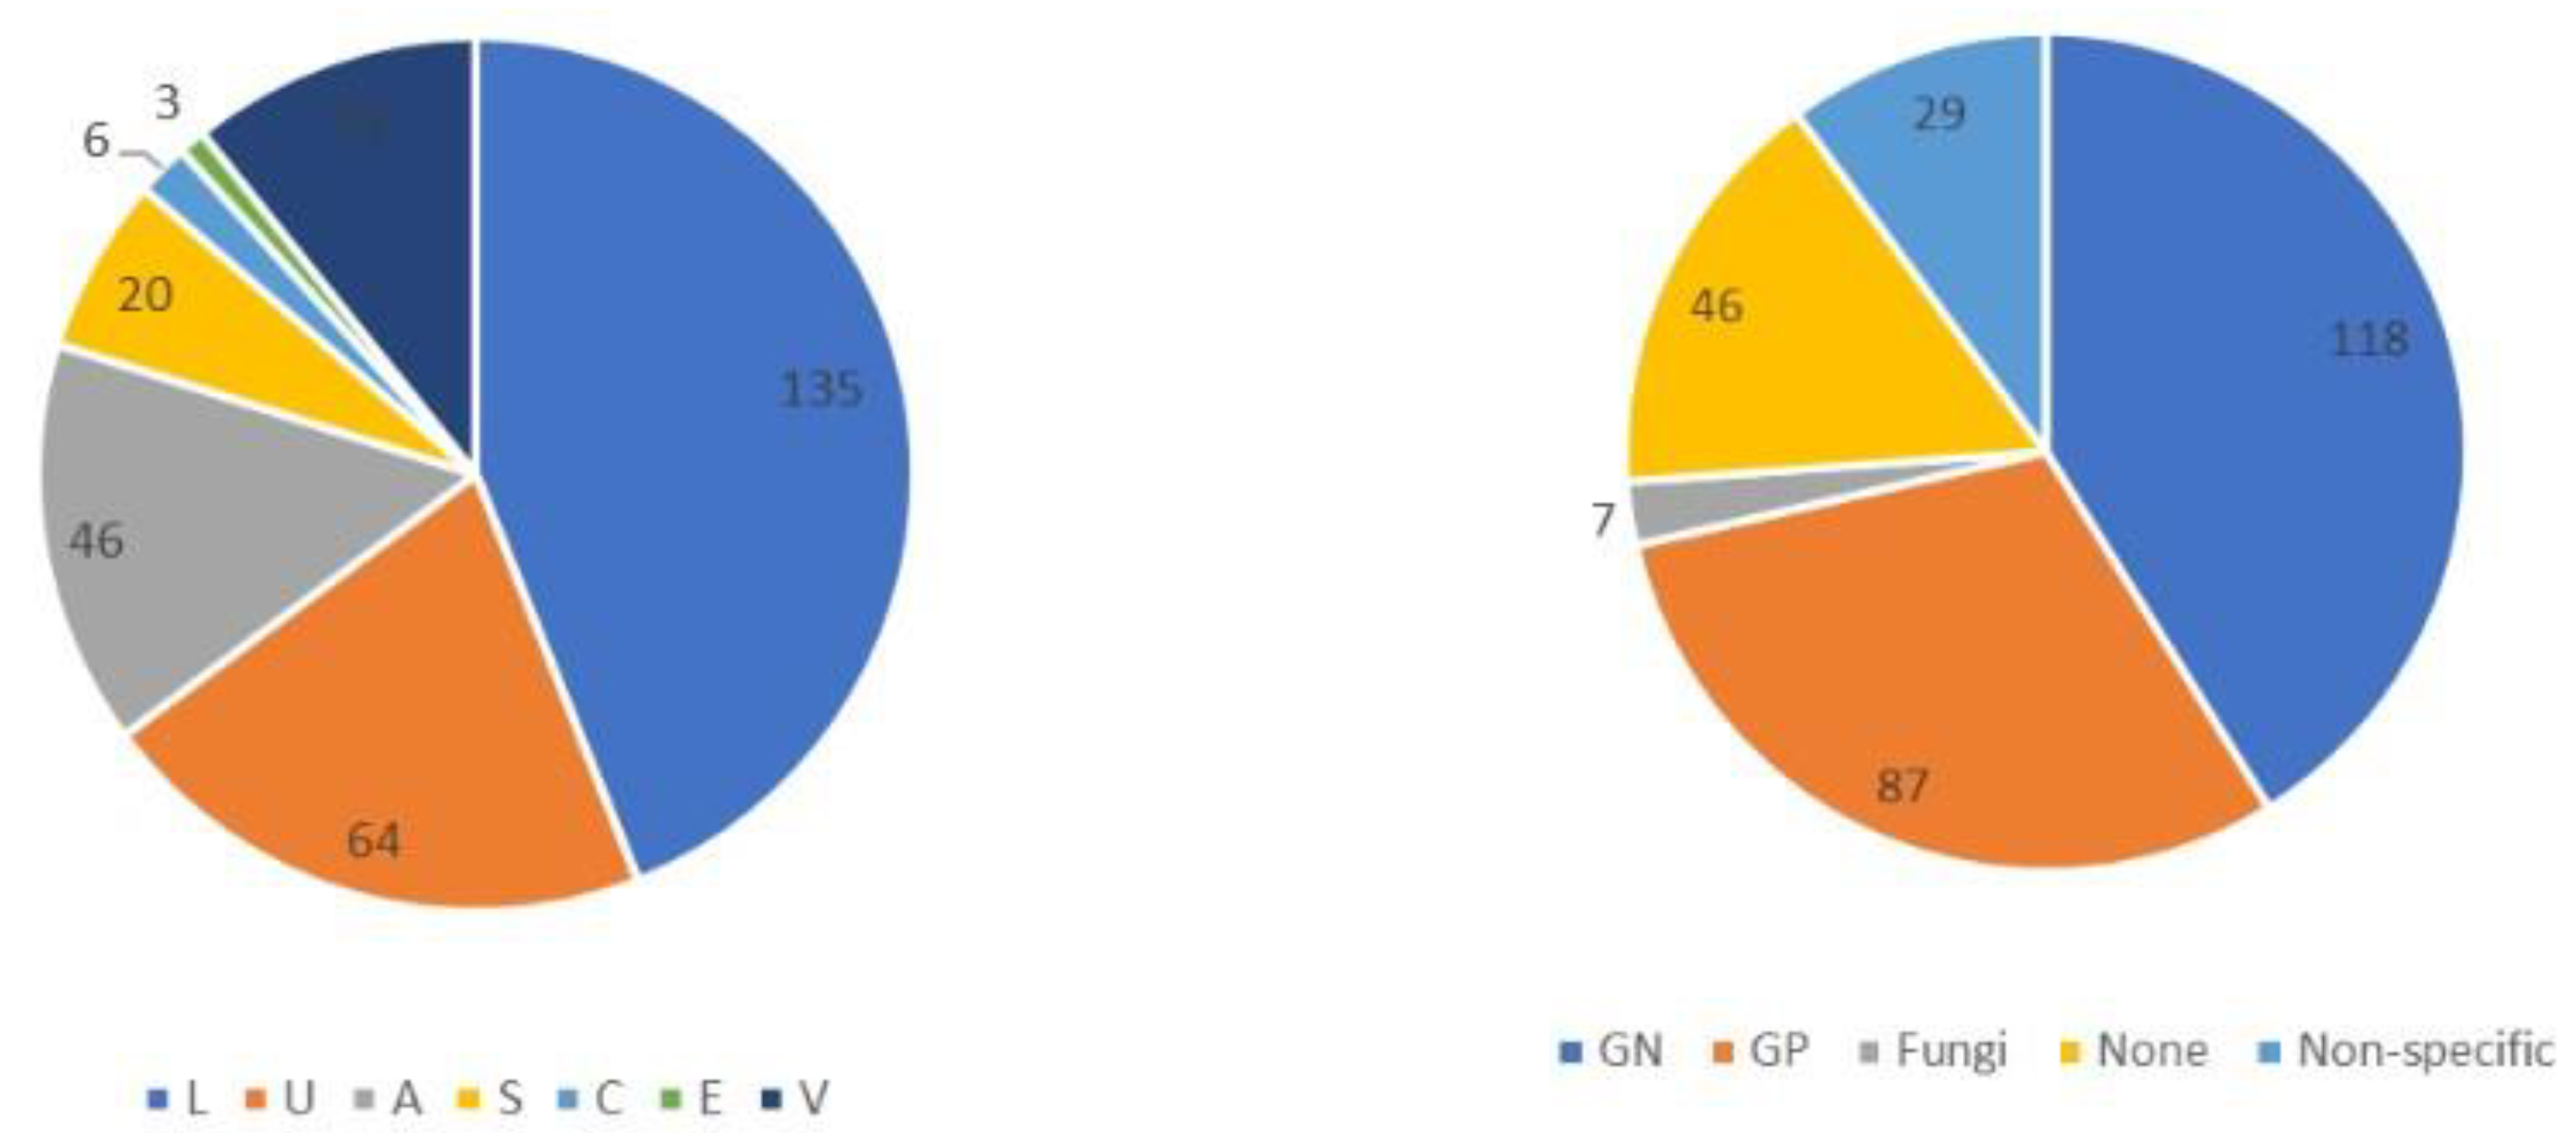
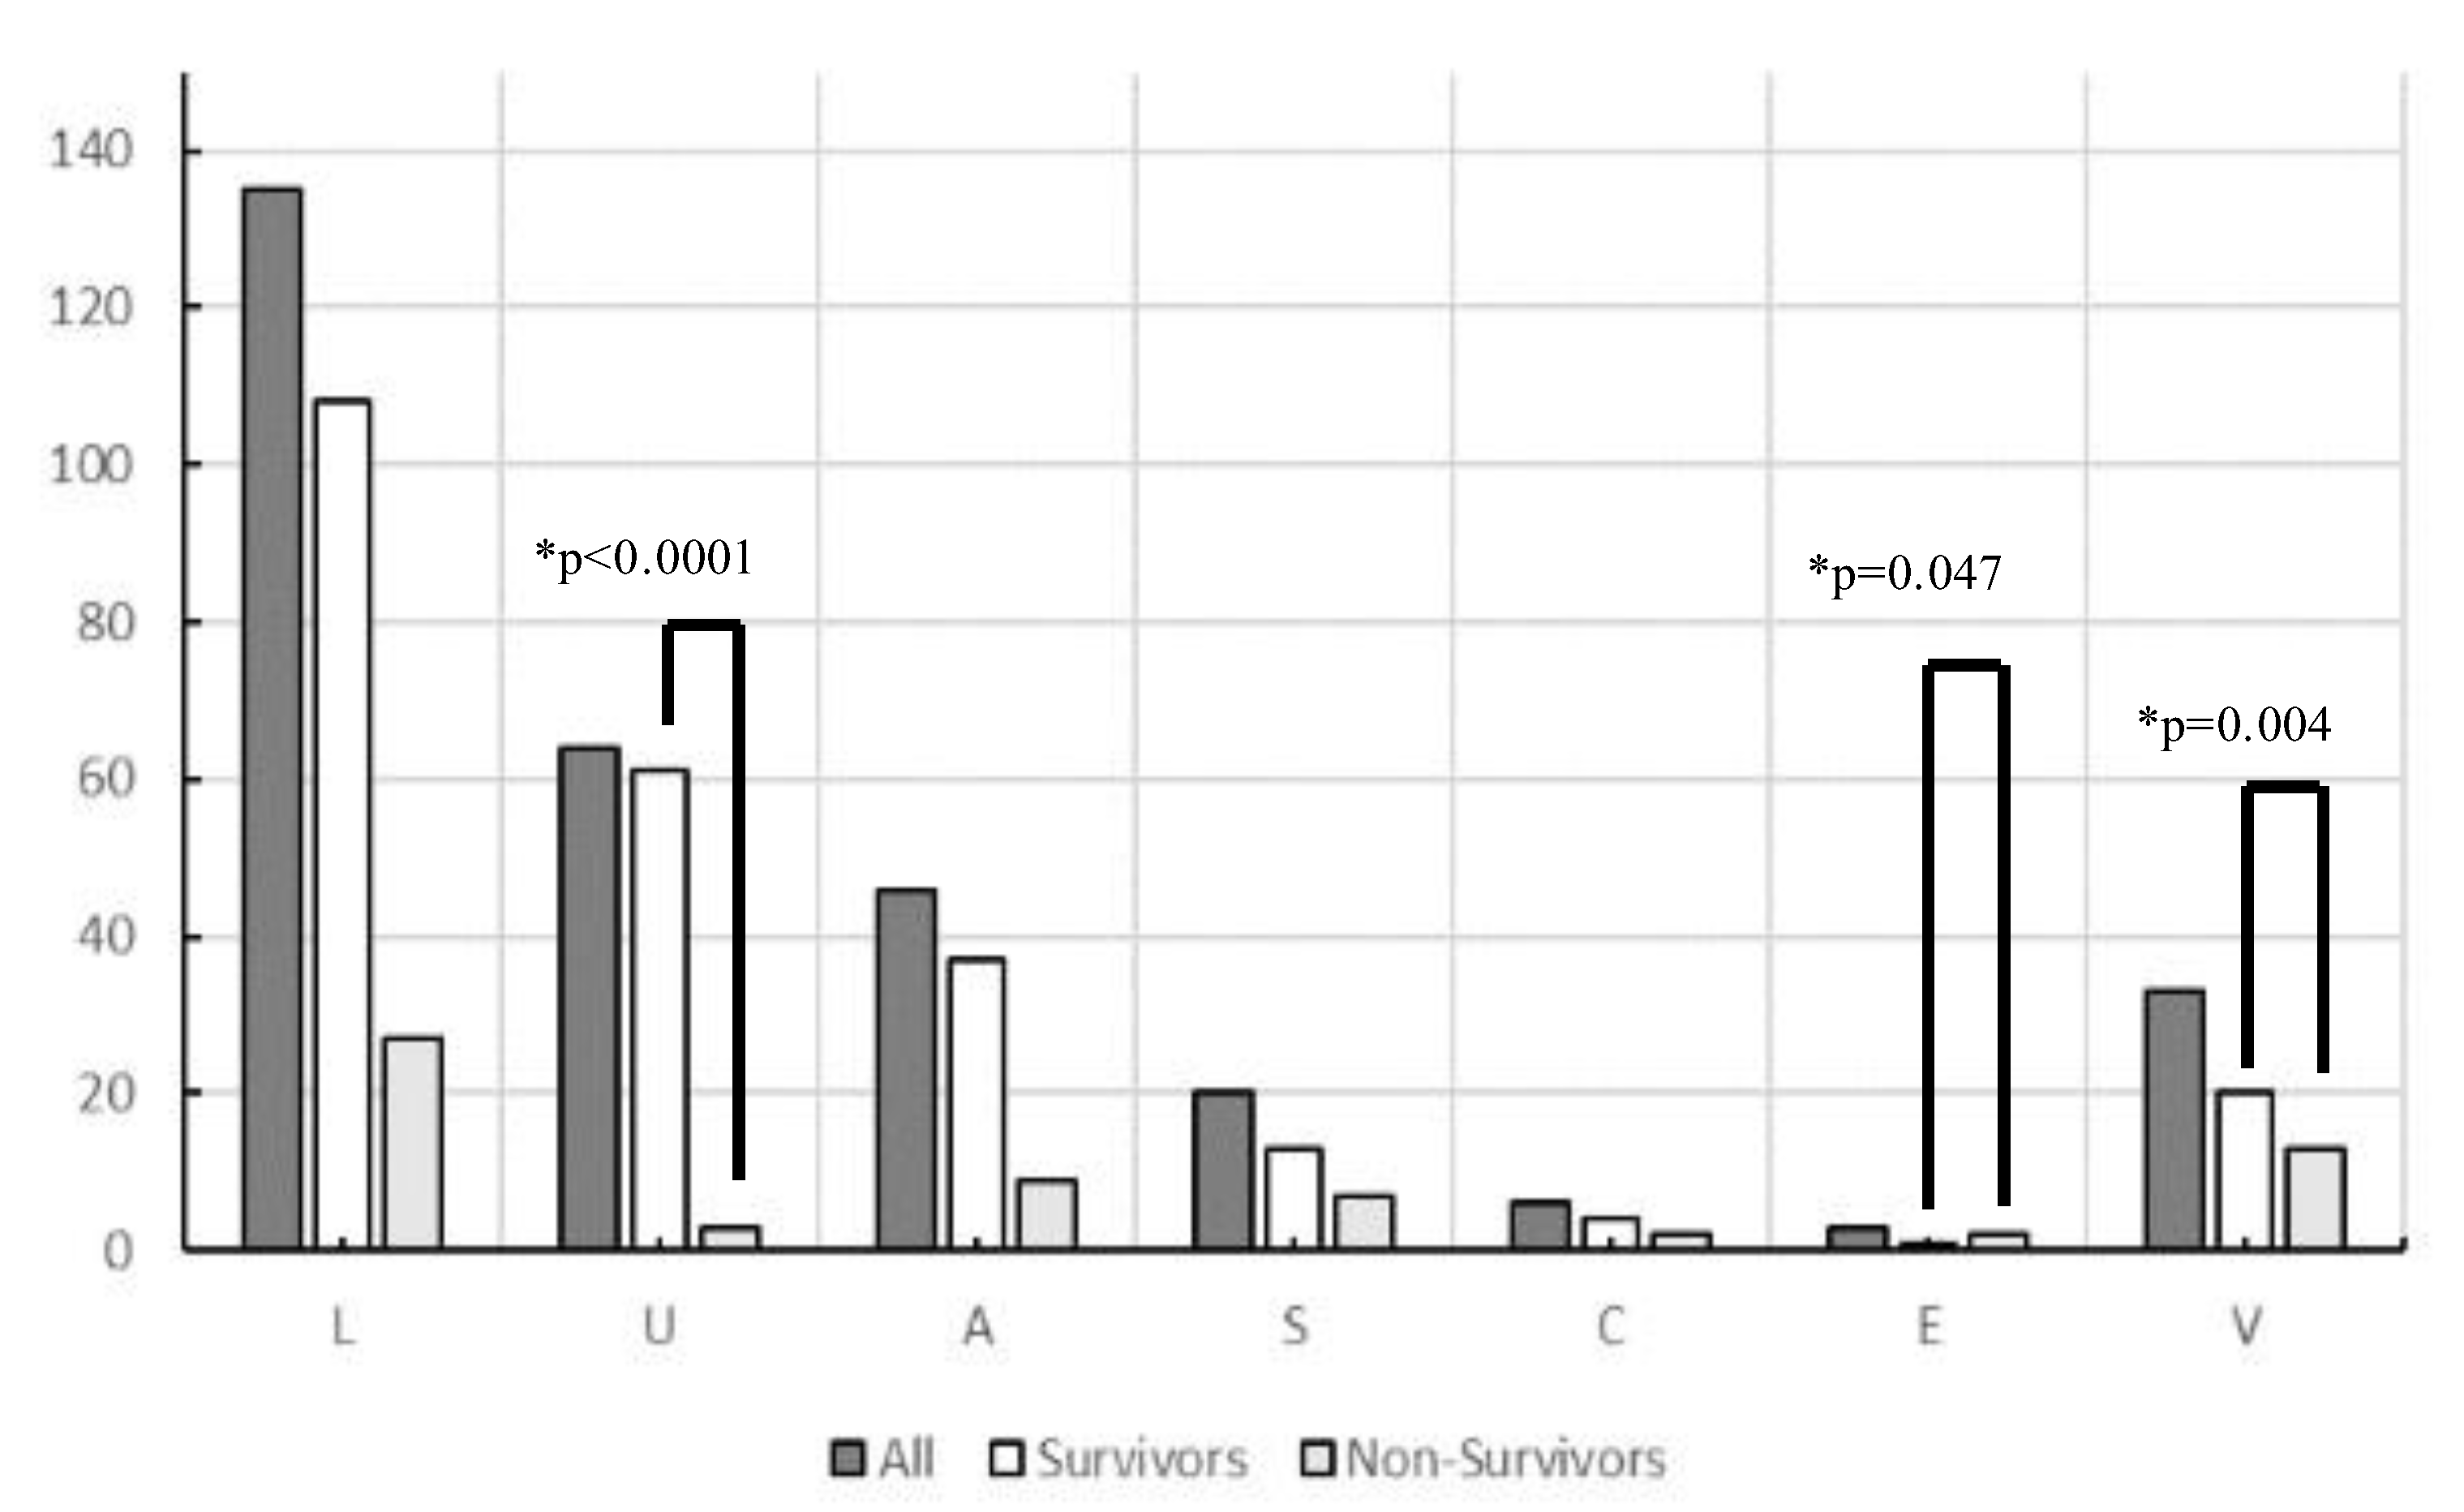
| Origin of Infection | Lung (n = 135) | Urine Tract (n = 64) | Abdomen (n = 46) | Soft Tissue (n = 20) | Central Nervous System (n = 6) | Endocardial Systems (n = 3) | Various Other Organs (n = 33) | p-Value |
|---|---|---|---|---|---|---|---|---|
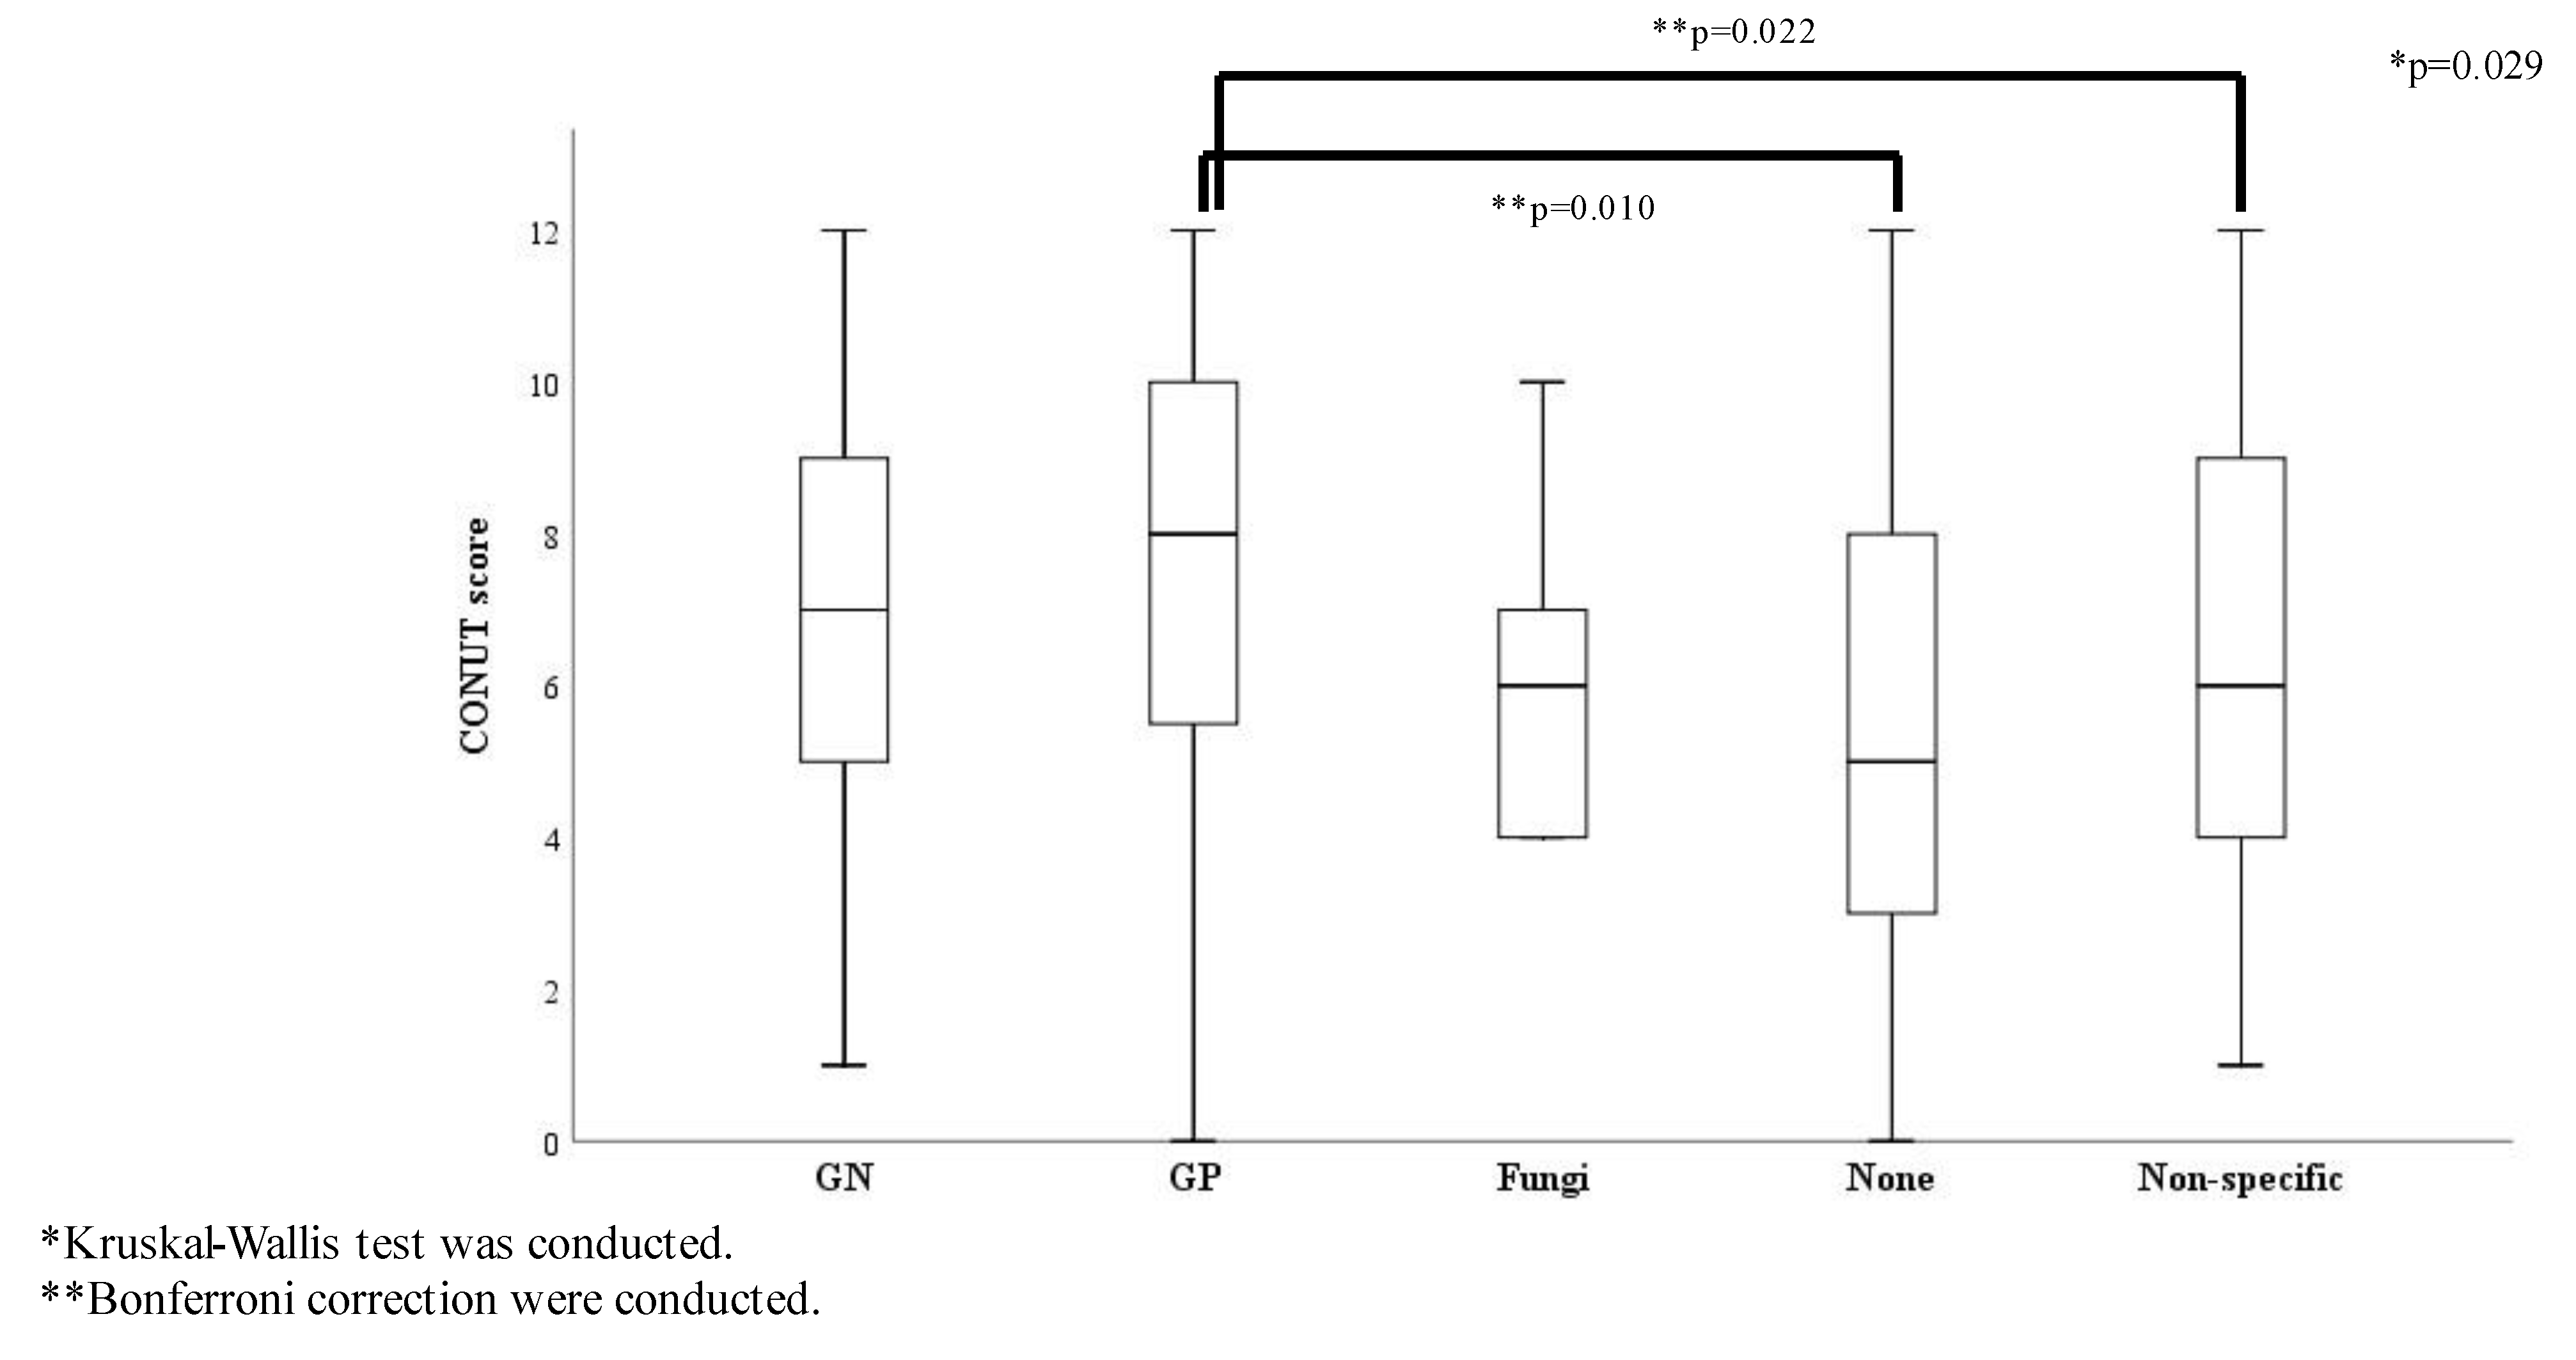
| CONUT score * | 6.52 ± 3.13 | 7.27 ± 3.46 | 7.36 ± 2.91 | 7.5 ± 3.14 | 6.83 ± 2.99 | 5.67 ± 2.52 | 6.81 ± 3.45 | 0.642 |
| BG (mg/mL) * | 168.4 ± 131.4 | 174 ± 141.5 | 185.2 ± 152.5 | 116.5 ± 70.9 | 215.7 ± 80.3 | 183.7 ± 42.3 | 223.5 ± 310.8 | 0.124 |
| Ratio of septic shock (%) ** | 56/132 (42.4) | 35/64 (54.7) | 27/45 (60.0) | 11/19 (57.9) | 3/6 (50.0) | 2/3 (66.7) | 18/32 (56.3) | 0.361 |
| Ratio of Hypo-G (%) ** | 13/135 (9.6) | 9/64 (14.1) | 9/46 (19.6) | 7/19 (36.8) | 0/6 (0.0) | 0/3 (0.0) | 7/19 (36.8) | 0.022 |
| Ratio of Inter-G(%) ** | 91/135 (67.4) | 40/64 (62.5) | 22/46 (47.8) | 10/19 (52.6) | 4/6 (66.7) | 2/3 (66.7) | 14/31 (45.2) | 0.145 |
| Ratio of Hyper-G (%) ** | 31/135 (23.0) | 15/64 (23.4) | 15/46 (32.6) | 2/19 (10.5) | 2/6 (33.3) | 1/3 (33.3) | 9/31 (29.0) | 0.603 |
| SOFA score * | 7.47 ± 2.80 | 8.17 ± 3.61 | 8.76 ± 3.70 | 8.45 ± 3.03 | 9.33 ± 3.39 | 8.00 ± 9.464 | 9.24 ± 3.48 | 0.074 |
| Explanatory Variable | Odds Ratio | 95% CI | p-Value * |
|---|---|---|---|
| Parameters | |||
| APACHE II score | - | ||
| SOFA score | 1.178 | 1.048–1.323 | 0.006 |
| AST | - | ||
| ALT | - | ||
| BUN | - | ||
| Lactate | 1.192 | 1.100–1.290 | <0.0001 |
| CRP | - | ||
| AT3 | |||
| Glucose | - | ||
| Hypo-G | - | ||
| Inter-G | - | ||
| Hyper-G | - | ||
| CONUT score | 1.214 | 1.076–1.368 | 0.002 |
| BMI | - | ||
| HbA1c | - |
| Variable | Non-Diabetes | Diabetes | p-Value |
|---|---|---|---|
| Age (years) | 75.1 ± 15.3 | 73.1 ± 11.2 | 0.084 |
| APACHE II score | 24.7 ± 7.53 | 24.6 ± 7.56 | 0.94 |
| SOFA score | 8.21 ± 3.38 | 7.77 ± 2.89 | 0.603 |
| CONUT score | 7.0 ± 3.10 | 6.43 ± 3.46 | 0.262 |
| Albumin (g/dL) | 2.79 ± 0.74 | 2.96 ± 0.76 | 0.110 |
| Lymphocyte count (per/µL) | 91.4 ± 107.1 | 94.9 ± 84.0 | 0.441 |
| T-Cho (mg/dL) | 148.7 ± 71.6 | 158.0 ± 66.1 | 0.041 |
| BG (mg/dL) | 134.6 ± 67.6 | 318.4 ± 272.0 | <0.0001 |
| HbA1c (NGSP (%)) | 5.58 ± 0.51 | 7.79 ± 1.35 | <0.0001 |
| BMI | 19.6 ± 4.37 | 22.9 ± 5.17 | <0.0001 |
| Mortality (D/All (%)) | 51/235 | 11/69 | 0.499 |
Disclaimer/Publisher’s Note: The statements, opinions and data contained in all publications are solely those of the individual author(s) and contributor(s) and not of MDPI and/or the editor(s). MDPI and/or the editor(s) disclaim responsibility for any injury to people or property resulting from any ideas, methods, instructions or products referred to in the content. |
© 2023 by the authors. Licensee MDPI, Basel, Switzerland. This article is an open access article distributed under the terms and conditions of the Creative Commons Attribution (CC BY) license (https://creativecommons.org/licenses/by/4.0/).
Share and Cite
Yamaguchi, J.; Kinoshita, K.; Nakagawa, K.; Mizuochi, M. Undernutrition Scored Using the CONUT Score with Hypoglycemic Status in ICU-Admitted Elderly Patients with Sepsis Shows Increased ICU Mortality. Diagnostics 2023, 13, 762. https://doi.org/10.3390/diagnostics13040762
Yamaguchi J, Kinoshita K, Nakagawa K, Mizuochi M. Undernutrition Scored Using the CONUT Score with Hypoglycemic Status in ICU-Admitted Elderly Patients with Sepsis Shows Increased ICU Mortality. Diagnostics. 2023; 13(4):762. https://doi.org/10.3390/diagnostics13040762
Chicago/Turabian StyleYamaguchi, Junko, Kosaku Kinoshita, Katsuhiro Nakagawa, and Minori Mizuochi. 2023. "Undernutrition Scored Using the CONUT Score with Hypoglycemic Status in ICU-Admitted Elderly Patients with Sepsis Shows Increased ICU Mortality" Diagnostics 13, no. 4: 762. https://doi.org/10.3390/diagnostics13040762
APA StyleYamaguchi, J., Kinoshita, K., Nakagawa, K., & Mizuochi, M. (2023). Undernutrition Scored Using the CONUT Score with Hypoglycemic Status in ICU-Admitted Elderly Patients with Sepsis Shows Increased ICU Mortality. Diagnostics, 13(4), 762. https://doi.org/10.3390/diagnostics13040762