
An Analysis of Optical Coherence Tomography Angiography (OCT-A) Perfusion Density Maps in Patients Treated for Retinal Vein Occlusion with Intravitreal Aflibercept


Abstract
:1. Introduction
2. Material and Methods
- pre-therapy measurement, i.e., timepoint 0 (hereafter referred to as the baseline);
- three intra-therapy timepoints, i.e., timepoint 1 (30 days after the first anti-VEGF injection), timepoint 2 (30 days after the second injection), and timepoint 3 (30 days after the third injection);
- two post-therapy timepoints, i.e., timepoint 4 (60 days after the third injection) and timepoint 5 (90 days after the third injection).
2.1. Acquisition of Images
2.2. OCTA Analysis
- vessel density (VD) of the superficial capillary plexus (VD-SF) and deep capillary plexus (VD-D),
- flow area in the outer retina (FAOR) and choriocapillaris flow area (FACC),
- superficial non-flow area (NFA),
- foveal avascular zone (FAZ).
3. Results
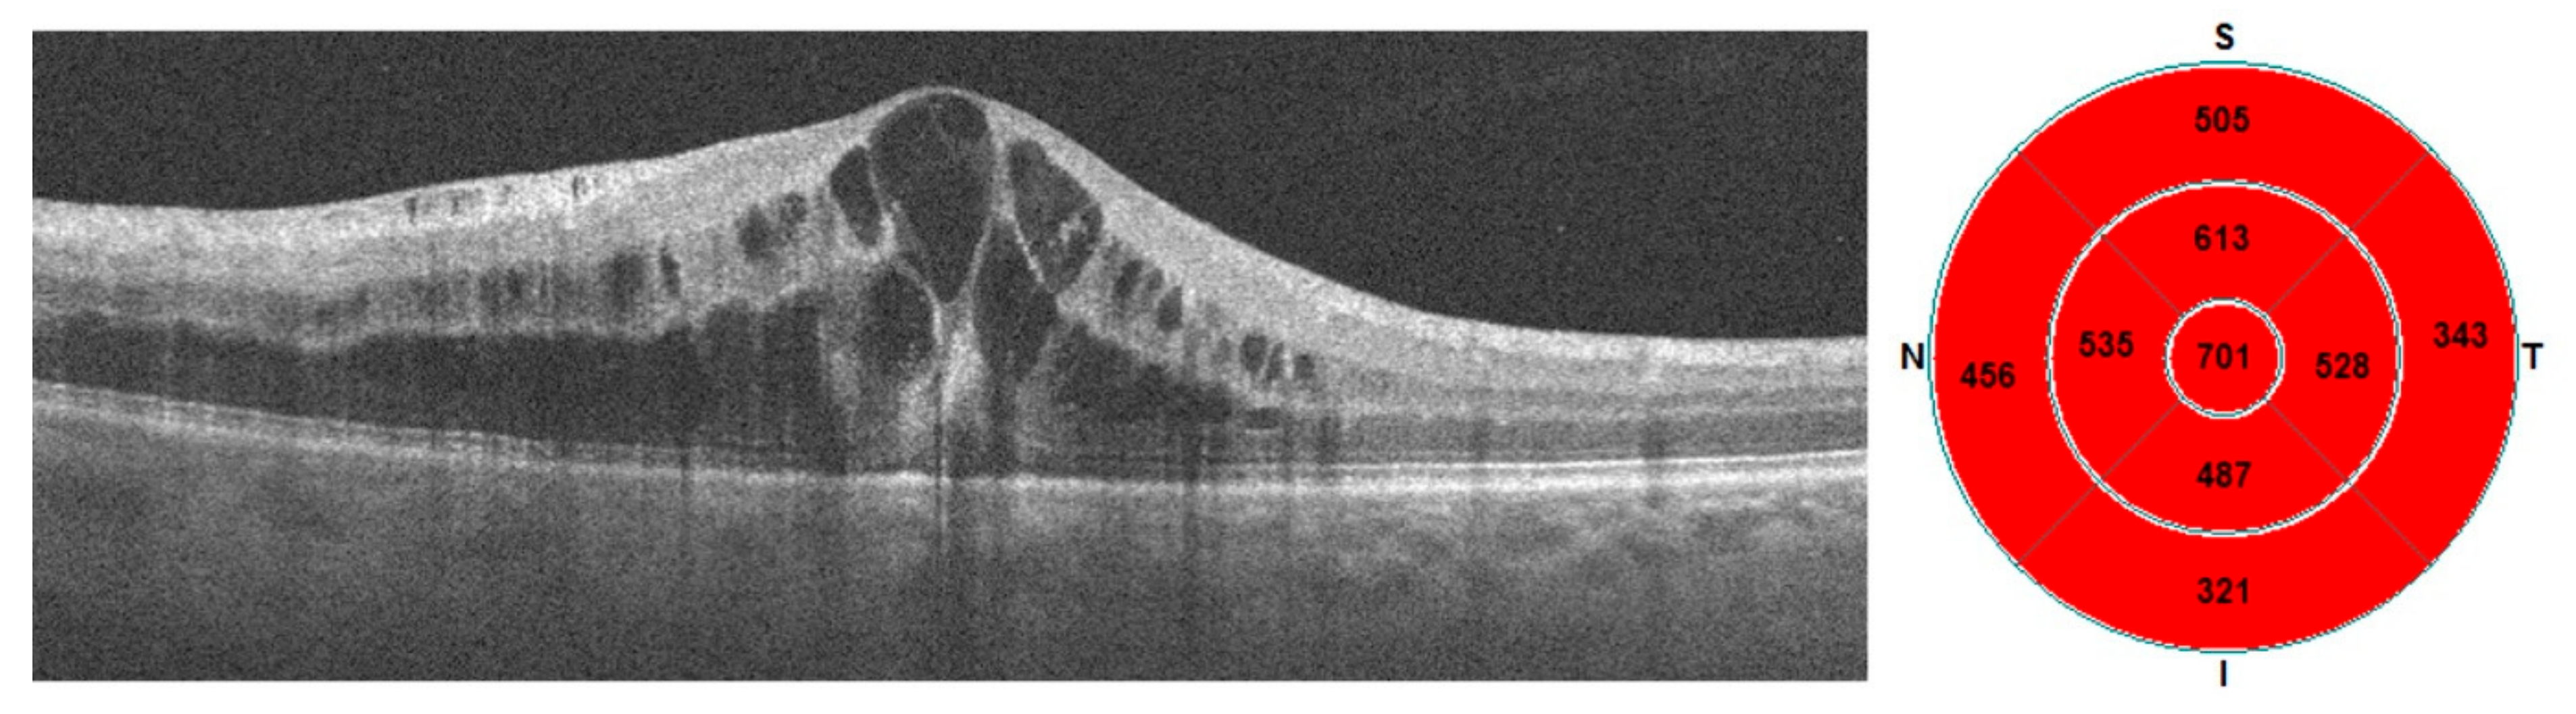
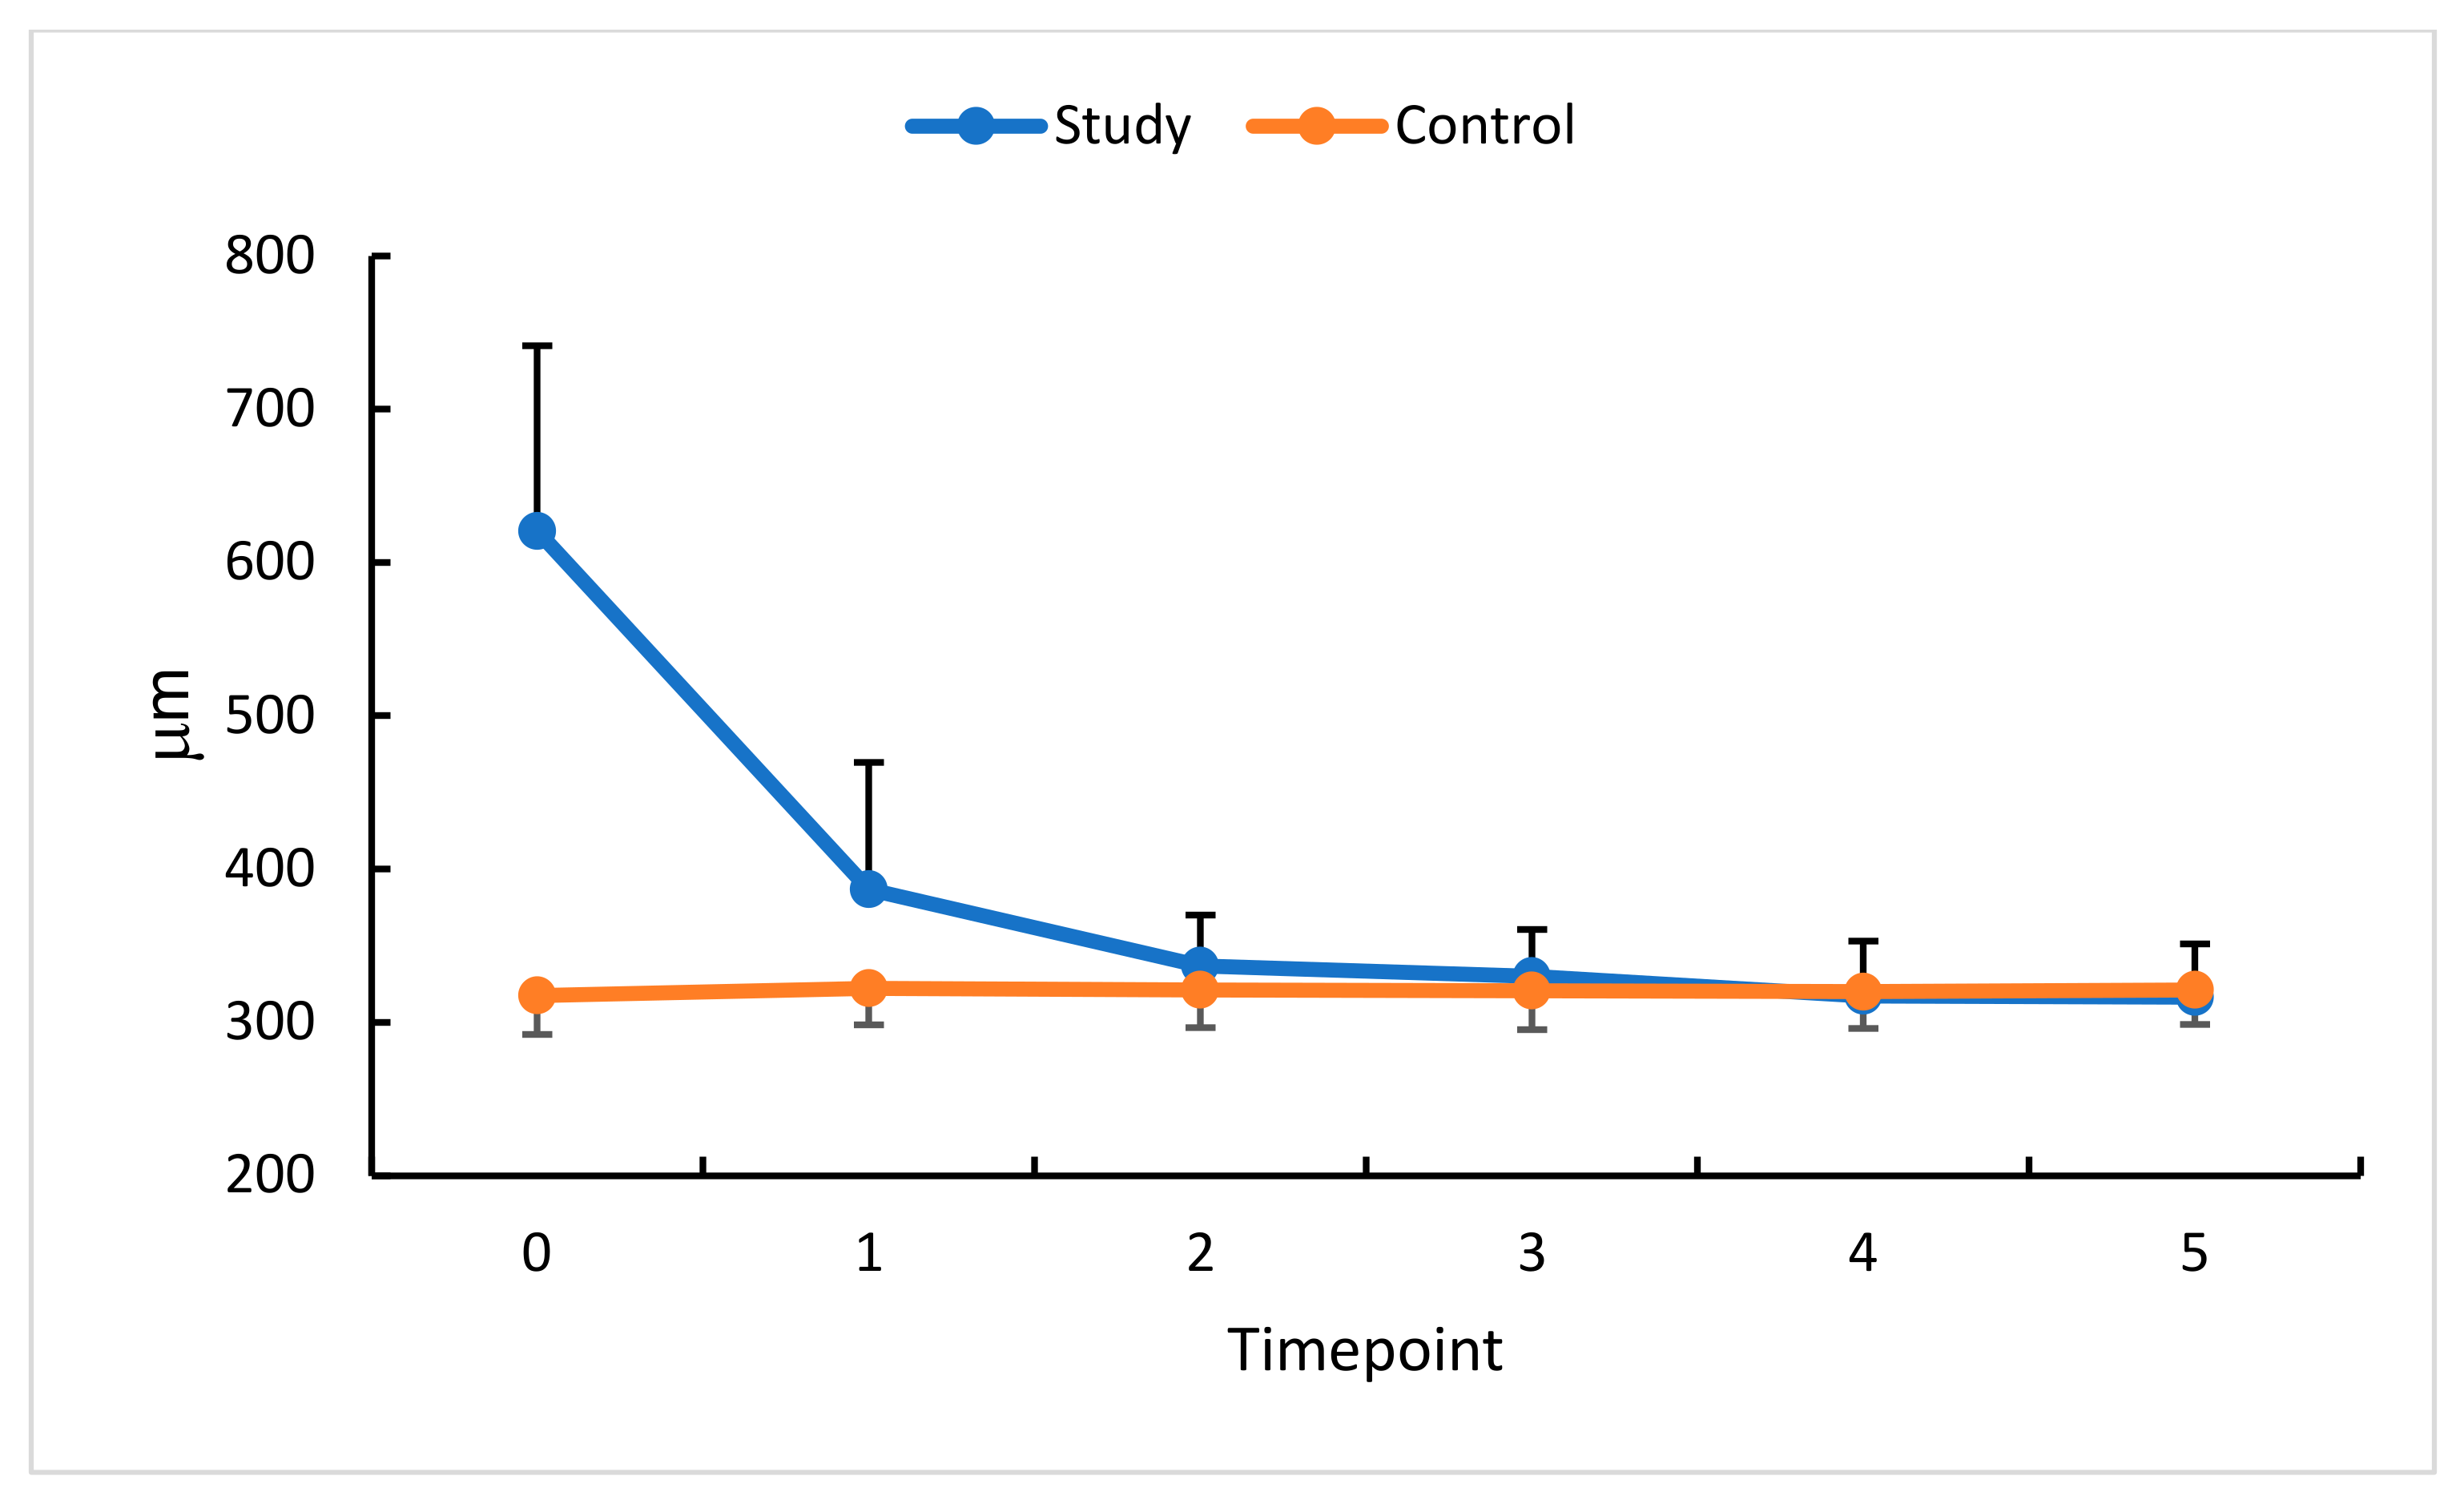
3.1. Intravitreal Anti-VEGF (Aflibercept) and CRT
3.2. Intravitreal Anti-VEGF (Aflibercept) and NFA
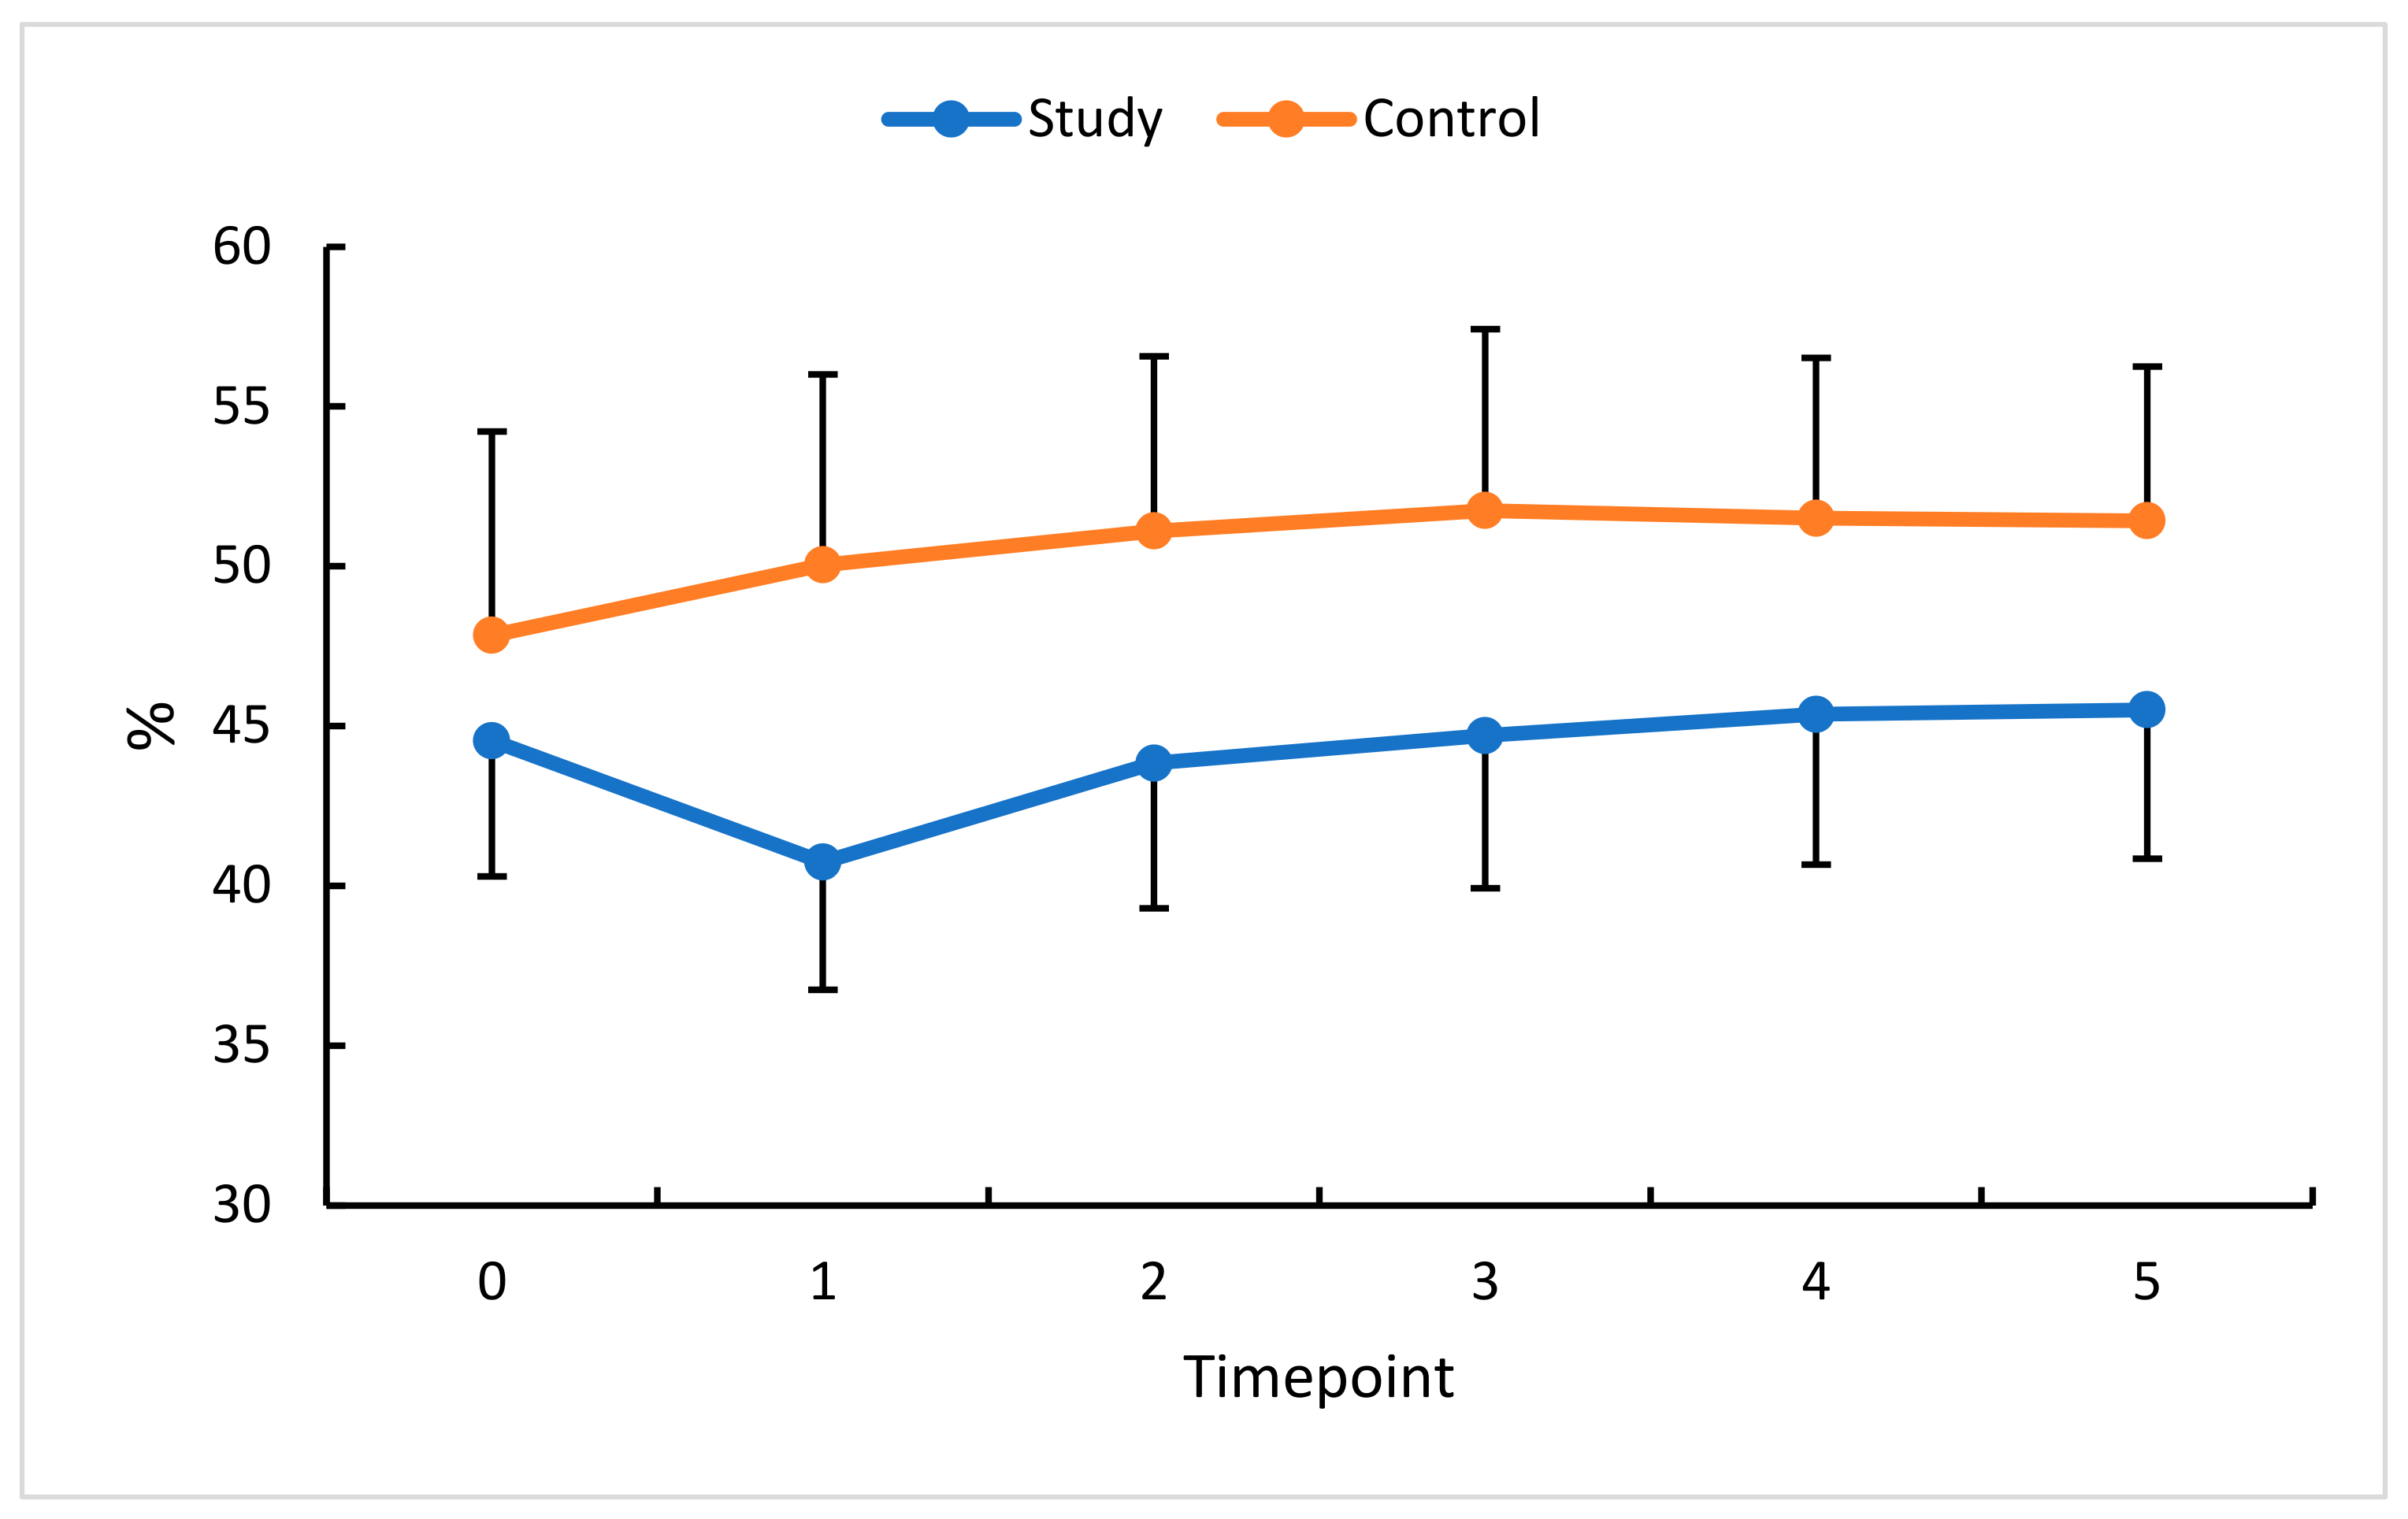
3.3. Intravitreal Anti-VEGF (Aflibercept) and VD
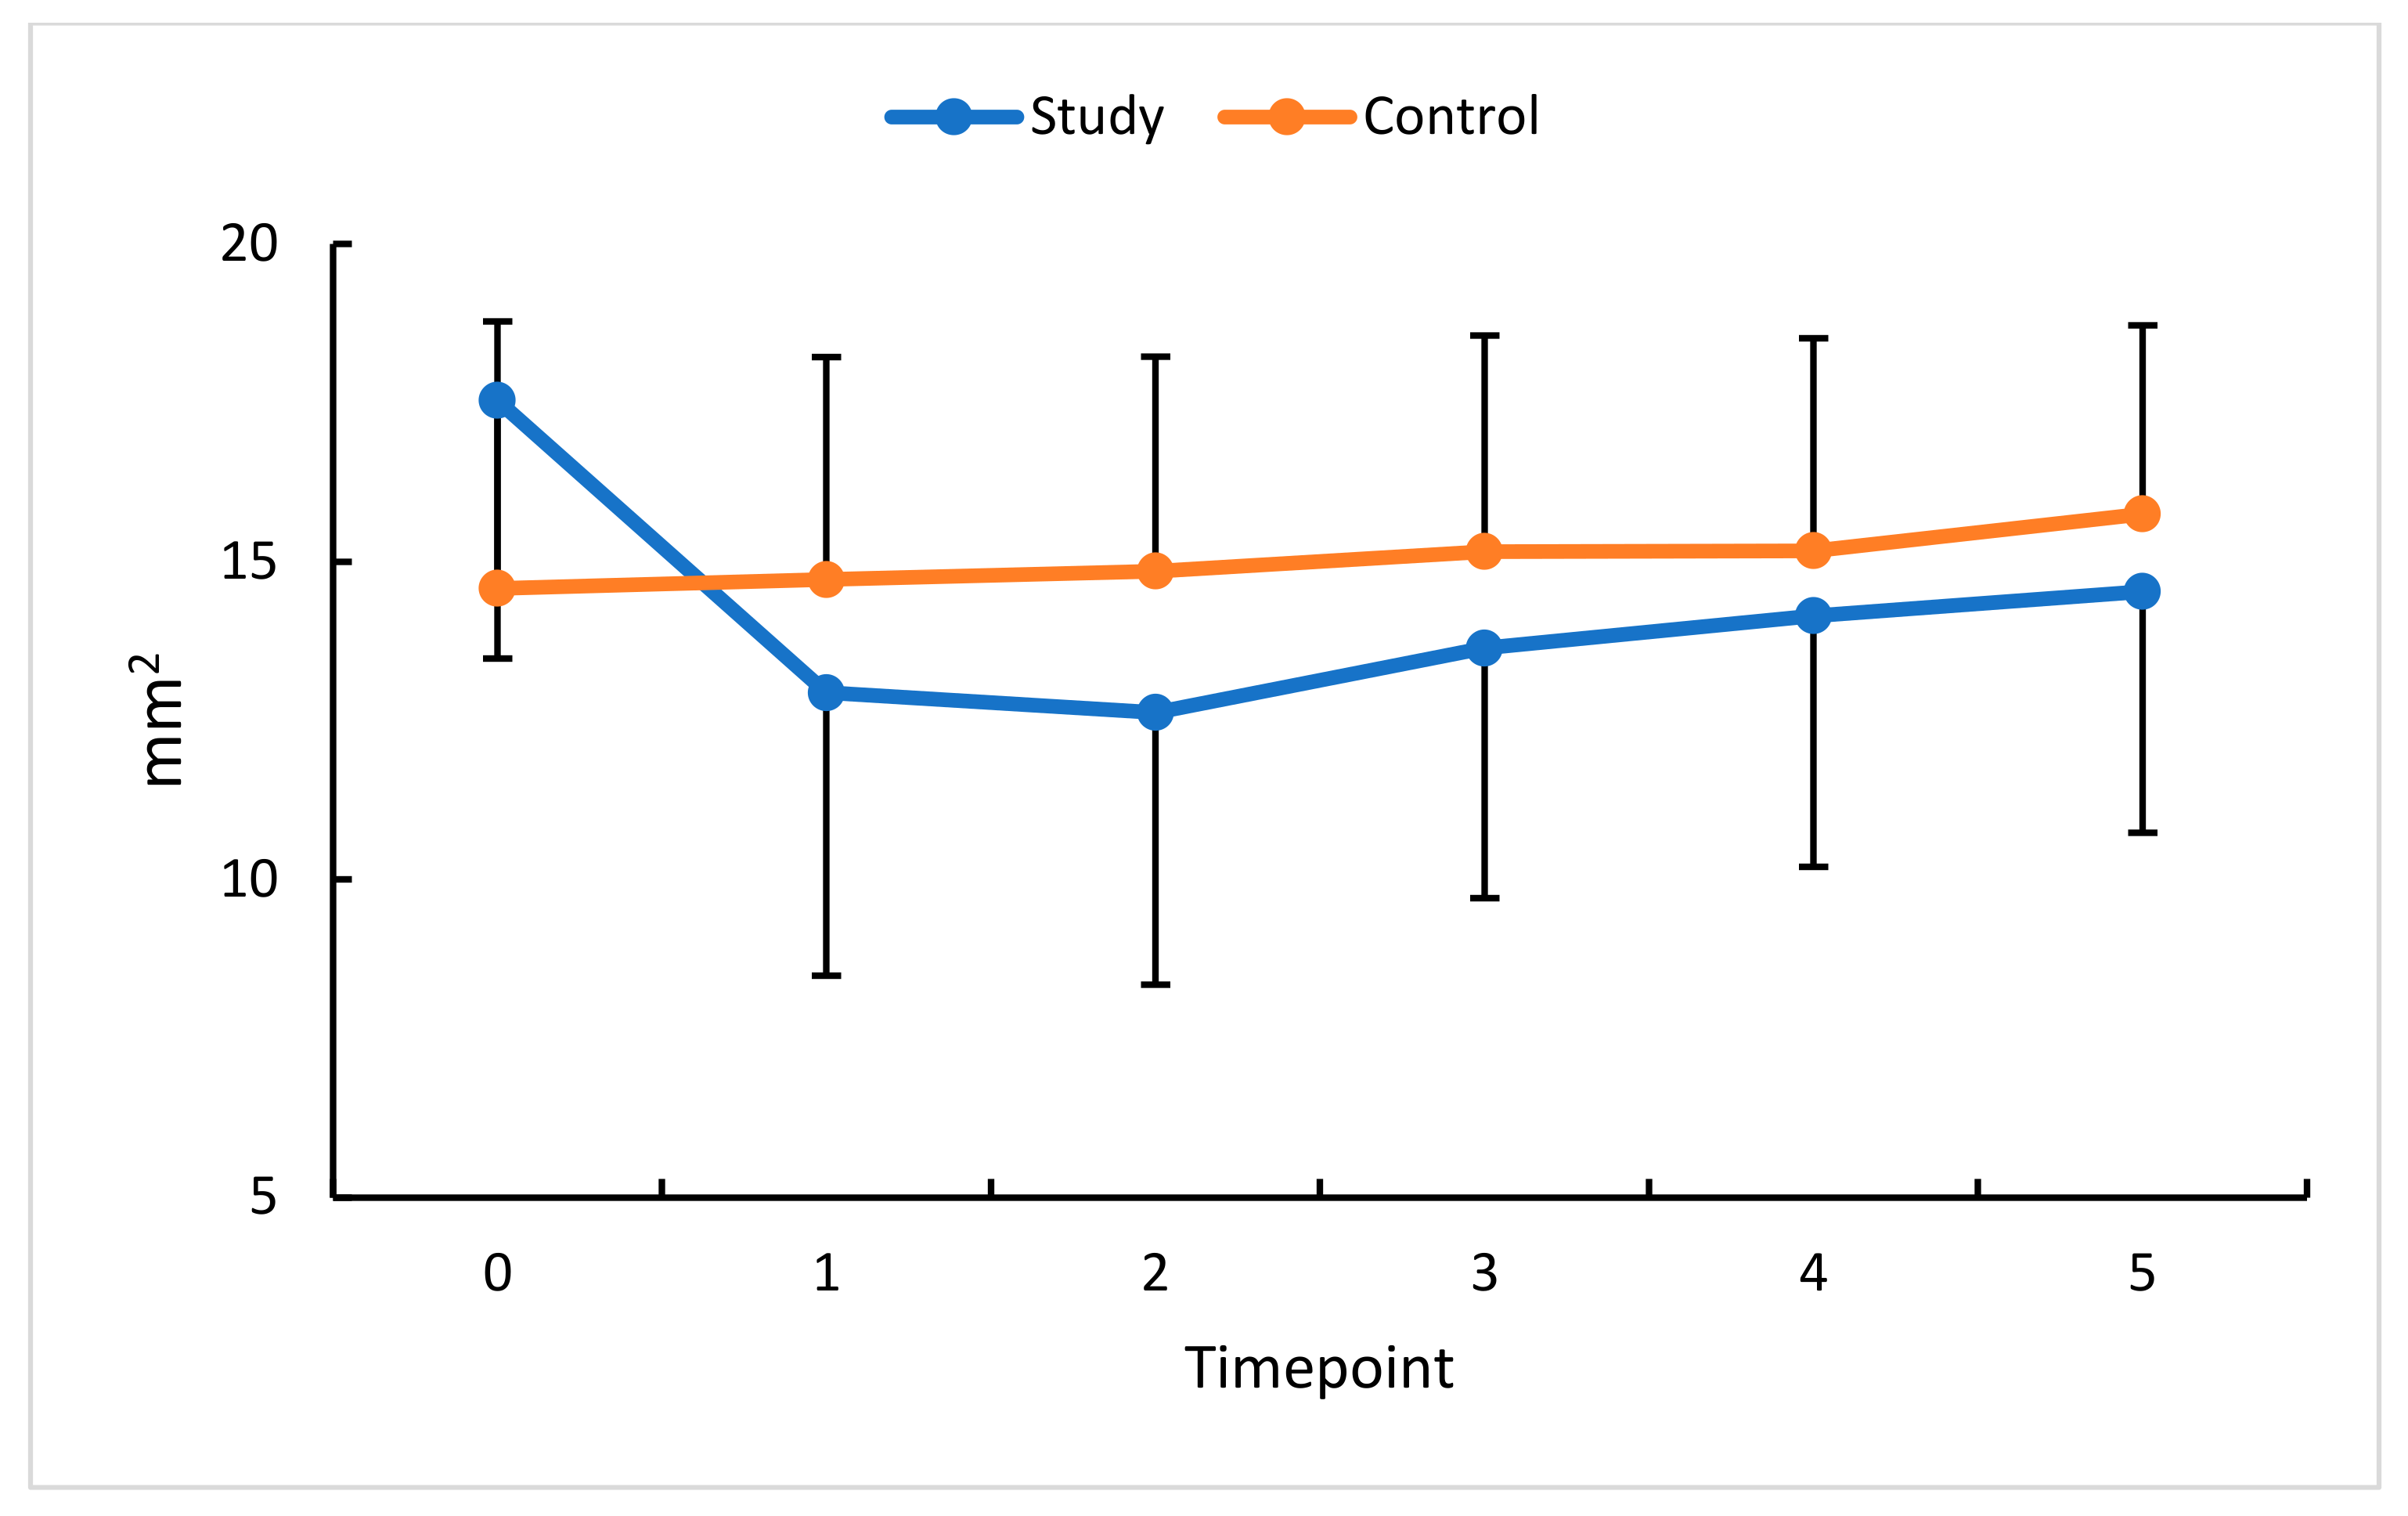
3.4. Intravitreal Anti-VEGF (Aflibercept) and FAOR/FACC
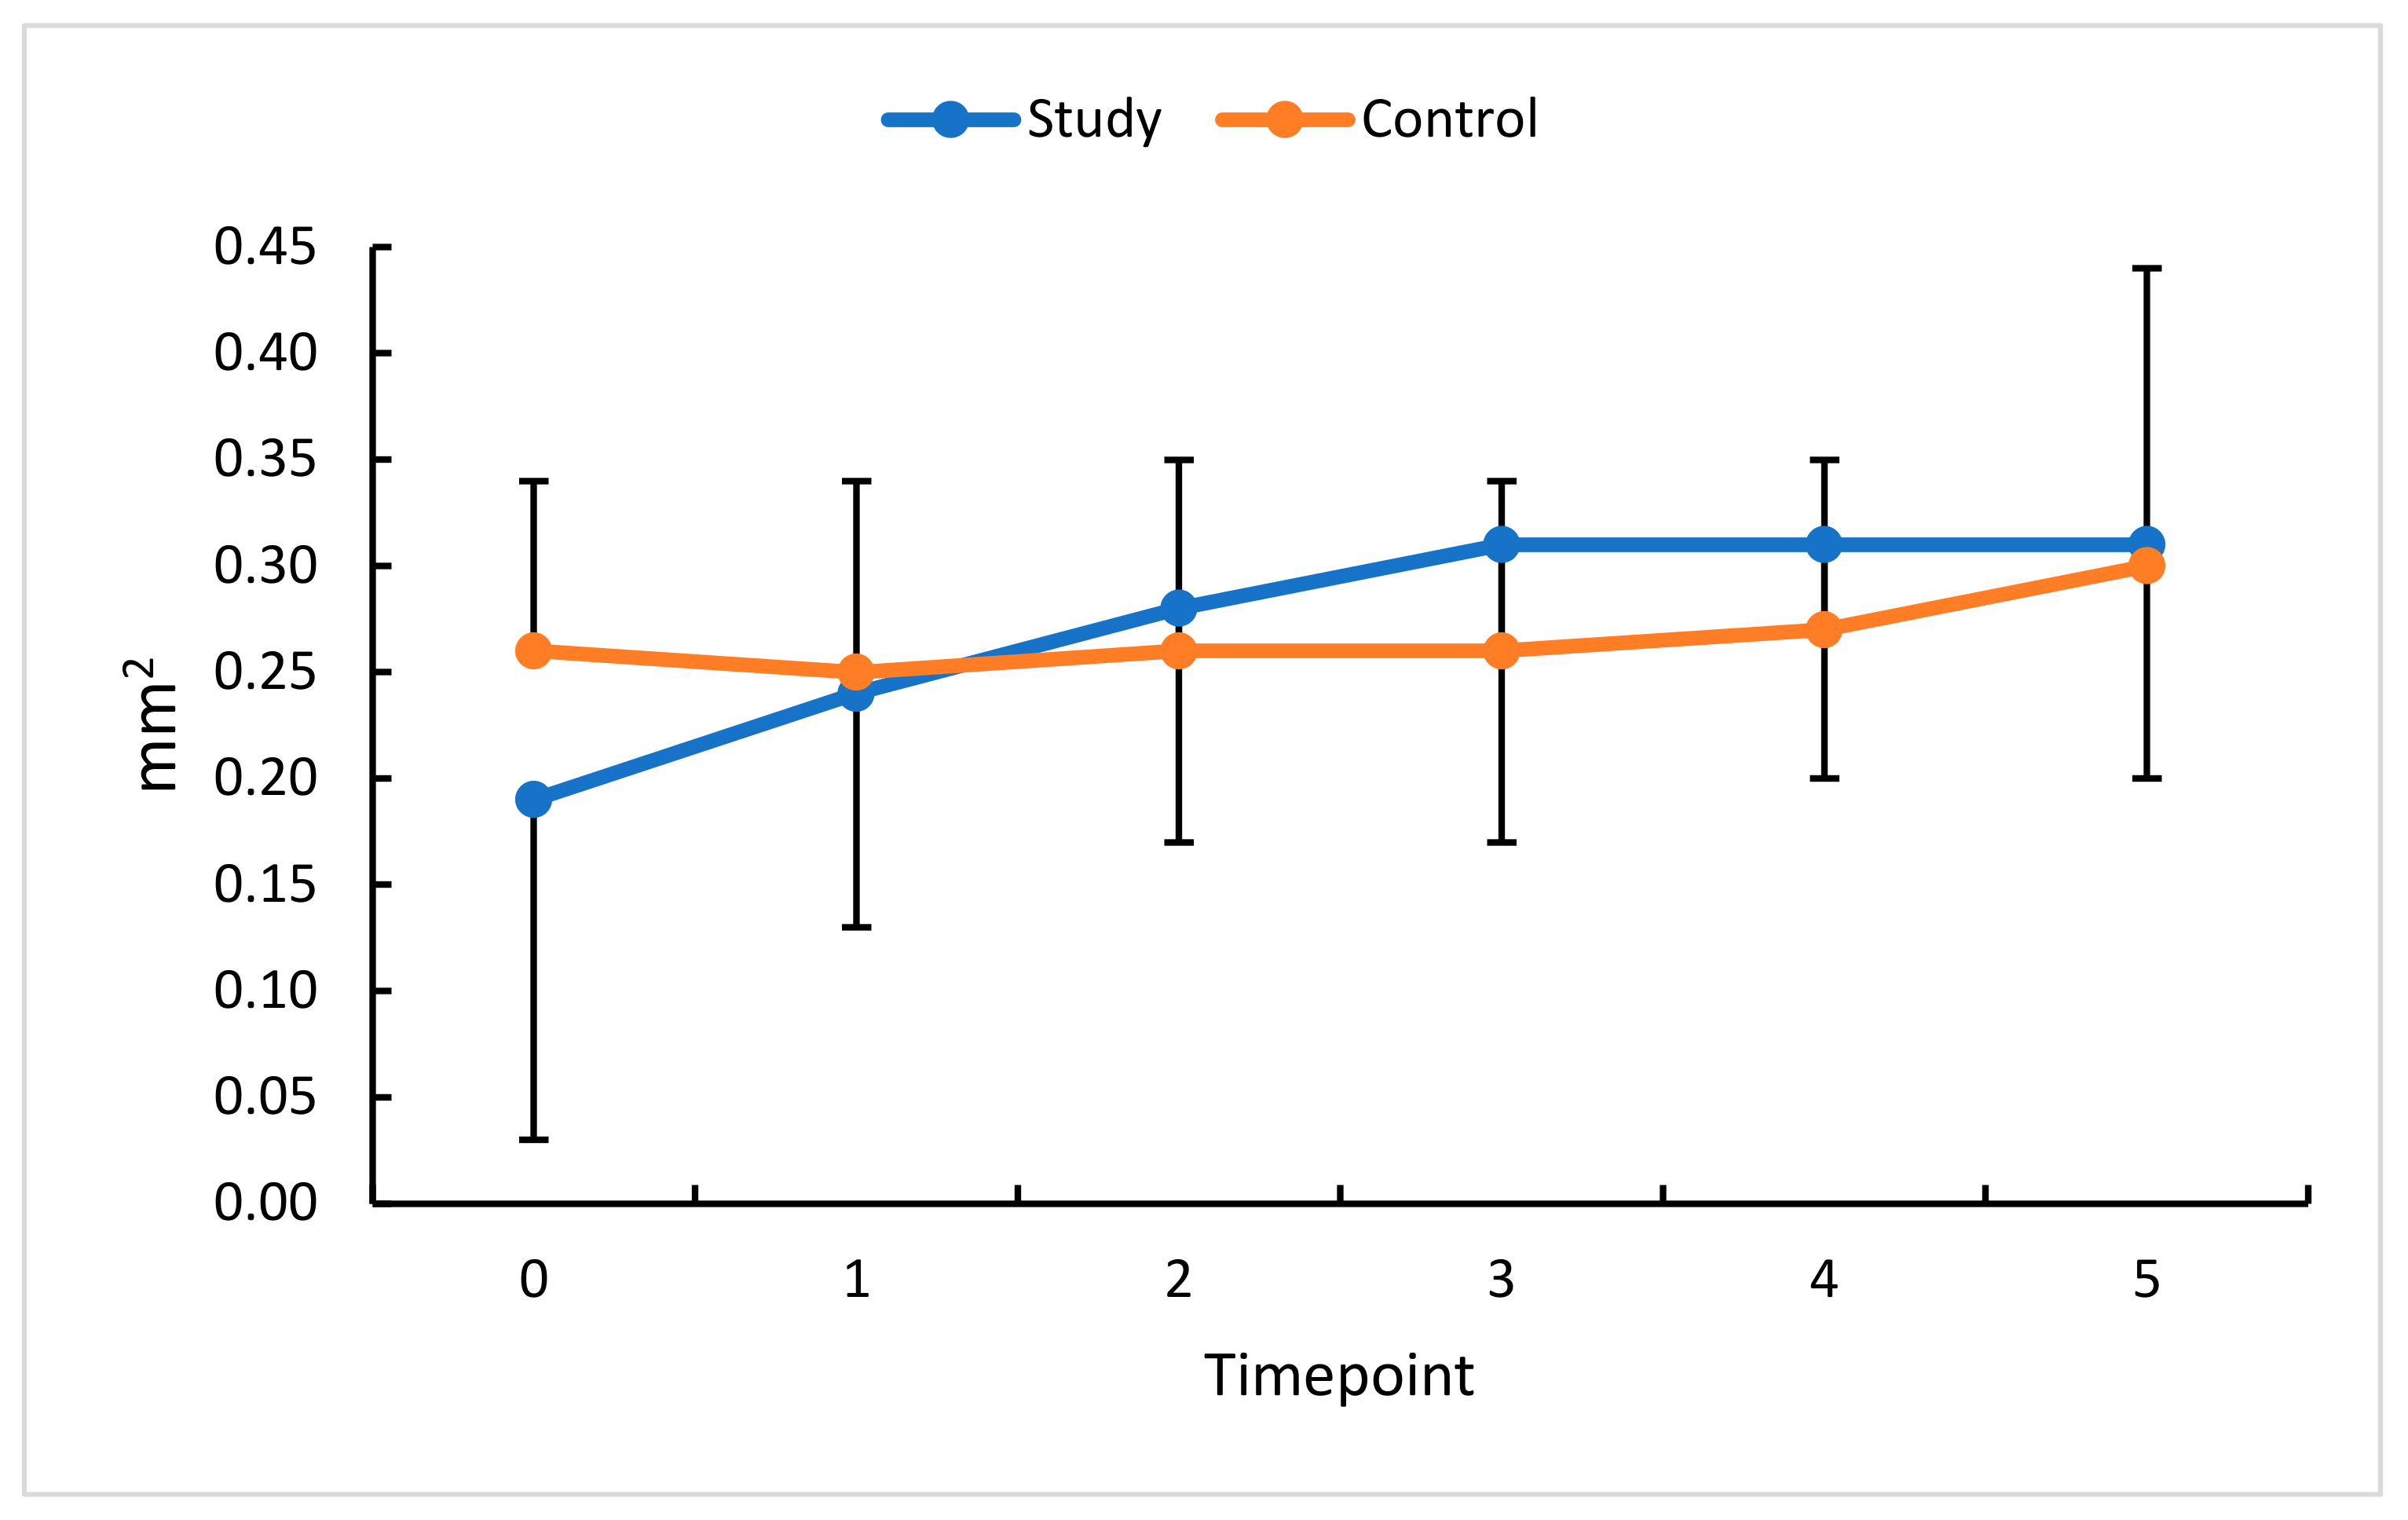
3.5. Intravitreal Anti-VEGF (Aflibercept) and FAZ
3.6. Intravitreal Anti-VEGF (Aflibercept) and BCVA
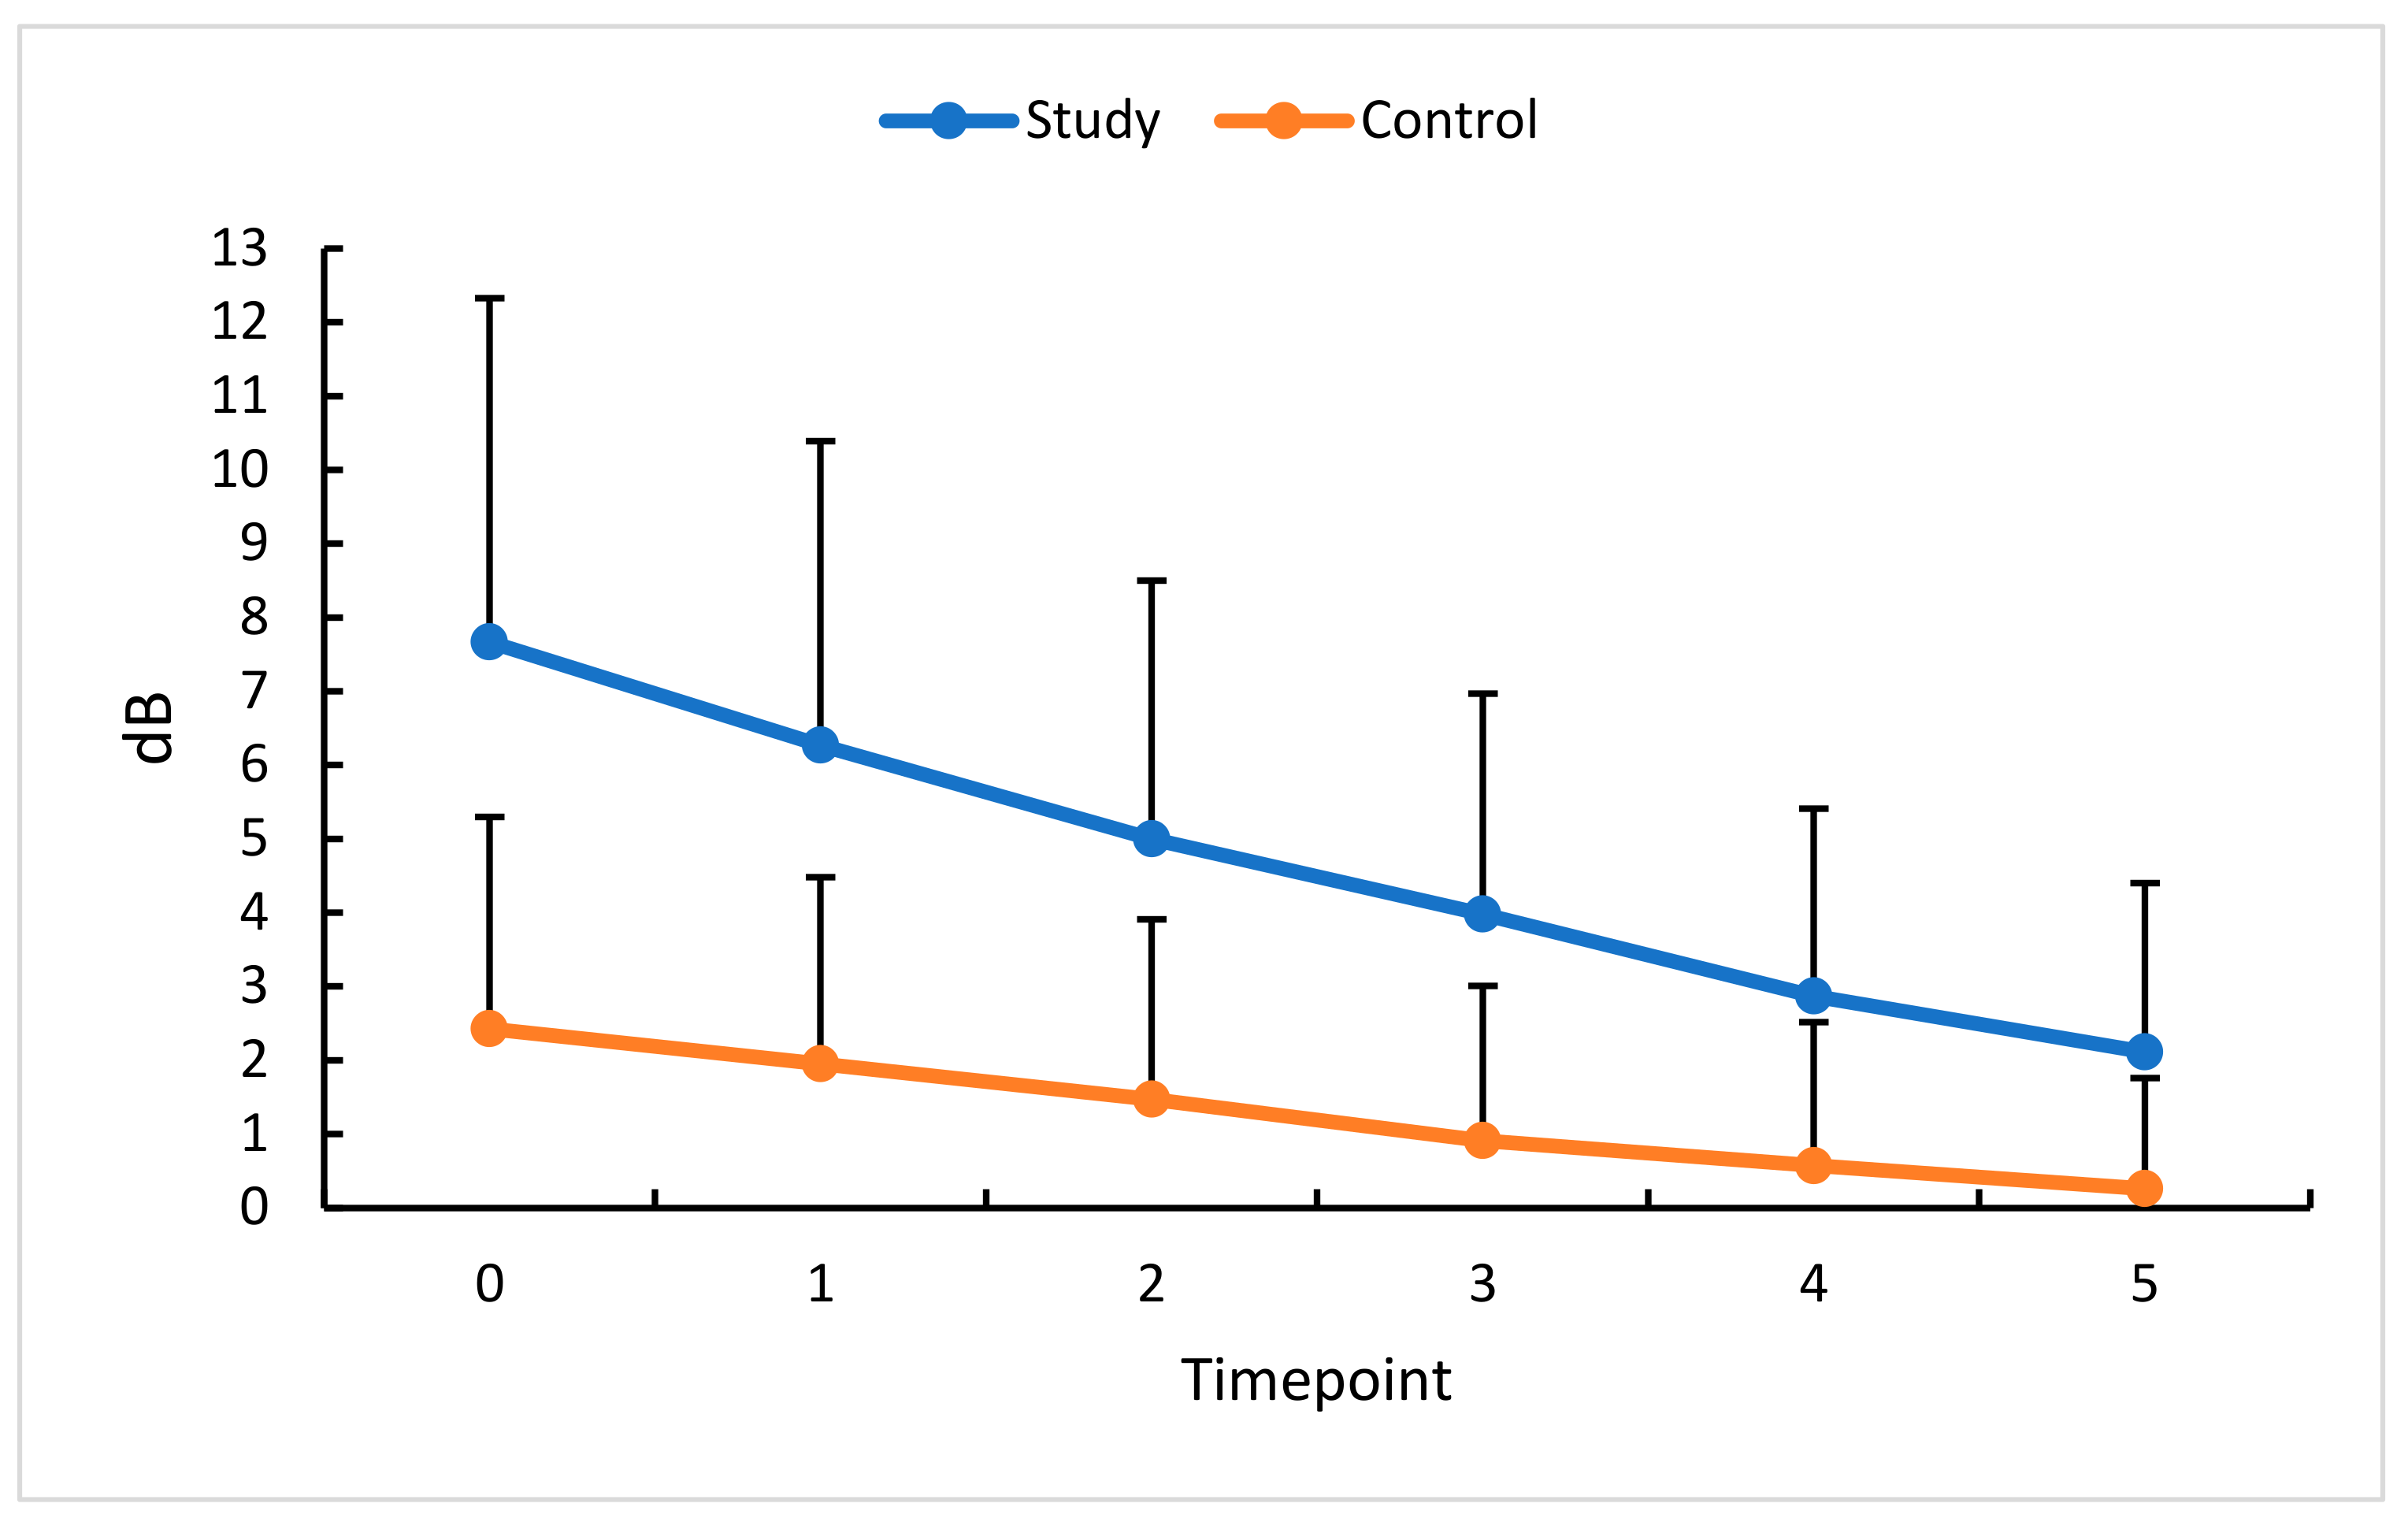
3.7. Intravitreal Anti-VEGF (Aflibercept) and MD
4. Discussion
5. Conclusions
6. Summary of Results in Tables
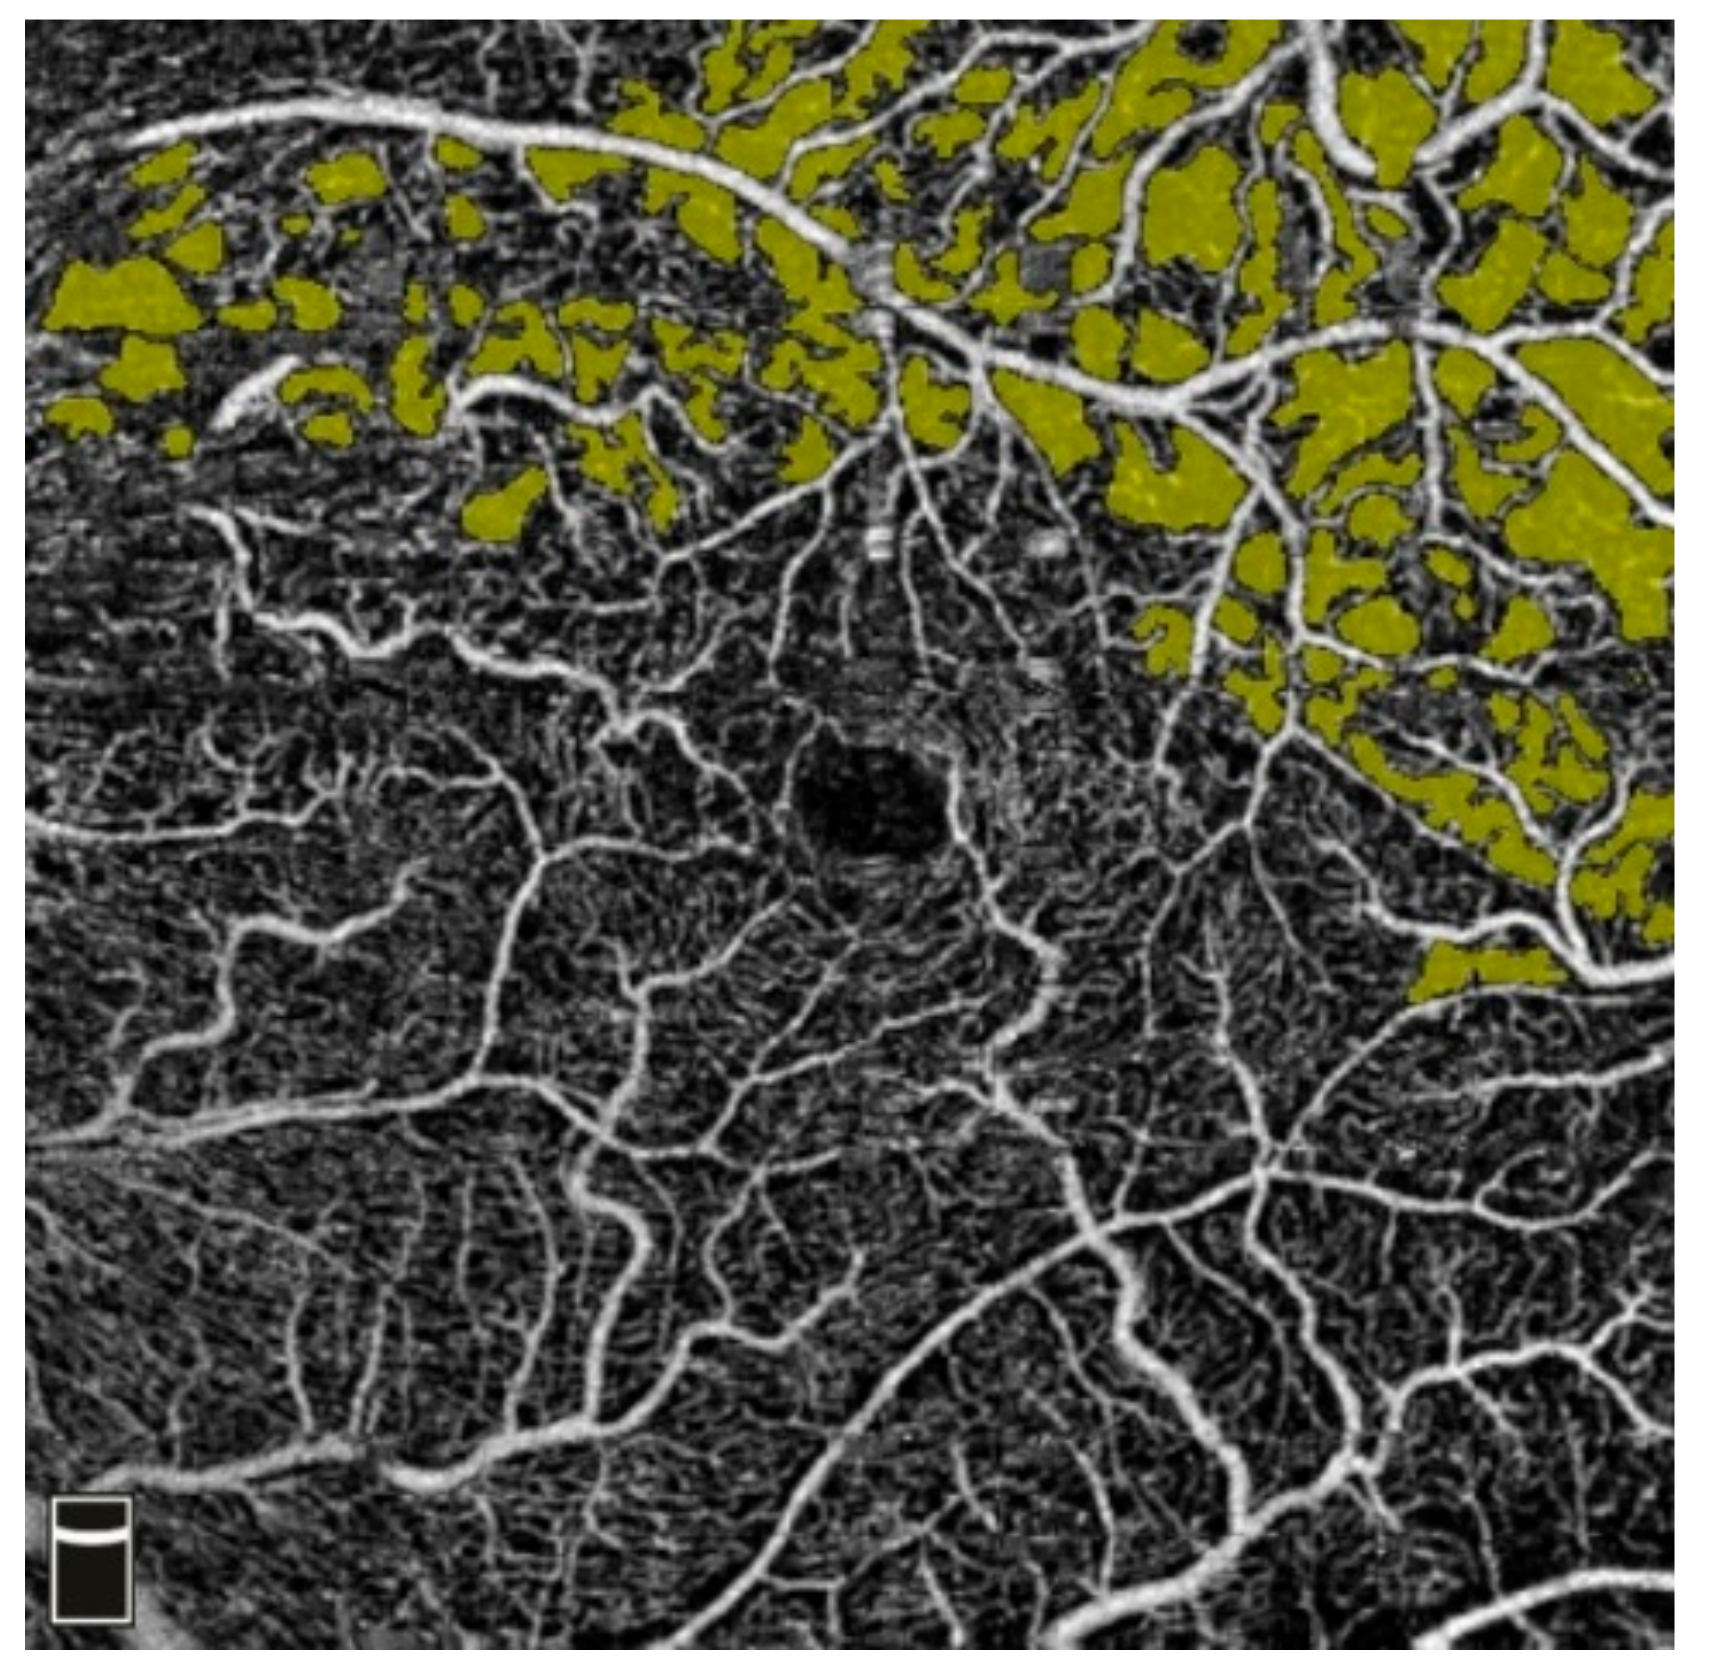
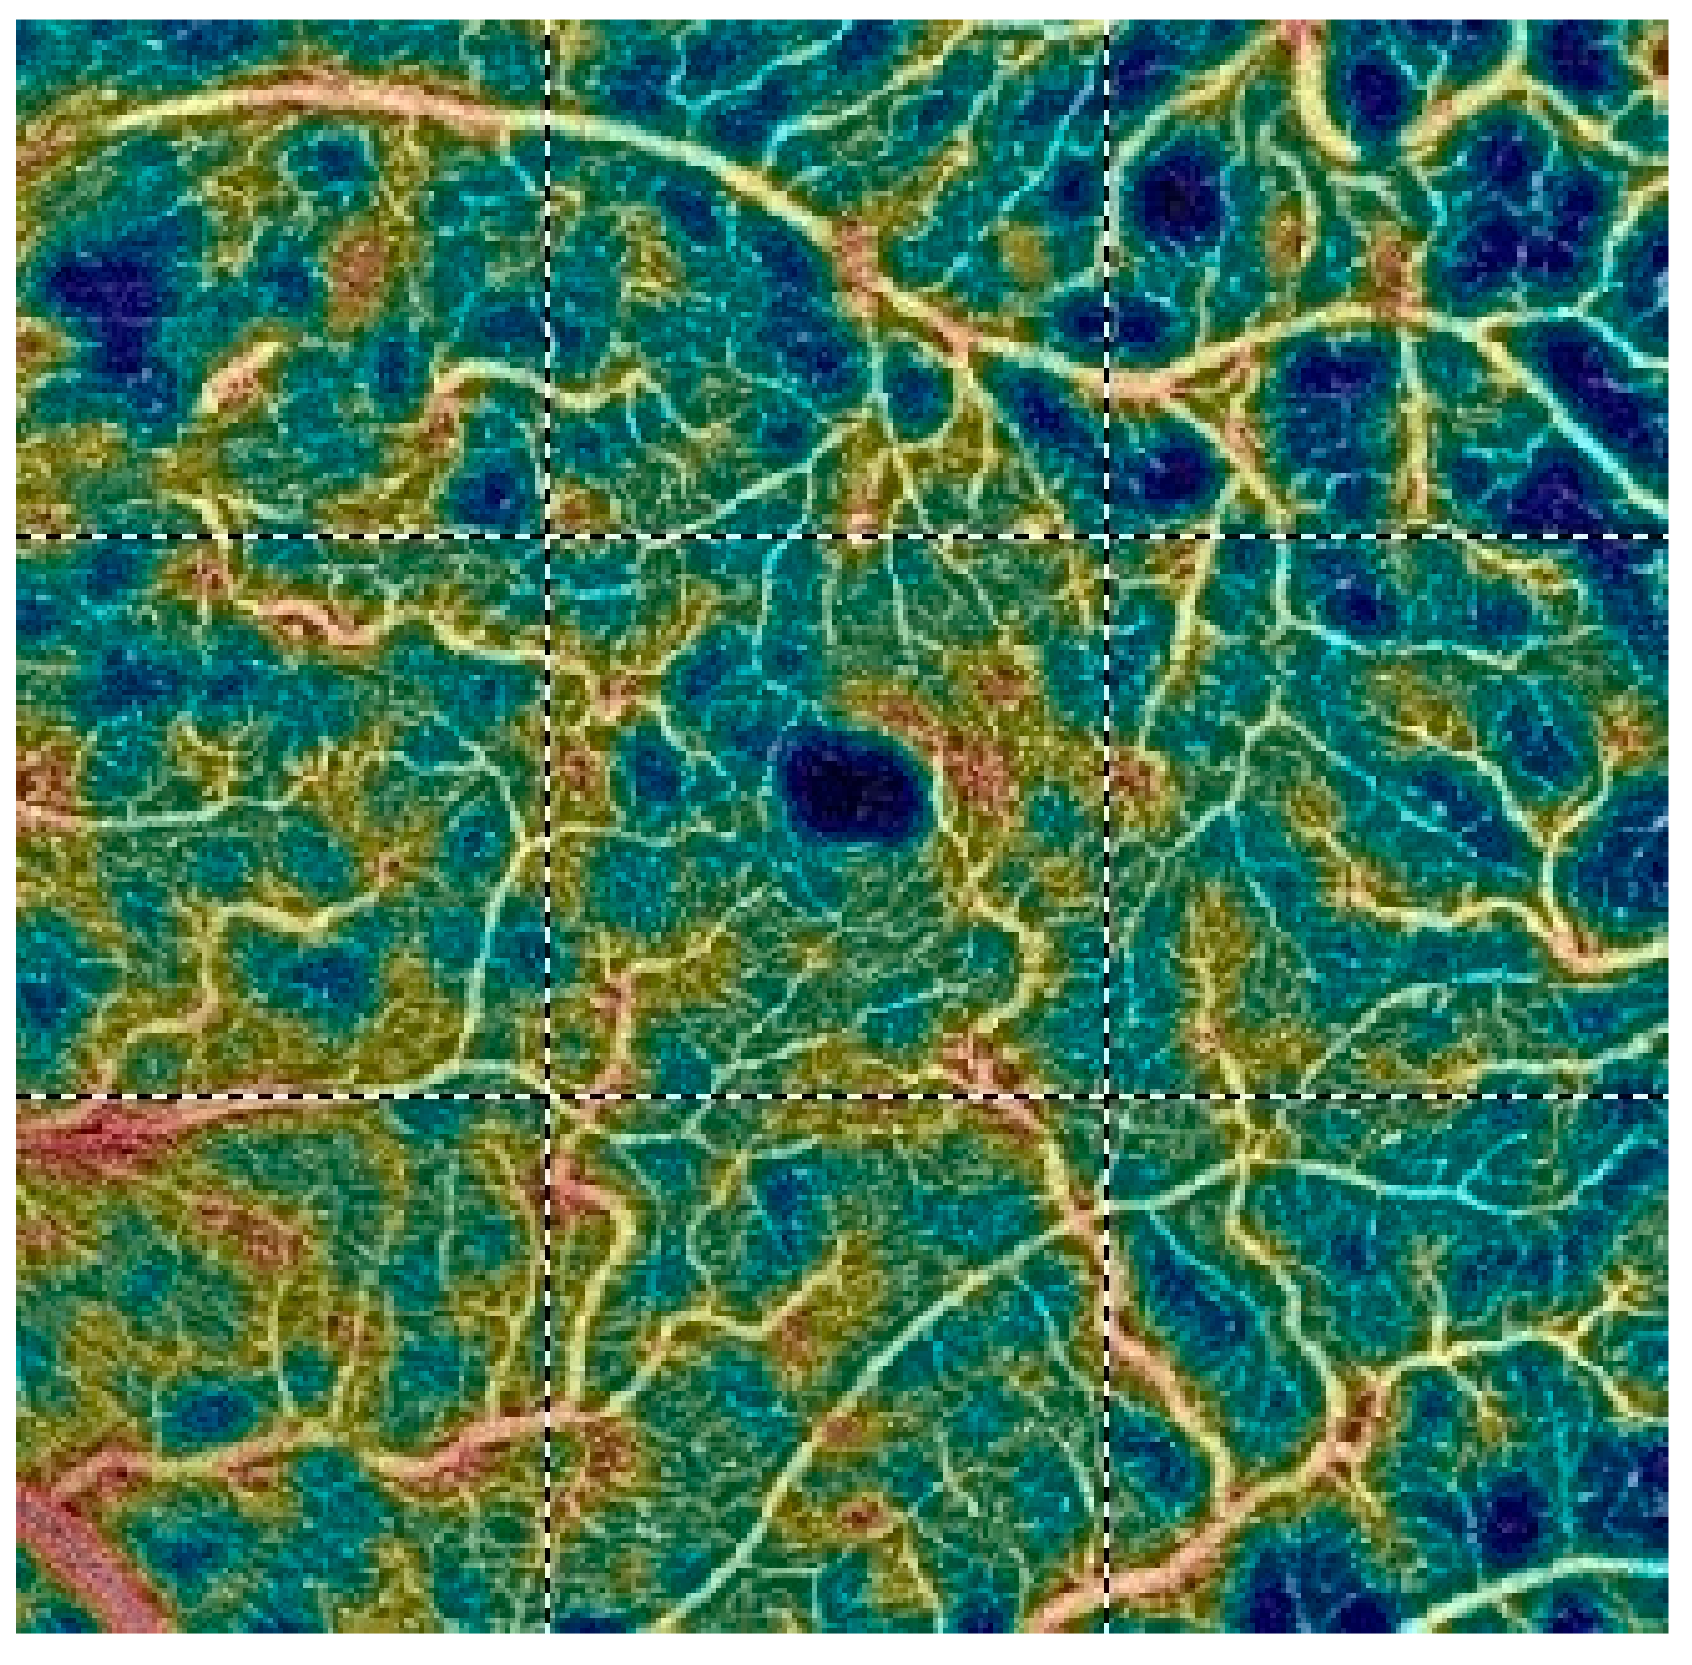
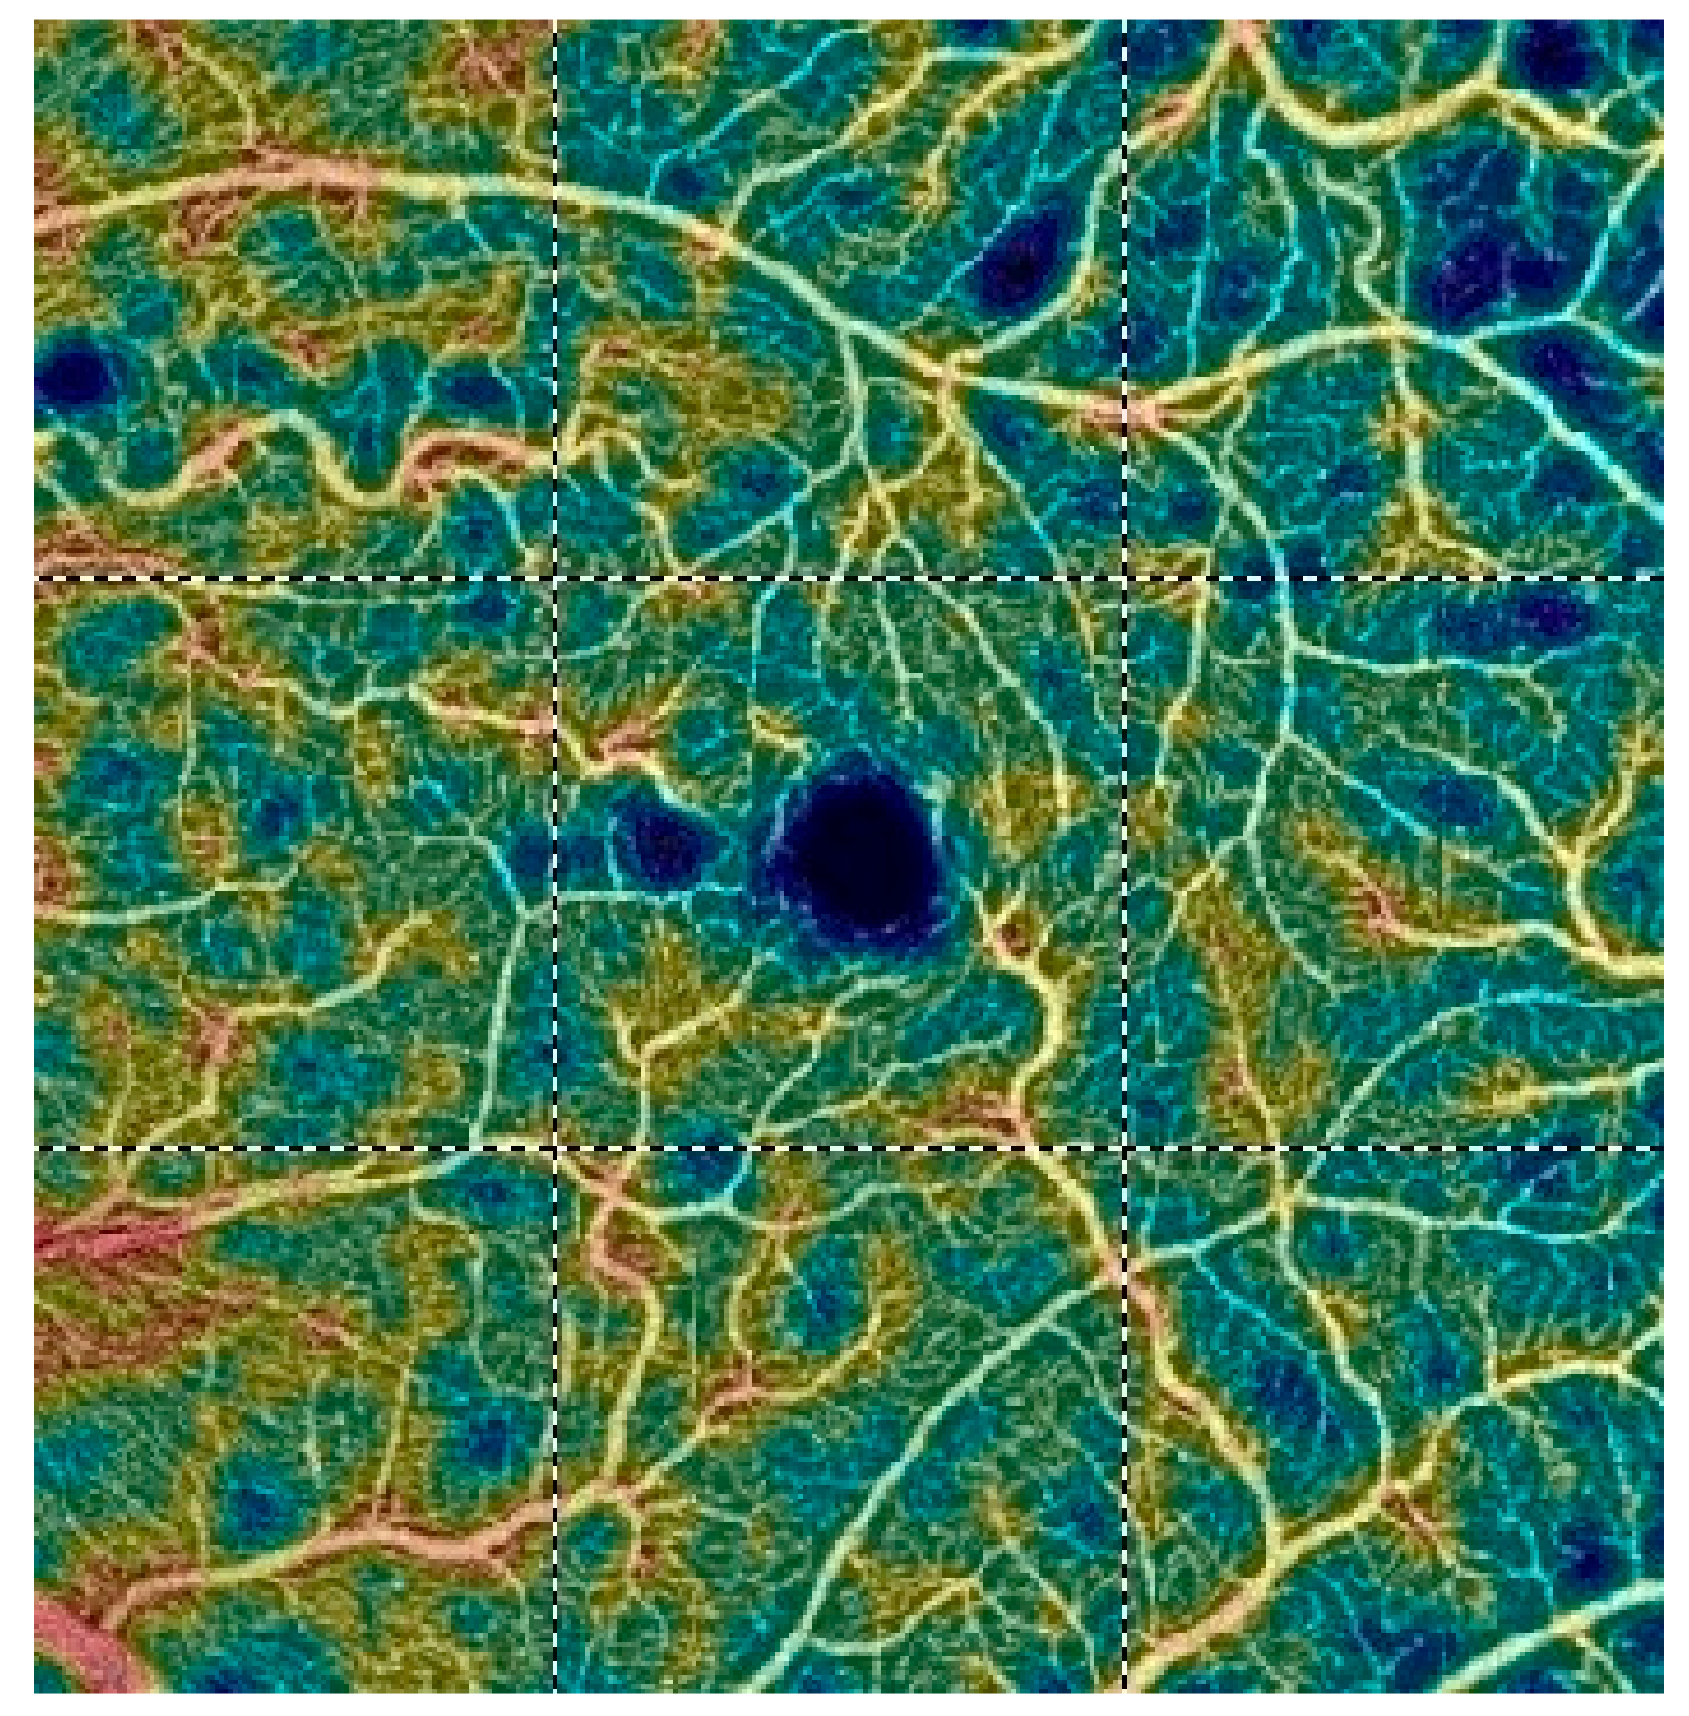
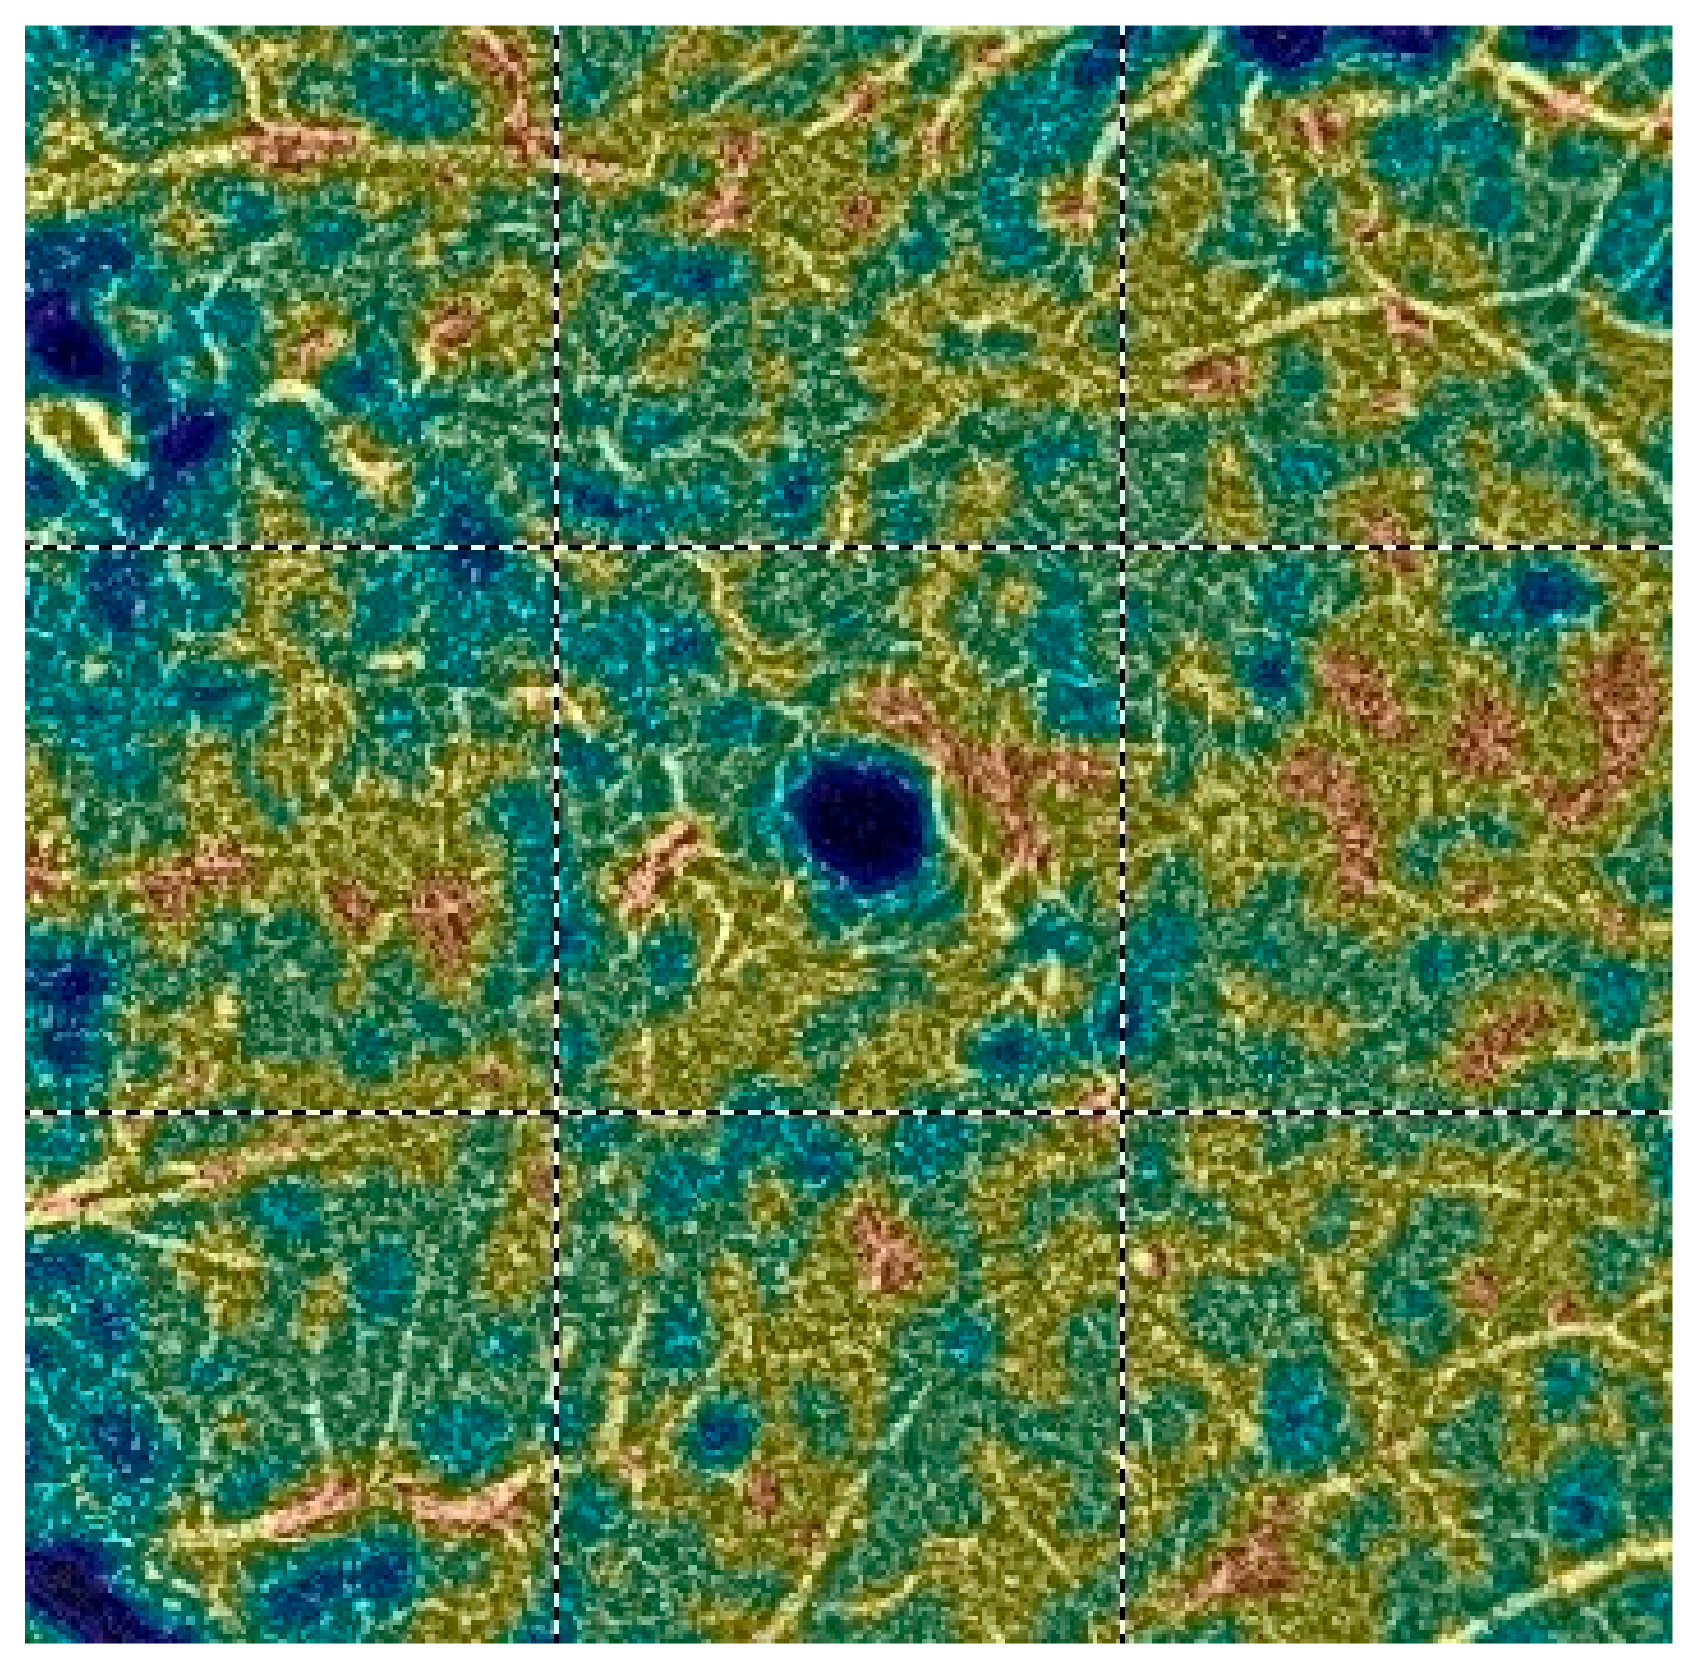
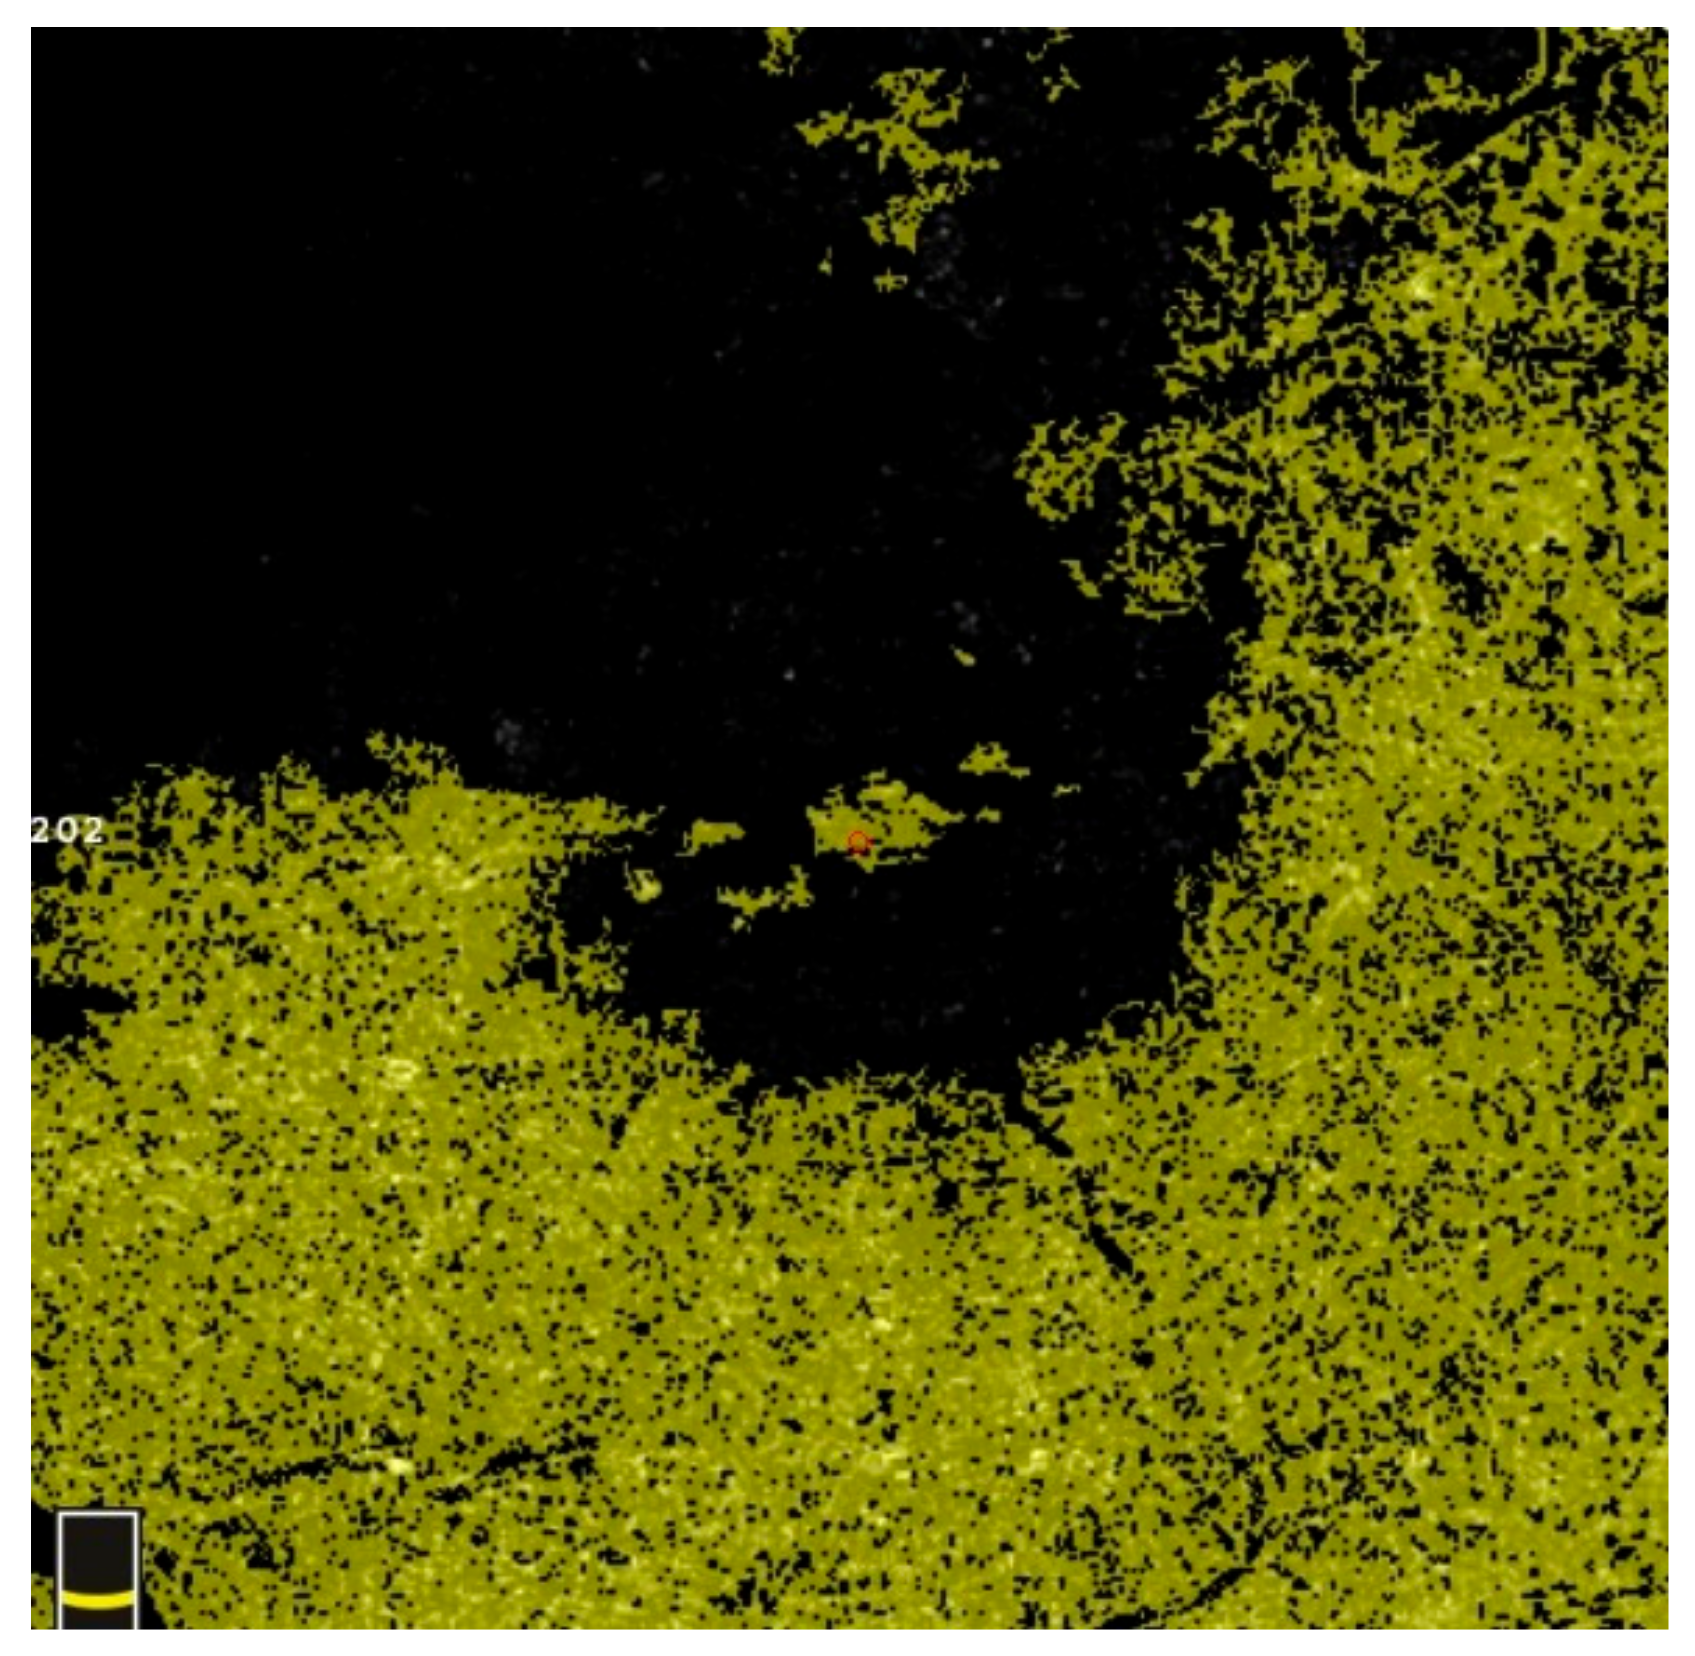
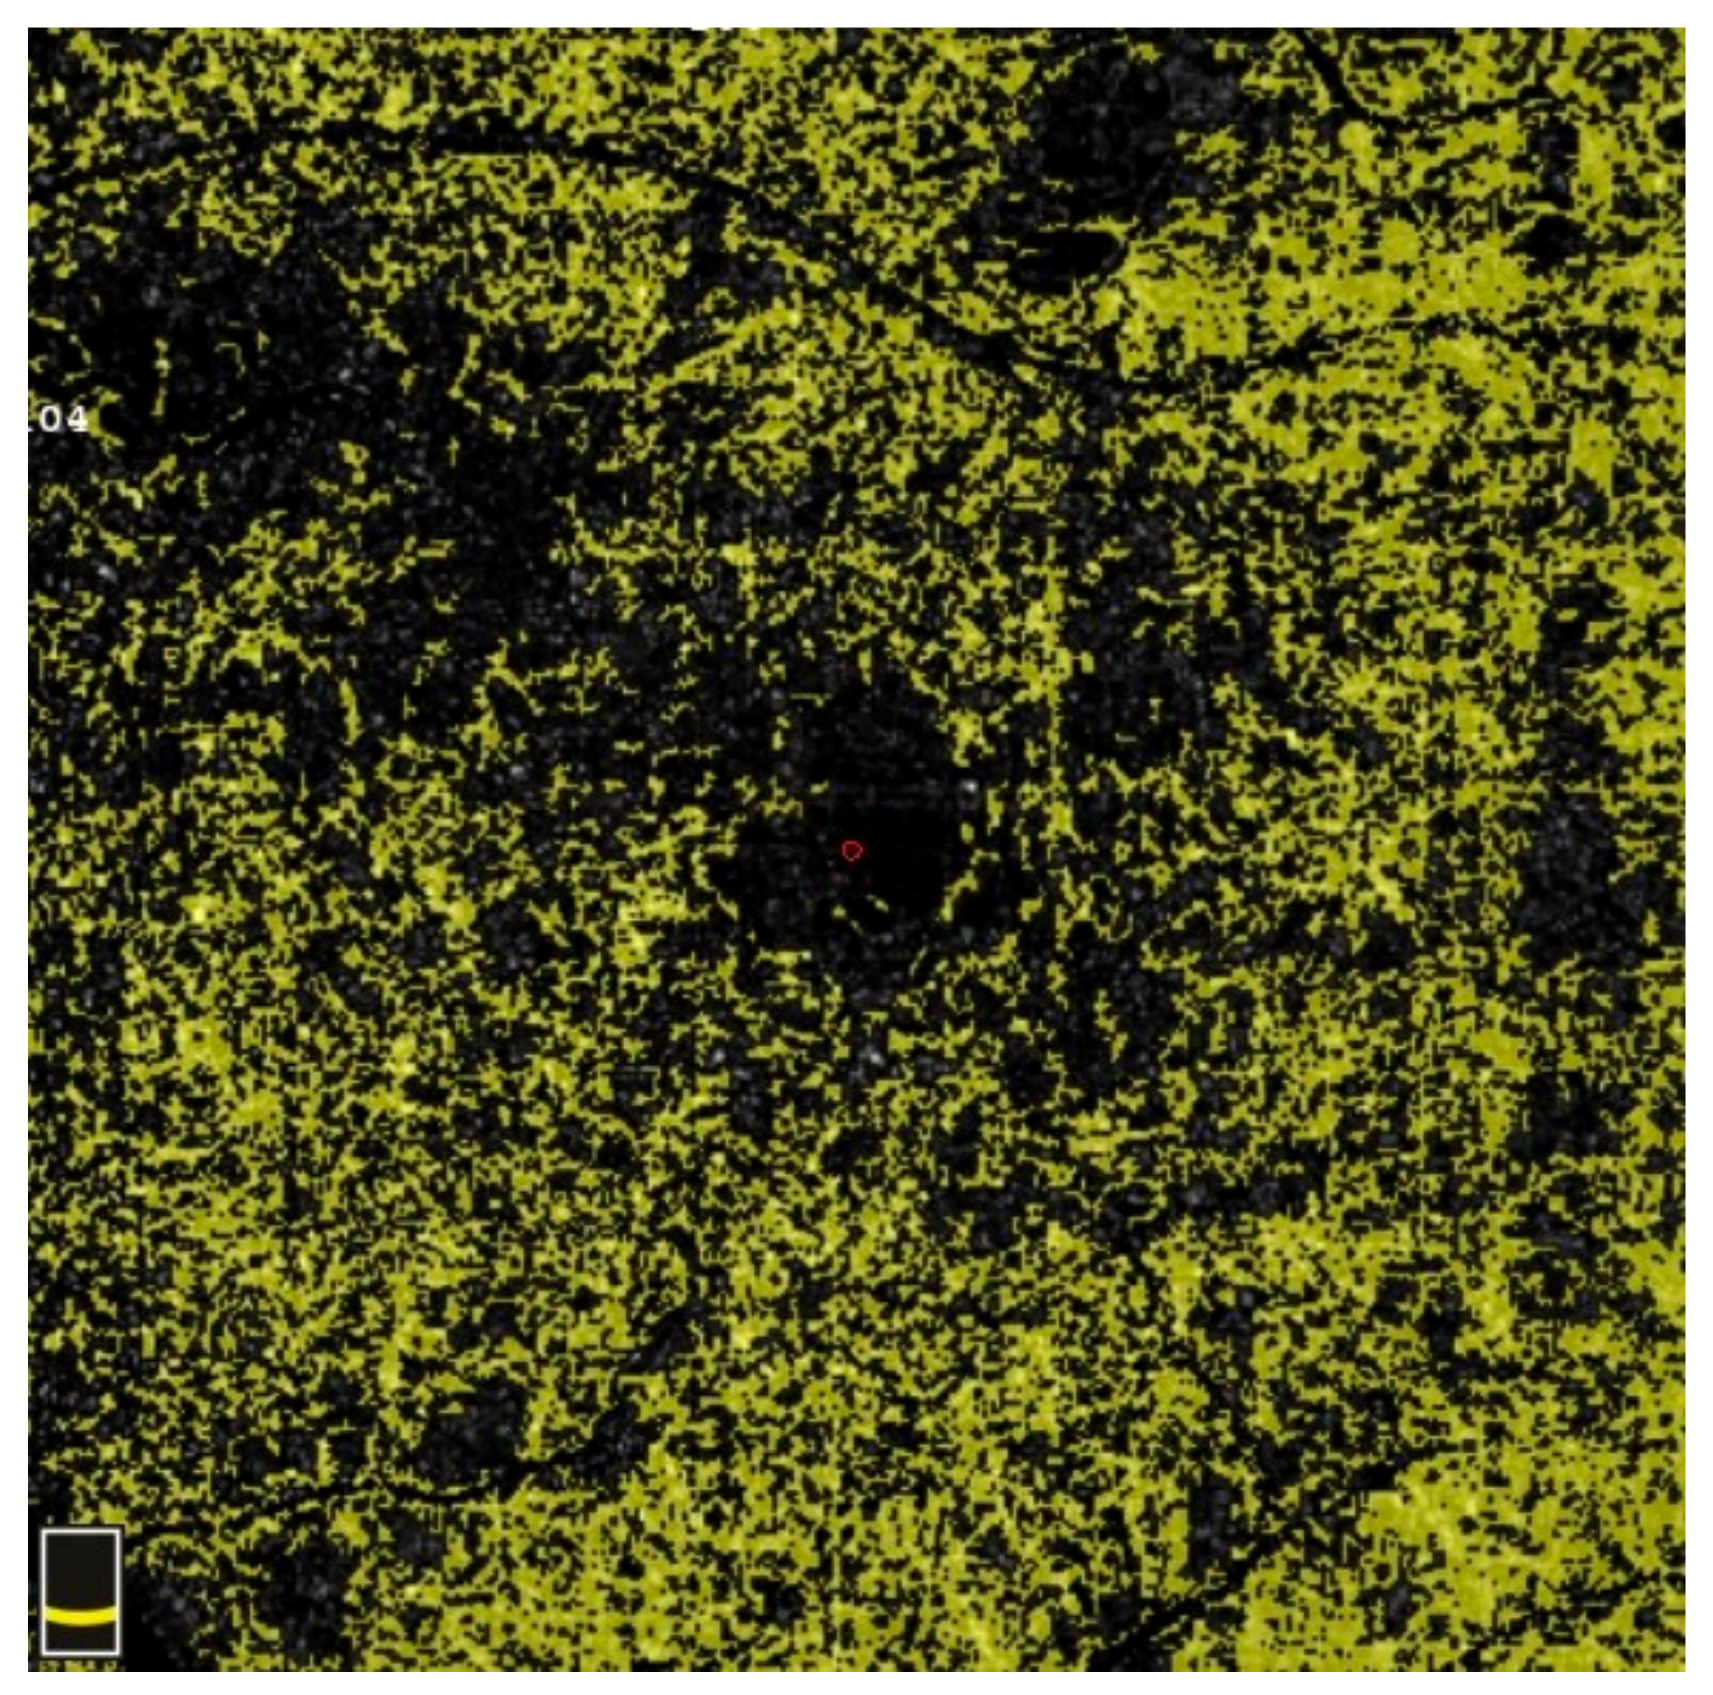
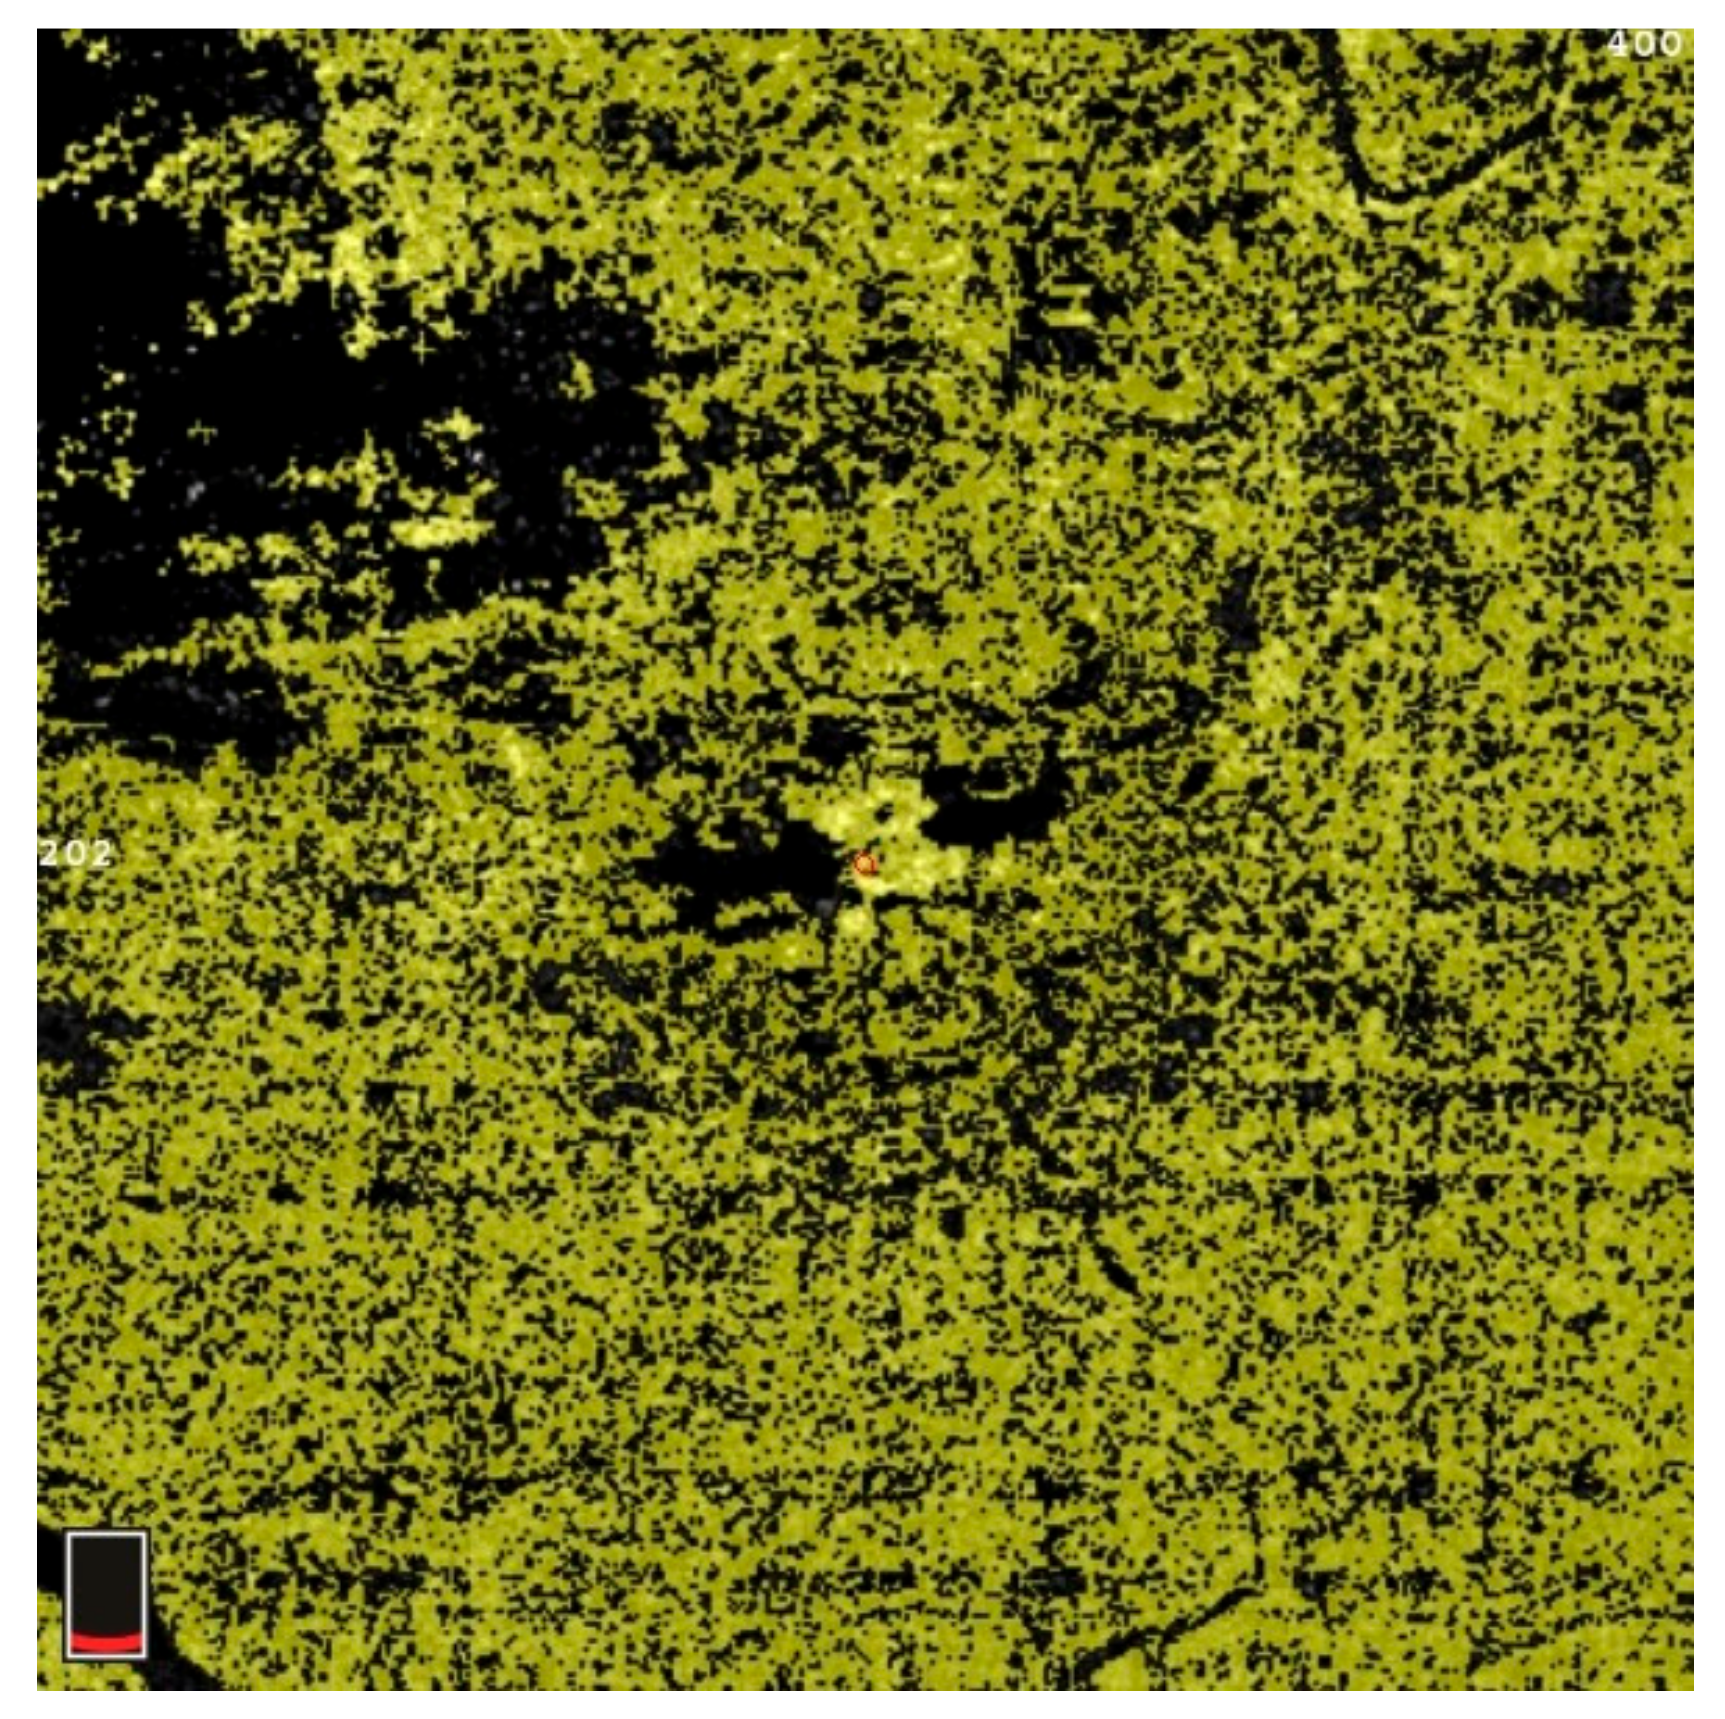
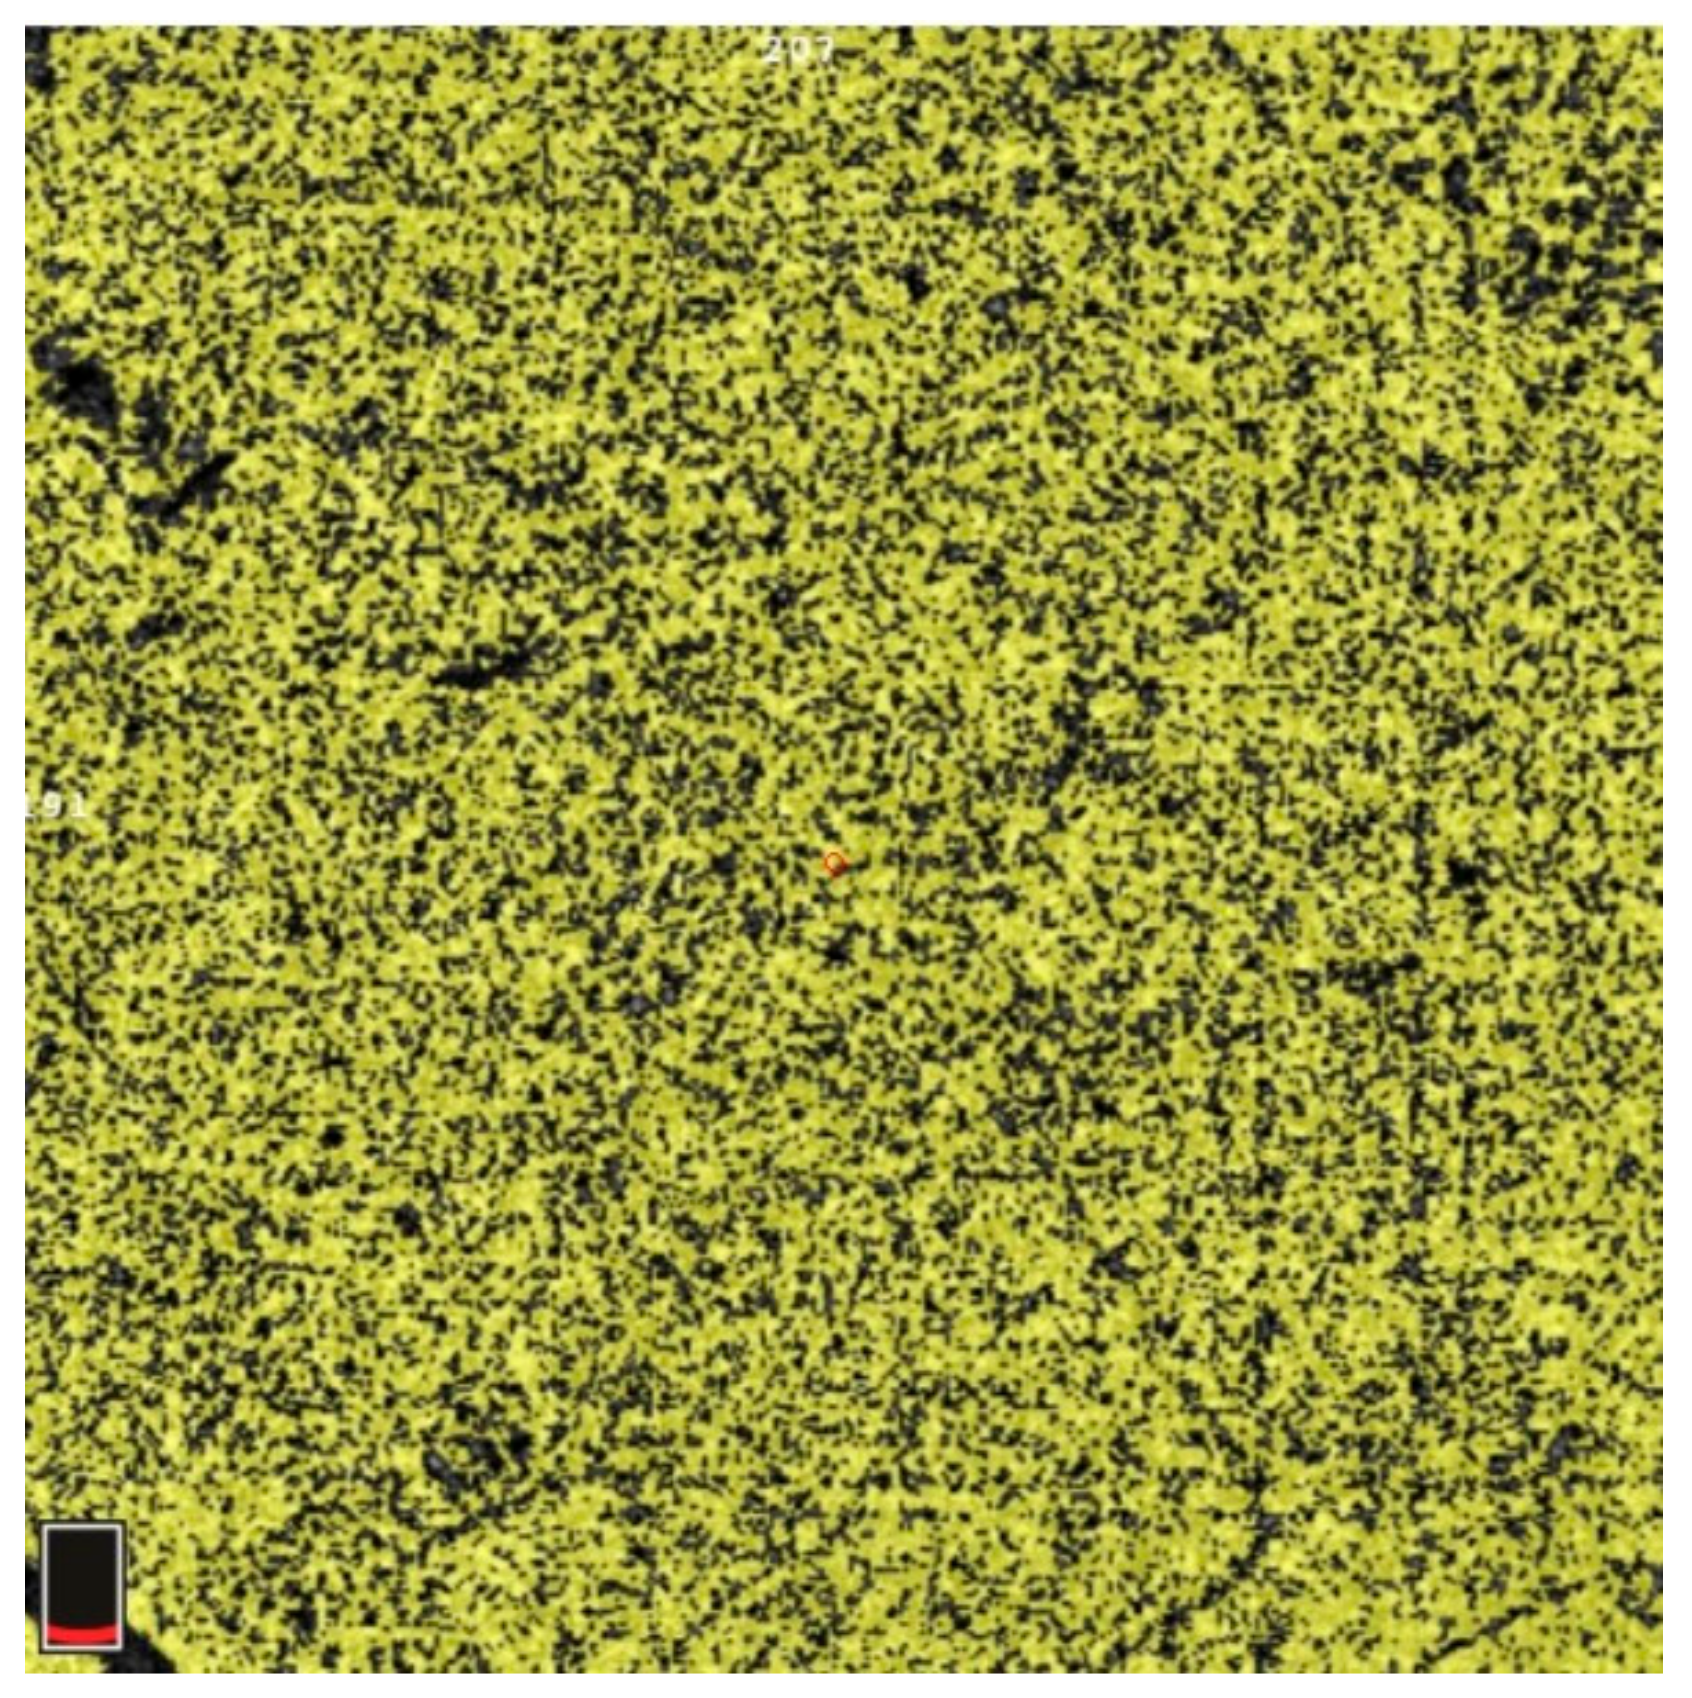
7. Examples of OCT-A Scans before and after Treatment
Author Contributions
Funding
Institutional Review Board Statement
Informed Consent Statement
Data Availability Statement
Acknowledgments
Conflicts of Interest
References
- Gao, L.; Zhou, L.; Tian, C.; Li, N.; Shao, W.; Peng, X.; Shi, Q. Intravitreal dexamethasone implants versus intravitreal anti-VEGF treatment in treating patients with retinal vein occlusion: A meta-analysis. BMC Ophthalmol. 2019, 19, 8. [Google Scholar] [CrossRef] [PubMed]
- Haller, J.A.; Bandello, F.; Belfort, R., Jr.; Blumenkranz, M.S.; Gillies, M.; Heier, J.; Loewenstein, A.; Yoon, Y.H.; Jacques, M.L.; Jiao, J.; et al. Randomized, sham-controlled trial of dexamethasone intravitreal implant in patients with macular edema due to retinal vein occlusion. Ophthalmology 2010, 117, 1134–1146.e3. [Google Scholar] [CrossRef] [PubMed]
- Jaulim, A.; Ahmed, B.; Khanam, T.; Chatziralli, I.P. Branch retinal vein occlusion: Epidemiology, pathogenesis, risk factors, clinical features, diagnosis, and complications. An update of the literature. Retina 2013, 33, 901–910. [Google Scholar] [CrossRef] [PubMed]
- Song, P.; Xu, Y.; Zha, M.; Zhang, Y.; Rudan, I. Global epidemiology of retinal vein occlusion: A systematic review and meta-analysis of prevalence, incidence, and risk factors. J. Glob. Health 2019, 9, 010427. [Google Scholar] [CrossRef]
- Rehak, J.; Rehak, M. Branch retinal vein occlusion: Pathogenesis, visual prognosis, and treatment modalities. Curr. Eye Res. 2008, 33, 111–131. [Google Scholar] [CrossRef] [PubMed]
- Karska-Basta, I.; Kubicka-Trzaska, A.; Romanowska-Dixon, B.; Undas, A. Altered fibrin clot properties in patients with retinal vein occlusion. J. Thromb. Haemost. JTH 2011, 9, 2513–2515. [Google Scholar] [CrossRef] [PubMed]
- Rogers, S.; McIntosh, R.L.; Cheung, N.; Lim, L.; Wang, J.J.; Mitchell, P.; Kowalski, J.W.; Nguyen, H.; Wong, T.Y. The prevalence of retinal vein occlusion: Pooled data from population studies from the United States, Europe, Asia, and Australia. Ophthalmology 2010, 117, 313–319.e1. [Google Scholar] [CrossRef]
- Ye, P.; Zhu, T.; Zheng, F.; Zhou, M.; Fang, X.; Yao, K. Microvascular comparison in younger and older patients with retinal vein occlusion analyzed by OCT angiography. BMC Ophthalmol. 2021, 21, 161. [Google Scholar] [CrossRef] [PubMed]
- Arai, Y.; Takahashi, H.; Inoda, S.; Sakamoto, S.; Tan, X.; Kawashima, H.; Yanagi, Y. Efficacy of a Modified Treat-and-Extend Aflibercept Regimen for Macular Oedema in Eyes with Central Retinal Vein Occlusion: 2-Year Prospective Study. J. Clin. Med. 2023, 12, 5089. [Google Scholar] [CrossRef]
- Balaratnasingam, C.; Inoue, M.; Ahn, S.; McCann, J.; Dhrami-Gavazi, E.; Yannuzzi, L.A.; Freund, K.B. Visual Acuity Is Correlated with the Area of the Foveal Avascular Zone in Diabetic Retinopathy and Retinal Vein Occlusion. Ophthalmology 2016, 123, 2352–2367. [Google Scholar] [CrossRef]
- Suzuki, N.; Hirano, Y.; Yoshida, M.; Tomiyasu, T.; Uemura, A.; Yasukawa, T.; Ogura, Y. Microvascular Abnormalities on Optical Coherence Tomography Angiography in Macular Edema Associated With Branch Retinal Vein Occlusion. Am. J. Ophthalmol. 2016, 161, 126–132.e1. [Google Scholar] [CrossRef] [PubMed]
- Huang, Y.T.; Wang, I.; Lin, C.J.; Lai, C.T.; Hsia, N.Y.; Chen, H.S.; Tien, P.T.; Bair, H.; Lin, J.M.; Chen, W.L.; et al. Comparison of Choroidal Thickness, Foveal Avascular Zone, and Macular Capillary Density in Macular Edema Secondary to Branch Retinal Vein Occlusion Treated with Ranibizumab or Aflibercept-A Prospective Study. Medicina 2022, 58, 540. [Google Scholar] [CrossRef]
- Suzuki, N.; Hirano, Y.; Tomiyasu, T.; Esaki, Y.; Uemura, A.; Yasukawa, T.; Yoshida, M.; Ogura, Y. Retinal Hemodynamics Seen on Optical Coherence Tomography Angiography Before and After Treatment of Retinal Vein Occlusion. Investig. Ophthalmol. Vis. Sci. 2016, 57, 5681–5687. [Google Scholar] [CrossRef]
- Nicolai, M.; Franceschi, A.; Turris, S.; Rosati, A.; Pirani, V.; Mariotti, C. Papillary Vessel Density Changes After Intravitreal Anti-VEGF Injections in Hypertensive Patients with Central Retinal Vein Occlusion: An Angio-OCT Study. J. Clin. Med. 2019, 8, 1636. [Google Scholar] [CrossRef] [PubMed]
- Tsai, G.; Banaee, T.; Conti, F.F.; Singh, R.P. Optical Coherence Tomography Angiography in Eyes with Retinal Vein Occlusion. J. Ophthalmic Vis. Res. 2018, 13, 315–332. [Google Scholar] [PubMed]
- Campochiaro, P.A.; Bhisitkul, R.B.; Shapiro, H.; Rubio, R.G. Vascular endothelial growth factor promotes progressive retinal nonperfusion in patients with retinal vein occlusion. Ophthalmology 2013, 120, 795–802. [Google Scholar] [CrossRef] [PubMed]
- Shimura, M.; Yasuda, K. Macular ischaemia after intravitreal bevacizumab injection in patients with central retinal vein occlusion and a history of diabetes and vascular disease. Br. J. Ophthalmol. 2010, 94, 381–383. [Google Scholar] [CrossRef] [PubMed]
- Mansour, A.M.; Bynoe, L.A.; Welch, J.C.; Pesavento, R.; Mahendradas, P.; Ziemssen, F.; Pai, S.A. Retinal vascular events after intravitreal bevacizumab. Acta Ophthalmol. 2010, 88, 730–735. [Google Scholar] [CrossRef]
- Choi, K.E.; Yun, C.; Cha, J.; Kim, S.W. OCT angiography features associated with macular edema recurrence after intravitreal bevacizumab treatment in branch retinal vein occlusion. Sci. Rep. 2019, 9, 14153. [Google Scholar] [CrossRef]
- Kang, J.W.; Yoo, R.; Jo, Y.H.; Kim, H.C. Correlation of Microvascular Structures on Optical Coherence Tomography Angiography with Visual Acuity in Retinal Vein Occlusion. Retina 2017, 37, 1700–1709. [Google Scholar] [CrossRef]
- Rispoli, M.; Savastano, M.C.; Lumbroso, B. Capillary Network Anomalies in Branch Retinal Vein Occlusion on Optical Coherence Tomography Angiography. Retina 2015, 35, 2332–2338. [Google Scholar] [CrossRef] [PubMed]
- Sellam, A.; Glacet-Bernard, A.; Coscas, F.; Miere, A.; Coscas, G.; Souied, E.H. Qualitative and quantitative follow-up using optical coherence tomography angiography of retinal vein occlusion treated with anti-vegf: Optical Coherence Tomography Angiography Follow-up of Retinal Vein Occlusion. Retina 2017, 37, 1176–1184. [Google Scholar] [CrossRef] [PubMed]
- Wang, X.; Jiang, C.; Kong, X.; Yu, X.; Sun, X. Peripapillary retinal vessel density in eyes with acute primary angle closure: An optical coherence tomography angiography study. Graefes Arch. Clin. Exp. Ophthalmol. Albrecht Graefes Arch. Klin. Exp. Ophthalmol. 2017, 255, 1013–1018. [Google Scholar] [CrossRef] [PubMed]
- De Carlo, T.E.; Chin, A.T.; Joseph, T.; Baumal, C.R.; Witkin, A.J.; Duker, J.S.; Waheed, N.K. Distinguishing Diabetic Macular Edema From Capillary Nonperfusion Using Optical Coherence Tomography Angiography. Ophthalmic Surg. Lasers Imaging Retin. 2016, 47, 108–114. [Google Scholar] [CrossRef]
- Mane, V.; Dupas, B.; Gaudric, A.; Bonnin, S.; Pedinielli, A.; Bousquet, E.; Erginay, A.; Tadayoni, R.; Couturier, A. Correlation between Cystoid Spaces in Chronic Diabetic Macular Edema and Capillary Nonperfusion Detected by Optical Coherence Tomography Angiography. Retina 2016, 36 (Suppl. S1), S102–S110. [Google Scholar] [CrossRef]
- Samara, W.A.; Shahlaee, A.; Sridhar, J.; Khan, M.A.; Ho, A.C.; Hsu, J. Quantitative Optical Coherence Tomography Angiography Features and Visual Function in Eyes With Branch Retinal Vein Occlusion. Am. J. Ophthalmol. 2016, 166, 76–83. [Google Scholar] [CrossRef] [PubMed]
- Costanzo, E.; Parravano, M.; Gilardi, M.; Cavalleri, M.; Sacconi, R.; Aragona, E.; Varano, M.; Bandello, F.; Querques, G. Microvascular Retinal and Choroidal Changes in Retinal Vein Occlusion Analyzed by Two Different Optical Coherence Tomography Angiography Devices. Ophthalmologica 2019, 242, 8–15. [Google Scholar] [CrossRef] [PubMed]
- Tripathy, S.; Le, H.G.; Cicinelli, M.V.; Gill, M.K. Longitudinal Changes on Optical Coherence Tomography Angiography in Retinal Vein Occlusion. J. Clin. Med. 2021, 10, 1423. [Google Scholar] [CrossRef]
- Enders, C.; Lang, G.E.; Dreyhaupt, J.; Loidl, M.; Lang, G.K.; Werner, J.U. Quantity and quality of image artifacts in optical coherence tomography angiography. PLoS ONE 2019, 14, e0210505. [Google Scholar] [CrossRef]
- Casselholmde Salles, M.; Kvanta, A.; Amren, U.; Epstein, D. Optical Coherence Tomography Angiography in Central Retinal Vein Occlusion: Correlation Between the Foveal Avascular Zone and Visual Acuity. Investig. Ophthalmol. Vis. Sci. 2016, 57, 242–246. [Google Scholar] [CrossRef]
- Sakanishi, Y.; Yasuda, K.; Morita, S.; Mashimo, K.; Tamaki, K.; Sakuma, T.; Ebihara, N. Twenty-four-month results of intravitreal aflibercept for macular edema due to branch retinal vein occlusion. Jpn. J. Ophthalmol. 2021, 65, 63–68. [Google Scholar] [CrossRef] [PubMed]
- Chung, C.Y.; Tang, H.H.Y.; Li, S.H.; Li, K.K.W. Differential microvascular assessment of retinal vein occlusion with coherence tomography angiography and fluorescein angiography: A blinded comparative study. Int. Ophthalmol. 2018, 38, 1119–1128. [Google Scholar] [CrossRef] [PubMed]
- Seknazi, D.; Coscas, F.; Sellam, A.; Rouimi, F.; Coscas, G.; Souied, E.H.; Glacet-Bernard, A. Optical Coherence Tomography Angiography in Retinal Vein Occlusion: Correlations Between Macular Vascular Density, Visual Acuity, and Peripheral Nonperfusion Area on Fluorescein Angiography. Retina 2018, 38, 1562–1570. [Google Scholar] [CrossRef] [PubMed]
- Coscas, F.; Glacet-Bernard, A.; Miere, A.; Caillaux, V.; Uzzan, J.; Lupidi, M.; Coscas, G.; Souied, E.H. Optical Coherence Tomography Angiography in Retinal Vein Occlusion: Evaluation of Superficial and Deep Capillary Plexa. Am. J. Ophthalmol. 2016, 161, 160–171.e2. [Google Scholar] [CrossRef] [PubMed]
- Tsuboi, K.; Ishida, Y.; Kamei, M. Gap in Capillary Perfusion on Optical Coherence Tomography Angiography Associated With Persistent Macular Edema in Branch Retinal Vein Occlusion. Investig. Ophthalmol. Vis. Sci. 2017, 58, 2038–2043. [Google Scholar] [CrossRef] [PubMed]
- Wons, J.; Pfau, M.; Wirth, M.A.; Freiberg, F.J.; Becker, M.D.; Michels, S. Optical Coherence Tomography Angiography of the Foveal Avascular Zone in Retinal Vein Occlusion. Ophthalmologica 2016, 235, 195–202. [Google Scholar] [CrossRef] [PubMed]
- Kadomoto, S.; Muraoka, Y.; Ooto, S.; Miwa, Y.; Iida, Y.; Suzuma, K.; Murakami, T.; Ghashut, R.; Tsujikawa, A.; Yoshimura, N. Evaluation of Macular Ischemia in Eyes with Branch Retinal Vein Occlusion: An Optical Coherence Tomography Angiography Study. Retina 2018, 38, 272–282. [Google Scholar] [CrossRef]
- Winegarner, A.; Wakabayashi, T.; Fukushima, Y.; Sato, T.; Hara-Ueno, C.; Busch, C.; Nishiyama, I.; Shiraki, N.; Sayanagi, K.; Nishida, K.; et al. Changes in Retinal Microvasculature and Visual Acuity After Antivascular Endothelial Growth Factor Therapy in Retinal Vein Occlusion. Investig. Ophthalmol. Vis. Sci. 2018, 59, 2708–2716. [Google Scholar] [CrossRef]
- Heier, J.S.; Campochiaro, P.A.; Yau, L.; Li, Z.; Saroj, N.; Rubio, R.G.; Lai, P. Ranibizumab for macular edema due to retinal vein occlusions: Long-term follow-up in the HORIZON trial. Ophthalmology 2012, 119, 802–809. [Google Scholar] [CrossRef]
- Papadia, M.; Misteli, M.; Jeannin, B.; Herbort, C.P. The influence of anti-VEGF therapy on present day management of macular edema due to BRVO and CRVO: A longitudinal analysis on visual function, injection time interval and complications. Int. Ophthalmol. 2014, 34, 1193–1201. [Google Scholar] [CrossRef]


| Variable | Study Eyes | Control Eyes | |||||
|---|---|---|---|---|---|---|---|
| X ± SD | Range | Median | X ± SD | Range | Median | p-Value | |
| CRT (μm) | 620.6 ± 120.9 | 397–856 | 632 | 317.6 ± 25.5 | 263–384 | 319 | p < 0.0001 |
| NFA (mm2) | 4.76 ± 2.43 | 1.55–10.66 | 4.21 | 1.18 ± 0.83 | 0.25–3.27 | 0.95 | p < 0.0001 |
| VDSF (%) | 45.21 ± 4.34 | 35.2–52.6 | 44.8 | 47.68 ± 4.29 | 35.3–56.0 | 47.7 | p = 0.04 |
| VDD (%) | 44.54 ± 4.24 | 36.4–51.3 | 44.8 | 47.84 ± 6.38 | 37.0–59.8 | 48.8 | p = 0.03 |
| FAOR (mm2) | 17.54 ± 4.06 | 6.7–25.8 | 17.7 | 14.58 ± 3.73 | 8.4–22.3 | 15.4 | p = 0.01 |
| FACC (mm2) | 20.74 ± 3/14 | 1.70–24.1 | 21.0 | 25.16 ± 1.41 | 21.1–27.2 | 25.2 | p < 0.0001 |
| FAZ (mm2) | 0.19 ± 0.16 | 0.04–0.92 | 0.15 | 0.26 ± 0.08 | 0.08–0.40 | 0.27 | p < 0.001 |
| MD (dB) | 7.67 ± 4.66 | 1.8–17.8 | 6.3 | 2.43 ± 2.87 | −1.1–9.7 | 1.3 | p < 0.0001 |
| BCVA | 0.13 ± 0.13 | 0.02–0.5 | 0.1 | 0.78 ± 0.17 | 0.5–1.0 | 0.8 | p < 0.0001 |
| Variable | Study Eyes | Control Eyes | |||||
|---|---|---|---|---|---|---|---|
| X ± SD | Range | Median | X ± SD | Range | Median | p-Value | |
| CRT (μm) | 386.8 ± 82.8 | 299–653 | 359 | 322.2 ± 23.7 | 272–385 | 323 | p < 0.0001 |
| NFA (mm2) | 6.37 ± 2.48 | 3.03–12.33 | 6.15 | 1.06 ± 0.79 | 0.15–3.61 | 0.90 | p < 0.0001 |
| VDSF (%) | 42.81 ± 4.02 | 34.1–50.2 | 43.3 | 49.11 ± 3.18 | 43.0–57.3 | 49.0 | p < 0.0001 |
| VDD (%) | 40.74 ± 3.99 | 35.6–53.6 | 40.1 | 50.04 ± 5.97 | 38.5–62.9 | 49.3 | p < 0.0001 |
| FAOR (mm2) | 12.94 ± 4.45 | 6.33–21.4 | 12.8 | 14.72 ± 3.50 | 8.5–23.3 | 14.79 | p = 0.1 |
| FACC (mm2) | 23.63 ± 1.42 | 20.7–26.6 | 23.6 | 25.3 ± 0.99 | 23.3–27.6 | 25.3 | p = 0.1 |
| FAZ (mm2) | 0.24 ± 0.11 | 0.07–0.55 | 0.21 | 0.25 ± 0.08 | 0.08–0.41 | 0.24 | p = 0.3 |
| MD (dB) | 6.27 ± 4.12 | 1.1–15.6 | 5.5 | 1.95 ± 2.53 | −1.4–8.1 | 1.1 | p < 0.0001 |
| BCVA | 0.34 ± 0.27 | 0.04–0.8 | 0.2 | 0.83 ± 0.17 | 0.5–1.0 | 0.9 | p < 0.0001 |
| Variable | Study Eyes | Control Eyes | |||||
|---|---|---|---|---|---|---|---|
| X ± SD | Range | Median | X ± SD | Range | Median | p-Value | |
| CRT (μm) | 336.8 ± 33.3 | 252–385 | 343.5 | 321.1 ± 24.6 | 266–392 | 323.5 | p = 0.08 |
| NFA (mm2) | 4.20 ± 2.13 | 1.05–11.32 | 4.15 | 0.88 ± 0.60 | 0.12–2.51 | 0.71 | p < 0.0001 |
| VDSF (%) | 44.73 ± 4.87 | 28.9–51.1 | 46.1 | 49.03 ± 3.62 | 37.4–55.0 | 49.5 | p < 0.0001 |
| VDD (%) | 43.84 ± 4.54 | 37.0–53.0 | 44.55 | 51.10 ± 5.47 | 38.6–60.7 | 51.7 | p < 0.0001 |
| FAOR (mm2) | 12.63 ± 4.28 | 4.07–20.87 | 12.9 | 14.85 ± 3.38 | 9.40–23.70 | 15.0 | p = 0.05 |
| FACC (mm2) | 24.14 ± 1.44 | 21.9–26.6 | 24.2 | 25.3 ± 1.02 | 23.7–27.2 | 25.2 | p < 0.001 |
| FAZ (mm2) | 0.28 ± 0.11 | 0.15–0.57 | 0.26 | 0.26 ± 0.09 | 0.05–0.41 | 0.27 | p = 0.7 |
| MD (dB) | 5.0 ± 3.5 | 1.0–14.5 | 4.1 | 1.47–2.44 | −1.8–7.2 | 0.7 | p < 0.0001 |
| BCVA | 0.44 ± 0.29 | 0.06–0.9 | 0.4 | 0.90 ± 0.11 | 0.7–1.0 | 1.0 | p < 0.0001 |
| Variable | Study Eyes | Control Eyes | |||||
|---|---|---|---|---|---|---|---|
| X ± SD | Range | Median | X ± SD | Range | Median | p-Value | |
| CRT (μm) | 330.0 ± 30.7 | 255–377 | 337.0 | 320.6 ± 25.4 | 267–389 | 321.0 | p = 0.2 |
| NFA (mm2) | 3.67 ± 2.12 | 1.00–11.30 | 3.63 | 0.84 ± 0.61 | 0.15–2.53 | 0.62 | p < 0.0001 |
| VDSF (%) | 44.90–4.89 | 28.0–50.9 | 46.10 | 48.85 ± 3.97 | 35.2–54.2 | 50.1 | p < 0.0001 |
| VDD (%) | 44.7 ± 4.77 | 33.6–53.5 | 45.6 | 51.75 ± 5.67 | 37.6–60.8 | 52.5 | p < 0.0001 |
| FAOR (mm2) | 13.64 ± 3.93 | 5.18–20.9 | 13.4 | 15.16 ± 3.40 | 9.27–22.95 | 15.9 | p = 0.1 |
| FACC (mm2) | 24.26 ± 1.31 | 21.3–26.6 | 24.7 | 25.2 ± 1.21 | 23.0–27.5 | 25.5 | p = 0.1 |
| FAZ (mm2) | 0.31 ± 0.14 | 0.15–0.73 | 0.29 | 0.26 ± 0.08 | 0.08–0.40 | 0.27 | p = 0.3 |
| MD (dB) | 3.98 ± 2.99 | 0.1–10.6 | 3.65 | 0.91 ± 2.10 | −1.8–7.1 | 0.20 | p < 0.0001 |
| BCVA | 0.55 ± 0.27 | 0.1–1.0 | 0.6 | 0.92 ± 0.11 | 0.7–1.0 | 1.0 | p < 0.0001 |
| Variable | Study Eyes | Control Eyes | |||||
|---|---|---|---|---|---|---|---|
| X ± SD | Range | Median | X ± SD | Range | Median | p-Value | |
| CRT (μm) | 317.2 ± 35.8 | 218–363 | 328.5 | 320.0 ± 24.0 | 271–384 | 320.4 | p = 0.7 |
| NFA (mm2) | 3.33 ± 2.09 | 1.01–11.32 | 3.13 | 0.79 ± 0.54 | 0.15–2.08 | 0.53 | p < 0.0001 |
| VDSF (%) | 45.09 ± 4.95 | 27.3–50.6 | 46.1 | 49.16 ± 3.75 | 36.1–53.9 | 50.3 | p < 0.0001 |
| VDD (%) | 45.37 ± 4.70 | 35.1–53.6 | 455.2 | 51.5 ± 5.03 | 39.8–60.6 | 51.7 | p < 0.0001 |
| FAOR (mm2) | 14.15 ± 3.95 | 6.0–21.2 | 14.1 | 15.17 ± 3.35 | 8.48–22.9 | 15.9 | p = 0.3 |
| FACC (mm2) | 24.50 ± 1.23 | 21.0–26.5 | 24.8 | 25.19–1.11 | 23.1–27.4 | 25.3 | p = 0.1 |
| FAZ (mm2) | 0.31 ± 0.11 | 0.17–0.67 | 0.29 | 0.27 ± 0.08 | 0.08–0.44 | 0.27 | p = 0.2 |
| MD (dB) | 2.87–2.54 | −0.7–8.2 | 2.45 | 0.57 ± 1.95 | −2.0–6.4 | 0.00 | p < 0.0001 |
| BCVA | 0.62 ± 0.26 | 0.1–1.0 | 0.6 | 0.94 ± 0.11 | 0.7–1.0 | 1.0 | p < 0.0001 |
| Variable | Study Eyes | Control Eyes | |||||
|---|---|---|---|---|---|---|---|
| X ± SD | Range | Median | X ± SD | Range | Median | p-Value | |
| CRT (μm) | 316.6 ± 34.6 | 225–382 | 329.0 | 321.1 ± 22.4 | 276–387 | 322.5 | p = 0.6 |
| NFA (mm2) | 3.14 ± 1.98 | 0.87–10.61 | 3.04 | 0.79 ± 0.55 | 0.13–2.08 | 0.53 | p < 0.0001 |
| VDSF (%) | 45.22 ± 4.80 | 28.3–50.5 | 46.4 | 48.98 ± 3.52 | 36.5–54.7 | 50.2 | p < 0.0001 |
| VDD (%) | 45.51 ± 4.66 | 35.3–53.9 | 45.5 | 51.42 ± 4.83 | 41.4–60.7 | 51.6 | p < 0.0001 |
| FAOR (mm2) | 14.53 ± 3.79 | 6.1–21.1 | 14.4 | 15.75 ± 2.97 | 8.4–22.7 | 16.5 | p = 0.2 |
| FACC (mm2) | 24.62 ± 1.09 | 21.5–26.5 | 24.9 | 24.84 ± 2.28 | 15.5–27.5 | 25.3 | p = 0.1 |
| FAZ (mm2) | 0.31 ± 0.11 | 0.16–0.69 | 0.28 | 0.30 ± 0.14 | 0.09–0.87 | 0.28 | p = 0.7 |
| MD (dB) | 2.11 ± 2.29 | −0.8–7.6 | 1.4 | 0.26 ± 1.94 | −2.6–6.2 | −0.1 | p < 0.001 |
| BCVA | 0.64 ± 0.28 | 0.1–1.0 | 0.7 | 0.94 ± 0.10 | 0.7–1.0 | 1.0 | p < 0.0001 |
Disclaimer/Publisher’s Note: The statements, opinions and data contained in all publications are solely those of the individual author(s) and contributor(s) and not of MDPI and/or the editor(s). MDPI and/or the editor(s) disclaim responsibility for any injury to people or property resulting from any ideas, methods, instructions or products referred to in the content. |
© 2023 by the authors. Licensee MDPI, Basel, Switzerland. This article is an open access article distributed under the terms and conditions of the Creative Commons Attribution (CC BY) license (https://creativecommons.org/licenses/by/4.0/).
Share and Cite
Śpiewak, D.; Witek, K.; Drzyzga, Ł.; Mrukwa-Kominek, E. An Analysis of Optical Coherence Tomography Angiography (OCT-A) Perfusion Density Maps in Patients Treated for Retinal Vein Occlusion with Intravitreal Aflibercept. Diagnostics 2023, 13, 3100. https://doi.org/10.3390/diagnostics13193100
Śpiewak D, Witek K, Drzyzga Ł, Mrukwa-Kominek E. An Analysis of Optical Coherence Tomography Angiography (OCT-A) Perfusion Density Maps in Patients Treated for Retinal Vein Occlusion with Intravitreal Aflibercept. Diagnostics. 2023; 13(19):3100. https://doi.org/10.3390/diagnostics13193100
Chicago/Turabian StyleŚpiewak, Dorota, Katarzyna Witek, Łukasz Drzyzga, and Ewa Mrukwa-Kominek. 2023. "An Analysis of Optical Coherence Tomography Angiography (OCT-A) Perfusion Density Maps in Patients Treated for Retinal Vein Occlusion with Intravitreal Aflibercept" Diagnostics 13, no. 19: 3100. https://doi.org/10.3390/diagnostics13193100
APA StyleŚpiewak, D., Witek, K., Drzyzga, Ł., & Mrukwa-Kominek, E. (2023). An Analysis of Optical Coherence Tomography Angiography (OCT-A) Perfusion Density Maps in Patients Treated for Retinal Vein Occlusion with Intravitreal Aflibercept. Diagnostics, 13(19), 3100. https://doi.org/10.3390/diagnostics13193100