Article

One-Stage Detection without Segmentation for Multi-Type Coronary Lesions in Angiography Images Using Deep Learning

1
Department of Biomedical Engineering, Faculty of Environment and Life, Beijing University of Technology, Beijing 100124, China
2
Department of Geriatrics, The Third Medical Center of Chinese PLA General Hospital, Beijing 100039, China
3
State Key Laboratory of Cardiovascular Disease, Department of Cardiac Surgery, National Center for Cardiovascular Diseases, Fuwai Hospital, Chinese Academy of Medical Sciences, Peking Union Medical College, Beijing 100037, China
4
Department of Research Center, Shanghai United Imaging Intelligence Co., Ltd., Shanghai 201807, China
5
College of Biomedical Engineering, Capital Medical University, Beijing 100069, China
6
State Key Laboratory of Cardiovascular Disease, Department of Structural Heart Disease, National Center for Cardiovascular Diseases, Fuwai Hospital, Chinese Academy of Medical Sciences, Peking Union Medical College, Beijing 100037, China
*
Authors to whom correspondence should be addressed.
These authors contributed equally to this work and share first authorship.
Diagnostics 2023, 13(18), 3011; https://doi.org/10.3390/diagnostics13183011
Submission received: 7 August 2023 / Revised: 12 September 2023 / Accepted: 18 September 2023 / Published: 21 September 2023
(This article belongs to the Special Issue Artificial Intelligence in Clinical Medical Imaging)

Abstract

:
It is rare to use the one-stage model without segmentation for the automatic detection of coronary lesions. This study sequentially enrolled 200 patients with significant stenoses and occlusions of the right coronary and categorized their angiography images into two angle views: The CRA (cranial) view of 98 patients with 2453 images and the LAO (left anterior oblique) view of 176 patients with 3338 images. Randomization was performed at the patient level to the training set and test set using a 7:3 ratio. YOLOv5 was adopted as the key model for direct detection. Four types of lesions were studied: Local Stenosis (LS), Diffuse Stenosis (DS), Bifurcation Stenosis (BS), and Chronic Total Occlusion (CTO). At the image level, the precision, recall, [email protected], and [email protected] predicted by the model were 0.64, 0.68, 0.66, and 0.49 in the CRA view and 0.68, 0.73, 0.70, and 0.56 in the LAO view, respectively. At the patient level, the precision, recall, and F1 scores predicted by the model were 0.52, 0.91, and 0.65 in the CRA view and 0.50, 0.94, and 0.64 in the LAO view, respectively. YOLOv5 performed the best for lesions of CTO and LS at both the image level and the patient level. In conclusion, the one-stage model without segmentation as YOLOv5 is feasible to be used in automatic coronary lesion detection, with the most suitable types of lesions as LS and CTO.

1. Introduction

Coronary artery disease (CAD) is one of the most common types of cardiovascular disease. It could cause stenoses and occlusions of coronary arteries, which will finally lead to severe endpoints such as myocardial ischemia and infarction. It is also the leading cause of mortality in the world, which is responsible for 16% of the total 55.4 million deaths in recent years [1]. Coronary angiography (CAG), which is recommended as the most important examination for CAD, is considered the gold standard for the diagnosis and treatment of ischemic heart disease [2,3,4]. CAG images can provide detailed anatomical information of vessels from multiple angle views, which is better than other examinations such as coronary CT angiography (CCTA) and cardiac magnetic resonance imaging (cMRI).
However, compared to CCTA and cMRI, CAG images still have some limitations: (1) Instantaneous contrast agent inhomogeneity makes the images fuzzy, with poor contrast between vessels and surrounding tissues; (2) irregular angle views cause images to change continuously; (3) complex vessel structures in two-dimensional images cause different coronary arteries to overlap and make them difficult to distinguish. Even so, given its extensive clinical application and significant diagnostic value, many studies still try to perform studies of artificial intelligence (AI)-assisted diagnosis of CAG via the deep learning (DL) method. The method of segmentation before detection has been mostly employed in previous studies. As described in the limitations of CAG images, difficulties in defining and detecting lesions caused by overlapped coronary arteries were the major challenges in the one-stage detection of multi-type coronary lesions. However, right coronary arteries rarely encounter these challenges due to less overlap.
Currently, segmenting the coronary arteries followed by diameter measurements or stenosis evaluations is the most studied method [5,6,7]. Zhao et al. [8] classified the lesions by performing image segmentation of the vessel centerline, calculating vessel diameters, and measuring the degree of stenoses. Liu et al. [9] performed vessel boundary-aware segmentation, branch node localization, coronary artery tree construction, and vessel diameter fitting, and ultimately accomplished stenosis detection. Algarni et al. [10] employed image noise removal, contrast enhancement, and Otsu thresholding as pre-processing techniques and used attention-based nested U-Net and VGG-16 for vessel segmentation and lesion detection. Their method only generated a binary classification of normal and abnormal images. However, both vessel segmentation and the extraction of coronary artery centerlines require significant work regarding manual annotation. Meanwhile, providing pixel-level specific lesion annotations for each frame reduces the robustness of lesion assessment and limits its clinical use and applications with large datasets.
Furthermore, some studies have stepped further by incorporating the automatic selection of contrast-enhanced images to extract the key frames of diagnosis for AI analysis. Cong et al. [11] employed convolutional neural networks (CNNs) and long short-term memory (LSTM) networks for automatic detection and key frame sampling. Then, they used the modified pre-trained Inception-V3 network [12] and employed the anchor-based feature pyramid network (FPN) for stenosis localization. Similarly, Moon et al. [13] used weakly supervised DL to extract key frames and performed the classification of regions of 50% stenosis. Then, they used the convolutional block attention module (CBAM) [14] to achieve the precise localization of vessel stenosis.
Some other studies have also employed multiple types of network models to improve detection performance. Ling et al. [15] used ResNet, Mask R-CNN, and RetinaNet to construct a system that includes functionalities of classification, segmentation, and detection. Du et al. [16] designed a multi-scale CNN to extract texture features of different scales from CAG images. They used the Faster R-CNN [17] framework for the detection and localization of stenoses. Danilov et al. [18] also trained and tested eight different detectors based on various network architectures and confirmed the feasibility of DL methods for the real-time detection of coronary stenoses by the intercomparisons among them.
On the other hand, studies also used artificially synthesized data because of the significant manual pre-processing steps of CAG images. Antczak et al. [19] trained a patch-based classification model with an artificial dataset and then tuned up the network using real-world patches to improve its accuracy. Ovalle-Magallanes et al. [20] proposed a pre-trained CNN model based on transfer learning for segmentation, along with fine-tuning by artificial and real-world data, to introduce a novel method for automated stenosis detection. The relevant studies are summarized in Table 1.
However, these studies still have some limitations: (1) Data in these studies are collected from patients with CAD who might undergo medical therapy or percutaneous coronary intervention (PCI) only. Lesions of them may be mild and simple, which could not represent the real world. (2) These studies lack detailed analysis of lesions as stenoses in detailed types. Du et al. [21] segmented the coronary arteries into more than 20 segments and explored various manifestations, such as stenosis, occlusion, calcification, thrombosis, and dissection. However, they did not analyze stenoses more comprehensively, of which lesions are the most common and important in clinical practice. (3) These studies all performed detection based on segmentation. Compared to direct detection, their approaches still involved more learning steps and more complex structures. Too many methods were employed to enhance model efficiency, which leaves space for further modification.
Inspired by this, we intended to develop a strategy to overcome these shortcomings in this study. We classified vascular lesions into four categories: Local stenosis, diffuse stenosis, bifurcation stenosis, and chronic total occlusion. We conducted a multi-view analysis of angiographies from candidates and adopted YOLOv5 as the key model for segmentation-free DL study of lesion detection, localization, and classification. Furthermore, we also employed the technique of gradient-weighted class activation mapping (Grad-CAM) for the visual explanations to evaluate the model performance and the feasibility of one-stage lesion detection without segmentation.
The contributions of this study are as follows:
  • This study enrolled angiography images from patients who were candidates for coronary artery bypass (CAB) surgery for the first time to evaluate the detection performance of DL techniques with complex lesions.
  • A single-stage detection model by the region-free approach was employed for the first time to detect vascular lesions directly, aiming to improve detection efficiency.
  • A more detailed classification of vascular stenoses was performed, providing a comprehensive evaluation of the network model’s performance among different types of lesions.

2. Materials and Methods

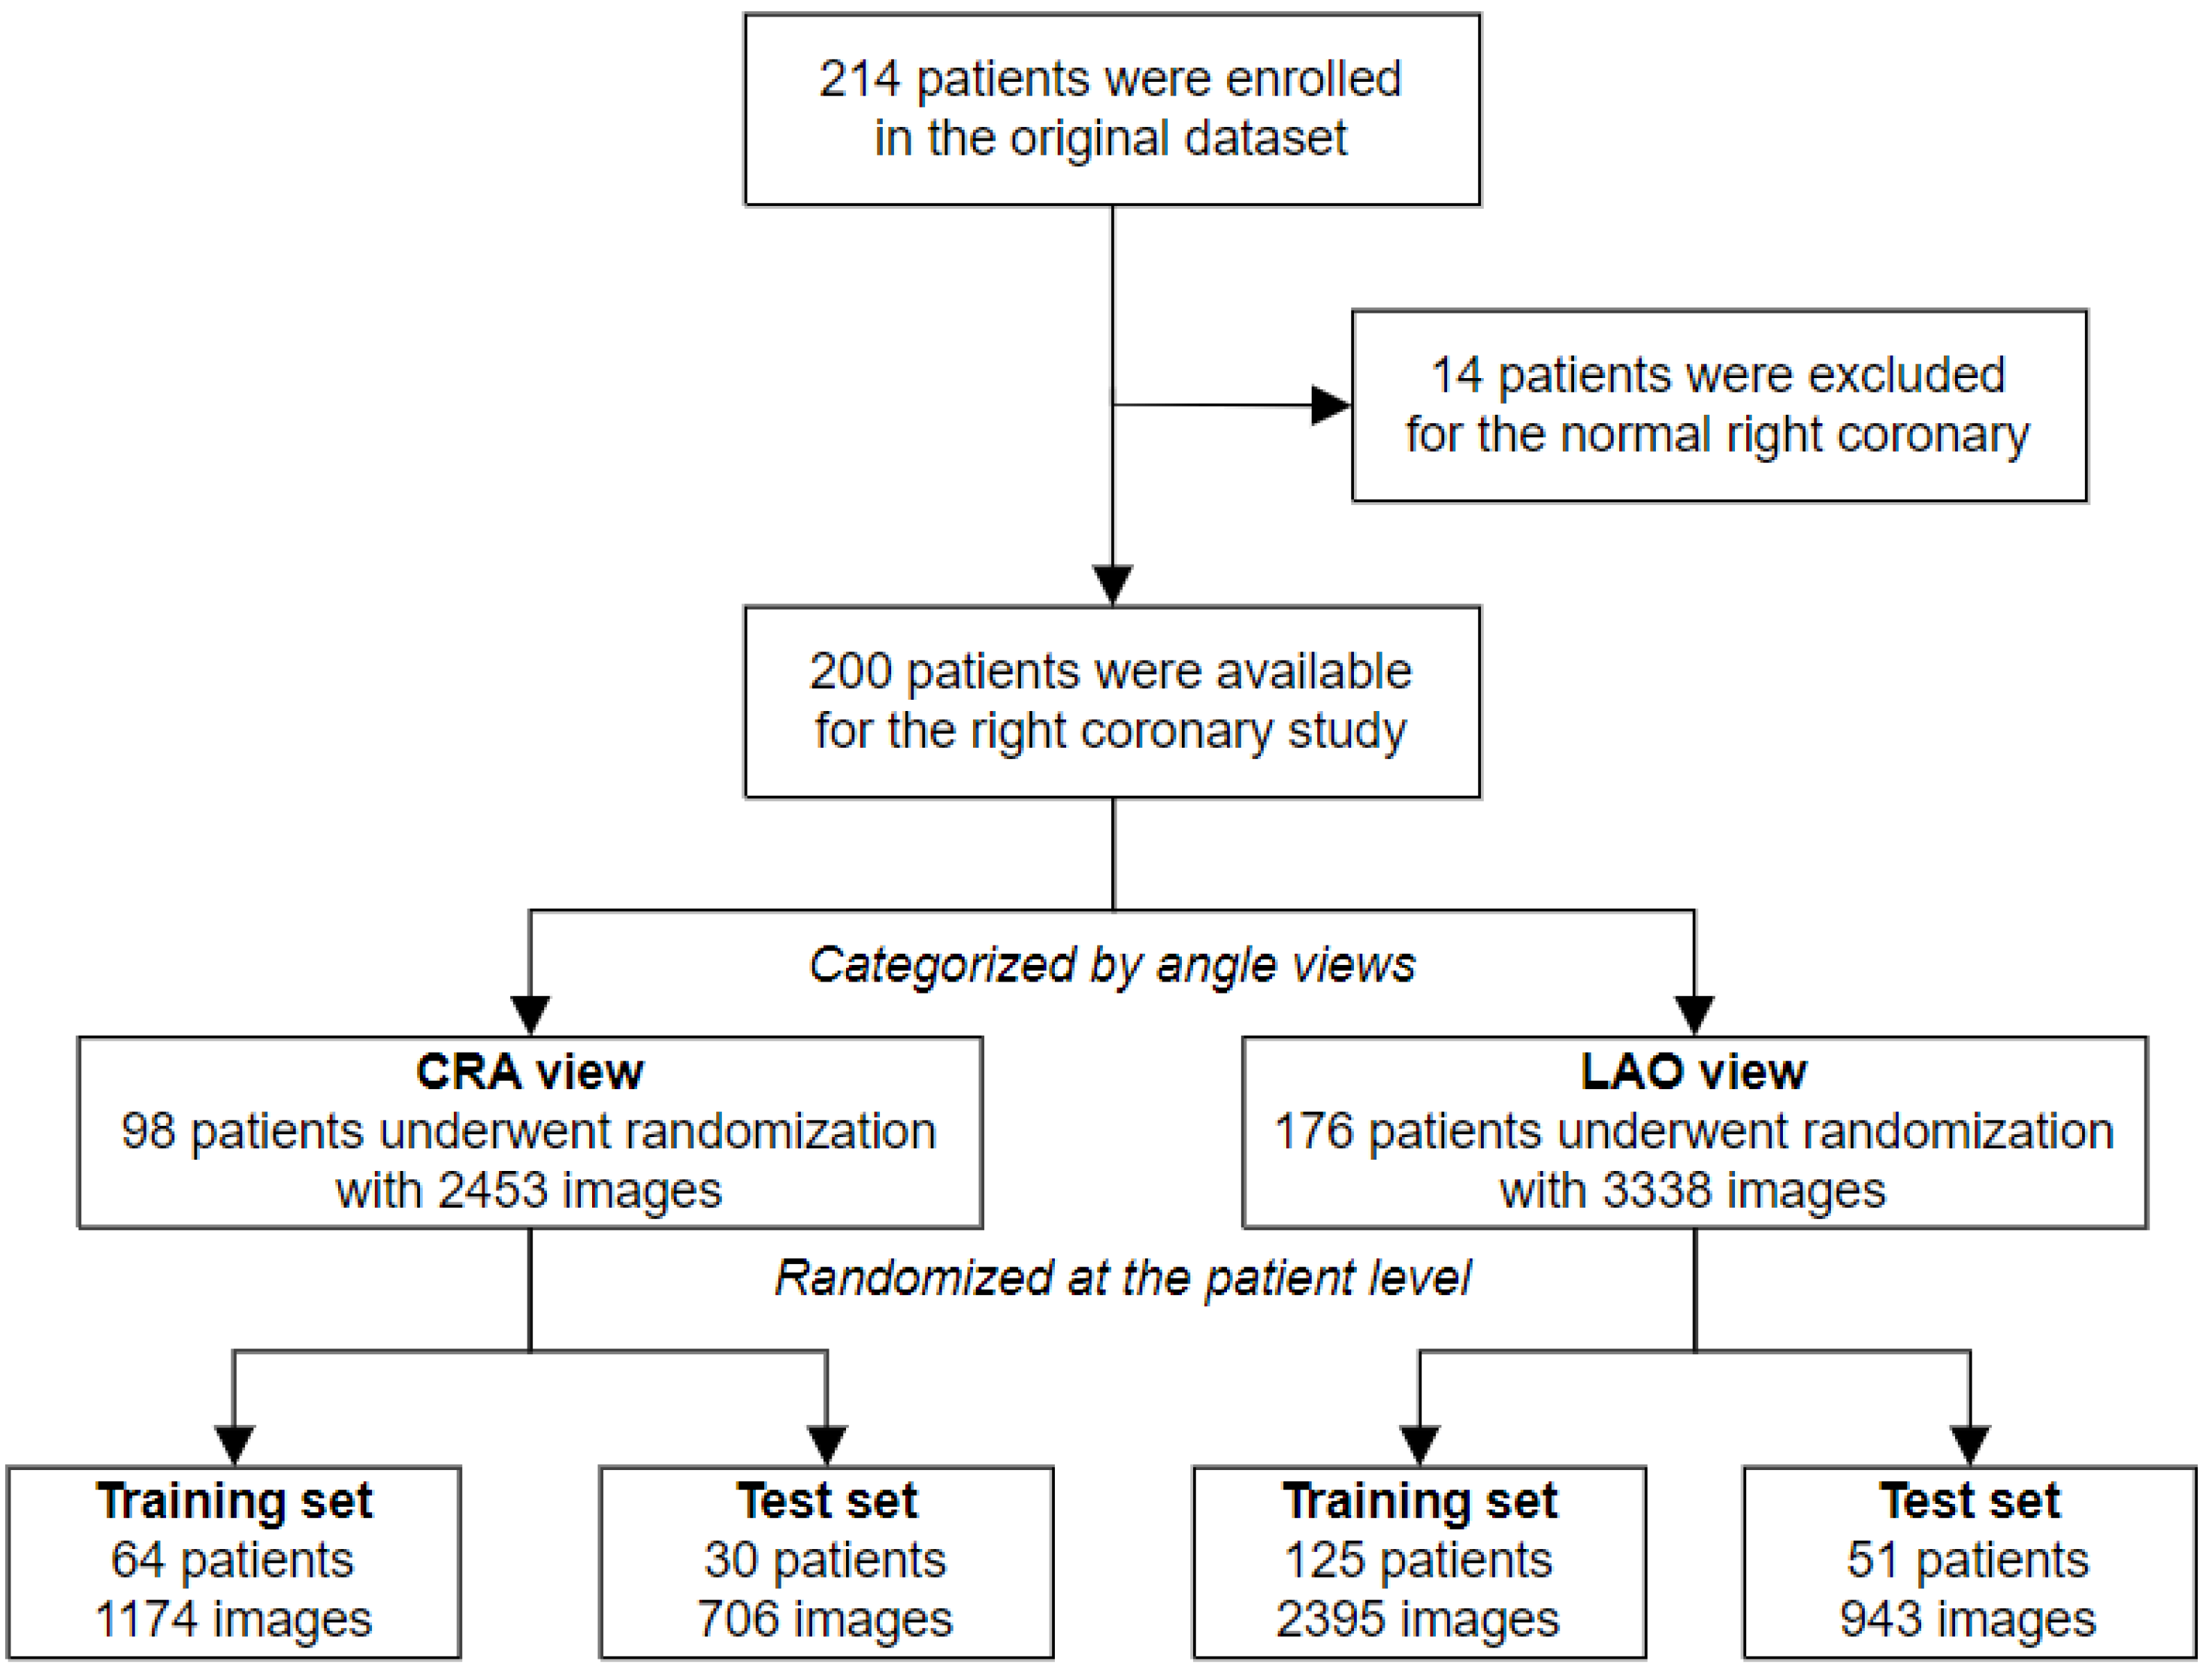
2.1. Dataset Characteristics

Two hundred and fourteen patients who were potential candidates for CAB surgery were enrolled from a single cardiac center (Fuwai Hospital, Beijing, China). This study was reviewed and approved by the ethics committee of Fuwai Hospital. There were some exclusion criteria when collecting data: (1) Combined with other cardiovascular diseases except atrial septal defect, ventricular septal defect, patent ductus arteriosus, and valvular heart disease; (2) combined with other diseases requiring surgical treatment; (3) emergency coronary artery bypass grafting or clinically unstable coronary artery disease (e.g., myocardial infarction within 30 days, preoperative implantation of the aorta counterpulsation, the need for continuous pumping of nitrates, etc.); (4) preoperative critical condition; (5) history of cardiovascular pulmonary resuscitation (CPR). The dataset was built by patients’ angiographies, which were saved as Digital Imaging and Communications in Medicine (DICOM) files and contained several angle views for left and right coronaries. Finally, images of the right coronary were analyzed in this study. Two major angle views were analyzed separately: The LAO (left anterior oblique) view is approximately 45° in the left anterior oblique view, which can display the proximal segment and middle segment well, and the CRA (cranial) view is approximately 20° in the cranial view, which can display the distal segment and posterior descending branch well. Fourteen patients had normal imaging findings with no lesion in the right coronary. Ninety-eight patients had lesions in the CRA view, and 176 patients had lesions in the LAO view. The final dataset had 2453 images in the CRA view and 3338 images in the LAO view. They were randomly divided into training sets and validation sets at the patient level by a ratio of 7:3. The enrollment profile is shown in Figure 1.
Four types of lesions (Figure 2) were analyzed in this study: (1) Local stenosis (LS): A local stenosis defined as any stenosis under 20 mm in length; (2) diffuse stenosis (DS): A diffuse stenosis defined as any stenosis over 20 mm in length, which was also named long lesion [23,24]; (3) bifurcation stenosis (BS): A bifurcation stenosis defined as any stenosis adjacent to, and/or involving, the origin of a significant side branch [25]; (4) chronic total occlusion (CTO): A chronic total occlusion defined as 100% occlusion of a coronary artery for a duration of greater than or equal to 3 months based on angiographic evidence. The details of image distribution are shown in Table 2.

2.2. Reference Standard and Annotation Procedures

We treated manual annotations by cardiologists and radiologists as the reference standard to evaluate the diagnostic performance of the model. Firstly, a researcher converted the DICOM files into JPG image files. Then, the images of the right coronary were selected from these files and handed over to two well-trained cardiologists or radiologists with over 10 years of experience in CAG to choose ideal frames and label the lesions. The lesions were classified into four types: LS, DS, BS, and CTO. In cases of conflicting annotations, the cardiologist and the radiologist collaborated and reached a consensus to determine the final type.

2.3. Experimental Environment and Methodology

Our experiments were conducted on a graphics workstation with Intel(R) Xeon Gold 6132 [email protected] GHz 2.59 GHz, and NVIDIA TITAN RTX 24 G. Python 3.8 and PyTorch 1.13 were chosen as the DL framework. Figure 3 shows the flowchart of the DL procedure. DICOM Files were first exported into serial images. Ideal frames were chosen by our researcher and datasets were subsequently established. The manual annotation procedure was performed in the ways mentioned above, and the labeled images were sent to the network for training and testing. It outputs three vectors containing the predicted box class, confidence, and coordinate location in CAG images. Coronary lesions were directly detected, eliminating the requirement for time-consuming processes like segmentation and blood vessel extraction in previous studies. The types of coronary lesions were simplified to four with discriminative characteristics. To the best of our knowledge, the proposed method is the first to employ the single-stage YOLOv5 model with the region-free method to directly detect coronary lesions in CAG images. Moreover, Grad-CAM was incorporated to visualize the distinguishing area of specific lesion types for network interpretation.
We performed experiments both at the image level and the patient level. Because of the tiny changes in images in the same angle view of one single patient, it might be treated as one lesion for those found in the same position in the serial images. We defined that the prediction was correct at the patient level if one correct prediction of the lesion was found in one of the images in the serial.

2.4. Architecture of Models

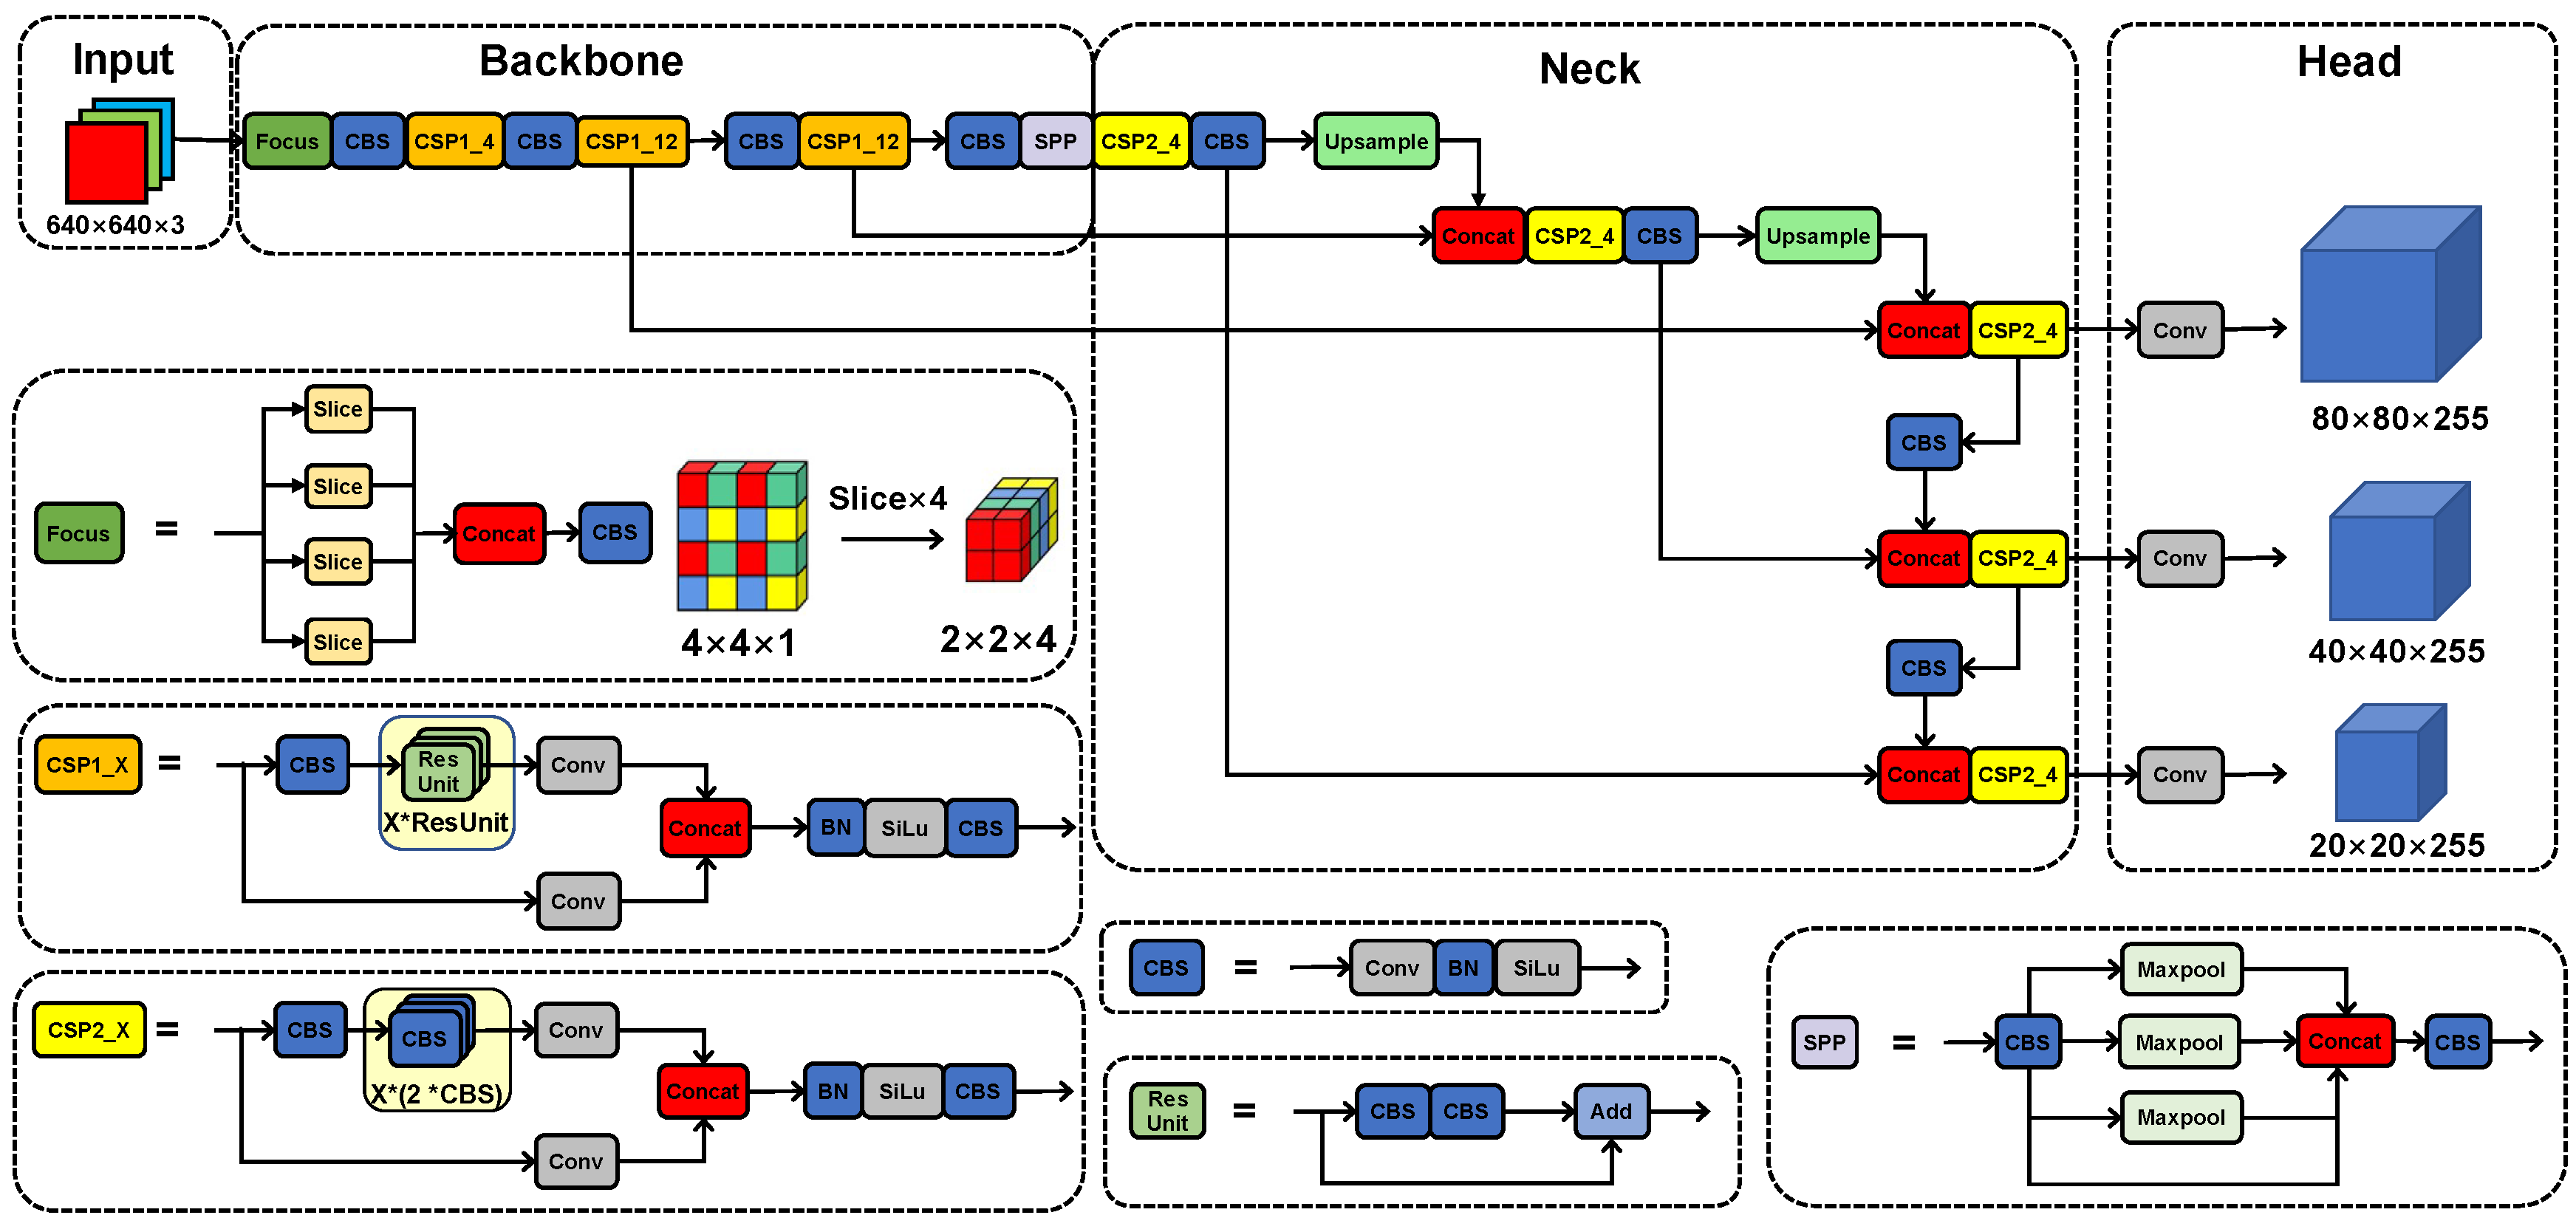
2.4.1. The YOLOv5x Model

Figure 4 shows the structure of the YOLOv5x [26]. The input was uniform-size CAG image data, which were sent to the one-stage segmentation-free CNN. The network automatically learned the most class-related discriminant region highlighted to detect lesions directly, skipping the time-consuming classification and location in two steps. Finally, the network directly returned the size, position, and category of the target lesion, achieving end-to-end predictions.
The YOLOv5x consisted of a backbone feature extraction network, a neck network, and a head target prediction network. The Mosaic data enhancement method was used to augment the data, which makes the network more robust. The backbone network was mainly composed of a focus structure, a cross-stage-partial (CSP) module, and a spatial pyramid pooling (SPP) module. The focus structure sliced the input CAG images and stitched the sliced result, which reduces the loss of lesion information and effectively improves the quality of feature extraction of contrast maps. Two CSP structures were employed to speed up the inference, decrease computation, and improve lesion detection. The feature pyramid network (FPN) [27] and path aggregation network (PAN) [28] were used in the neck to realize multi-scale lesion feature fusion. Three branches of target detection heads were used in the procedure, which could detect lesions on small, medium, and large targets, respectively. The dense anchor frame could significantly increase the network’s ability to identify targets, which is obvious for small target detection. The network directly outputs results with predictions of lesion types and confidence to realize the automatic integrated prediction of the lesion type and position.
In this study, the batch size was 16 for the training set and 32 for the test set. A total of 100 epochs of training were conducted. LambdaLR was used as the learning rate updating strategy, and the stochastic gradient descent (SGD) optimizer and an initial learning rate of 10−4 were used. Box loss, obj (object) loss, and cls (class) loss were used:
L o s s = C I o U L o s s + i = 0 S × S j = 0 B I i j o b j C i log C i + 1 C i log 1 C i i = 0 S × S j = 0 B I i j n o o b j C i log C i + 1 C i log 1 C i + i = 0 S × S j = 0 B I i j o b j c c l a s s e s p i c log p i c + 1 p i c log 1 p i c
where S represents the size of the final layer of feature maps and B is the number of detection boxes. I i j o b j stands for items in the grid i , j and I i j n o o b j for objects not present in the grid i , j .
YOLOv5 used CIoUloss [29] as the loss function of bounding box coordinate regression, which addresses the issue of slow convergence speed and imprecision regression in IoU and GIoU [30]. Additionally, while conducting non-maximum suppression, weighted non-maximum suppression (NMS) was employed, which effectively detects some overlapping vessels in coronary angiography images without consuming more processing resources.

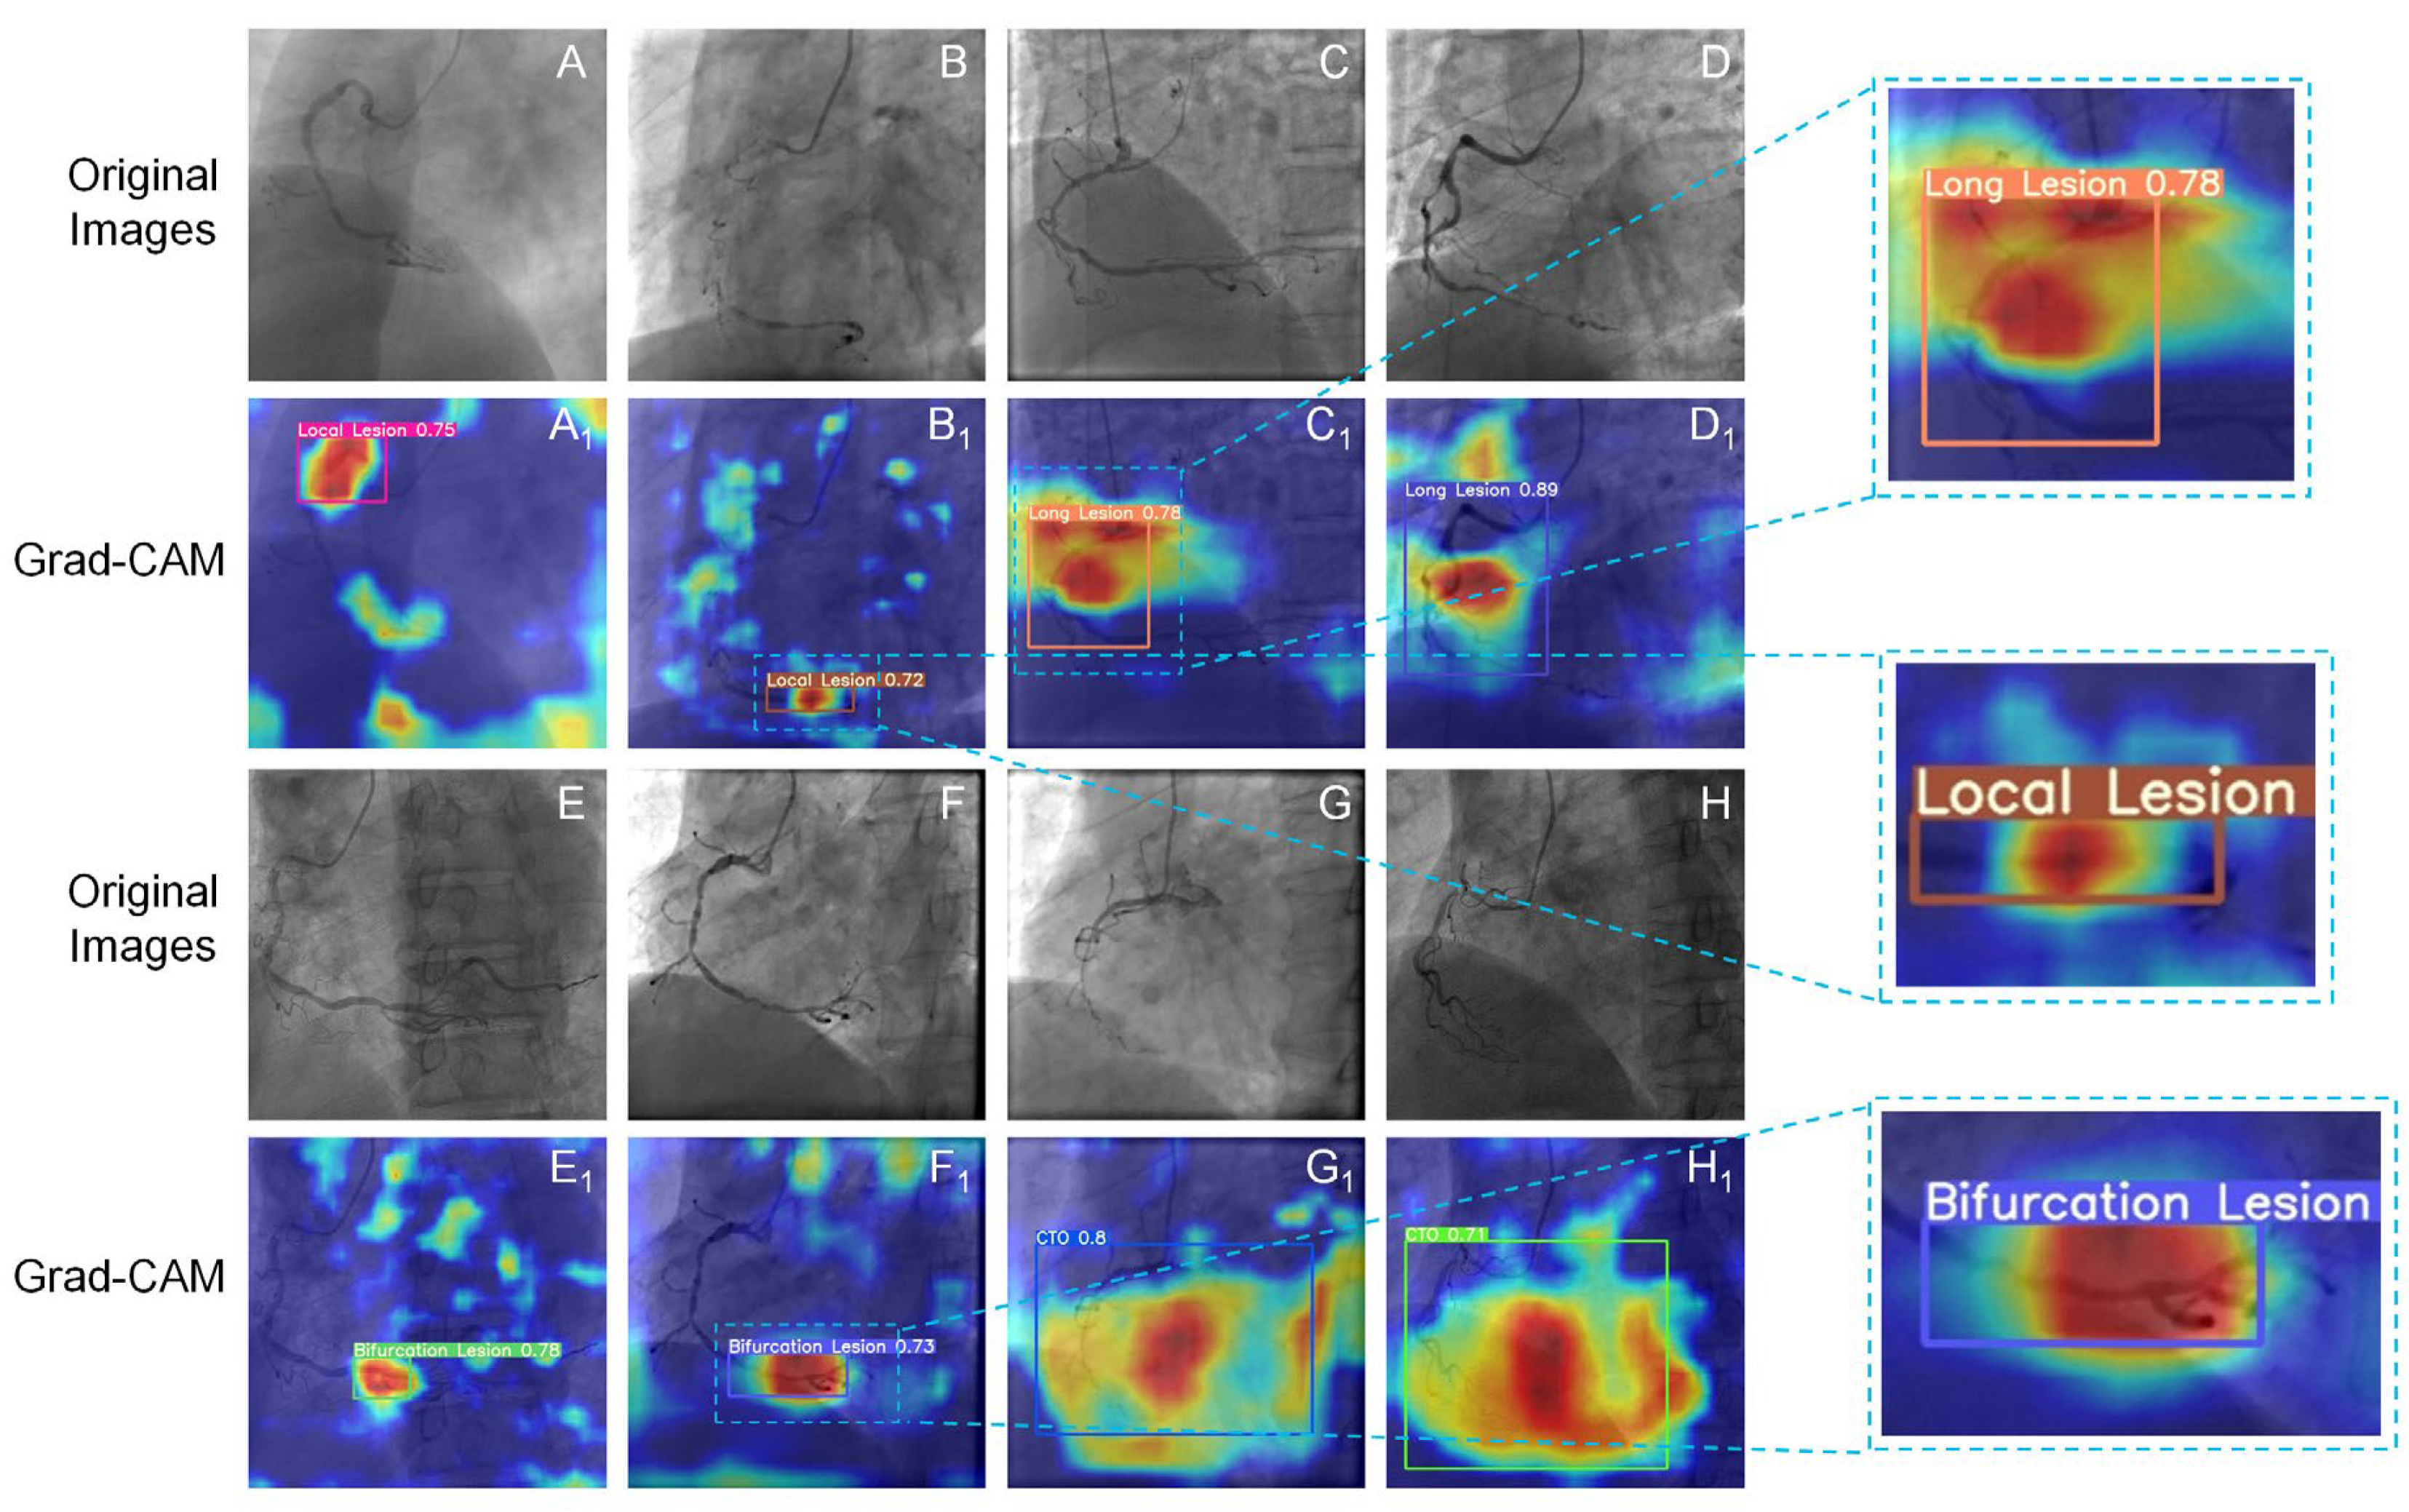
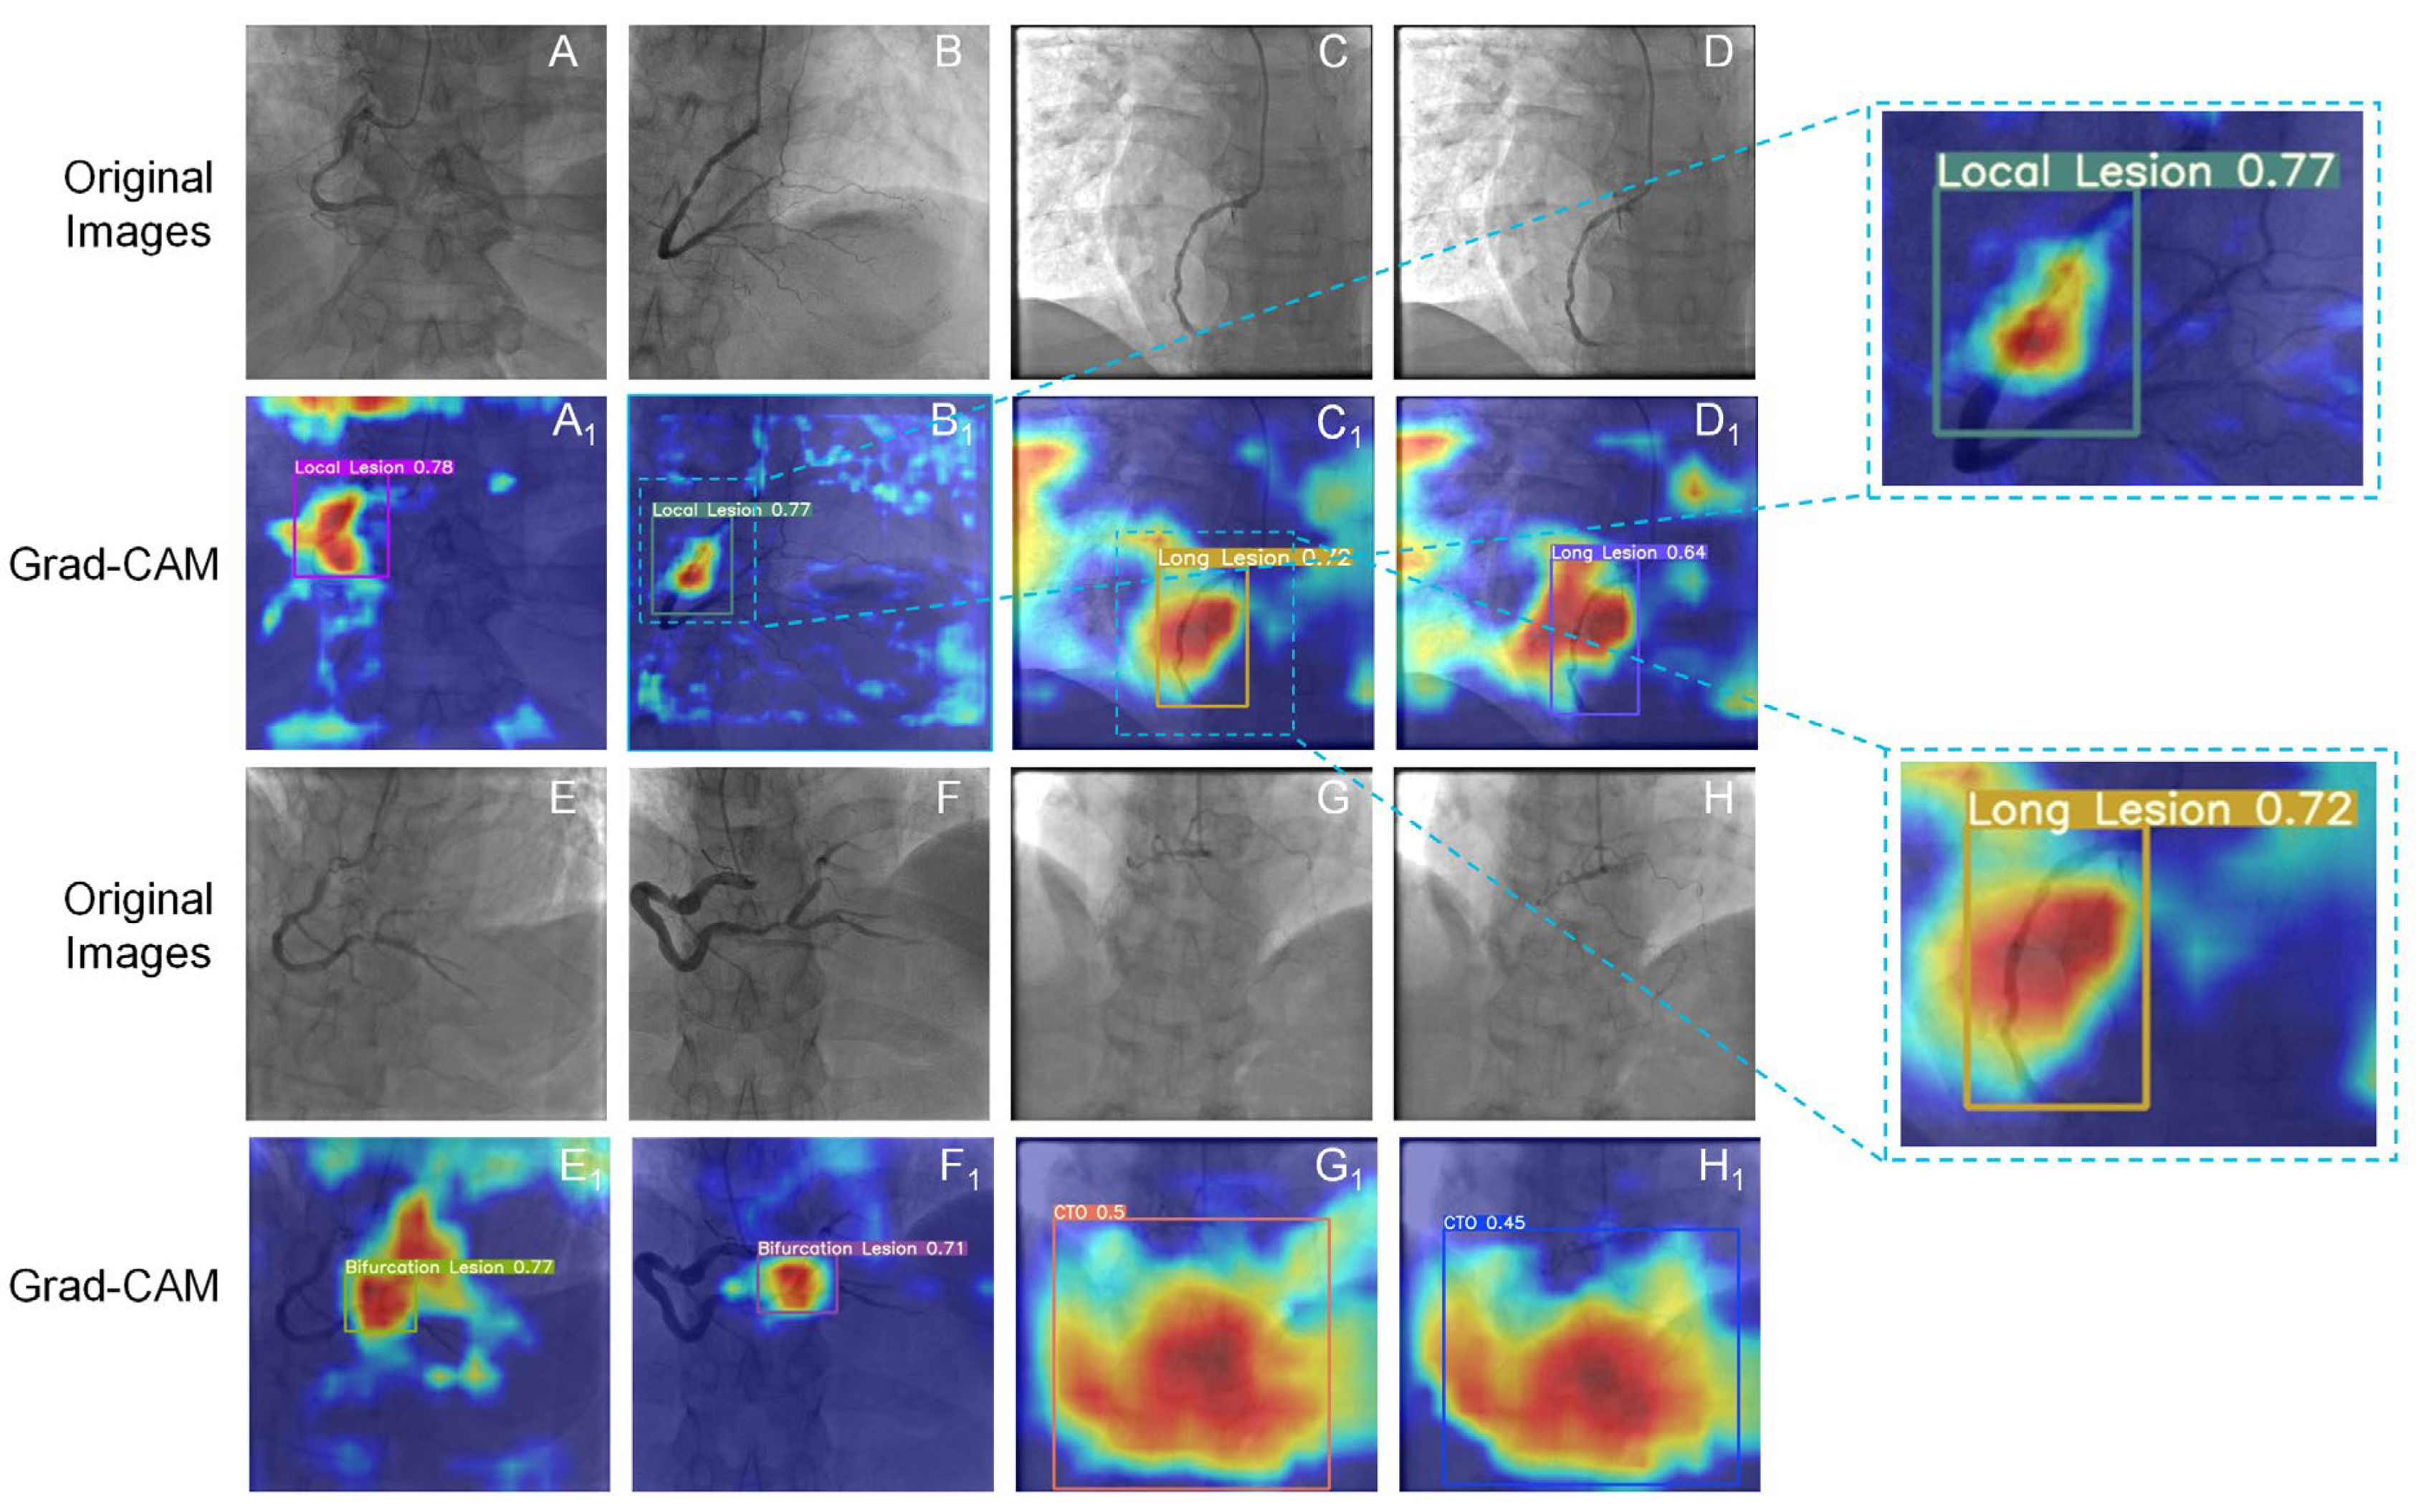
2.4.2. The Grad-CAM Technique

We used the Grad-CAM [31] for visual explanations after lesion detection to identify the discriminative regions in each trained model that have varied contribution weights for its classification decision. Grad-CAM can be considered mathematically as a modification of CAM and can be utilized to extend to any CNN-based network.
To understand the significance of each neuron to a specific lesion category c (e.g., the local stenosis), Grad-CAM used the gradient information flowing into the ultimate convolutional layer of the CNN. The neuron importance weights α k c were obtained by an averaged pooling of gradients via backpropagation from category c:
α k c = 1 Z i j y c A i j k
where Z is a normalization operation. The output of Grad-CAM is generated when all feature maps of the same size are weighted and added in accordance with their respective weights. Then, a rectified linear unit (ReLU) was applied to the linear combination to reject feature maps with negative activation values ( A k ):
L G r a d C A M c = R e L U k α k c · A k

2.5. Performance Evaluation

The detection performance was evaluated by the confusion matrix, precision-recall (P-R) curve, precision, recall, F1 score, and mean average precision (mAP) at the image level and the precision, recall, F1 score, and mFP at the patient level. They were defined as
P r e c i s i o n = T P T P + F P
R e c a l l = T P T P + F N
F 1   s c o r e = 2 × P r e c i s i o n × R e c a l l P r e c i s i o n + R e c a l l
I o U = A B A B
m F P = F P n
where A is the predicted label from YOLOv5x and B is the reference label. A true positive (TP) represents the correct classification of lesions with the intersection over union (IoU) ≥ threshold. A false positive (FP) represents the incorrect classification of lesions OR with the intersection over union (IoU) < threshold. The mean false positive (mFP) represents the mean number of FPs for each patient. A false negative (FN) is an undetected reference label. We also employed [email protected] (IoU = 0.1) and [email protected] (IoU = 0.5) in the study.

2.6. Statistics

Descriptive factors were summarized as the mean and standard deviation. Pearson’s Chi-square tests and Student’s t-tests were conducted for categorical and continuous factors, respectively. A two-sided p-value < 0.05 was considered statistically significant. Statistical Product Service Solutions (SPSS) 25.0 was used for statistical analysis.

3. Results

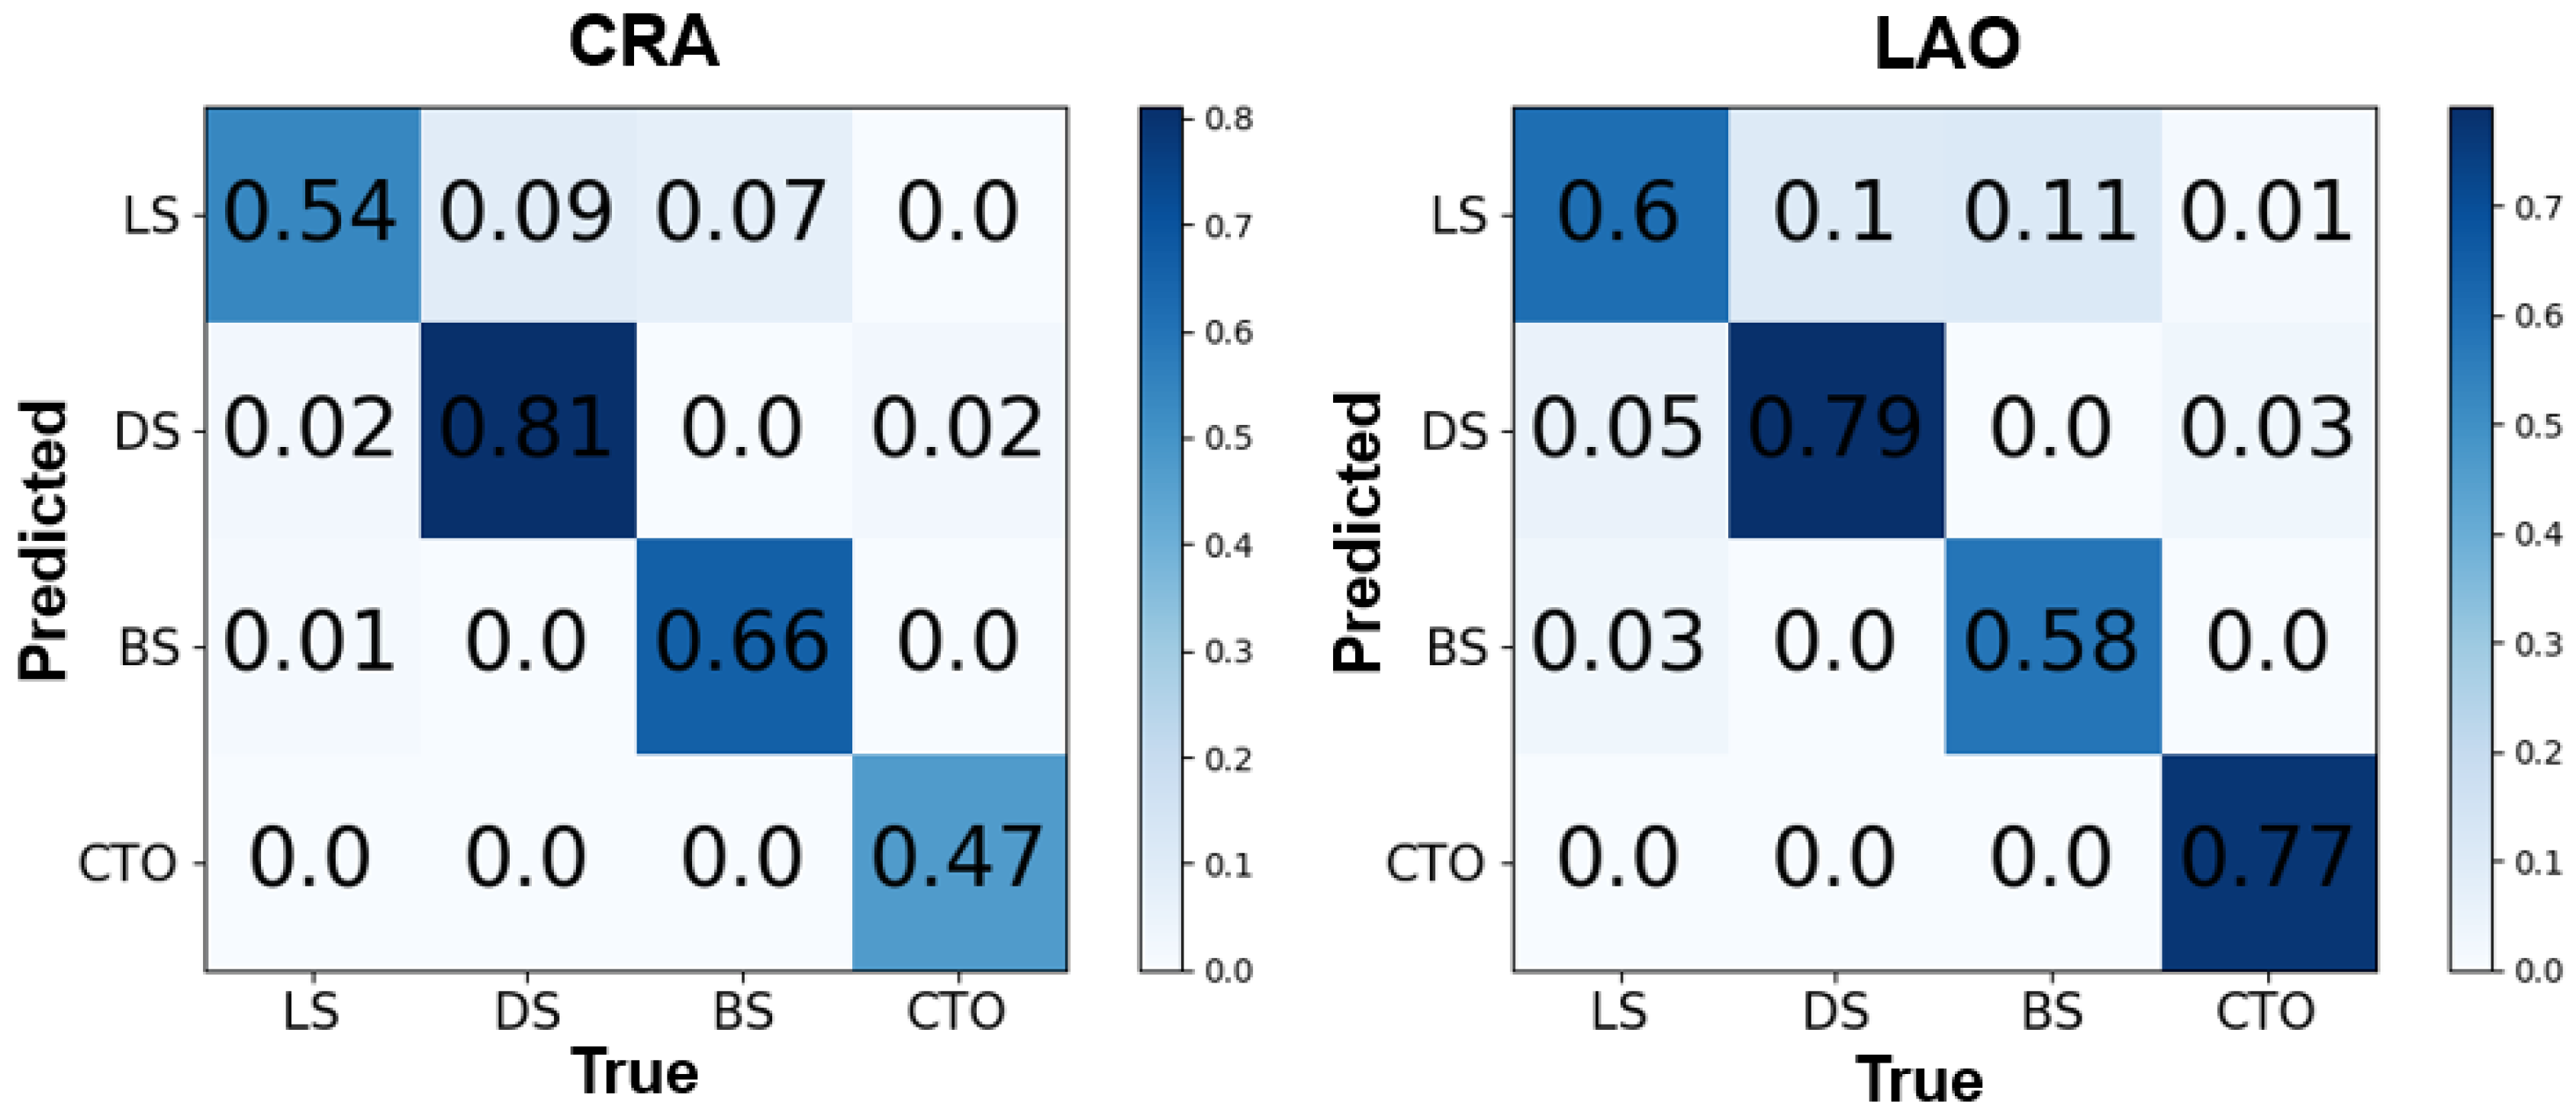
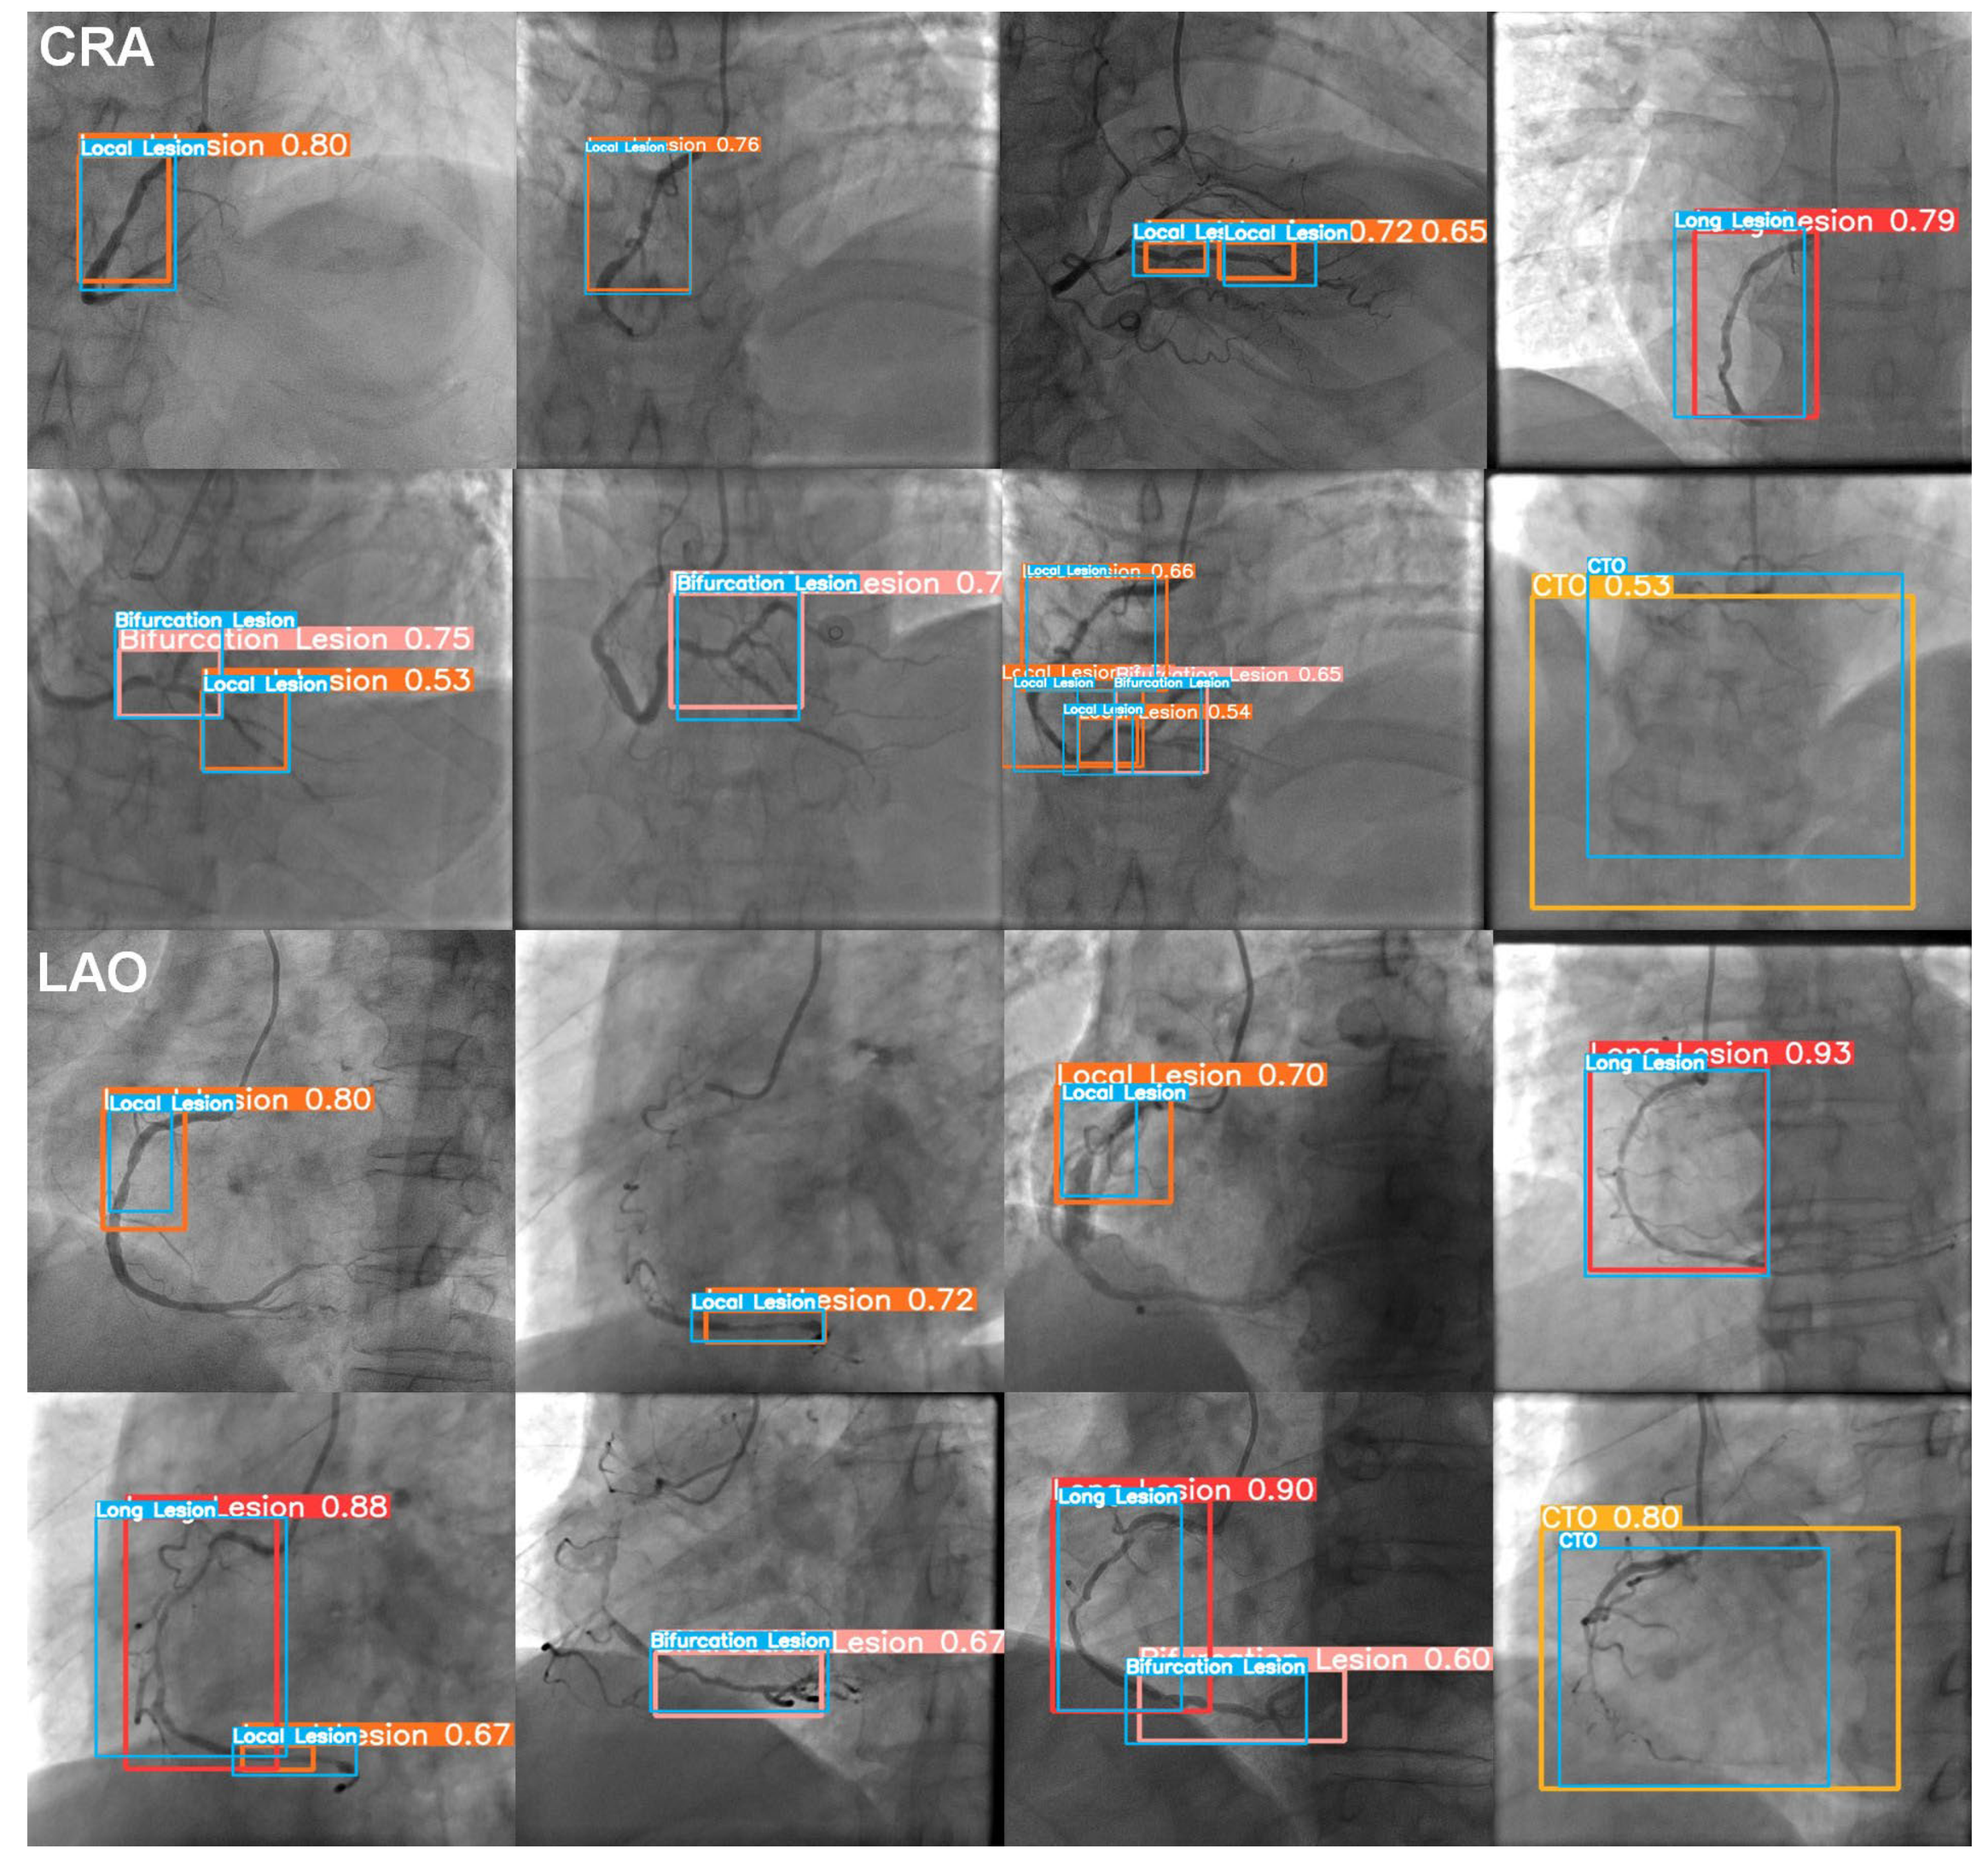
3.1. The Image Level

Details of the results are presented in Table 3. In the general statistics, the precision, recall, [email protected], and [email protected] predicted by the model were 0.64, 0.68, 0.66, and 0.49 in the CRA view, respectively. Meanwhile, the precision, recall, [email protected], and [email protected] predicted by the model were 0.68, 0.73, 0.70, and 0.56 in general in the LAO view, respectively. The results of CTO showed the best performance with F1 scores of 0.65 and 0.86 in the four types of lesions in both angle views, compared to the results of LS of 0.67 and 0.50 for the opposite.
The confusion matrices for YOLOv5x (Predicted) and manual annotations (True) of four types of lesions are shown in Figure 5 (IoU = 0.1). All the detected regions were taken into account when calculating the confusion matrix’s values, similar to other studies on YOLO [32,33,34]. Two angle views of the right coronary showed the same performance. In the CRA view, the probability of correct localization and classification for DS was 0.81, which was the best, and 0.54, 0.66, and 0.47 for LS, BS, and CTO, respectively. However, it was noted that 51% of the real CTO was predicted as background, while the background was also treated as LS, which represented 66% of the predicted LS. In the LAO view, the probability of correctly locating and classifying DS was 0.79, which was also the best, followed by 0.60, 0.58, and 0.77 for LS, BS, and CTO, respectively. However, like the performance in the CRA view, it could be found that 51% of the background was treated as LS in the LAO results.
The P-R curves of the two angle views shown in Figure 6 were performed for the situation of IoU = 0.1. The area under the curve (AUC) in general was 0.663 ([email protected]) in the CRA view and 0.704 ([email protected]) in the LAO view. It could be found in Figure 6 that in the LAO view, the result of CTO had an excellent performance, compared to the result of LS on the opposite. Meanwhile, in the CRA view, four types of lesions had the same performance.
Figure 7 shows the effect of YOLOv5x-detected lesions in CRA and LAO views. From the test results, it could be found that the model’s detection was close to the manual annotations of physicians. With the value of confidence displayed in the following, the model showed good consistency with the reference standard.

3.2. The Patient Level

At the patient level, the model yielded the results of the precision, recall, and F1 score as 0.52, 0.91, and 0.65 in the CRA view and 0.50, 0.94, and 0.64 in the LAO view, respectively. The results of CTO showed the best performance with an F1 score of 0.77 and 0.88 in four types of lesions in both angle views, compared to the results of 0.54 for BS and 0.44 for LS on the opposite. We also calculated the mFP in two angle views. The performance of LS made the most mistakes across the four types of lesions. The model performed the best in the CTO with 0.07 and 0.10 of mFP in both views. Moreover, the mFP was 2.47 in the CRA view and 1.86 in the LAO view. Table 4 shows the details of the results (IoU = 0.1).
The Grad-CAM technique always provided valuable information on the model learning procedure. We generated the heat map of Grad-CAM to consequently testify the regions of interest for YOLOv5x in both angle views. As shown in Figure 8 and Figure 9, the activated regions (the highlighted area) corresponded to the regions that the model labeled. The model was confirmed to have a robust performance even with mild lesions. It was found that the model could learn the characteristics of lesions well and locate and classify the lesions precisely.

4. Discussion

This study used a single-stage model via the region-free method for the first time to detect coronary lesions directly in CAG images. We also classified common vascular abnormalities into four types: LS, DS, BS, and CTO. Our results showed that direct detection models like YOLOv5x can effectively identify vessel lesions. Meanwhile, because of the segmentation-free feature, YOLOv5x offered a more concise processing procedure, and hence it could maintain a good balance between model performance and detection efficiency in general.
In previous studies, the YOLO series of models have mostly been applied in tumor detection and retinal fundus disease evaluation. However, the fundus vessel lesion evaluation shows similarity compared to the coronary stenoses during the DL processing procedure [35,36,37]. Santos et al. [36] also used YOLOv5 as the detection model. In their public datasets of diabetic retinopathy images, YOLOv5 generated [email protected] of 0.154 and an F1 score of 0.252. In our study, the detection of lesions achieved a precision of 0.675, a recall rate of 0.734, an [email protected] of 0.558, and an F1 score of 0.703 in the LAO view at the image level. Meanwhile, at the patient level, the detection of lesions reached a precision of 0.792, a recall rate of 100%, an F1 score of 0.884, and a maximum mFP of 0.466.
Generally, it can be found that the YOLO series of models demonstrates promising performance in the automatic detection of coronary artery lesions. The high precision and recall rates at both the image and patient levels indicate the model’s reliability in identifying vascular abnormalities in CAG images. The impressive F1 scores further validate the model’s ability to balance precision and recall effectively. The low mFP also suggests that the model minimizes false-positive detections, which is crucial for accurate diagnosis and reducing unnecessary interventions. Overall, these findings highlight the potential of using YOLO-based direct detection models for the efficient and reliable detection of coronary artery abnormalities in medical imaging applications.
In the subgroup analysis of the four lesions, the CTO group and the DS group showed good results. They achieved a precision of 0.927, a recall rate of 0.796, [email protected] of 0.870, and an F1 score of 0.857 for the CTO group in the LAO view at the image level and a precision of 0.648, a recall rate of 0.868, [email protected] of 0.773, and an F1 score of 0.742 for the DS group. Du et al. [16] tested the performances of four models (CALD-Net, ZF-Net+Faster R-CNN, VGG+Faster R-CNN, and ResNet50+Faster R-CNN), finding recall rates of 0.88, 0.41, 0.50, and 0.62. Pang et al. [22] tested the performances of five models (Faster R-CNN, Guided Anchoring, Libra R-CNN, Cascade R-CNN, and Stenosis-DetNet), finding F1 scores of 0.80, 0.79, 0.81, 0.78, and 0.88. Even in the analysis with a large dataset comprising 20,612 CAG images of 10,073 patients, it had a precision of 0.769 for the stenosis and 0.757 for the CTO lesion [21]. Our study showed that the direct detection of lesions like CTO and diffuse stenoses had the same performance compared to these studies. Consequently, it might be concluded that single-stage detection models like YOLOv5 could generate a stable result, which is similar to, or even better than, detection models combining segmentation in suitable situations.
However, in our study, the performance in the LS group showed an unsatisfactory result. In the LAO view of the image level, the LS group had a precision of 0.426, a recall rate of 0.617, a [email protected] of 0.479, and an F1 score of 0.504. At the patient level, the LS group also had the highest mFP compared to other groups with results of 1.467 in the CRA view and 1.118 in the LAO view, which meant more than one false labeling of LS for each patient. Correspondingly, the mFP in the CTO group was just 0.067 in the CRA view and 0.098 in the LAO view. Moon et al. [13] used the internal dataset and external dataset in their study. They showed a similar performance, with a mean accuracy of diffuse lesions better than focal lesions in each dataset. These results might be related to factors such as low-range stenosis, which is inconspicuous, susceptibility to background noises, and small lesion characteristics resulting in confusion with the visual features of normal arteries. Therefore, it is necessary to perform segmentation before the detection of local stenoses in the DL procedure.
Grad-CAM demonstrated the network-learned lesion characteristics, located the identification details of lesions, and visualized the distinguishing area of specific lesion types in the image based on DL. The low-heat region and high-heat region in the heatmap are determined based on the contribution of the regions in the image to the identification of lesions, with the high-heat region playing a decisive part in the network’s inferential decision-making. The network has successfully learned the characteristics of the lesion, allowing the lesion area to receive adequate attention in Grad-CAM, as indicated by the position of the intact area with high heat (darker part) and the detection box being consistent. Figure 8B1 and Figure 9B1 show that the model effectively learned the tiny characteristics of local stenoses and classified them correctly. Moreover, high-heat areas were only visible in the stenosis area but not in normal blood vessels. As can be observed in the wide array of high-heat areas in Figure 8G1,H1 and Figure 9G1,H1, CTO exhibited a greater range of characteristics than local stenosis, which was also identified by the model. However, Grad-CAM struggles to show only the complicated regions that require attention. Some noise might be produced, which manifests as comparatively low-heat areas like the edge regions in C1 of Figure 8.
This study has several limitations. (1) We only performed the DL analysis in the right coronary. Lesions in the right coronary are always simpler than in the left. The YOLO series of models might face much bigger challenges, and their robustness should be tested in more complex circumstances. (2) The CAG images of candidate patients were collected in primary hospitals in our country, which might make it difficult to control the quality of angiography. It could be an important confounding factor that would impact the final performance of network models. (3) Our dataset should be enriched in future studies. The YOLOv5 model performed better for the local stenosis in the CRA view than for the CRA view, accompanied by a dataset of 1055 lesions compared to 433 lesions. It could be supposed that the performance of YOLOv5 could be better in a huge dataset of CAG images.

5. Conclusions

Our study used the one-stage strategy to detect coronary lesions in a segmentation-free manner and demonstrated that the YOLOv5 model could be feasible in CAG analysis using the DL method, with good robustness. We also found in the subgroup study that lesions of CTO and DS were most suitable for direct detection without segmentation, which could shorten processing time and improve working efficiency.

Author Contributions

Conceptualization: J.L. and S.W.; methodology: H.W., J.Z., Y.Z. and Z.Z.; software: H.W. and J.Z.; validation: Y.Z. and Z.Z.; formal analysis: H.W. and J.Z.; investigation: J.Z., Z.S. and L.C.; resources: L.X., M.S. and Q.Y.; data curation: J.Z., L.X., M.S. and Q.Y.; writing—original draft preparation: H.W., J.Z., J.L. and Y.Z.; writing—review and editing: W.W., Z.Z. and S.W.; project administration: J.L., W.W., Z.Z. and S.W.; funding acquisition, W.W. All authors have read and agreed to the published version of the manuscript.

Funding

This research was funded by the R&D Program of the Beijing Municipal Education Commission (No. KM202310025019).

Institutional Review Board Statement

The study was conducted according to the guidelines of the Declaration of Helsinki and approved by the Ethics Committee of Fuwai Hospital, Beijing, China (protocol code: 2021-1546; date of approval: 29 August 2022).

Informed Consent Statement

Patient consent was waived for this retrospective study.

Data Availability Statement

The raw data supporting the conclusions of this article may be provided upon reasonable requests for scientific research purposes.

Acknowledgments

The authors would like to thank the anonymous reviewers for their valuable comments and suggestions.

Conflicts of Interest

Z.Y. is an employee of Shanghai United Imaging Intelligence Co., Ltd. The authors declare no conflict of interest. The funders had no role in the design of the study; in the collection, analyses, or interpretation of data; in the writing of the manuscript, or in the decision to publish the results.

Abbreviations

The following abbreviations are used in the manuscript:
AIArtificial Intelligence
BSBifurcation Stenosis
CABCoronary Artery Bypass
CADCoronary Artery Disease
CAGCoronary AngioGraphy
CNNConvolutional Neural Network
CPRCardiovascular Pulmonary Resuscitation
CRACRAnial
CTOChronic Total Occlusion
DICOMDigital Imaging and COmmunications in Medicine
DLDeep Learning
DSDiffuse Stenosis
FNFalse Negative
FPFalse Positive
Grad-CAMGradient-weighted Class Activation Mapping
IoUIntersection over Union
LAOLeft Anterior Oblique
LSLocal Stenosis
mAPmean Average Precision
mFPmean False Positive
PCIPercutaneous Coronary Intervention
PRPrecision-Recall
TNTrue Negative
TPTrue Positive

References

  1. The Top 10 Causes of Death. 2020. Available online: https://www.who.int/news-room/fact-sheets/detail/the-top-10-causes-of-death (accessed on 9 December 2020).
  2. Collet, J.-P.; Thiele, H.; Barbato, E.; Barthélémy, O.; Bauersachs, J.; Bhatt, D.L.; Dendale, P.; Dorobantu, M.; Edvardsen, T.; Folliguet, T.; et al. 2020 ESC Guidelines for the management of acute coronary syndromes in patients presenting without persistent ST-segment elevation. Eur. Heart J. 2021, 42, 1289–1367. [Google Scholar] [PubMed]
  3. Lawton, J.S.; Tamis-Holland, J.E.; Bangalore, S.; Bates, E.R.; Beckie, T.M.; Bischoff, J.M.; Bittl, J.A.; Cohen, M.G.; DiMaio, J.M.; Don, C.W.; et al. 2021 ACC/AHA/SCAI Guideline for Coronary Artery Revascularization: A Report of the American College of Cardiology/American Heart Association Joint Committee on Clinical Practice Guidelines. Circulation 2022, 145, e18–e114. [Google Scholar] [PubMed]
  4. Knuuti, J.; Wijns, W.; Saraste, A.; Capodanno, D.; Barbato, E.; Funck-Brentano, C.; Prescott, E.; Storey, R.F.; Deaton, C.; Cuisset, T.; et al. 2019 ESC Guidelines for the diagnosis and management of chronic coronary syndromes. Eur. Heart J. 2020, 41, 407–477. [Google Scholar] [PubMed]
  5. Zhang, D.; Liu, X.; Xia, J.; Gao, Z.; Zhang, H.; de Albuquerque, V.H.C. A Physics-guided Deep Learning Approach for Functional Assessment of Cardiovascular Disease in IoT-based Smart Health. IEEE Internet Things J. 2023, 1. [Google Scholar] [CrossRef]
  6. Menezes, M.N.; Silva, J.L.; Silva, B.; Rodrigues, T.; Guerreiro, C.; Guedes, J.P.; Santos, M.O.; Oliveira, A.L.; Pinto, F.J. Coronary X-ray angiography segmentation using Artificial Intelligence: A multicentric validation study of a deep learning model. Int. J. Cardiovasc. Imaging 2023, 39, 1385–1396. [Google Scholar] [CrossRef]
  7. Zhang, H.; Gao, Z.; Zhang, D.; Hau, W.K.; Zhang, H. Progressive Perception Learning for Main Coronary Segmentation in X-Ray Angiography. IEEE Trans. Med. Imaging 2023, 42, 864–879. [Google Scholar]
  8. Zhao, C.; Vij, A.; Malhotra, S.; Tang, J.; Tang, H.; Pienta, D.; Xu, Z.; Zhou, W. Automatic extraction and stenosis evaluation of coronary arteries in invasive coronary angiograms. Comput. Biol. Med. 2021, 136, 104667. [Google Scholar] [CrossRef]
  9. Liu, X.; Wang, X.; Chen, D.; Zhang, H. Automatic Quantitative Coronary Analysis Based on Deep Learning. Appl. Sci. 2023, 13, 2975. [Google Scholar] [CrossRef]
  10. Algarni, M.; Al-Rezqi, A.; Saeed, F.; Alsaeedi, A.; Ghabban, F. Multi-constraints based deep learning model for automated segmentation and diagnosis of coronary artery disease in X-ray angiographic images. PeerJ Comput. Sci. 2022, 8, e933. [Google Scholar] [CrossRef]
  11. Cong, C.; Kato, Y.; De Vasconcellos, H.D.; Ostovaneh, M.R.; Lima, J.A.C.; Ambale-Venkatesh, B. Deep learning-based end-to-end automated stenosis classification and localization on catheter coronary angiography. Front. Cardiovasc. Med. 2023, 10, 944135. [Google Scholar] [CrossRef]
  12. Szegedy, C.; Liu, W.; Jia, Y.; Sermanet, P.; Reed, S.; Anguelov, D.; Erhan, D.; Vanhoucke, V.; Rabinovich, A. Going deeper with convolutions. In Proceedings of the 2015 IEEE Conference on Computer Vision and Pattern Recognition (CVPR), Boston, MA, USA, 7–12 June 2015. pp. 1–9.
  13. Moon, J.H.; Lee, D.Y.; Cha, W.C.; Chung, M.J.; Lee, K.-S.; Cho, B.H.; Choi, J.H. Automatic stenosis recognition from coronary angiography using convolutional neural networks. Comput. Methods Programs Biomed. 2020, 198, 105819. [Google Scholar] [CrossRef] [PubMed]
  14. Woo, S.; Park, J.; Lee, J.-Y.; Kweom, I.S. CBAM: Convolutional block attention module. In Proceedings of the European Conference on Computer Vision (ECCV), Munich, Germany, 8–14 September 2018; Volume 11211, pp. 3–19. [Google Scholar]
  15. Ling, H.; Chen, B.; Guan, R.; Xiao, Y.; Yan, H.; Chen, Q.; Bi, L.; Chen, J.; Feng, X.; Pang, H.; et al. Deep Learning Model for Coronary Angiography. J. Cardiovasc. Transl. Res. 2023, 16, 896–904. [Google Scholar] [CrossRef] [PubMed]
  16. Du, T.; Liu, X.; Zhang, H.; Xu, B. Real-time Lesion Detection of Cardiac Coronary Artery Using Deep Neural Networks. In Proceedings of the 2018 International Conference on Network Infrastructure and Digital Content (IC-NIDC), Guiyang, China, 22–24 August 2018; pp. 150–154. [Google Scholar]
  17. Ren, S.; He, K.; Girshick, R.; Sun, J. Faster R-CNN: Towards Real-Time Object Detection with Region Proposal Networks. IEEE Trans. Pattern Anal. Mach. Intell. 2017, 39, 1137–1149. [Google Scholar] [CrossRef] [PubMed]
  18. Danilov, V.V.; Klyshnikov, K.Y.; Gerget, O.M.; Kutikhin, A.G.; Ganyukov, V.I.; Frangi, A.F.; Ovcharenko, E.A. Real-time coronary artery stenosis detection based on modern neural networks. Sci. Rep. 2021, 11, 7582. [Google Scholar] [CrossRef]
  19. Antczak, K.; Liberadzki, A. Stenosis Detection with Deep Convolutional Neural Networks. MATEC Web Conf. 2018, 210, 04001. [Google Scholar] [CrossRef]
  20. Ovalle-Magallanes, E.; Avina-Cervantes, J.G.; Cruz-Aceves, I.; Ruiz-Pinales, J. Transfer Learning for Stenosis Detection in X-ray Coronary Angiography. Mathematics 2020, 8, 1510. [Google Scholar] [CrossRef]
  21. Du, T.; Xie, L.; Zhang, H.; Liu, X.; Wang, X.; Chen, D.; Xu, Y.; Sun, Z.; Zhou, W.; Song, L.; et al. Training and validation of a deep learning architecture for the automatic analysis of coronary angiography. EuroIntervention 2021, 17, 32–40. [Google Scholar] [CrossRef]
  22. Pang, K.; Ai, D.; Fang, H.; Fan, J.; Song, H.; Yang, J. Stenosis-DetNet: Sequence consistency-based stenosis detection for X-ray coronary angiography. Comput. Med. Imaging Graph. 2021, 89, 101900. [Google Scholar] [CrossRef]
  23. Dingli, P.; Gonzalo, N.; Escaned, J. Intravascular Ultrasound-guided Management of Diffuse Stenosis. Radcl. Cardiol. 2018, 2018, 1–18. [Google Scholar]
  24. Levine, G.N.; Bates, E.R.; Blankenship, J.C.; Bailey, S.R.; Bittl, J.A.; Cercek, B.; Chambers, C.E.; Ellis, S.G.; Guyton, R.A.; Hollenberg, S.M.; et al. 2011 ACCF/AHA/SCAI Guideline for Percutaneous Coronary Intervention: A report of the American College of Cardiology Foundation/American Heart Association Task Force on Practice Guidelines and the Society for Cardiovascular Angiography and Interventions. Circulation 2011, 124, e574–e651. [Google Scholar]
  25. Louvard, Y.; Thomas, M.; Dzavik, V.; Hildick-Smith, D.; Galassi, A.R.; Pan, M.; Burzotta, F.; Zelizko, M.; Dudek, D.; Ludman, P.; et al. Classification of coronary artery bifurcation lesions and treatments: Time for a consensus! Catheter. Cardiovasc. Interv. 2007, 71, 175–183. [Google Scholar] [CrossRef] [PubMed]
  26. Ultralytics. GitHub-Ultralytics/Yolov5: YOLOv5 in PyTorch > ONNX > CoreML > TFLite. 2020. Available online: https://github.com/ultralytics/yolov5 (accessed on 26 June 2020).
  27. Lin, T.Y.; Dollár, P.; Girshick, R.; He, K.; Hariharan, B.; Belongie, S. Feature Pyramid Networks for Object Detection. arXiv 2016, arXiv:1612.03144. [Google Scholar]
  28. Liu, S.; Qi, L.; Qin, H.; Shi, J.; Jia, J. Path Aggregation Network for Instance Segmentation. In Proceedings of the 2018 IEEE/CVF Conference on Computer Vision and Pattern Recognition, Salt Lake City, UT, USA, 18–23 June 2018; pp. 8759–8768. [Google Scholar]
  29. Zheng, Z.; Wang, P.; Liu, W.; Li, J.; Ye, R.; Ren, D. Distance-IoU Loss: Faster and Better Learning for Bounding Box Regression. arXiv 2019, arXiv:1911.08287. [Google Scholar] [CrossRef]
  30. Rezatofighi, H.; Tsoi, N.; Gwak, J.; Sadeghian, A.; Reid, I.; Savarese, S. Generalized Intersection Over Union: A Metric and a Loss for Bounding Box Regression. In Proceedings of the 2019 IEEE/CVF Conference on Computer Vision and Pattern Recognition (CVPR), Long Beach, CA, USA, 15–20 June 2019; pp. 658–666. [Google Scholar]
  31. Selvaraju, R.R.; Cogswell, M.; Das, A.; Vedantam, R.; Parikh, D.; Batra, D. Grad-CAM: Visual Explanations from Deep Networks via Gradient-based Localization. arXiv 2016, arXiv:1610.02391. [Google Scholar]
  32. Dinesh, M.G.; Bacanin, N.; Askar, S.S.; Abouhawwash, M. Diagnostic ability of deep learning in detection of pancreatic tumour. Sci. Rep. 2023, 13, 9725. [Google Scholar] [CrossRef]
  33. Zahrawi, M.; Shaalan, K. Improving video surveillance systems in banks using deep learning techniques. Sci. Rep. 2023, 13, 7911. [Google Scholar] [CrossRef]
  34. Chiriboga, M.; Green, C.M.; Hastman, D.A.; Mathur, D.; Wei, Q.; Díaz, S.A.; Medintz, I.L.; Veneziano, R. Rapid DNA origami nanostructure detection and classification using the YOLOv5 deep convolutional neural network. Sci. Rep. 2022, 12, 3871. [Google Scholar] [CrossRef]
  35. Alyoubi, W.L.; Abulkhair, M.F.; Shalash, W.M. Diabetic Retinopathy Fundus Image Classification and Lesions Localization System Using Deep Learning. Sensors 2021, 21, 3704. [Google Scholar] [CrossRef]
  36. Santos, C.; Aguiar, M.; Welfer, D.; Belloni, B. A New Approach for Detecting Fundus Lesions Using Image Processing and Deep Neural Network Architecture Based on YOLO Model. Sensors 2022, 22, 6441. [Google Scholar] [CrossRef]
  37. Li, T.; Bo, W.; Hu, C.; Kang, H.; Liu, H.; Wang, K.; Fu, H. Applications of deep learning in fundus images: A review. Med. Image Anal. 2021, 69, 101971. [Google Scholar] [CrossRef]
Figure 1. Flow chart of the study enrollment. CRA: cranial; LAO: left anterior oblique.
Diagnostics 13 03011 g001
Figure 2. Four types of lesions on the right coronary artery. (A) Local stenosis (blue rectangular box); (B) diffuse stenosis (red rectangular box); (C) bifurcation stenosis (yellow rectangular box); (D) chronic total occlusion (green rectangular box).
Diagnostics 13 03011 g002
Figure 3. Flowchart of the proposed method. DICOM: digital imaging and communications in medicine; LS: local stenosis; DS: diffuse stenosis; BS: bifurcation stenosis; CTO: chronic total occlusion; NMS: non-max suppression; Grad-CAM: gradient-weighted class activation mapping.
Diagnostics 13 03011 g003
Figure 4. Overview of the YOLOv5x model architecture. The whole architecture contains 4 general modules, namely, an input terminal, a backbone, a neck, and a prediction network, along with 6 basic components: Focus, CSP1_X, CSP2_X, CBS, Res Unit, and SPP.
Diagnostics 13 03011 g004
Figure 5. Confusion matrices of the CRA view and the LAO view. The horizontal axis represents the ground truth, and the vertical axis represents the prediction. CRA: cranial; LAO: left anterior oblique; LS: local stenosis; DS: diffuse stenosis; BS: bifurcation stenosis; CTO: chronic total occlusion.
Diagnostics 13 03011 g005
Figure 6. Precision-recall curves of the CRA view and the LAO view. CRA: cranial; LAO: left anterior oblique; CTO: chronic total occlusion.
Diagnostics 13 03011 g006
Figure 7. Representative coronary lesion detection results using YOLOv5 in the test set. The bounding boxes contain images of coronary lesions. CRA: cranial; LAO: left anterior oblique; Blue box: the manual annotation; Orange box: predicted local stenosis; Red box: predicted diffuse stenosis (long lesion); Pink box: predicted bifurcation stenosis; Yellow box: predicted CTO; Value: confidence.
Diagnostics 13 03011 g007
Figure 8. Heatmaps of Grad-CAM generated in the CRA view. The bounding boxes contain images of coronary lesions. (AH) Original images with local stenosis (local lesion), diffuse stenosis (long lesion), bifurcation stenosis, and CTO; (A1H1) heatmap of Grad-CAM with lesions; Value: confidence.
Diagnostics 13 03011 g008
Figure 9. Heatmaps of Grad-CAM generated in the LAO view. The bounding boxes contain images of coronary lesions. (AH): Original images with local stenosis (local lesion), diffuse stenosis (long lesion), bifurcation stenosis, and CTO; (A1H1) heatmap of Grad-CAM with lesions; Value: confidence.
Diagnostics 13 03011 g009
Table 1. Related studies are summarized in four aspects: Methods, data, classes, and results.
Ref.MethodsDataClassesResults
Zhao et al. (2021) [8]FP-U-Net++, arterial centerline extraction, diameter calculation, arterial stenosis detection99 patients,
314 images
1–24%, 25–49%, 50–69%, 70–100%Precision = 0.6998, recall = 0.6840,
Liu et al. (2023) [9]AI-QCA3275 patients,
13,222 images
0–100%Precision = 0.897, recall = 0.879
Algarni et al. (2022) [10]ASCARIS model130 imagesnormal and abnormalAccuracy = 97%, recall = 95%, specificity = 93%
Cong et al. (2023) [11]Inception-v3 and LSTM, redundancy training, and Inception-V3, FPN230 patients,
14,434 images
<25%, 25–99%, CTOAccuracy = 0.85, recall = 0.96, AUC = 0.86
Moon et al. (2020) [13]GoogleNet Inception-v3, CBAM, Grad-CAM452 clipsStenosis ≥ 50% AUC = 0.971, accuracy = 0.934
Ovalle-Magallanes et al. (2020) [20]pre-trained CNN via Transfer Learning, CAM10,000 artificial images, 250 real imagesStenosisAccuracy = 0.95, precision = 0.93, sensitivity = 0.98, specificity = 0.92, F 1   s c o r e = 0.95
Antczak et al. (2021) [19]A patch-based CNN for stenosis detection10,000 artificial images, 250 real imagesStenosisAccuracy = 90%
Du et al. (2021) [21]A DNN for the recognition of lesion morphology10,073 patients, 20,612 imagesStenotic lesion, total occlusion, calcification, thrombus, and dissection F 1   s c o r e = 0.829, 0.810, 0.802, 0.823, 0.854
Ling et al. (2023) [15]DLCAG diagnose system 949 patients,
2980 images
StenosismAP = 86.3%
Danilov et al. (2021) [18]Comparison of state-of-the-art CNN (N = 8)100 patients,
8325 images
Stenosis ≥ 70%mAP = 0.94, F1 score = 0.96, prediction speed = 10 fps
Pang et al. (2021) [22]Stenosis-DetNet with SFF and SCA166 sequence,
1494 images
StenosisAccuracy = 94.87%, sensitivity 82.22%
Table 2. Distributions of images and lesions in the CRA and LAO angle views.
The CRA ViewThe LAO Viewp Value
Age, years63 ± 864 ± 90.54
Gender
Male (%)68 (69%)118 (67%)0.72
Images245333380.66
Training Set (%)17472395
Test Set (%)706943
Lesions
Training Set32591529<0.01
LS20031005
DS37696
BS500375
CTO38053
Test Set38741262<0.01
LS2187433
DS405273
BS411174
CTO871382
CRA: cranial; LAO: left anterior oblique; LS: local stenosis; DS: diffuse stenosis; BS: bifurcation stenosis; CTO: chronic total occlusion.
Table 3. Results of four lesions with two angle views at the image level.
LesionsNumberPrecisionRecall[email protected][email protected]F1 Score
CRALS10550.6850.6470.6430.4050.665
DS960.4580.8440.6870.6770.594
BS3740.6560.6580.6750.6250.657
CTO530.750.5660.6470.2630.645
All15780.6370.6790.6630.4930.657
LAOLS4330.4260.6170.4790.2730.504
DS2730.6480.8680.7730.6880.742
BS1740.6990.6550.6940.5210.676
CTO3820.9270.7960.870.7490.857
All12620.6750.7340.7040.5580.703
[email protected]: mean average precision (IoU = 0.1); [email protected]: mean average precision (IoU = 0.5); CRA: cranial; LAO: left anterior oblique; LS: local stenosis; DS: diffuse stenosis; BS: bifurcation stenosis; CTO: chronic total occlusion.
Table 4. Results of four lesions with two angle views at the patient level.
LesionsTP + FNTPFNFPPRF1 ScoremFP
CRALS59554440.5560.9320.6961.467
DS66080.4291.0000.6000.267
BS15132200.3940.8670.5420.667
CTO65120.7140.8330.7690.067
All86797740.5230.9080.6522.467
LAOLS28244570.2960.8570.4401.118
DS18180170.5141.0000.6790.333
BS11101160.3850.9090.5410.314
CTO1919050.7921.0000.8840.098
All76715950.4970.9420.6361.863
TP: true positive; FN: false negative; FP: false positive; P: precision; R: recall; mFP: mean predicted positive; CRA: cranial; LAO: left anterior oblique; LS: local stenosis; DS: diffuse stenosis; BS: bifurcation stenosis; CTO: chronic total occlusion.
Disclaimer/Publisher’s Note: The statements, opinions and data contained in all publications are solely those of the individual author(s) and contributor(s) and not of MDPI and/or the editor(s). MDPI and/or the editor(s) disclaim responsibility for any injury to people or property resulting from any ideas, methods, instructions or products referred to in the content.

