
Empowering Lower Limb Disorder Identification through PoseNet and Artificial Intelligence

 ,
,  ,
,  ,
,  ,
,  ,
,  ,
,  and
and 
Abstract
:1. Introduction
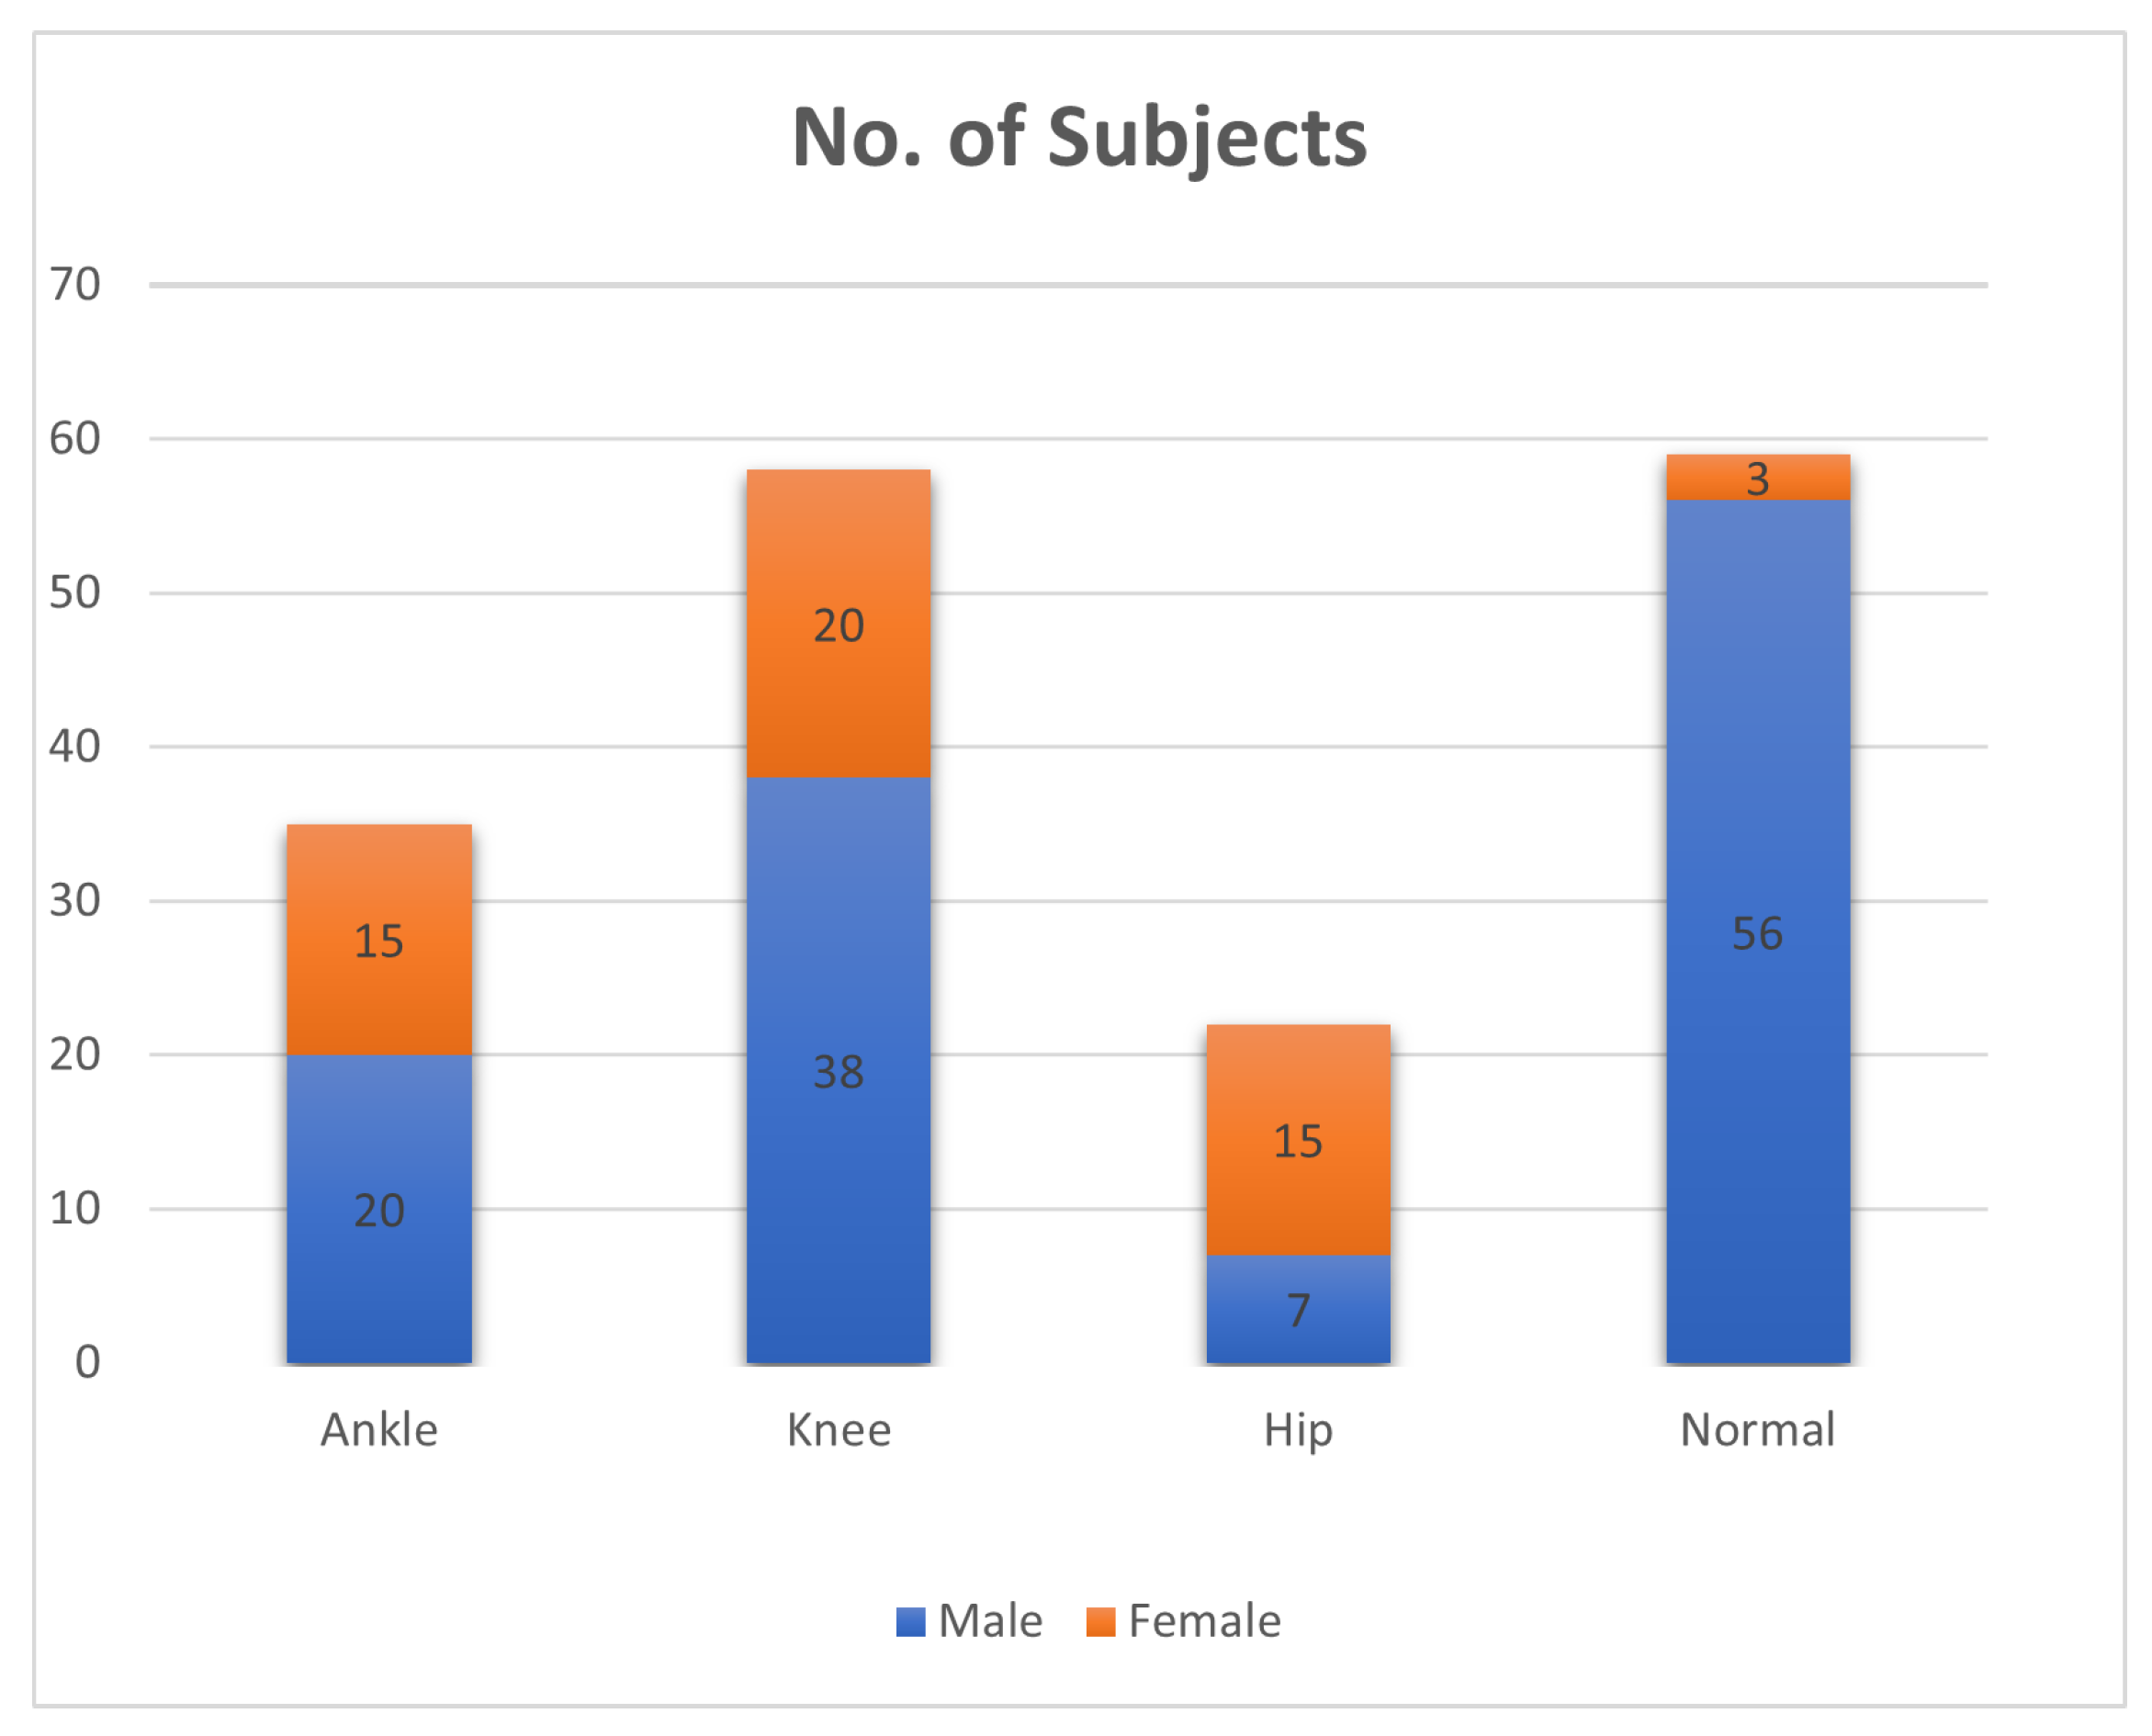
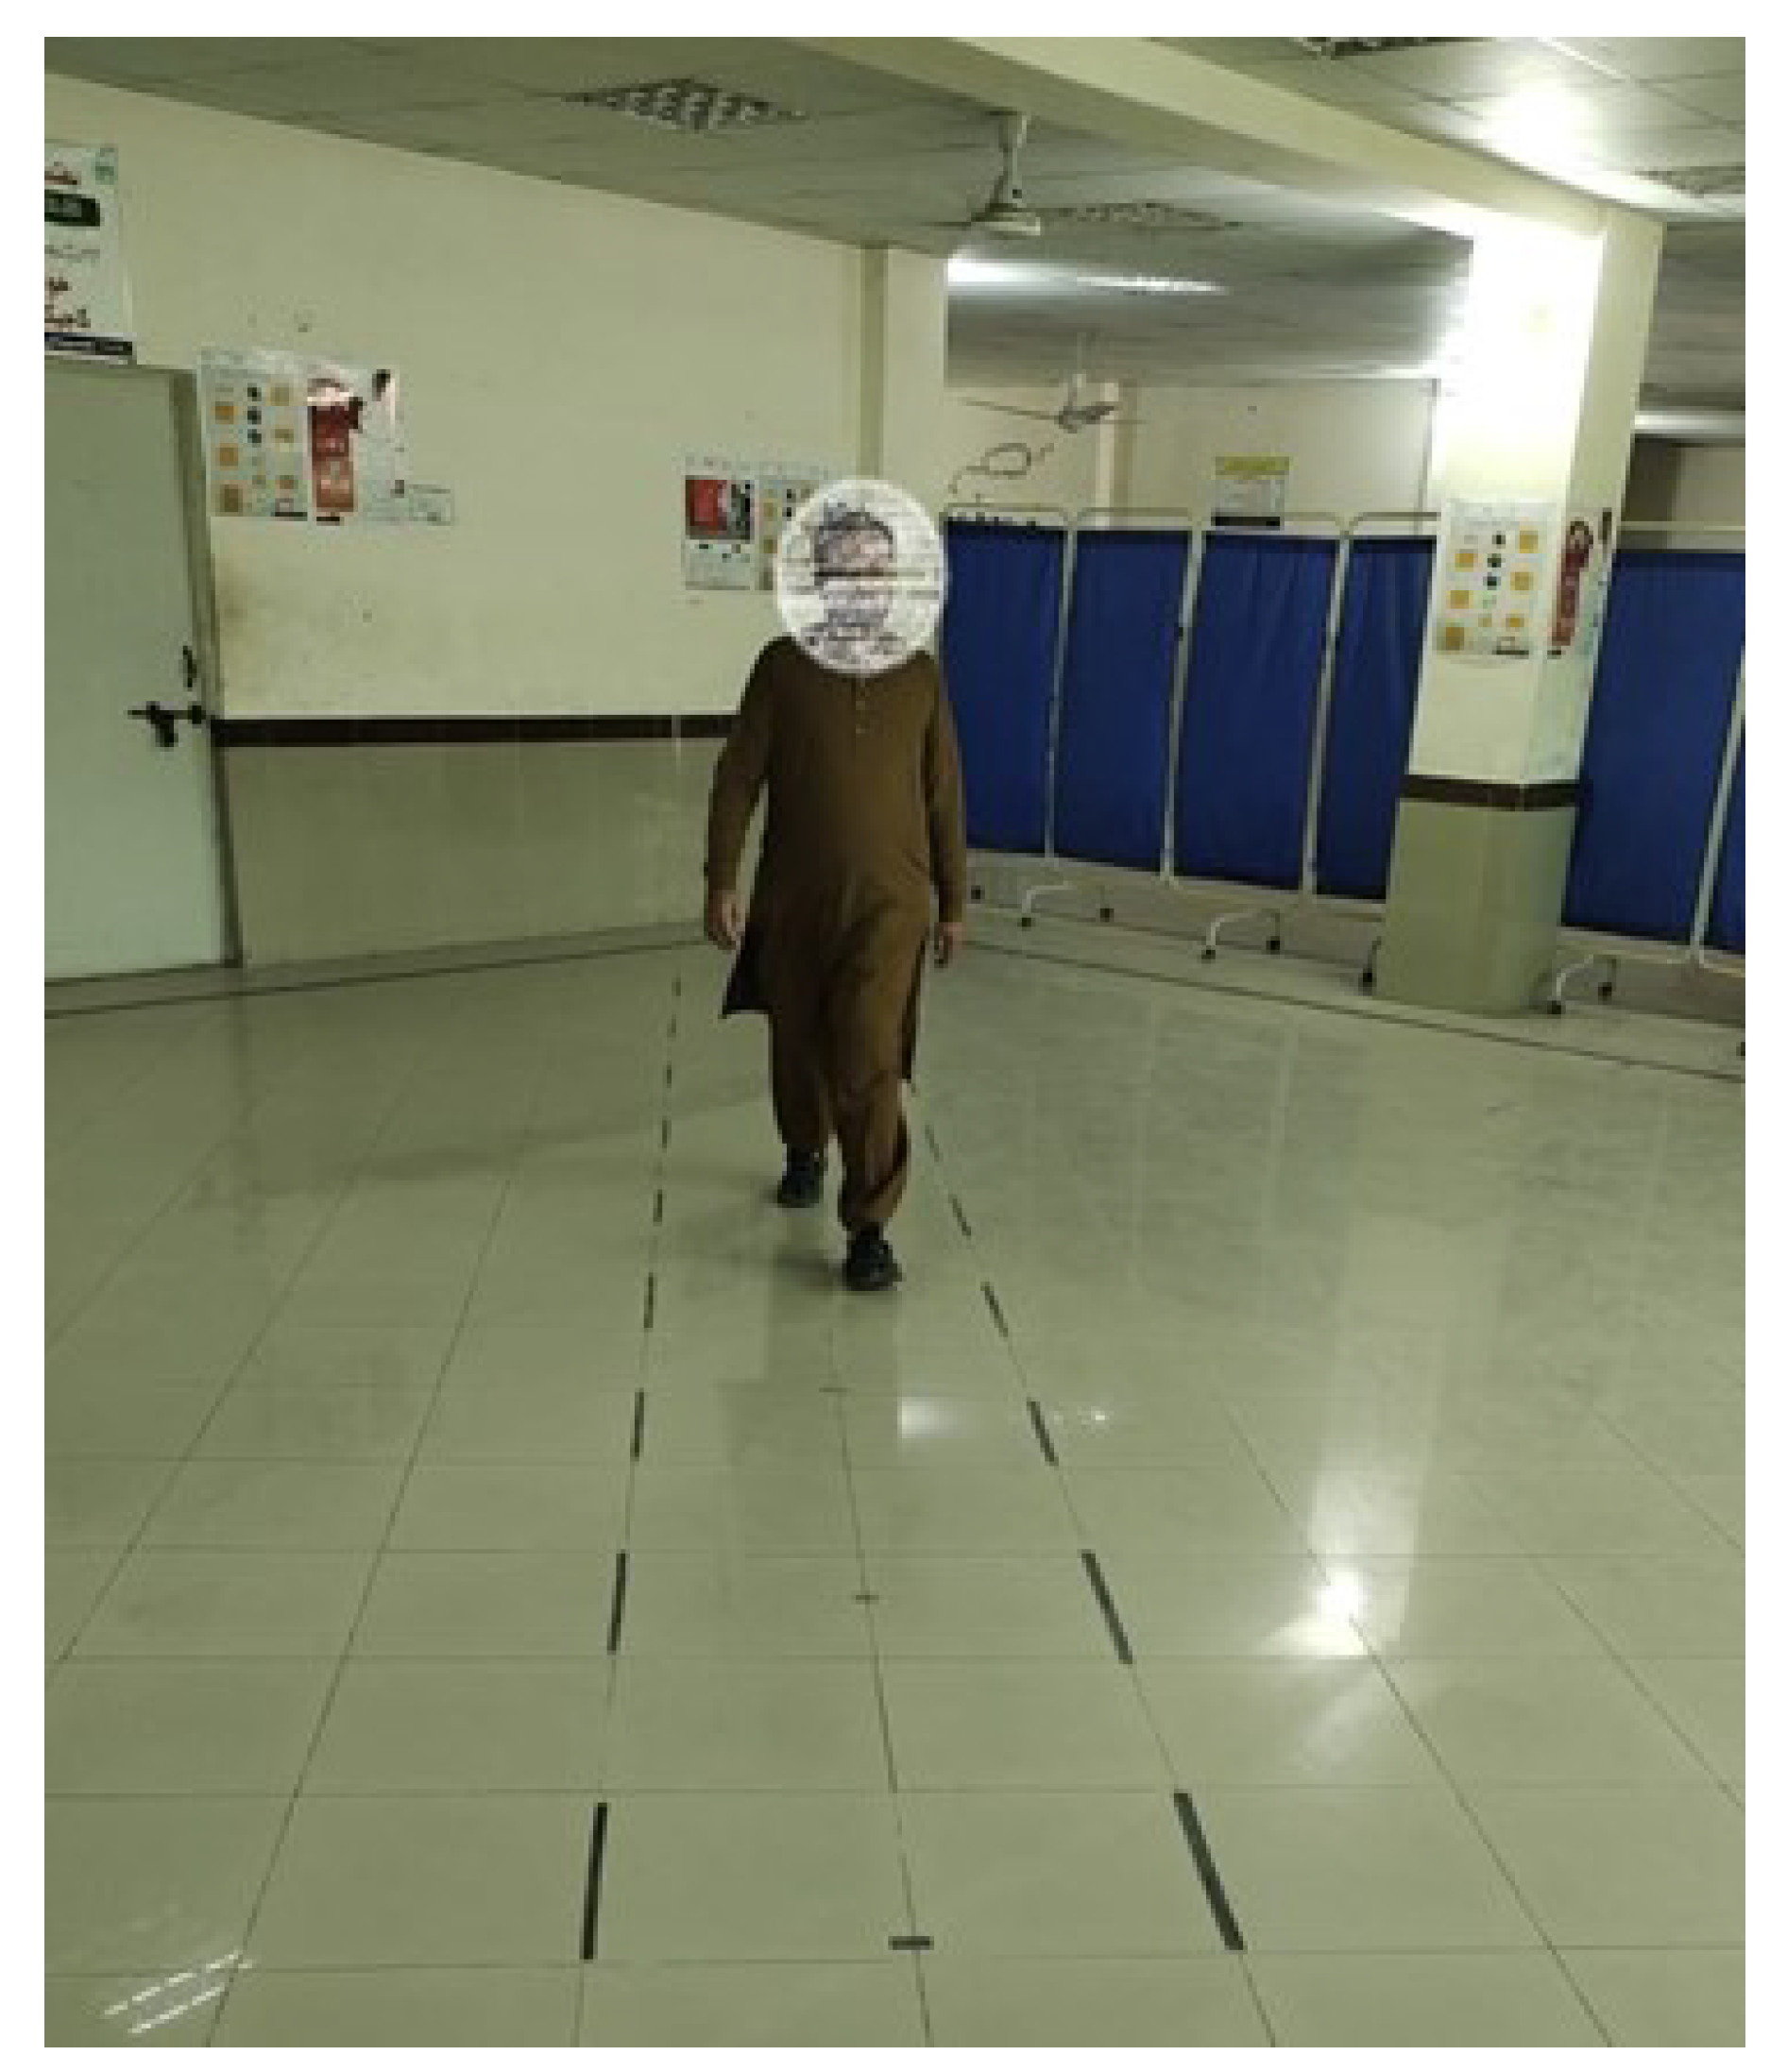
- The data were collected from a total of 174 real patients and normal individuals, comprising both male and female participants. The data collection process involved capturing videos of the participants using a camera while they walked on a designated walkway at the Tehsil Headquarter (THQ) Hospital in Sadiqabad.
- The data were gathered by the system via video recordings, thereby obviating the necessity for intrusive sensors or apparatus affixed to the subjects’ bodies. The implementation of this data collection method that minimizes interference guarantees a more authentic and unrestrained evaluation of gait patterns, thereby enhancing the ecological validity of the system.
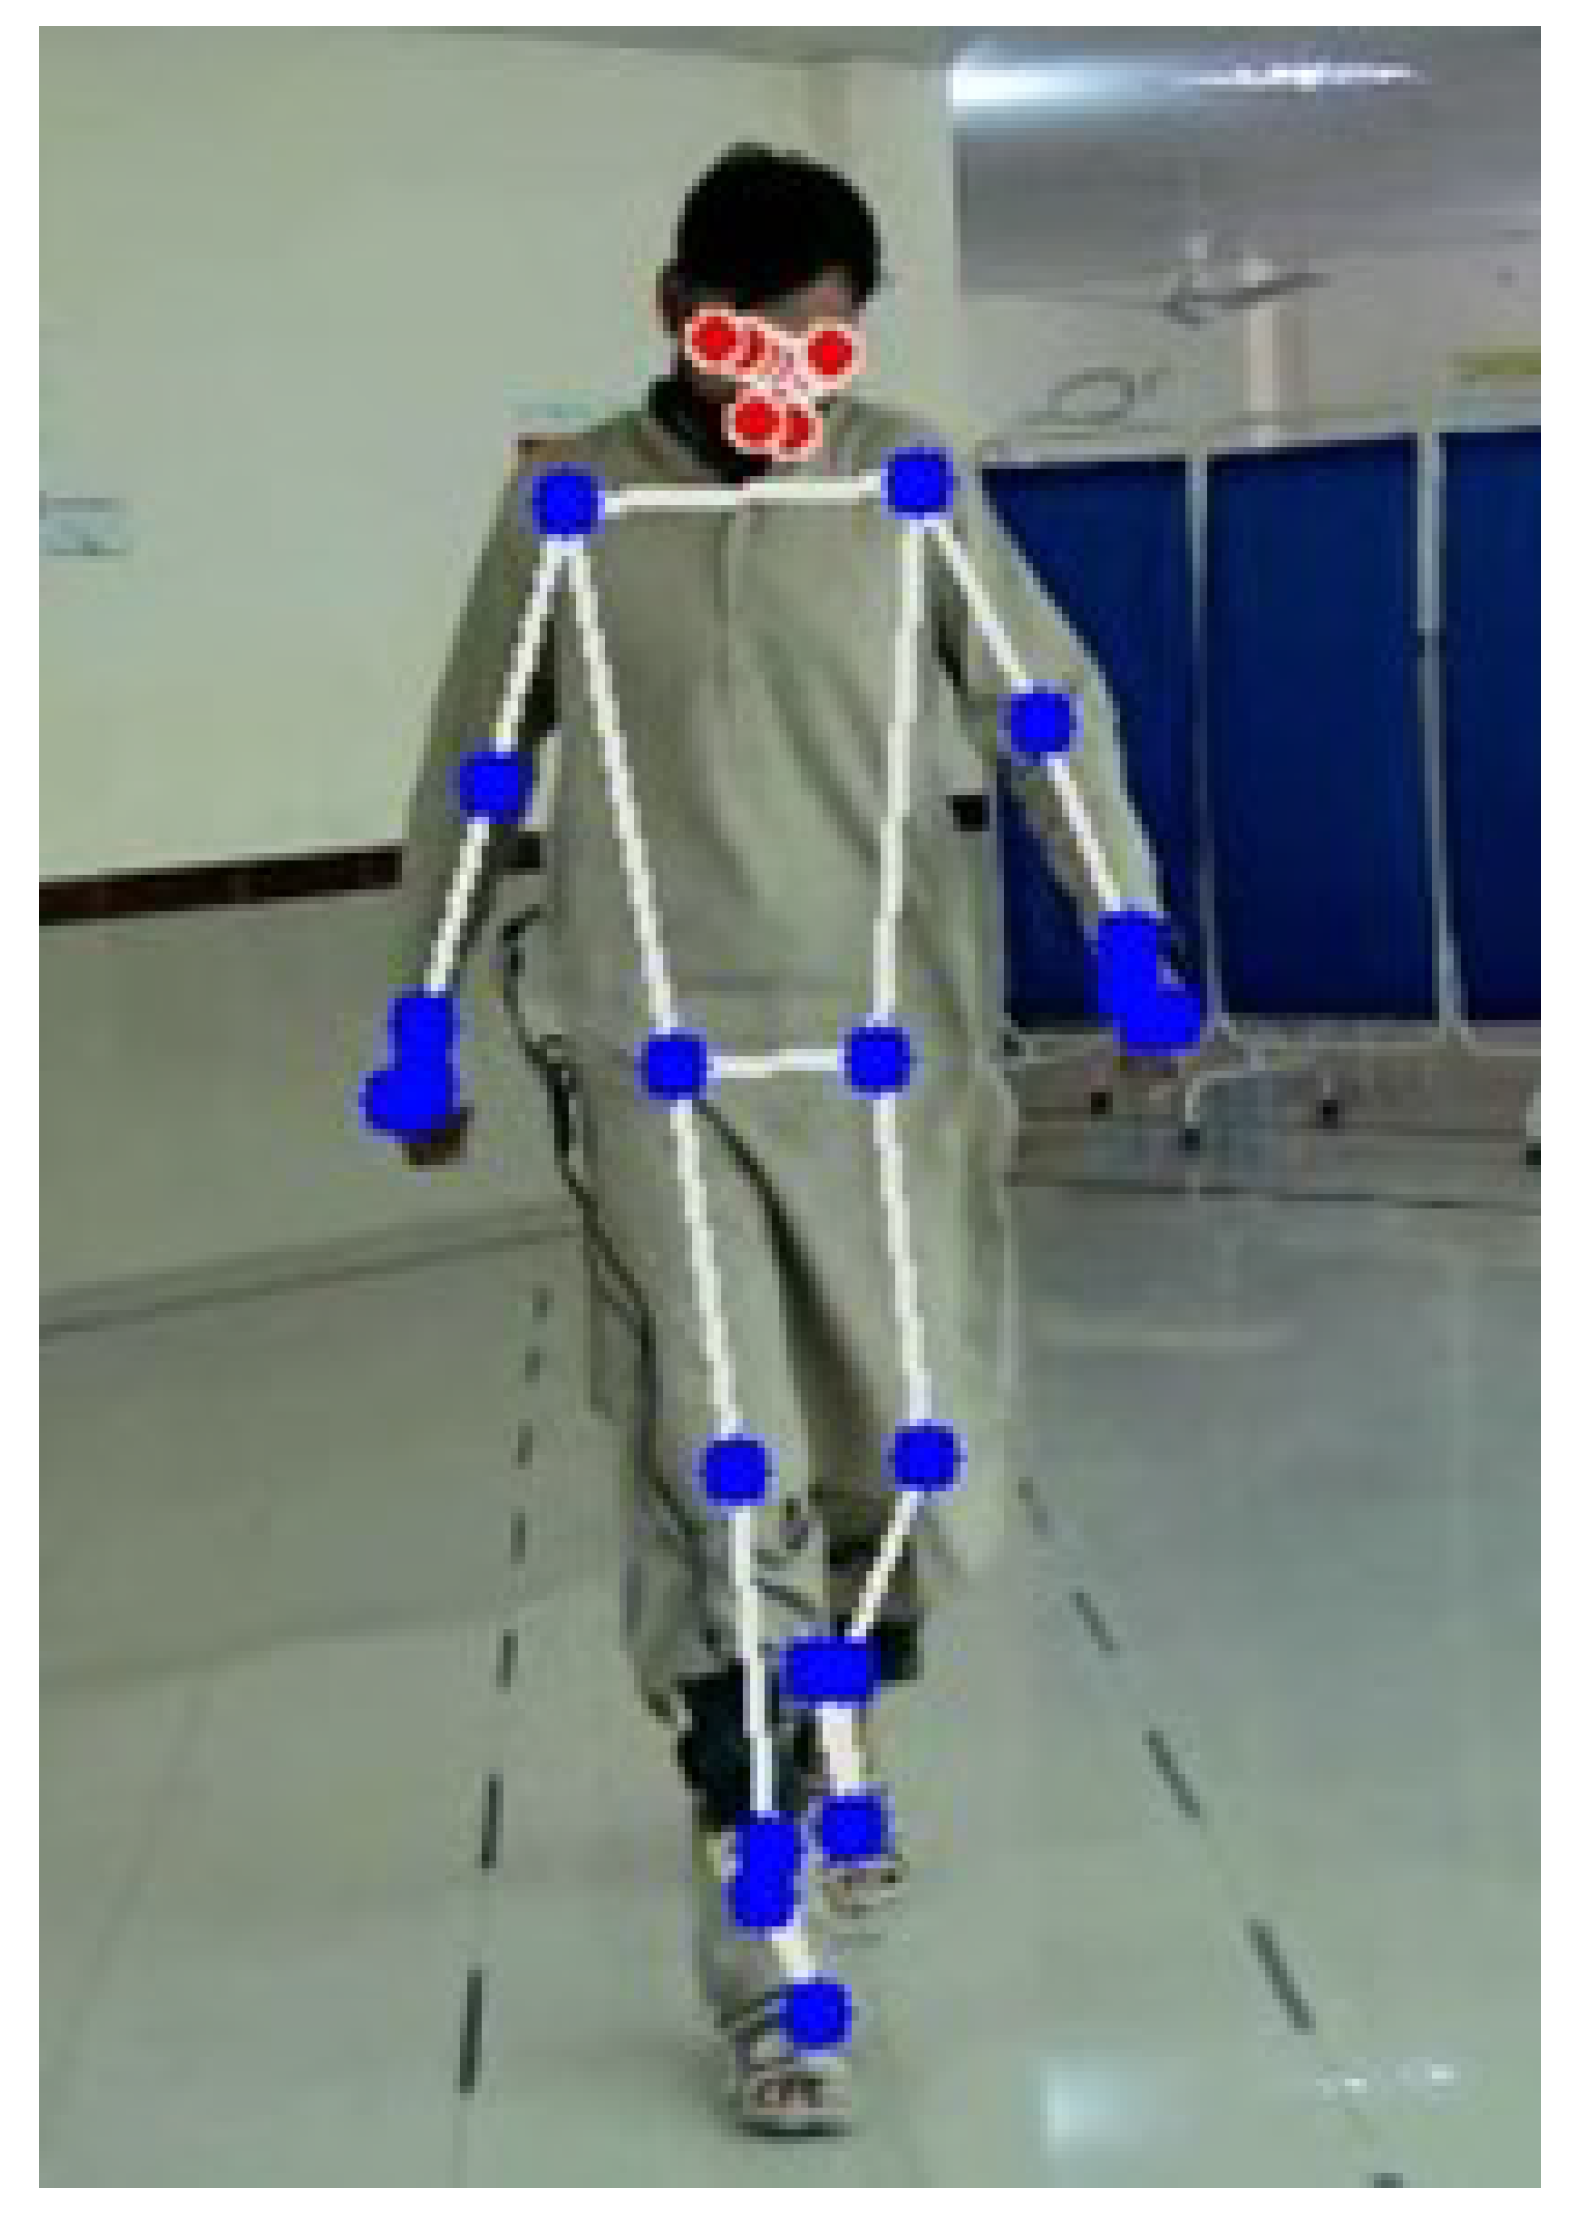
- The system employs PoseNet, a deep learning model, to extract relevant features from videos that capture movements of the lower limbs. By utilizing the features of PoseNet, the system capitalizes on the model’s capacity to accurately estimate the human pose, facilitating a thorough examination of gait patterns.
- Through the application of machine learning (ML) algorithms to the extracted PoseNet features, the system possesses the capability to effectively classify and distinguish various disorders that impact the hip, ankle, and knee. The implementation of automation in this context serves to decrease the level of subjectivity involved in manual analysis, while also reducing the amount of time required for such analysis. As a result, the process of diagnosis becomes more expedient and efficient.
2. Literature Review
3. Materials and Methods
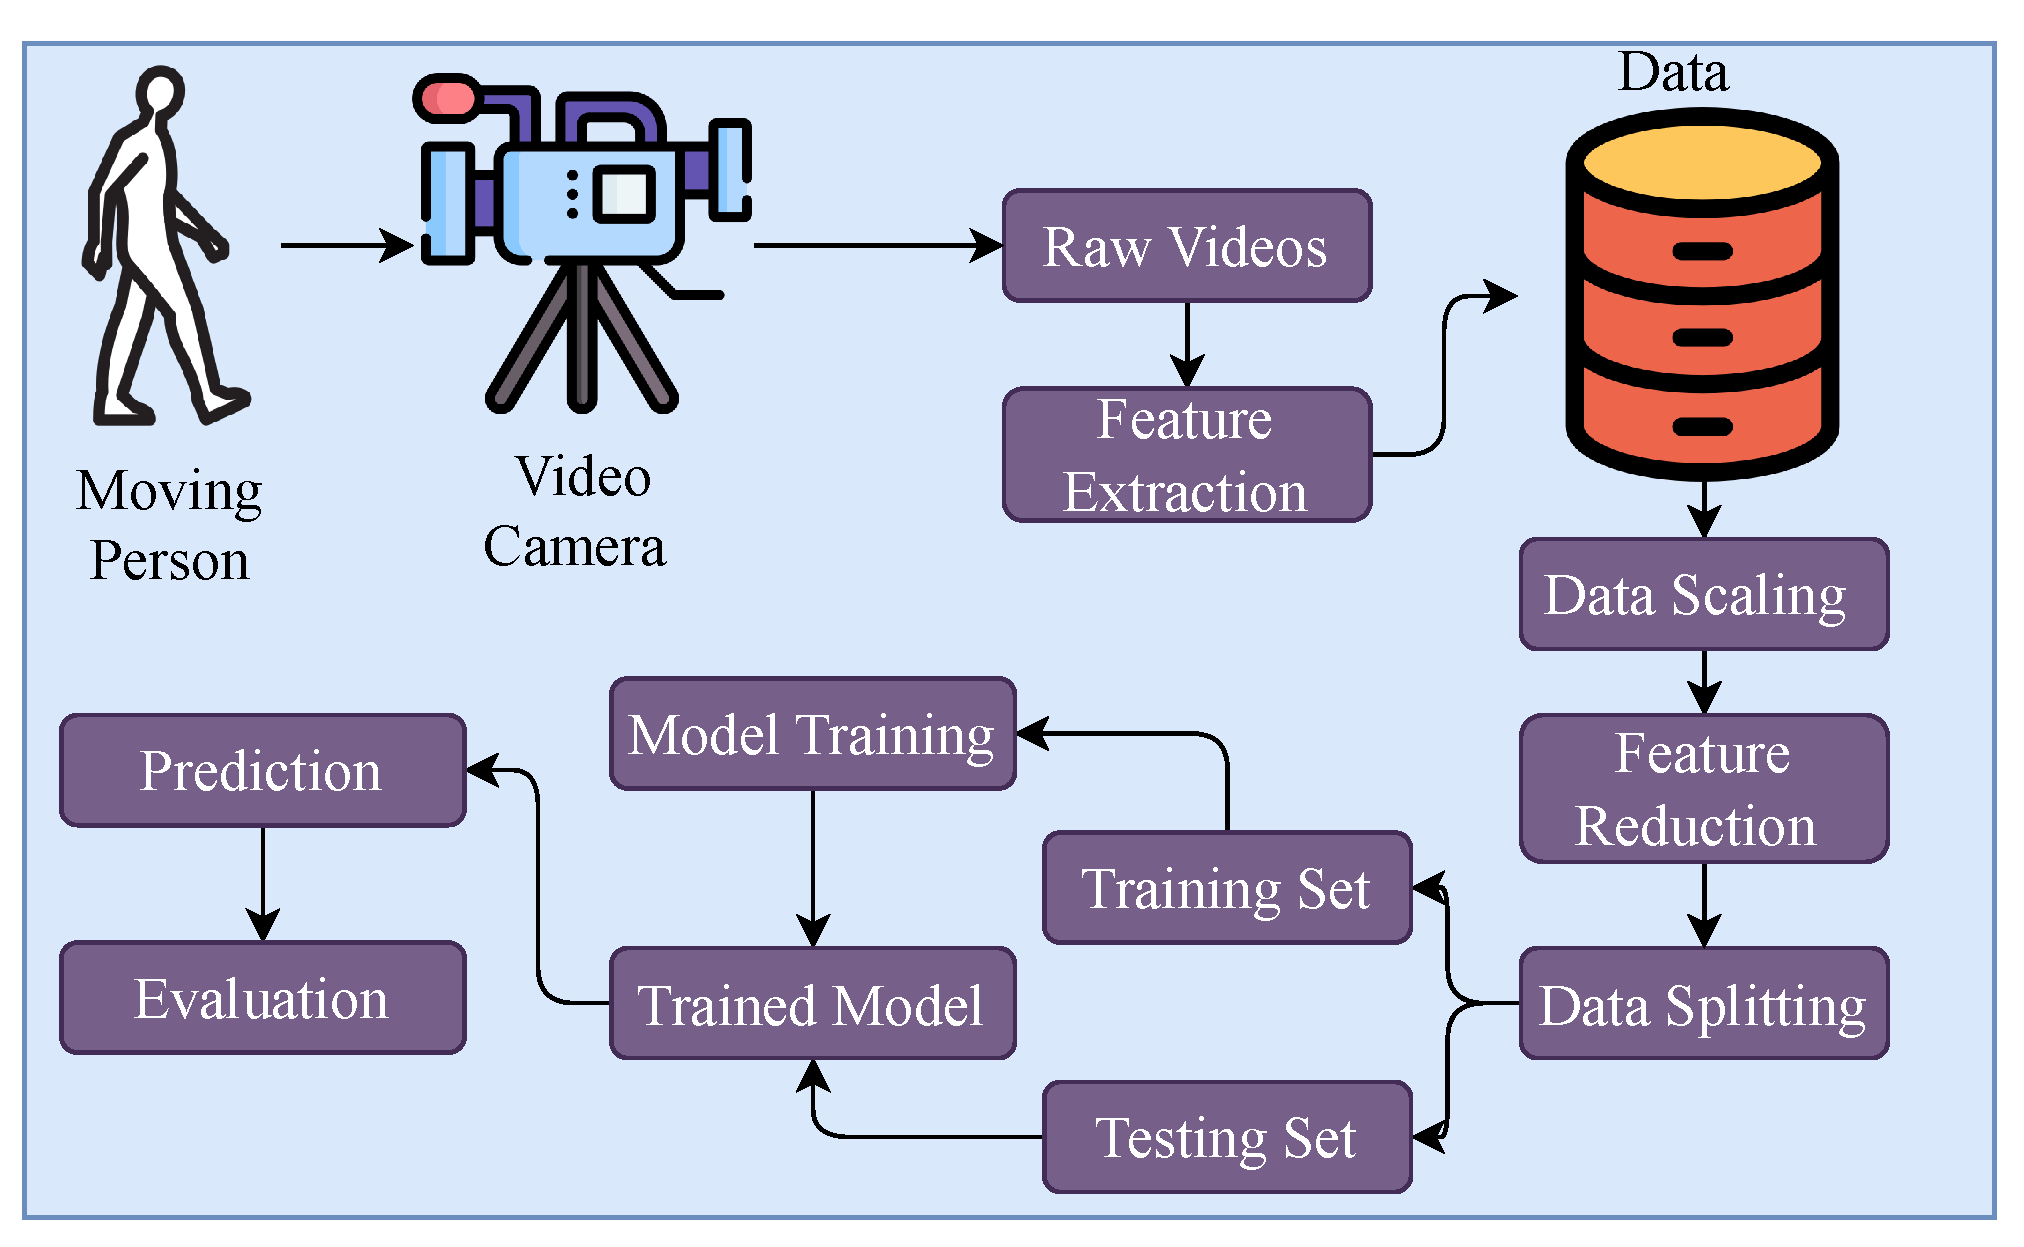
3.1. Proposed Methodology
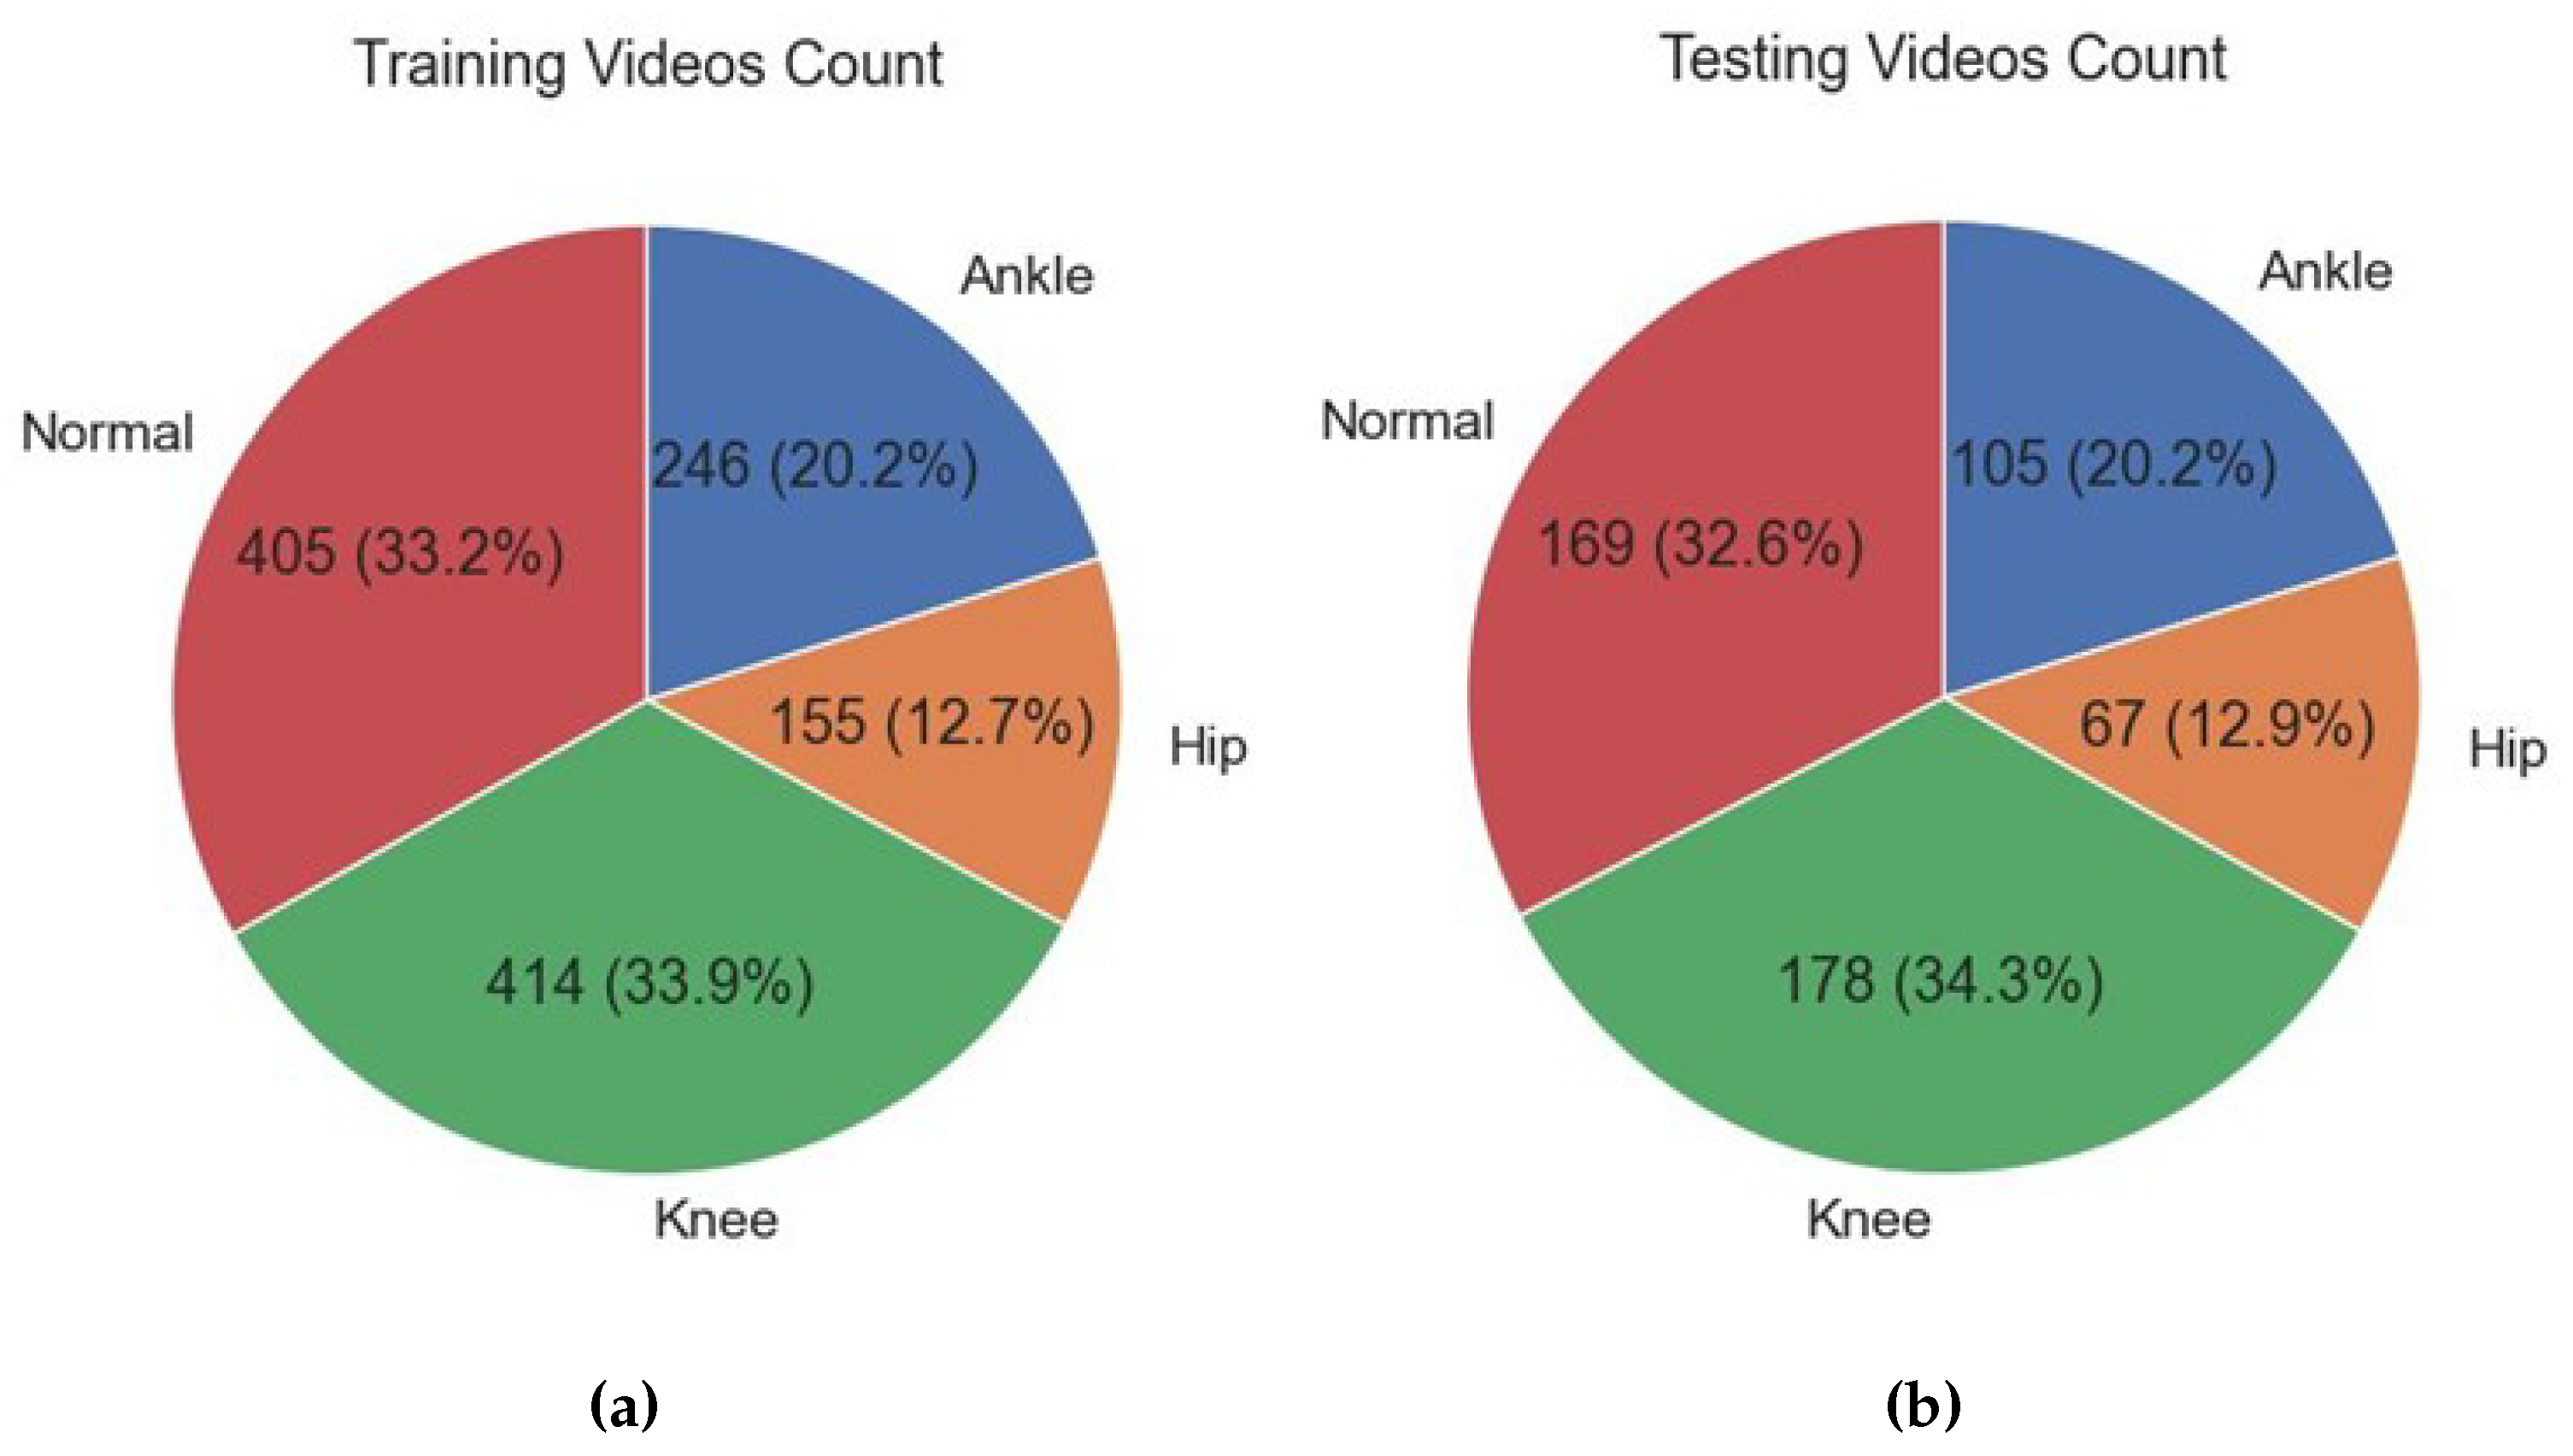
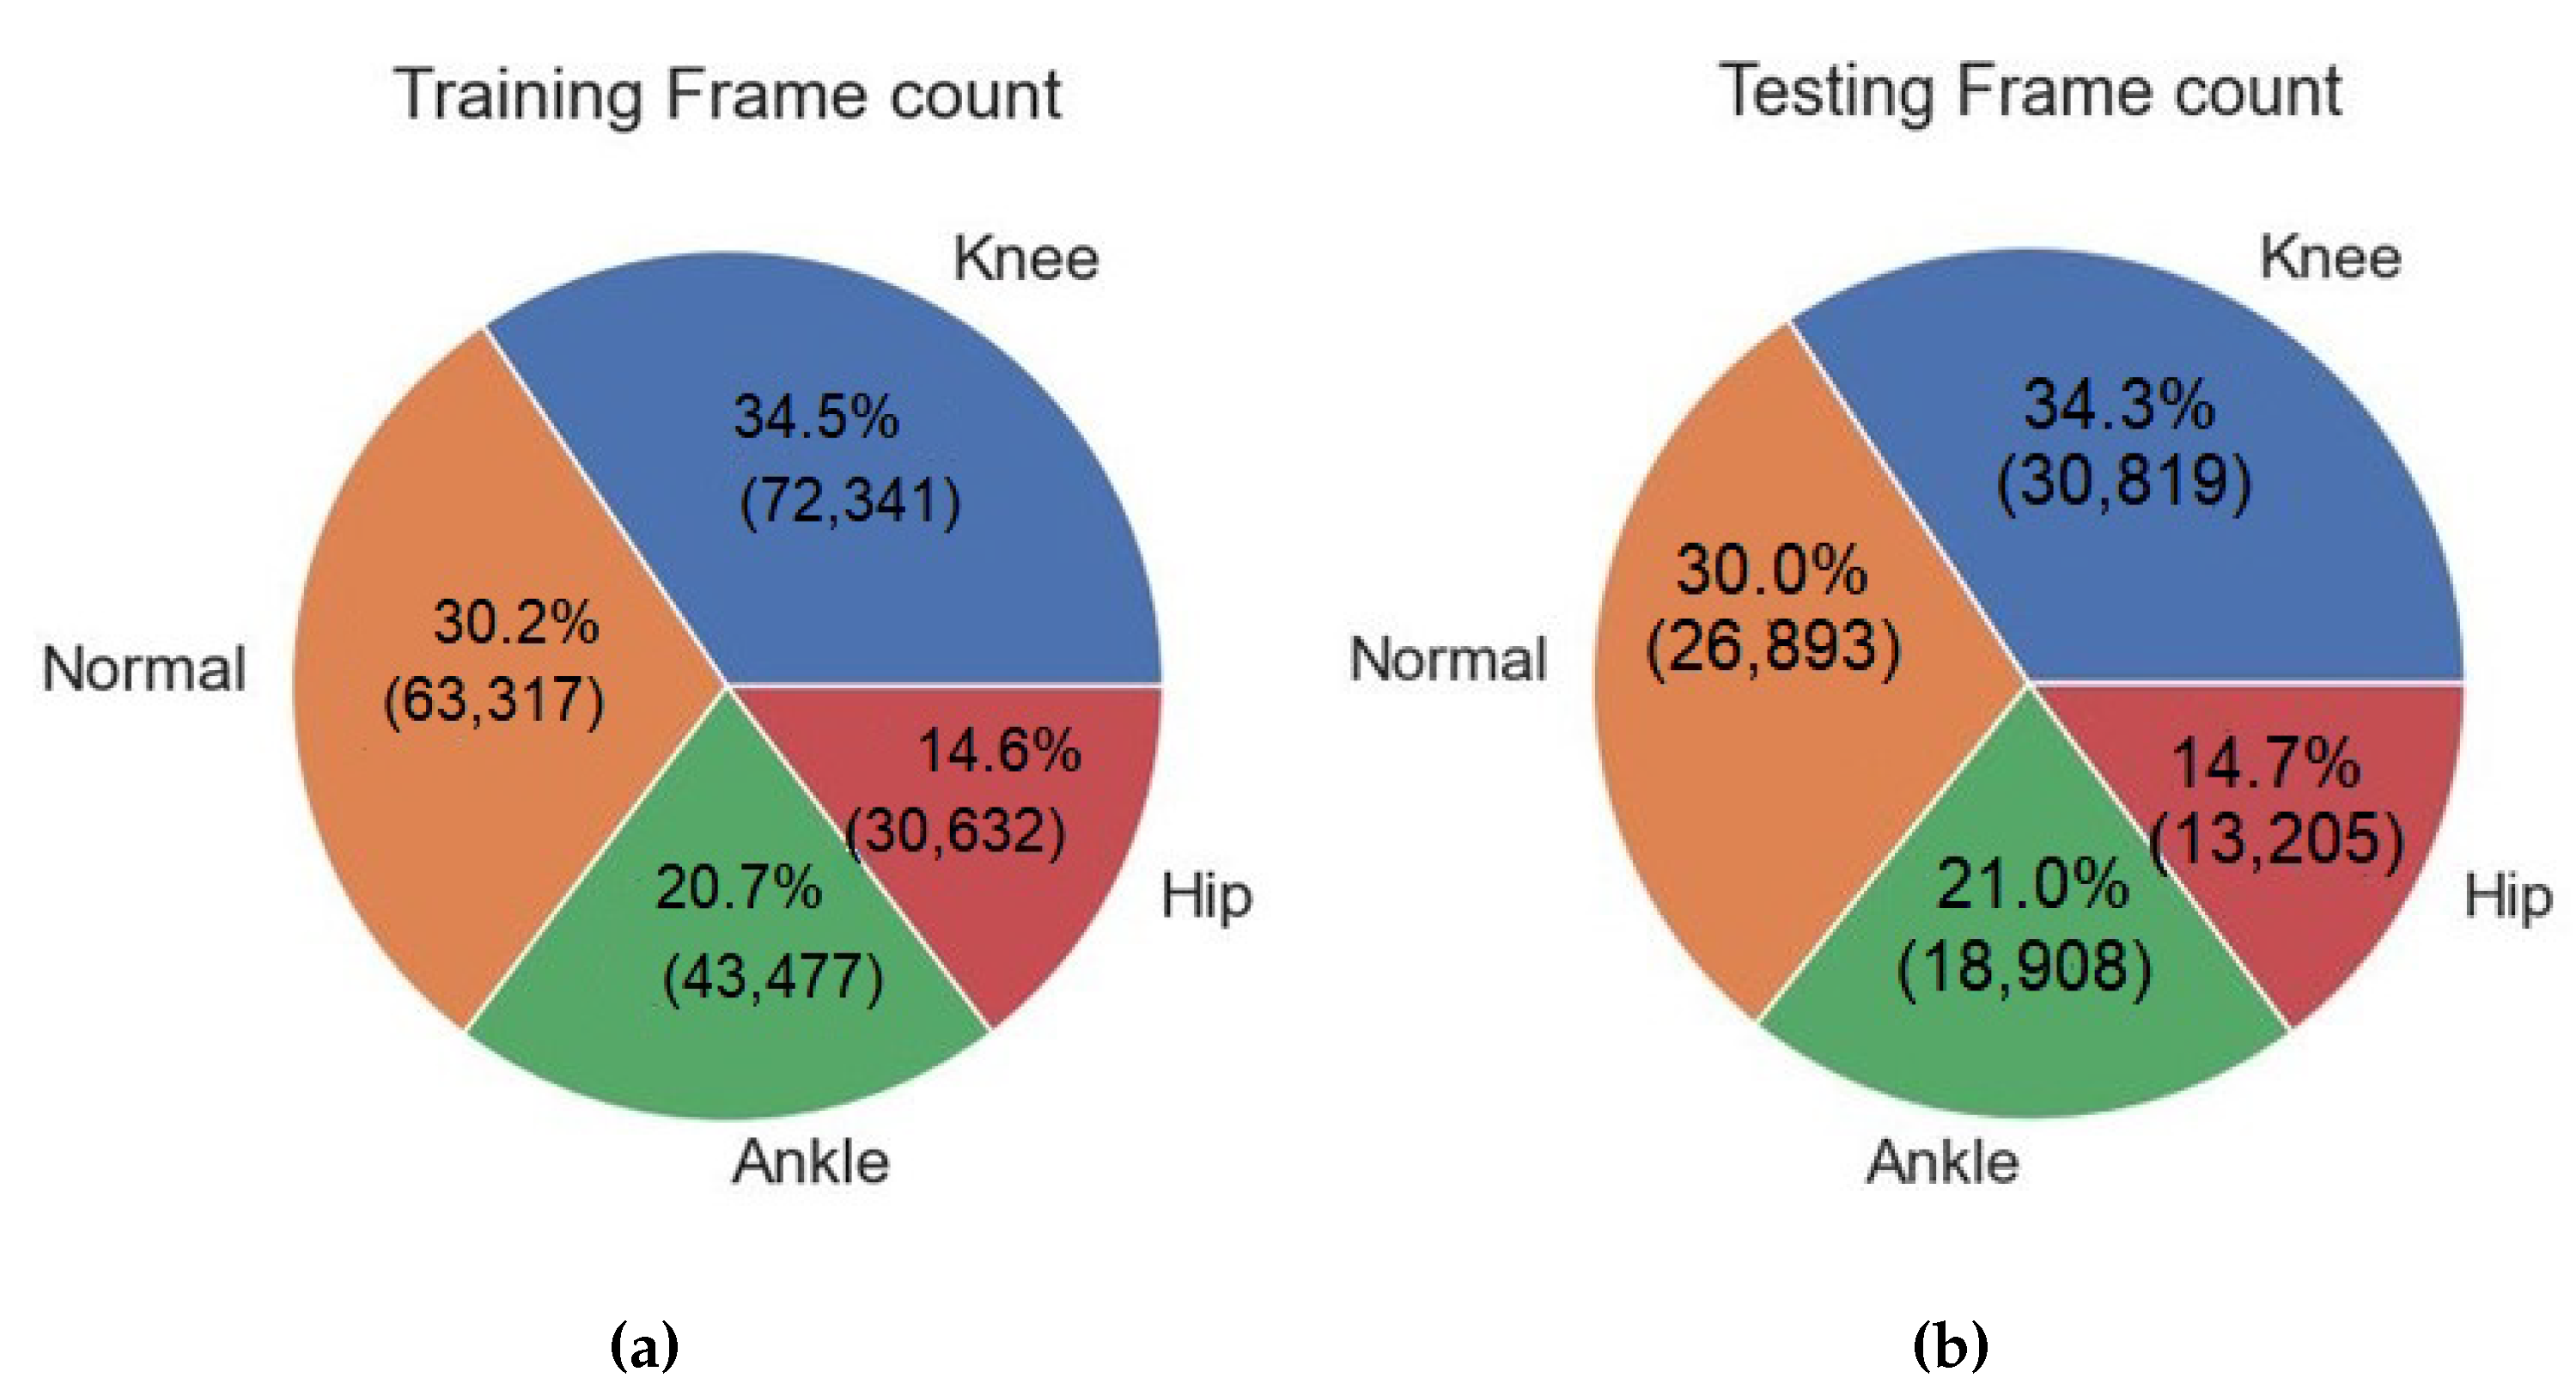
3.2. Data Collection
3.3. Feature Extraction
- Upper Body:
- -
- Left Shoulder;
- -
- Right Shoulder;
- -
- Left Elbow;
- -
- Right Elbow;
- -
- Left Wrist;
- -
- Right Wrist;
- -
- Left Pinky;
- -
- Right Pinky;
- -
- Left Index;
- -
- Right Index;
- -
- Left Thumb;
- -
- Right Thumb.
- Lower Body:
- -
- Left Hip;
- -
- Right Hip;
- -
- Left Knee;
- -
- Right Knee;
- -
- Left Ankle;
- -
- Right Ankle;
- -
- Left Heel;
- -
- Right Heel;
- -
- Left Foot Index;
- -
- Right Foot Index.
- Number of key points = 22.
- Number of extracted features from each key point = 4.
- Total number of features = 22 × 4 = 88.
3.4. Data Scaling and Feature Reduction
- represents the scaled feature value;
- X is the original feature value;
- is the mean of the feature values in the dataset;
- is the standard deviation of the feature values in the dataset.
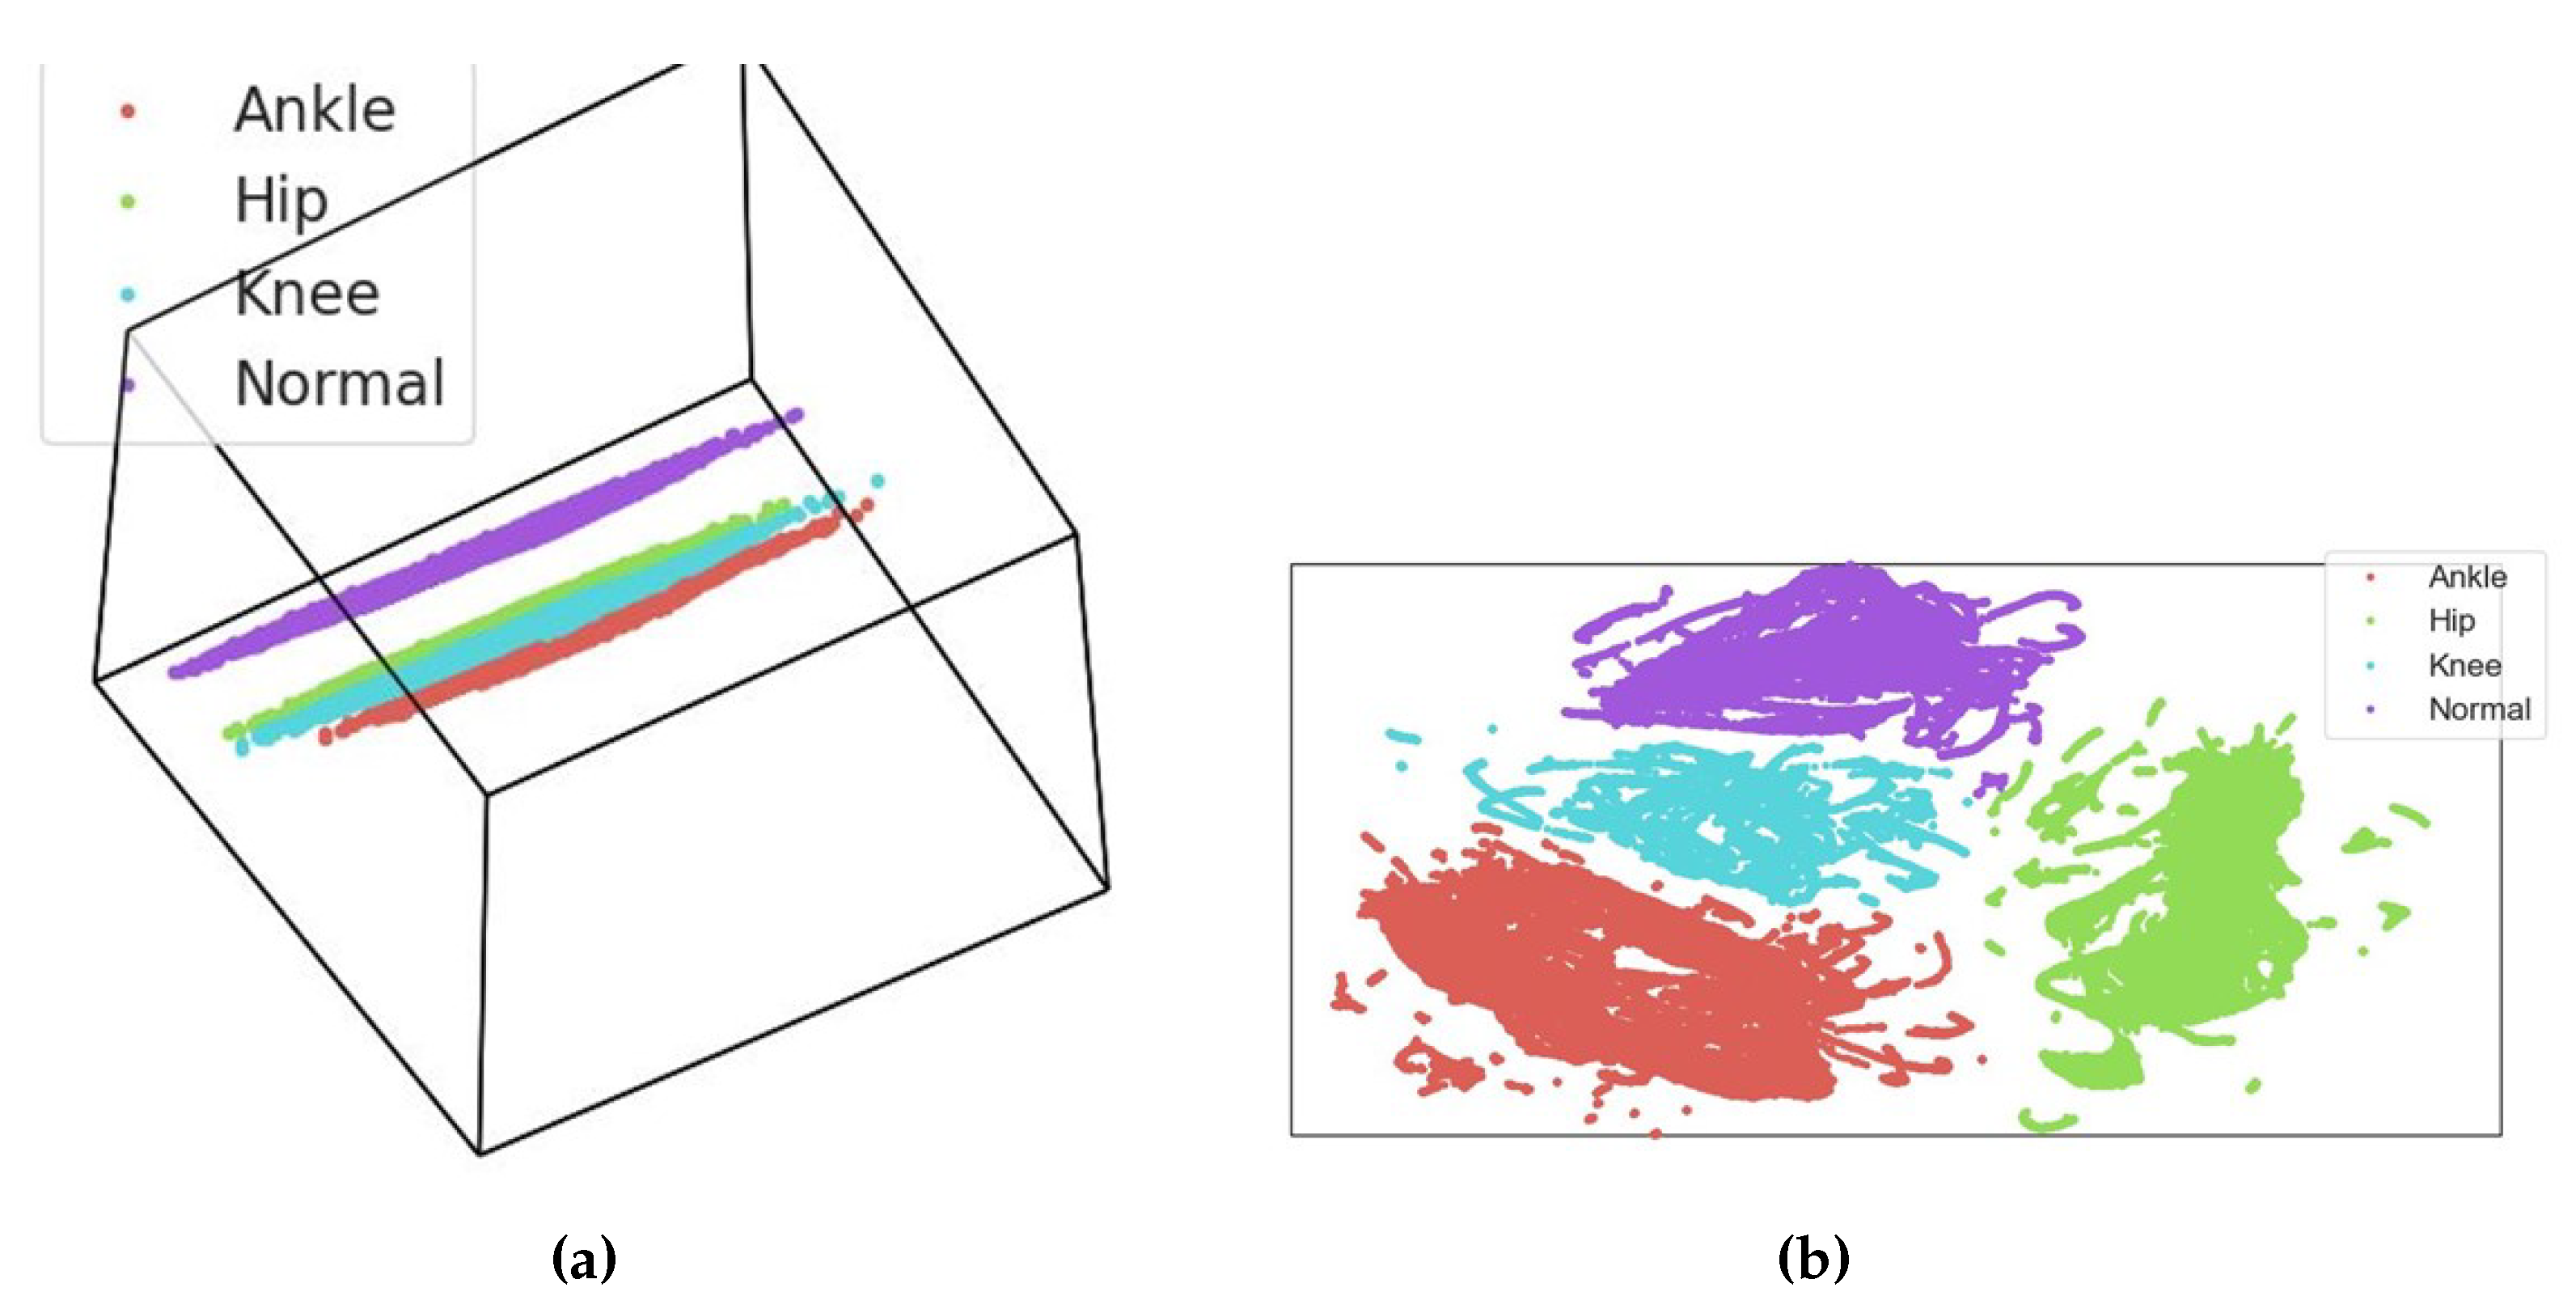
3.5. Exploratory Data Analysis
4. Results and Discussion
4.1. Computational Complexity
4.2. Comparison with Existing Studies
5. Conclusions
Author Contributions
Funding
Institutional Review Board Statement
Informed Consent Statement
Data Availability Statement
Conflicts of Interest
Abbreviations
| RF | Random Forest |
| DT | Decision Tree |
| KNN | K-Nearest Neighbor |
| LR | Logistic Regression |
| SVM | Support Vector Machine |
| PCA | Principal Component Analysis |
| VNC | Virtual Network Computing |
| FPS | Frames Per Second |
| NN | Neural Network |
| CNN | Convolutional Neural Network |
| ML | Machine Learning |
| AOA | Ankle Osteoarthrosis |
| ETC | Extra Tree Classifier |
| GDs | Gait Disorders |
| ELA | Learning-Based Adaboost |
| RQA | Recurrence Quantification Analysis |
References
- Fatima, S.Z. Life of an amputee: Predictors of quality of life after lower limb amputation. Wiener Medizinische Wochenschrift 2022, 1–5. [Google Scholar] [CrossRef] [PubMed]
- Grimmer, M.; Riener, R.; Walsh, C.J.; Seyfarth, A. Mobility related physical and functional losses due to aging and disease-a motivation for lower limb exoskeletons. J. Neuroeng. Rehabil. 2019, 16, 1–21. [Google Scholar] [CrossRef]
- Pirani, H.; Noori, S.; Shahmoradi, D. Examining the prevalence of lower body disorders among male lower-secondary education students in Kermanshah. Int. J. Health Life Sci. 2019, 5, e85033. [Google Scholar] [CrossRef]
- Leggit, J.; Carey, P.M.; Alisangco, J.B. Disorders of the Lower Extremity. In Family Medicine: Principles and Practice; Paulman, P.M., Taylor, R.B., Paulman, A.A., Nasir, L.S., Eds.; Springer International Publishing: Cham, Switzerland, 2017; pp. 1489–1513. [Google Scholar] [CrossRef]
- Osteoarthritis. Available online: https://www.mayoclinic.org/diseases-conditions/osteoarthritis/symptoms-causes/syc-20351925 (accessed on 17 August 2023).
- Musculoskeletal Health. 2022. Available online: https://www.who.int/news-room/fact-sheets/detail/musculoskeletal-conditions (accessed on 17 August 2023).
- Khalid, H.; Hussain, M.; Al Ghamdi, M.A.; Khalid, T.; Khalid, K.; Khan, M.A.; Fatima, K.; Masood, K.; Almotiri, S.H.; Farooq, M.S.; et al. A comparative systematic literature review on knee bone reports from mri, x-rays and ct scans using deep learning and machine learning methodologies. Diagnostics 2020, 10, 518. [Google Scholar] [CrossRef] [PubMed]
- Heidari, B. Knee osteoarthritis diagnosis, treatment and associated factors of progression: Part II. Casp. J. Intern. Med. 2011, 2, 249. [Google Scholar]
- Hamza, A.; Khan, M.A.; Alhaisoni, M.; Al Hejaili, A.; Shaban, K.A.; Alsubai, S.; Alasiry, A.; Marzougui, M. D2BOF-COVIDNet: A framework of deep bayesian optimization and fusion-assisted optimal deep features for COVID-19 classification using chest X-ray and mri scans. Diagnostics 2022, 13, 101. [Google Scholar] [CrossRef]
- Devereux, R.B.; Pini, R.; Aurigemma, G.P.; Roman, M.J. Measurement of left ventricular mass: Methodology and expertise. J. Hypertens. 1997, 15, 801–809. [Google Scholar] [CrossRef]
- Weygers, I.; Kok, M.; Konings, M.; Hallez, H.; De Vroey, H.; Claeys, K. Inertial sensor-based lower limb joint kinematics: A methodological systematic review. Sensors 2020, 20, 673. [Google Scholar] [CrossRef]
- Picerno, P. 25 years of lower limb joint kinematics by using inertial and magnetic sensors: A review of methodological approaches. Gait Posture 2017, 51, 239–246. [Google Scholar] [CrossRef]
- Balaji, E.; Brindha, D.; Elumalai, V.K.; Umesh, K. Data-driven gait analysis for diagnosis and severity rating of Parkinson’s disease. Med Eng. Phys. 2021, 91, 54–64. [Google Scholar]
- Van Deventer, K.A.; Seehusen, C.N.; Walker, G.A.; Wilson, J.C.; Howell, D.R. The diagnostic and prognostic utility of the dual-task tandem gait test for pediatric concussion. J. Sport Health Sci. 2021, 10, 131–137. [Google Scholar] [CrossRef] [PubMed]
- Beyrami, S.M.G.; Ghaderyan, P. A robust, cost-effective and non-invasive computer-aided method for diagnosis three types of neurodegenerative diseases with gait signal analysis. Measurement 2020, 156, 107579. [Google Scholar] [CrossRef]
- Hill, C.N.; Romero, M.; Rogers, M.; Queen, R.M.; Brolinson, P.G. Effect of osteopathic manipulation on gait asymmetry. J. Osteopath. Med. 2021, 122, 85–94. [Google Scholar] [CrossRef]
- Terrell, Z.T.; Moudy, S.C.; Hensel, K.L.; Patterson, R.M. Effects of osteopathic manipulative treatment vs. osteopathic cranial manipulative medicine on Parkinsonian gait. J. Osteopath. Med. 2022, 122, 243–251. [Google Scholar] [CrossRef] [PubMed]
- Martins, J.S.; Sabino, G.; Nascimento, D.H.; Machado, G.M.; Vimieiro, C.B. Biomechanical model for Dynamic Analysis of the Human Gait. In Proceedings of the International Symposium on Computer Methods in Biomechanics and Biomedical Engineering, New York, NY, USA, 14–16 August 2019; pp. 362–370. [Google Scholar]
- Silva, M.P.; Ambrósio, J.A. Sensitivity of the results produced by the inverse dynamic analysis of a human stride to perturbed input data. Gait Posture 2004, 19, 35–49. [Google Scholar] [CrossRef] [PubMed]
- Ruiz, D.V.; Magluta, C.; Roitman, N. Experimental verification of biomechanical model of bipedal walking to simulate vertical loads induced by humans. Mech. Syst. Signal Process. 2022, 167, 108513. [Google Scholar] [CrossRef]
- Song, Y.; Biro, I. The Evolution of Marker-based Motion Analysis and the Integration of Advanced Computational Methods: Application to Human Gait Biomechanics. In Proceedings of the 2022 2nd International Conference on Bioinformatics and Intelligent Computing, Harbin, China, 21–23 January 2022; pp. 201–205. [Google Scholar]
- Li, J.; Du, H. Research on the sports biomechanics modeling of the human motion technical movements. In Cyber Security Intelligence and Analytics; Springer: Berlin/Heidelberg, Germany, 2020; pp. 243–248. [Google Scholar]
- Meng, Y.; Bíró, I.; Sárosi, J. Markerless measurement techniques for motion analysis in sports science. Analecta Tech. Szeged. 2023, 17, 24–31. [Google Scholar] [CrossRef]
- Fouasson-Chailloux, A.; Menu, P.; Dauty, M. Lower-Limb Arthropathies and Walking: The Use of 3D Gait Analysis as a Relevant Tool in Clinical Practice. Int. J. Environ. Res. Public Health 2022, 19, 6785. [Google Scholar] [CrossRef]
- Klöpfer-Krämer, I.T.; Augat, P. Functional Capacity Evaluation and Quantitative Gait Analysis: Lower Limb Disorders. In Handbook of Human Motion; Müller, B., Wolf, S.I., Brueggemann, G.P., Deng, Z., McIntosh, A., Miller, F., Selbie, W.S., Eds.; Springer International Publishing: Cham, Switzerland, 2017; pp. 1–17. [Google Scholar] [CrossRef]
- Shin, J.; Yoo, J.; Jung, T.; Goo, H. Comparison of lower extremity motor score parameters for patients with motor incomplete spinal cord injury using gait parameters. Spinal Cord 2011, 49, 529–533. [Google Scholar] [CrossRef]
- Schmid-Zalaudek, K.; Fischer, T.; Száva, Z.; Lackner, H.K.; Kropiunig, U.; Bittner, C.; Höcker, K.; Winkler, G.; Peternell, G. Kinetic Gait Parameters in Unilateral Lower Limb Amputations and Normal Gait in Able-Bodied: Reference Values for Clinical Application. J. Clin. Med. 2022, 11, 2683. [Google Scholar] [CrossRef]
- Fernandez, J. MediaPipe Pose Estimation Documentation. Available online: https://github.com/google/mediapipe/blob/master/docs/solutions/pose.md (accessed on 17 August 2023).
- Chen, Y.; Shen, C.; Wei, X.S.; Liu, L.; Yang, J. Adversarial posenet: A structure-aware convolutional network for human pose estimation. In Proceedings of the IEEE International Conference on Computer Vision, Venice, Italy, 22–29 October 2017; pp. 1212–1221. [Google Scholar]
- Chua, J.; Ong, L.Y.; Leow, M.C. Telehealth using PoseNet-based system for in-home rehabilitation. Future Internet 2021, 13, 173. [Google Scholar] [CrossRef]
- Li, Y.; Wang, C.; Cao, Y.; Liu, B.; Tan, J.; Luo, Y. Human pose estimation based in-home lower body rehabilitation system. In Proceedings of the 2020 International Joint Conference on Neural Networks (IJCNN), Glasgow, UK, 19–24 July 2020; pp. 1–8. [Google Scholar]
- Cordella, F.; Di Corato, F.; Zollo, L.; Siciliano, B. A robust hand pose estimation algorithm for hand rehabilitation. In Proceedings of the New Trends in Image Analysis and Processing–ICIAP 2013: ICIAP 2013 International Workshops, Naples, Italy, 9–13 September 2013; pp. 1–10. [Google Scholar]
- Siddiqui, H.U.R.; Younas, F.; Rustam, F.; Flores, E.S.; Ballester, J.B.; Diez, I.d.l.T.; Dudley, S.; Ashraf, I. Enhancing Cricket Performance Analysis with Human Pose Estimation and Machine Learning. Sensors 2023, 23, 6839. [Google Scholar] [CrossRef] [PubMed]
- Devanandan, M.; Rasaratnam, V.; Anbalagan, M.K.; Asokan, N.; Panchendrarajan, R.; Tharmaseelan, J. Cricket Shot Image Classification Using Random Forest. In Proceedings of the 2021 3rd International Conference on Advancements in Computing (ICAC), Colombo, Sri Lanka, 9–11 December 2021; pp. 425–430. [Google Scholar]
- Kotti, M.; Duffell, L.D.; Faisal, A.A.; McGregor, A.H. Detecting knee osteoarthritis and its discriminating parameters using random forests. Med. Eng. Phys. 2017, 43, 19–29. [Google Scholar] [CrossRef]
- Cui, X.; Zhao, Z.; Ma, C.; Chen, F.; Liao, H. A gait character analyzing system for osteoarthritis pre-diagnosis using RGB-D camera and supervised classifier. In Proceedings of the World Congress on Medical Physics and Biomedical Engineering 2018, Prague, Czech Republic, 3–8 June 2018; Springer: Berlin/Heidelberg, Germany, 2019; Volume 1, pp. 297–301. [Google Scholar]
- Verlekar, T.T.; Soares, L.D.; Correia, P.L. Automatic classification of gait impairments using a markerless 2D video-based system. Sensors 2018, 18, 2743. [Google Scholar] [CrossRef] [PubMed]
- Chen, F.; Cui, X.; Zhao, Z.; Zhang, D.; Ma, C.; Zhang, X.; Liao, H. Gait acquisition and analysis system for osteoarthritis based on hybrid prediction model. Comput. Med Imaging Graph. 2020, 85, 101782. [Google Scholar] [CrossRef]
- Jun, K.; Lee, S.; Lee, D.W.; Kim, M.S. Deep learning-based multimodal abnormal gait classification using a 3D skeleton and plantar foot pressure. IEEE Access 2021, 9, 161576–161589. [Google Scholar] [CrossRef]
- Kwon, S.B.; Han, H.S.; Lee, M.C.; Kim, H.C.; Ku, Y. Machine learning-based automatic classification of knee osteoarthritis severity using gait data and radiographic images. IEEE Access 2020, 8, 120597–120603. [Google Scholar] [CrossRef]
- Chopra, S.; Crevoisier, X. Preoperative gait asymmetry in end-stage unilateral ankle osteoarthrosis patients. Foot Ankle Surg. 2019, 25, 298–302. [Google Scholar] [CrossRef]
- Slijepcevic, D.; Zeppelzauer, M.; Gorgas, A.M.; Schwab, C.; Schüller, M.; Baca, A.; Breiteneder, C.; Horsak, B. Automatic classification of functional gait disorders. IEEE J. Biomed. Health Inform. 2017, 22, 1653–1661. [Google Scholar] [CrossRef]
- Shuzan, M.N.I.; Chowdhury, M.E.; Reaz, M.B.I.; Khandakar, A.; Abir, F.F.; Faisal, M.A.A.; Ali, S.H.M.; Bakar, A.A.A.; Chowdhury, M.H.; Mahbub, Z.B.; et al. Machine learning-based classification of healthy and impaired gaits using 3D-GRF signals. Biomed. Signal Process. Control 2023, 81, 104448. [Google Scholar] [CrossRef]
- Zeng, W.; Ma, L.; Zhang, Y. Detection of knee osteoarthritis based on recurrence quantification analysis, fuzzy entropy and shallow classifiers. Multimed. Tools Appl. 2023, 1–22. [Google Scholar] [CrossRef]
- Jupyter Notebook. Available online: https://jupyter.org/ (accessed on 17 August 2023).
- scikit-learn. Available online: https://scikit-learn.org/stable/index.html (accessed on 17 August 2023).
- Pandas. Available online: https://pandas.pydata.org/ (accessed on 17 August 2023).
- 2K QHD Webcam. Available online: https://hiievpu.us/products/2k-qhd-webcam?pr_prod_strat=copurchase_transfer_learning&pr_rec_id=39d1bbc4a&pr_rec_pid=7619743645942&pr_ref_pid=7619750461686&pr_seq=uniform (accessed on 17 August 2023).
- Fei, K.; Wang, C.; Zhang, J.; Liu, Y.; Xie, X.; Tu, Z. Flow-pose Net: An effective two-stream network for fall detection. Vis. Comput. 2022, 39, 2305–2320. [Google Scholar] [CrossRef]
- MediaPipe Solutions Guide. Available online: https://developers.google.com/mediapipe/solutions/guide (accessed on 17 August 2023).
- Meyns, P. Comment: Difference between assessment of upper limb movement and upper limb associated reactions during walking. J. NeuroEng. Rehabil. 2021, 18, 47. [Google Scholar] [CrossRef] [PubMed]
- Stephenson, J.L.; Lamontagne, A.; De Serres, S.J. The coordination of upper and lower limb movements during gait in healthy and stroke individuals. Gait Posture 2009, 29, 11–16. [Google Scholar] [CrossRef] [PubMed]
- Bruijn, S.M.; Meijer, O.G.; Beek, P.J.; Van Dieen, J.H. The effects of arm swing on human gait stability. J. Exp. Biol. 2010, 213, 3945–3952. [Google Scholar] [CrossRef]
- Ferraris, C.; Amprimo, G.; Masi, G.; Vismara, L.; Cremascoli, R.; Sinagra, S.; Pettiti, G.; Mauro, A.; Priano, L. Evaluation of Arm Swing Features and Asymmetry during Gait in Parkinson’s Disease Using the Azure Kinect Sensor. Sensors 2022, 22, 6282. [Google Scholar] [CrossRef]
- Hill, A.; Nantel, J. The effects of arm swing amplitude and lower-limb asymmetry on gait stability. PLoS ONE 2019, 14, e0218644. [Google Scholar] [CrossRef]
- Sharma, V. A Study on Data Scaling Methods for Machine Learning. Int. J. Glob. Acad. Sci. Res. 2022, 1, 23–33. [Google Scholar] [CrossRef]
- Ivosev, G.; Burton, L.; Bonner, R. Dimensionality reduction and visualization in principal component analysis. Anal. Chem. 2008, 80, 4933–4944. [Google Scholar] [CrossRef]
- Ahsan, M.M.; Luna, S.A.; Siddique, Z. Machine-learning-based disease diagnosis: A comprehensive review. Healthcare 2022, 10, 541. [Google Scholar] [CrossRef]
- George, A.; Ravindran, A.; Mendieta, M.; Tabkhi, H. Mez: An adaptive messaging system for latency-sensitive multi-camera machine vision at the iot edge. IEEE Access 2021, 9, 21457–21473. [Google Scholar] [CrossRef]
- Mendieta, M.; Neff, C.; Lingerfelt, D.; Beam, C.; George, A.; Rogers, S.; Ravindran, A.; Tabkhi, H. A novel application/infrastructure co-design approach for real-time edge video analytics. In Proceedings of the 2019 SoutheastCon, Huntsville, AL, USA, 11–14 April 2019; pp. 1–7. [Google Scholar]
- Sharma, A.; Jain, A.; Gupta, P.; Chowdary, V. Machine learning applications for precision agriculture: A comprehensive review. IEEE Access 2020, 9, 4843–4873. [Google Scholar] [CrossRef]
- Shafique, R.; Aljedaani, W.; Rustam, F.; Lee, E.; Mehmood, A.; Choi, G.S. Role of Artificial Intelligence in Online Education: A Systematic Mapping Study. IEEE Access 2023, 11, 52570–52584. [Google Scholar] [CrossRef]
- Brownlee, J. A Gentle Introduction to k-Fold Cross-Validation. 2020. Available online: https://machinelearningmastery.com/k-fold-cross-validation/ (accessed on 17 August 2023).

| Classifier | Hyperparameters |
|---|---|
| RF | random_state=100, max_depth=50, n_estimators=100 |
| ETC | n_estimators=100, max_depth=200, random_state=0 |
| Adaboost | ExtraTreesClassifier(n_estimators=100, max_depth=200, random_state=0) |
| KNN | algorithm=‘auto’, leaf_size=50, metric=‘minkowski’, metric_params=None, n_jobs=3, n_neighbors=4, weights=‘uniform’ |
| MLP | random_state=142, max_iter=100 |
| ANN | Dense (1024, activation=‘relu’), Dense (512, activation=‘relu’), Dense (256, activation=‘relu’), Dense (128, activation=‘relu’), optimizer=‘adam’, loss=‘categorical_crossentropy’, metrics=[‘accuracy’] |
| CNN | Conv1D (32, 3, activation=‘relu’), MaxPooling1D (2), Conv1D (64, 3, activation=‘relu’) MaxPooling1D (2), Flatten (), Dense (128, activation=‘relu’), Dense (num_classes, activation=‘softmax’), optimizer=‘adam’, loss=‘categorical_crossentropy’, metrics=[‘accuracy’] |
| Classifier | Accuracy (%) | Precision | Recall | F1-Score | K-Fold Cross- Validation Score |
|---|---|---|---|---|---|
| RF | 94 | 0.96 | 0.91 | 0.93 | 0.97 ± 0.00 |
| ETC | 93.44 | 0.96 | 0.91 | 0.93 | 0.98 ± 0.00 |
| KNN | 95.76 | 0.96 | 0.95 | 0.96 | 0.98 ± 0.00 |
| Adaboost | 93.06 | 0.95 | 0.90 | 0.92 | 0.98 ± 0.00 |
| MLP | 97.88 | 0.98 | 0.98 | 0.98 | 0.95 ± 0.00 |
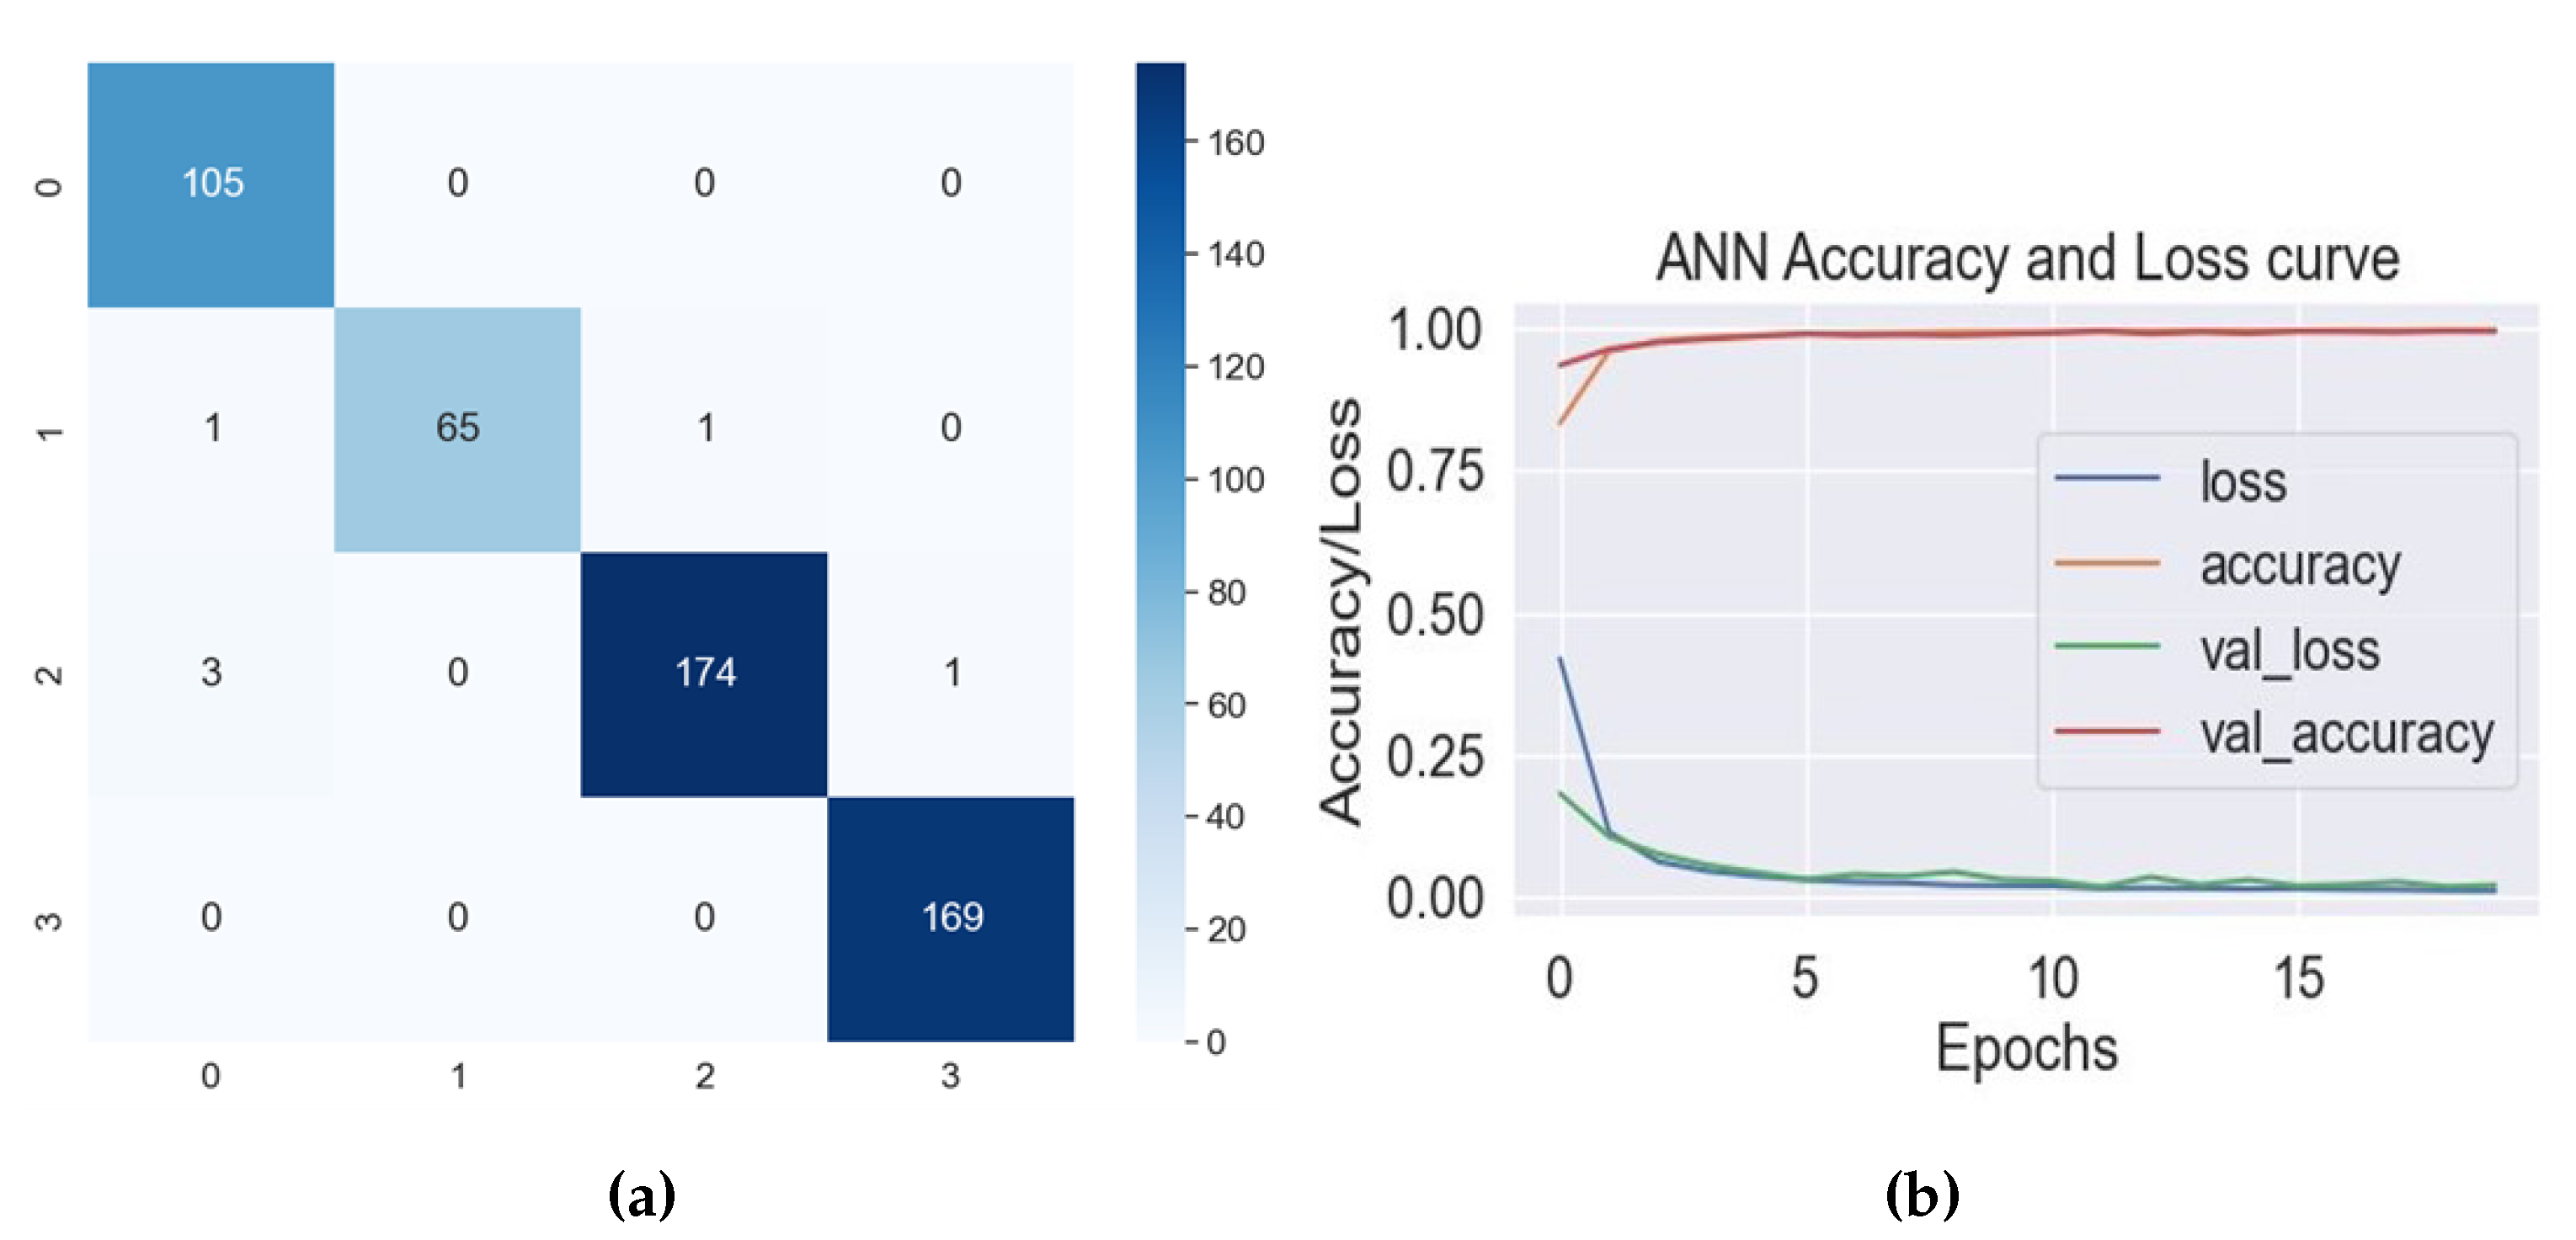
| ANN | 98.84 | 0.99 | 0.99 | 0.99 | 0.99 ± 0.02 |
| CNN | 98.84 | 0.99 | 0.99 | 0.99 | 0.97 ± 0.10 |
| Class | Precision | Recall | F1-Score |
|---|---|---|---|
| Ankle | 0.96 | 1.00 | 0.98 |
| Hip | 1.00 | 0.97 | 0.98 |
| Knee | 0.99 | 0.98 | 0.99 |
| Normal | 0.99 | 1.00 | 1.00 |
| Classifier | Computational Time Complexity (s) |
|---|---|
| RF | 364 |
| ETC | 102 |
| KNN | 155 |
| Adaboost | 462 |
| MLP | 128 |
| ANN | 500 |
| CNN | 712 |
| Study Reference | Focus | Accuracy/Results |
|---|---|---|
| [35] | Automated detection of knee osteoarthritis | Mean accuracy: 72.61% |
| [36] | Assessment and diagnosis of gait abnormalities in osteoarthritis | Average accuracy: 97% |
| [37] | Automated detection and classification of gait abnormalities using a 2D video camera | Accuracy: 98.8% |
| [38] | Cost-effective system for acquiring and analyzing gait data in osteoarthritis | Accuracy: 98.77% |
| [39] | Classification of atypical gait patterns using 3D skeletal data and foot pressure measurements | Accuracy: 97.60% |
| [40] | Automated categorization framework for knee osteoarthritis using radiographic imaging and gait analysis data | AUC values range from 0.82 to 0.97 |
| [44] | Diagnostic system for knee osteoarthritis using dynamical gait features | SVM classifier accuracy: 92.31% (KOAs vs. controls), 100% (healthy controls) |
| Proposed Study | Classification of lower limb disorders using PoseNet features extracted from video data | ANN accuracy: 98.8%, CV score: 99% (std. dev.: 0.02) |
Disclaimer/Publisher’s Note: The statements, opinions and data contained in all publications are solely those of the individual author(s) and contributor(s) and not of MDPI and/or the editor(s). MDPI and/or the editor(s) disclaim responsibility for any injury to people or property resulting from any ideas, methods, instructions or products referred to in the content. |
© 2023 by the authors. Licensee MDPI, Basel, Switzerland. This article is an open access article distributed under the terms and conditions of the Creative Commons Attribution (CC BY) license (https://creativecommons.org/licenses/by/4.0/).
Share and Cite
Siddiqui, H.U.R.; Saleem, A.A.; Raza, M.A.; Villar, S.G.; Lopez, L.A.D.; Diez, I.d.l.T.; Rustam, F.; Dudley, S. Empowering Lower Limb Disorder Identification through PoseNet and Artificial Intelligence. Diagnostics 2023, 13, 2881. https://doi.org/10.3390/diagnostics13182881
Siddiqui HUR, Saleem AA, Raza MA, Villar SG, Lopez LAD, Diez IdlT, Rustam F, Dudley S. Empowering Lower Limb Disorder Identification through PoseNet and Artificial Intelligence. Diagnostics. 2023; 13(18):2881. https://doi.org/10.3390/diagnostics13182881
Chicago/Turabian StyleSiddiqui, Hafeez Ur Rehman, Adil Ali Saleem, Muhammad Amjad Raza, Santos Gracia Villar, Luis Alonso Dzul Lopez, Isabel de la Torre Diez, Furqan Rustam, and Sandra Dudley. 2023. "Empowering Lower Limb Disorder Identification through PoseNet and Artificial Intelligence" Diagnostics 13, no. 18: 2881. https://doi.org/10.3390/diagnostics13182881
APA StyleSiddiqui, H. U. R., Saleem, A. A., Raza, M. A., Villar, S. G., Lopez, L. A. D., Diez, I. d. l. T., Rustam, F., & Dudley, S. (2023). Empowering Lower Limb Disorder Identification through PoseNet and Artificial Intelligence. Diagnostics, 13(18), 2881. https://doi.org/10.3390/diagnostics13182881