

An Improved Multimodal Medical Image Fusion Approach Using Intuitionistic Fuzzy Set and Intuitionistic Fuzzy Cross-Correlation


Abstract
1. Introduction
2. Related Works
- A novel intuitionistic fuzzy set is used for the fusion process, which can enhance the fused image quality and complete the fusion process successfully.
- The intuitionistic fuzzy images are created by using the optimum value, α, which can be obtained from intuitionistic fuzzy entropy.
- The Intuitionistic cross-correlation function is employed to measure the correlation between intuitionistic fuzzy images and then produce a fused image without uncertainty and vagueness.
- The proposed fusion algorithm proves that the fused image has good contrast and enhanced edges and is superior to other existing methods both visually and quantitatively.
3. Materials and Methods
3.1. Intuitionistic Fuzzy Generator
3.2. Proposed Fuzzy Complement and Intuitionistic Fuzzy Generator
- (i)
- P1: Boundary conditions:
- (ii)
- P2: Monotonicity
- (iii)
- P3: Involution
3.3. Intuitionistic Fuzzy Cross-Correlation (IFCC)
4. Proposed Fusion Method
4.1. Grayscale Image Fusion Algorithm
- Read the registered input images and .
- Initially, the first input image is fuzzified by using Equation (18):
- 3.
- Compute the optimum value, for first input image by using IFE, which is given in Equations (14) and (15).
- 4.
- With the help of the optimized value, , calculate the fuzzified new IFI (NIFI) for the first input image by using Equations (19)–(22), which can be represented as .
- 5.
- Similarly, for the second input image, repeat from step 2 to step 4 to obtain the optimum value, , used to calculate NIFI ():
- 6.
- Decompose the two NIFI images ( and ) into small blocks and the kth block of two decomposed images are represented as and , respectively.
- 7.
- Compute the intuitionistic fuzzy cross-correlation fusion rule between two windows of images ( and ) and the kth block of the fused image is obtained by using minimum, average, and maximum operations:
- 8.
- Reconstruct the fused IFI image by the combined small blocks.
- 9.
- Finally, the fused image can be obtained in the crisp domain by using the defuzzification process, which is obtained by the inverse function of Equation (18).
4.2. Color Image Fusion Algorithm
- Consider MRI and PET/SPECT as input images. The PET/SPECT image is converted into an HSV color model, such as hue (H), saturation (S), and value (V).
- For the fusion process, take the MRI image and V component image, and then perform a grayscale image fusion algorithm from step 2 to step 9 as shown in Section 4.1, to get the fused component (V1).
- Finally, the colored fused image can be obtained by considering the brightness image (V1) and unchanged hue (H) and saturation (S) parts and then converting into the RGB color model.
5. Experimental Results and Discussion
- ➢
- API: API is used to quantify the average intensity values of the fused image i.e., brightness, which can be defined as:
- ➢
- SD: SD is used to represent the amounts of intensity variations—contrast—in an image. It is described as
- ➢
- AG: This metric is used to measure the sharpness degree and clarity, which is represented as:
- ➢
- SF: SF reflects the rate of change in the gray level of the image and also measures the quality of the image. For better performance, the SF value should be high. It can be calculated as follows:
- ➢
- MSF: This metric is used to measure the overall active levels present in the fused image. It can be employed as follows:
- ➢
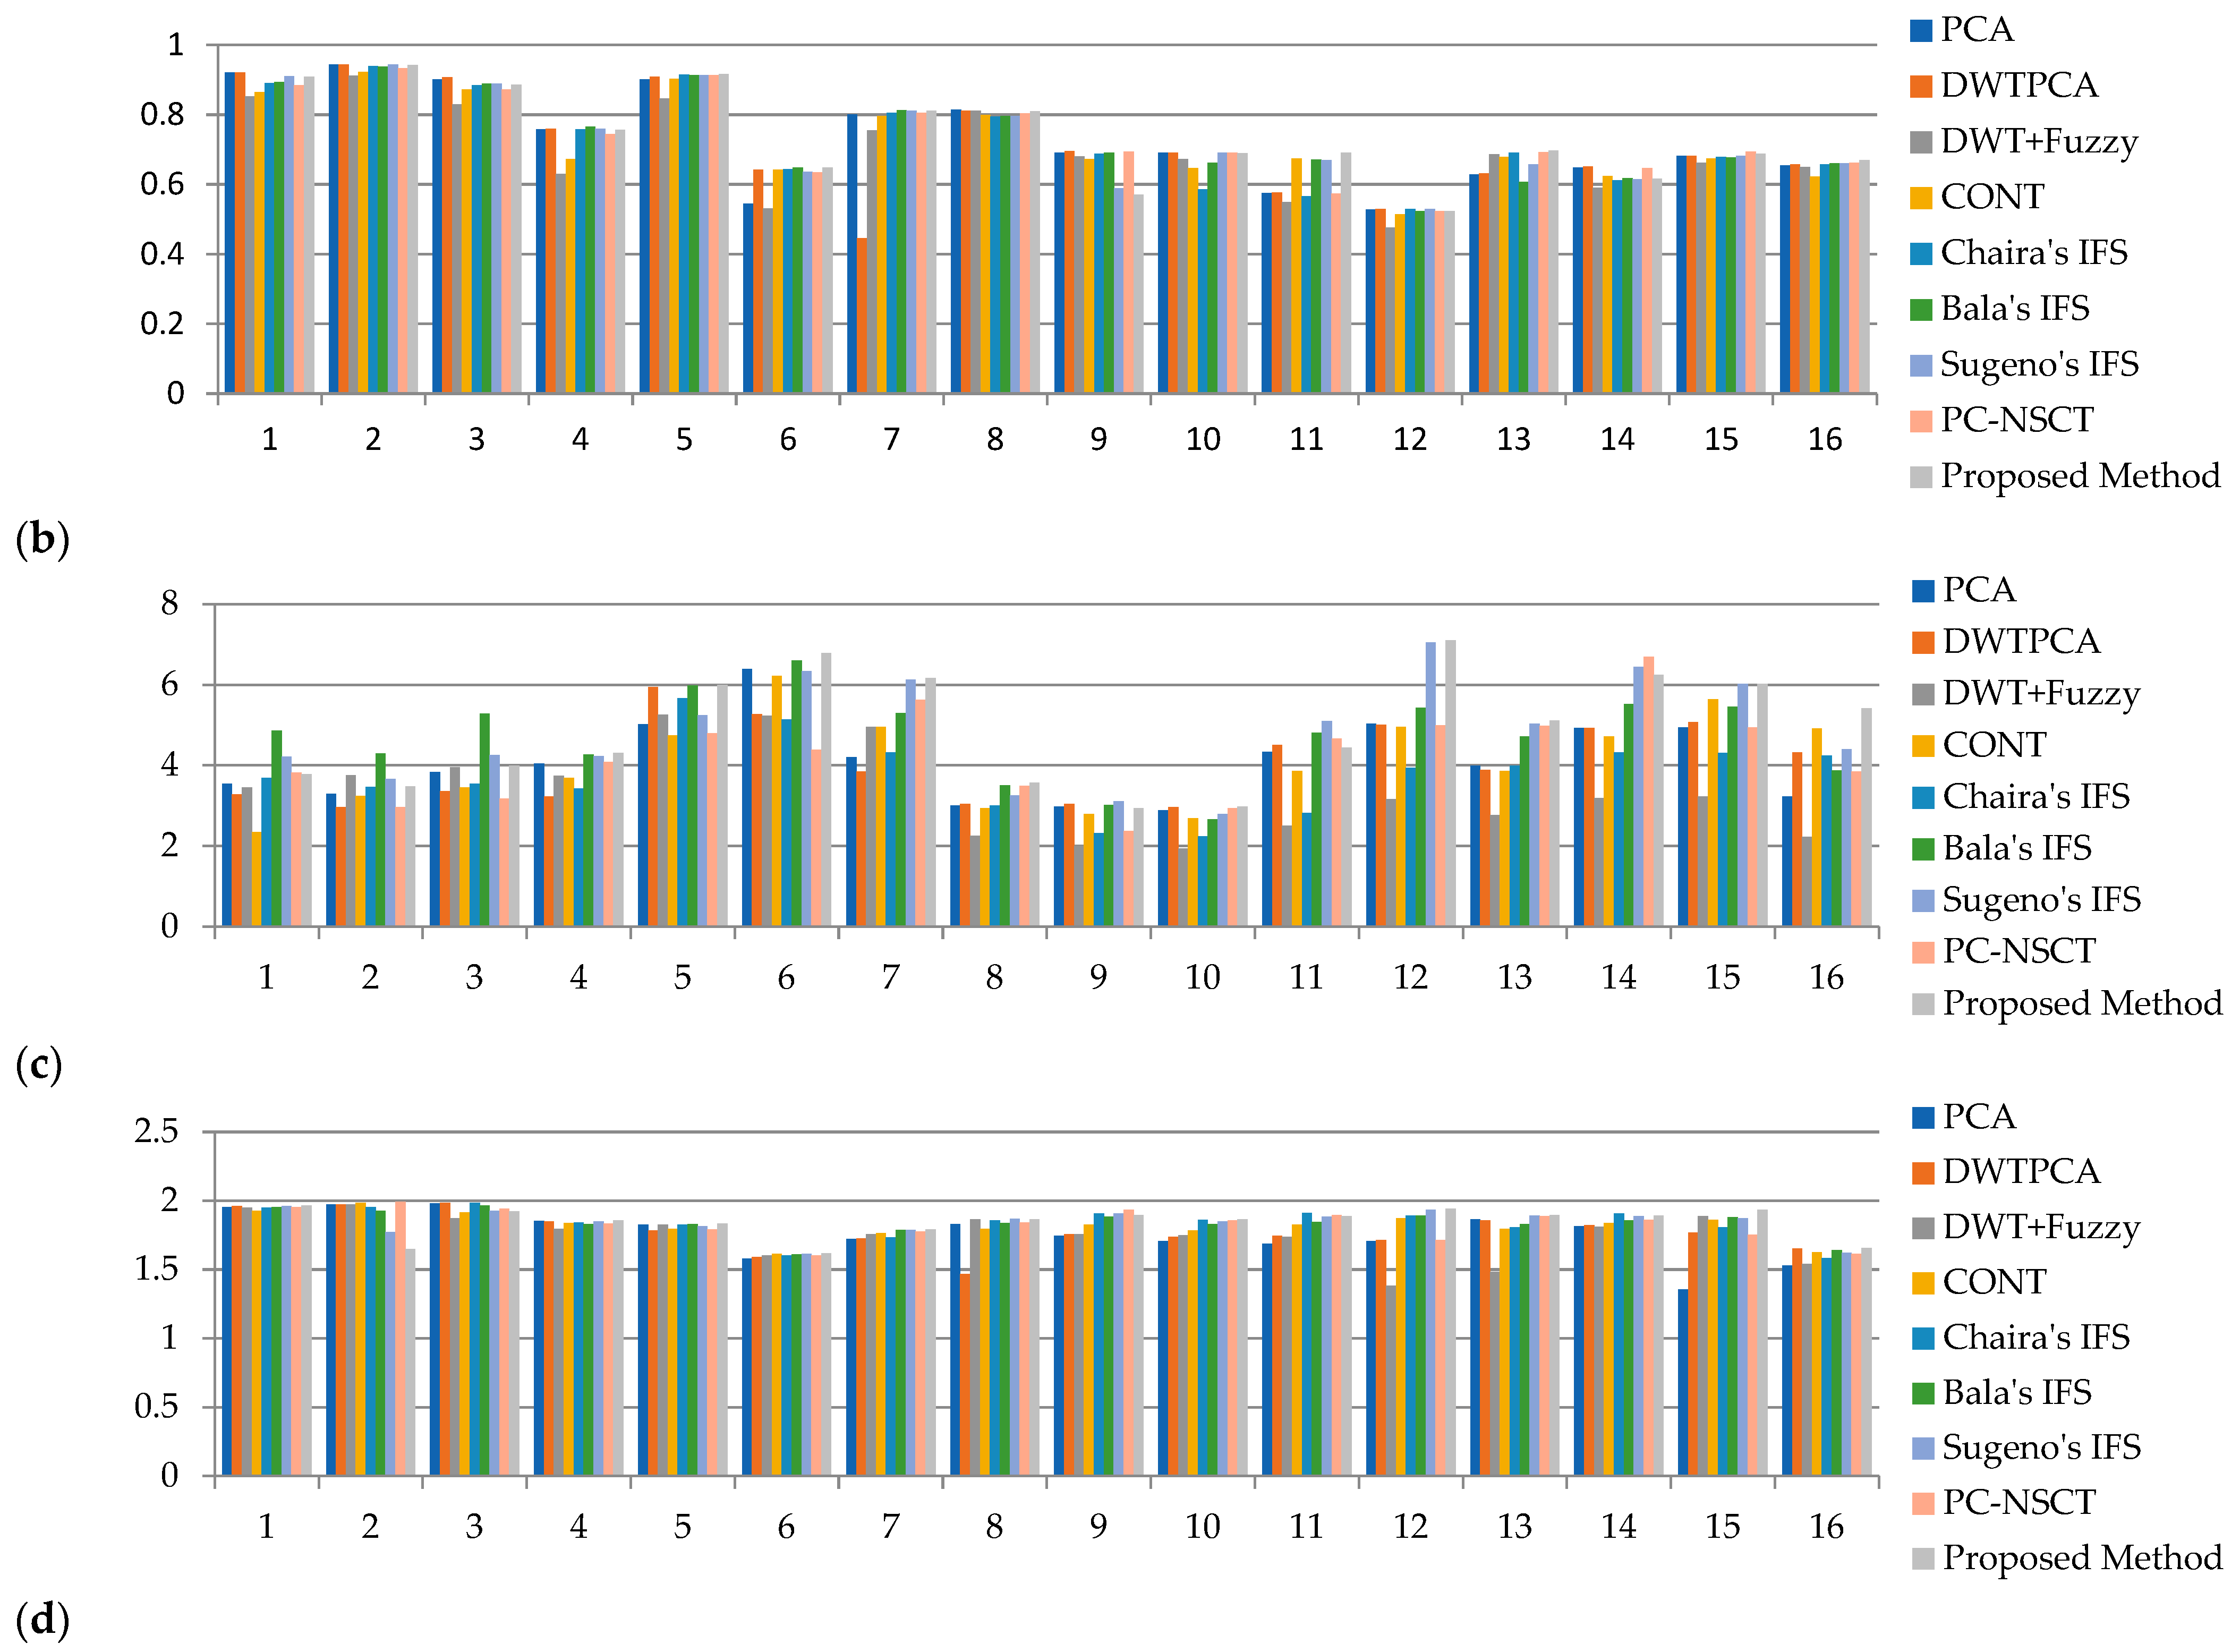
- CC: This metric represents the similarity between the source and fused images. The range of CC is [0–1]. For high similarity, the CC value is 1 and it decreases as the dissimilarity increases. It is represented as follows:
- ➢
- MI: The MI parameter is used to calculate the total information that is transferred to the fused image from input images.
- ➢
- FS: FS is introduced to measure the symmetry of the fused image with respect to the source images. If the value of FS is close to 2, this indicates both input images equally contribute to the fused image. Therefore, the fused image quality will be better.
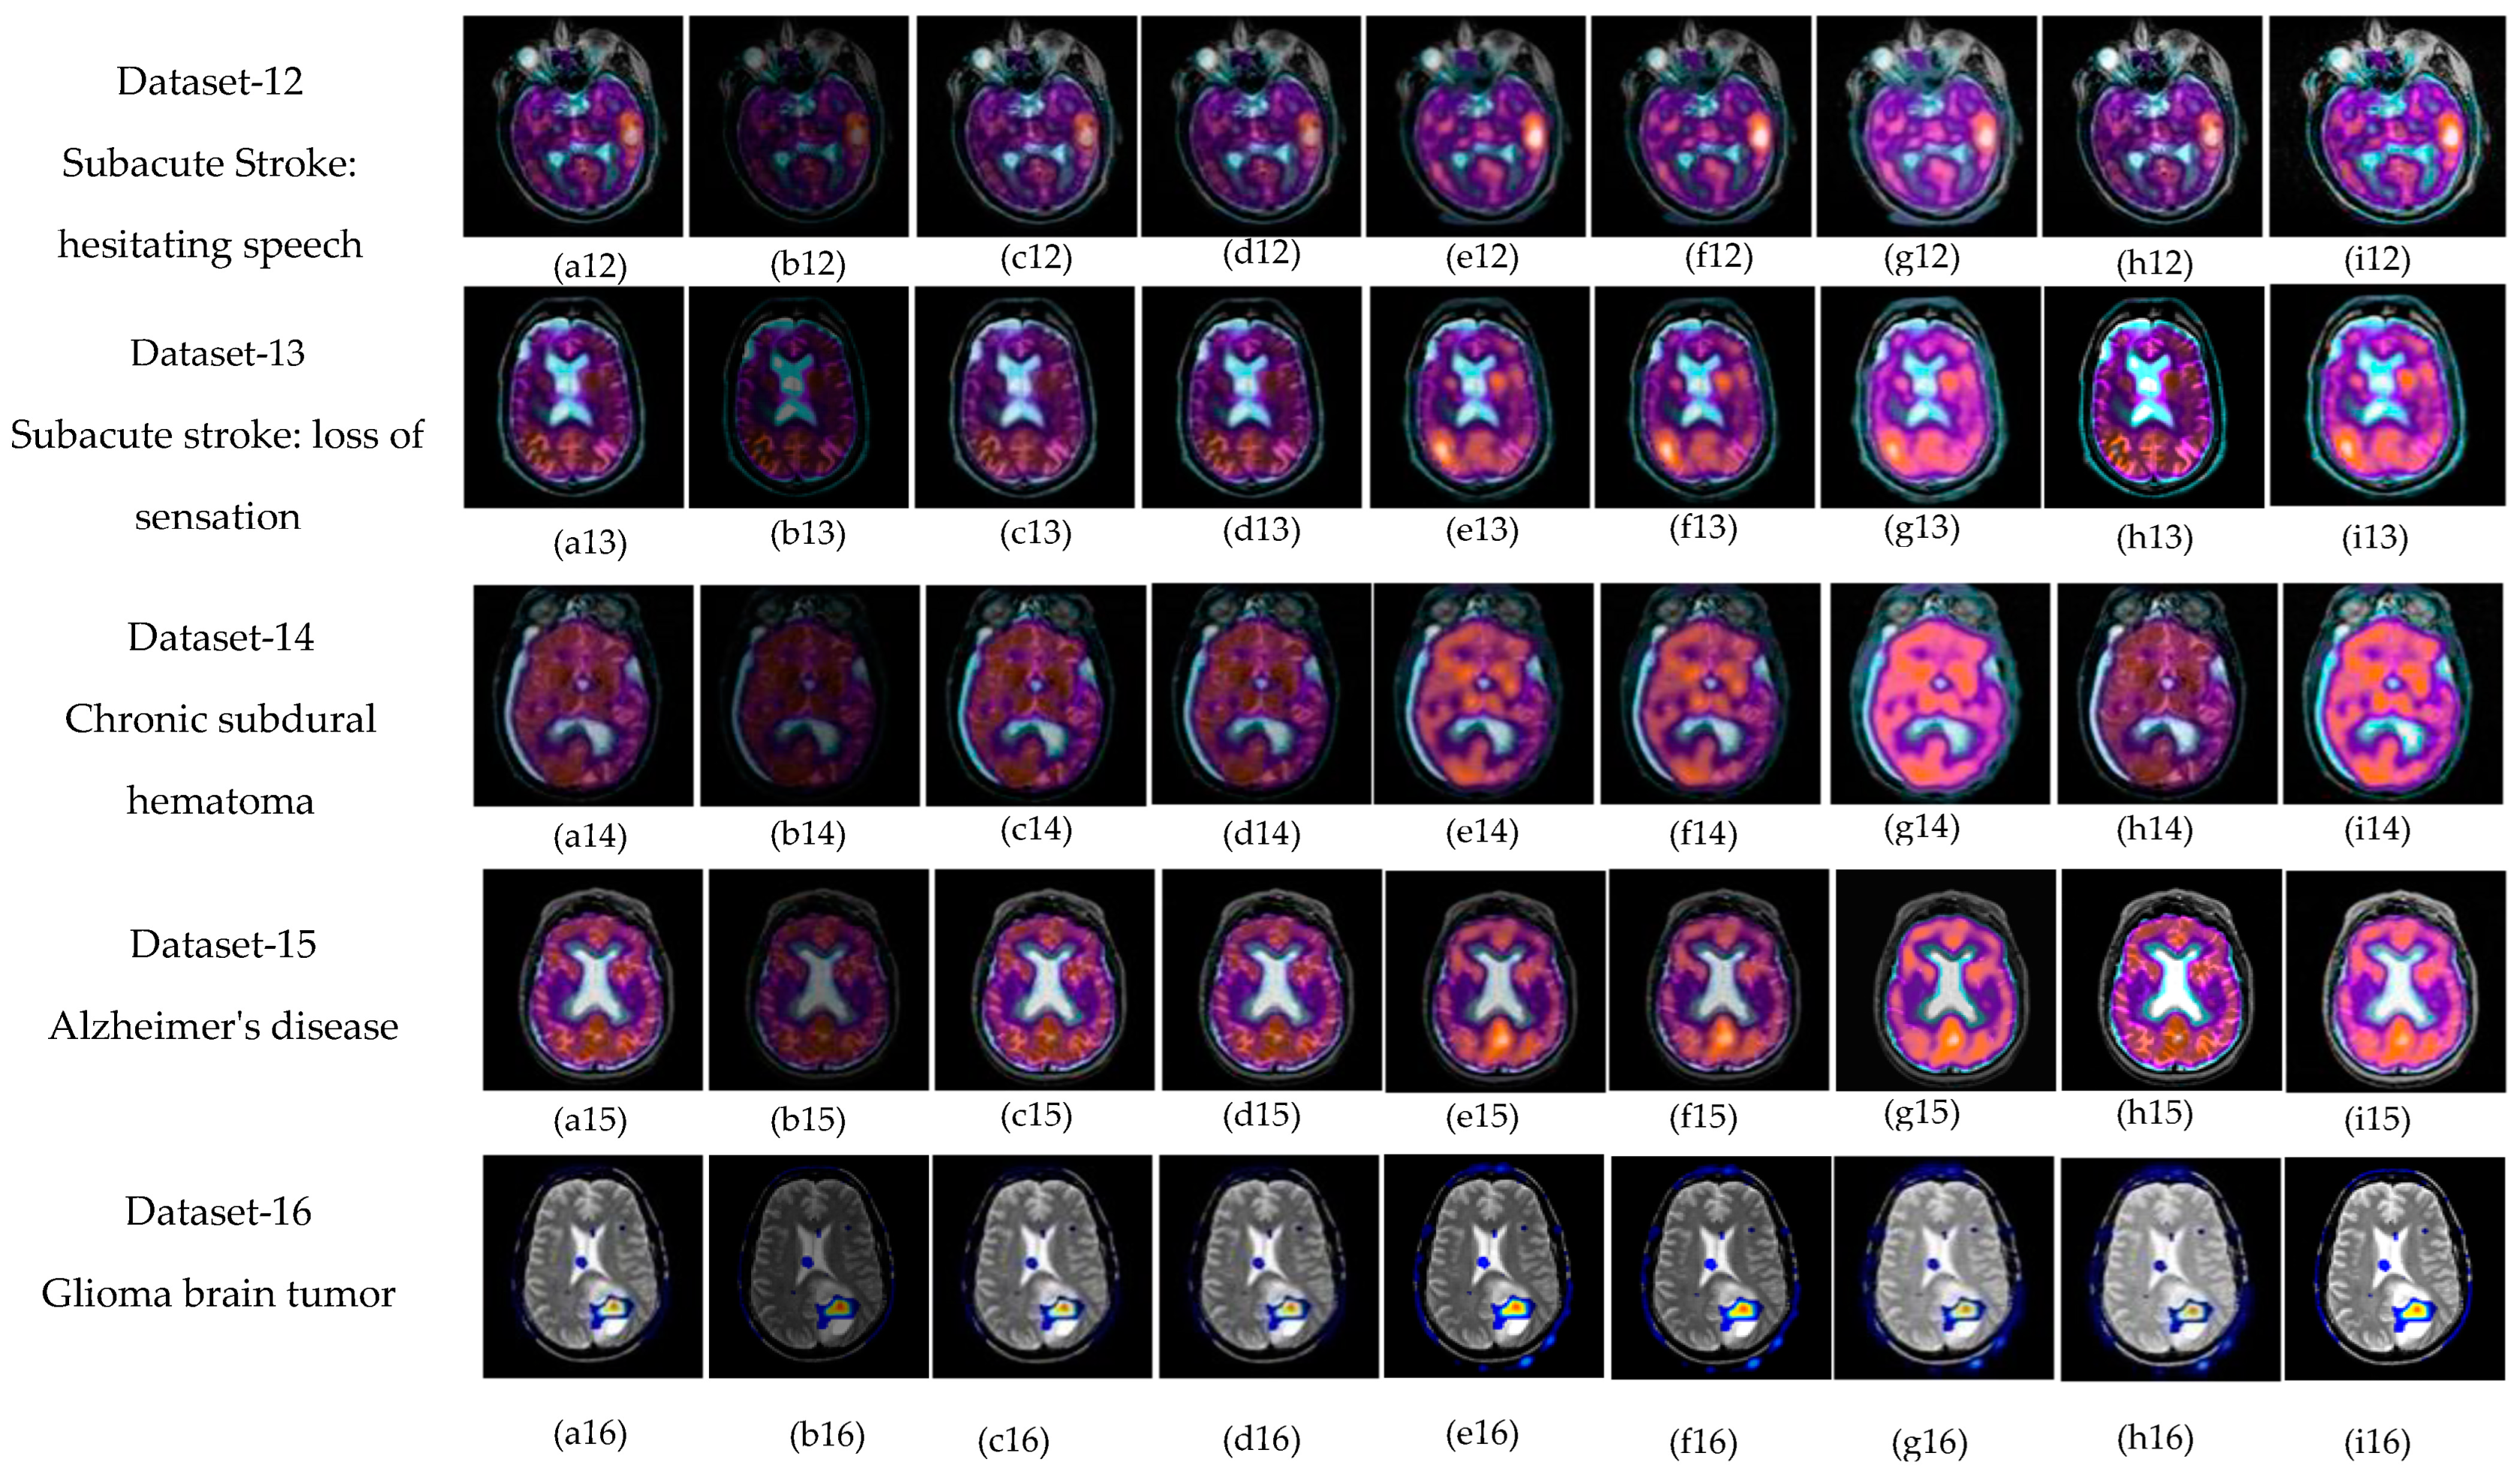
5.1. Subjective-Type Evaluation
5.2. Objective Evaluation
5.3. Ranking Analysis
5.4. Running Time
6. Conclusions
Author Contributions
Funding
Institutional Review Board Statement
Informed Consent Statement
Data Availability Statement
Conflicts of Interest
References
- Azam, M.A.; Khan, K.B.; Salahuddin, S.; Rehman, E.; Khan, S.A.; Khan, M.A.; Kadry, S.; Gandomi, A.H. A Review on Multimodal Medical Image Fusion: Compendious Analysis of Medical Modalities, Multimodal Databases, Fusion Techniques and Quality Metrics. Comput. Biol. Med. 2022, 144, 105253. [Google Scholar] [CrossRef]
- Ma, J.; Liu, Y.; Jiang, J.; Wang, Z.; Xu, H.; Huo, X.; Deng, Y.; Shao, K. Infrared and Visible Image Fusion with Significant Target Enhancement. Entropy 2022, 24, 1633. [Google Scholar]
- Deveci, M.; Gokasar, I.; Pamucar, D.; Zaidan, A.A.; Wen, X.; Gupta, B.B. Evaluation of Cooperative Intelligent Transportation System Scenarios for Resilience in Transportation Using Type-2 Neutrosophic Fuzzy VIKOR. Transp. Res. Part A Policy Pract. 2023, 172, 103666. [Google Scholar] [CrossRef]
- Mary, S.R.; Pachar, S.; Srivastava, P.K.; Malik, M.; Sharma, A.; Almutiri, G.T.; Atal, Z. Deep Learning Model for the Image Fusion and Accurate Classification of Remote Sensing Images. Comput. Intell. Neurosci. 2022, 2022, 2668567. [Google Scholar] [CrossRef] [PubMed]
- James, A.P.; Dasarathy, B.V. Medical Image Fusion: A Survey of the State of the Art. Inf. Fusion 2014, 19, 4–19. [Google Scholar] [CrossRef]
- Kumar, M.; Kaur, A. Amita Improved Image Fusion of Colored and Grayscale Medical Images Based on Intuitionistic Fuzzy Sets. Fuzzy Inf. Eng. 2018, 10, 295–306. [Google Scholar] [CrossRef]
- Venkatesan, B.; Ragupathy, U.S.; Natarajan, I. A Review on Multimodal Medical Image Fusion towards Future Research. Multimed. Tools Appl. 2023, 82, 7361–73824. [Google Scholar] [CrossRef]
- Palanisami, D.; Mohan, N.; Ganeshkumar, L. A New Approach of Multi-Modal Medical Image Fusion Using Intuitionistic Fuzzy Set. Biomed. Signal Process. Control 2022, 77, 103762. [Google Scholar] [CrossRef]
- Prakash, O.; Park, C.M.; Khare, A.; Jeon, M.; Gwak, J. Multiscale Fusion of Multimodal Medical Images Using Lifting Scheme Based Biorthogonal Wavelet Transform. Optik 2019, 182, 995–1014. [Google Scholar] [CrossRef]
- Kumar, P.; Diwakar, M. A Novel Approach for Multimodality Medical Image Fusion over Secure Environment. Trans. Emerg. Telecommun. Technol. 2021, 32, e3985. [Google Scholar] [CrossRef]
- Dilmaghani, M.S.; Daneshvar, S.; Dousty, M. A New MRI and PET Image Fusion Algorithm Based on BEMD and IHS Methods. In Proceedings of the 2017 Iranian Conference on Electrical Engineering (ICEE), Tehran, Iran, 2–4 May 2017; pp. 118–121. [Google Scholar]
- Panigrahy, C.; Seal, A.; Mahato, N.K. MRI and SPECT Image Fusion Using a Weighted Parameter Adaptive Dual Channel PCNN. IEEE Signal Process. Lett. 2020, 27, 690–694. [Google Scholar] [CrossRef]
- Kaur, H.; Koundal, D.; Kadyan, V. Image Fusion Techniques: A Survey. Arch. Comput. Methods Eng. 2021, 28, 4425–4447. [Google Scholar] [CrossRef] [PubMed]
- Wang, Z.; Ziou, D.; Armenakis, C.; Li, D.; Li, Q. A Comparative Analysis of Image Fusion Methods. IEEE Trans. Geosci. Remote Sens. 2005, 43, 1391–1402. [Google Scholar] [CrossRef]
- He, C.; Liu, Q.; Li, H.; Wang, H. Multimodal Medical Image Fusion Based on IHS and PCA. Procedia Eng. 2010, 7, 280–285. [Google Scholar] [CrossRef]
- Li, M.; Dong, Y. Image Fusion Algorithm Based on Contrast Pyramid and Application. In Proceedings of the 2013 International Conference on Mechatronic Sciences, Electric Engineering and Computer (MEC), Shenyang, China, 20–22 December 2013; pp. 1342–1345. [Google Scholar]
- Tang, J. A Contrast Based Image Fusion Technique in the DCT Domain. Digit. Signal Process. 2004, 14, 218–226. [Google Scholar] [CrossRef]
- Liang, J.; He, Y.; Liu, D.; Zeng, X. Image Fusion Using Higher Order Singular Value Decomposition. IEEE Trans. Image Process. 2012, 21, 2898–2909. [Google Scholar] [CrossRef] [PubMed]
- Prasad, P.; Subramani, S.; Bhavana, V.; Krishnappa, H.K. Medical Image Fusion Techniques Using Discrete Wavelet Transform. In Proceedings of the 2019 3rd International Conference on Computing Methodologies and Communication (ICCMC), Erode, India, 27–29 March 2019; pp. 614–618. [Google Scholar]
- Li, X.; He, M.; Roux, M. Multifocus Image Fusion Based on Redundant Wavelet Transform. IET Image Process. 2010, 4, 283. [Google Scholar] [CrossRef]
- Khare, A.; Srivastava, R.; Singh, R. Edge Preserving Image Fusion Based on Contourlet Transform. In Proceedings of the Image and Signal Processing: 5th International Conference, ICISP 2012, Agadir, Morocco, 28–30 June 2012; Volume 7340, pp. 93–102. [Google Scholar]
- Sinhal, R.; Sharma, S.; Ansari, I.A.; Bajaj, V. Multipurpose Medical Image Watermarking for Effective Security Solutions. Multimed. Tools Appl. 2022, 81, 14045–14063. [Google Scholar] [CrossRef]
- Liu, M.; Mei, S.; Liu, P.; Gasimov, Y.; Cattani, C. A New X-Ray Medical-Image-Enhancement Method Based on Multiscale Shannon–Cosine Wavelet. Entropy 2022, 24, 1754. [Google Scholar]
- Liu, S.; Wang, M.; Yin, L.; Sun, X.; Zhang, Y.-D.; Zhao, J. Two-Scale Multimodal Medical Image Fusion Based on Structure Preservation. Front. Comput. Neurosci. 2022, 15, 133. [Google Scholar] [CrossRef]
- Chen, X.; Wan, Y.; Wang, D.; Wang, Y. Image Deblurring Based on an Improved CNN-Transformer Combination Network. Appl. Sci. 2023, 13, 311. [Google Scholar] [CrossRef]
- Ganasala, P.; Kumar, V. CT and MR Image Fusion Scheme in Nonsubsampled Contourlet Transform Domain. J. Digit. Imaging 2014, 27, 407–418. [Google Scholar] [CrossRef] [PubMed]
- Qiu, C.; Wang, Y.; Zhang, H.; Xia, S. Image Fusion of CT and MR with Sparse Representation in NSST Domain. Comput. Math. Methods Med. 2017, 2017, 9308745. [Google Scholar] [CrossRef] [PubMed]
- Liu, X.; Mei, W.; Du, H. Multi-Modality Medical Image Fusion Based on Image Decomposition Framework and Nonsubsampled Shearlet Transform. Biomed. Signal Process. Control 2018, 40, 343–350. [Google Scholar] [CrossRef]
- Sanjay, A.R.; Soundrapandiyan, R.; Karuppiah, M.; Ganapathy, R. CT and MRI Image Fusion Based on Discrete Wavelet Transform and Type-2 Fuzzy Logic. Int. J. Intell. Eng. Syst. 2017, 10, 355–362. [Google Scholar] [CrossRef]
- Cao, G.; Huang, L.; Tian, H.; Huang, X.; Wang, Y.; Zhi, R. Contrast Enhancement of Brightness-Distorted Images by Improved Adaptive Gamma Correction. Comput. Electr. Eng. 2018, 66, 569–582. [Google Scholar] [CrossRef]
- Salem, N.; Malik, H.; Shams, A. Medical Image Enhancement Based on Histogram Algorithms. Procedia Comput. Sci. 2019, 163, 300–311. [Google Scholar] [CrossRef]
- Zadeh, L.A. Fuzzy Sets. Inf. Control 1965, 8, 338–353. [Google Scholar] [CrossRef]
- Atanassov, K.T. Intuitionistic Fuzzy Sets. Fuzzy Sets Syst. 1986, 20, 87–96. [Google Scholar] [CrossRef]
- Güneri, B.; Deveci, M. Evaluation of Supplier Selection in the Defense Industry Using Q-Rung Orthopair Fuzzy Set Based EDAS Approach. Expert Syst. Appl. 2023, 222, 119846. [Google Scholar] [CrossRef]
- Szmidt, E.; Kacprzyk, J. Distances between Intuitionistic Fuzzy Sets. Fuzzy Sets Syst. 2000, 114, 505–518. [Google Scholar] [CrossRef]
- Chaira, T. A Novel Intuitionistic Fuzzy C Means Clustering Algorithm and Its Application to Medical Images. Appl. Soft Comput. 2011, 11, 1711–1717. [Google Scholar] [CrossRef]
- Huang, H.L.; Guo, Y. An Improved Correlation Coefficient of Intuitionistic Fuzzy Sets. J. Intell. Syst. 2019, 28, 231–243. [Google Scholar] [CrossRef]
- Bustince, H.; Kacprzyk, J.; Mohedano, V. Intuitionistic Fuzzy Generators Application to Intuitionistic Fuzzy Complementation. Fuzzy Sets Syst. 2000, 114, 485–504. [Google Scholar] [CrossRef]
- Sugeno, M. Fuzzy measures and fuzzy integrals—A survey. In Readings in Fuzzy Sets for Intelligent Systems; Elsevier: Amsterdam, The Netherlands, 1993; pp. 251–257. [Google Scholar]
- Roychowdhury, S.; Wang, B.H. Composite Generalization of Dombi Class and a New Family of T-Operators Using Additive-Product Connective Generator. Fuzzy Sets Syst. 1994, 66, 329–346. [Google Scholar] [CrossRef]
- De Luca, A.; Termini, S. A Definition of a Nonprobabilistic Entropy in the Setting of Fuzzy Sets Theory. Inf. Control 1972, 20, 301–312. [Google Scholar] [CrossRef]
- Joshi, D.; Kumar, S. Intuitionistic Fuzzy Entropy and Distance Measure Based TOPSIS Method for Multi-Criteria Decision Making. Egypt. Inform. J. 2014, 15, 97–104. [Google Scholar] [CrossRef]
- Hung, W.L.; Yang, M.S. Fuzzy Entropy on Intuitionistic Fuzzy Sets. Int. J. Intell. Syst. 2006, 21, 443–451. [Google Scholar] [CrossRef]
- Brain Image. Available online: http://www.metapix.de/examples.html (accessed on 3 February 2020).
- The Whole Brain Atlas. Available online: https://www.med.harvard.edu/aanlib/home.html (accessed on 3 February 2020).
- Bavirisetti, D.P.; Kollu, V.; Gang, X.; Dhuli, R. Fusion of MRI and CT Images Using Guided Image Filter and Image Statistics. Int. J. Imaging Syst. Technol. 2017, 27, 227–237. [Google Scholar] [CrossRef]
- Haddadpour, M.; Daneshavar, S.; Seyedarabi, H. PET and MRI Image Fusion Based on Combination of 2-D Hilbert Transform and IHS Method. Biomed. J. 2017, 40, 219–225. [Google Scholar] [CrossRef]
- Bavirisetti, D.P.; Dhuli, R. Multi-Focus Image Fusion Using Multi-Scale Image Decomposition and Saliency Detection. Ain Shams Eng. J. 2018, 9, 1103–1117. [Google Scholar] [CrossRef]
- Das, S.; Kundu, M.K. NSCT-Based Multimodal Medical Image Fusion Using Pulse-Coupled Neural Network and Modified Spatial Frequency. Med. Biol. Eng. Comput. 2012, 50, 1105–1114. [Google Scholar] [CrossRef]
- Shreyamsha Kumar, B.K. Image Fusion Based on Pixel Significance Using Cross Bilateral Filter. Signal Image Video Process. 2015, 9, 1193–1204. [Google Scholar] [CrossRef]
- Dammavalam, S.R. Quality Assessment of Pixel-Level ImageFusion Using Fuzzy Logic. Int. J. Soft Comput. 2012, 3, 11–23. [Google Scholar] [CrossRef]
- Naidu, V.P.S.; Raol, J.R. Pixel-Level Image Fusion Using Wavelets and Principal Component Analysis. Def. Sci. J. 2008, 58, 338–352. [Google Scholar] [CrossRef]
- Chaira, T. A Rank Ordered Filter for Medical Image Edge Enhancement and Detection Using Intuitionistic Fuzzy Set. Appl. Soft Comput. 2012, 12, 1259–1266. [Google Scholar] [CrossRef]
- Balasubramaniam, P.; Ananthi, V.P. Image Fusion Using Intuitionistic Fuzzy Sets. Inf. Fusion 2014, 20, 21–30. [Google Scholar] [CrossRef]
- Tirupal, T.; Mohan, B.C.; Kumar, S.S. Multimodal Medical Image Fusion Based on Sugeno’s Intuitionistic Fuzzy Sets. ETRI J. 2017, 39, 173–180. [Google Scholar] [CrossRef]
- Zhu, Z.; Zheng, M.; Qi, G.; Wang, D.; Xiang, Y. A Phase Congruency and Local Laplacian Energy Based Multi-Modality Medical Image Fusion Method in NSCT Domain. IEEE Access 2019, 7, 20811–20824. [Google Scholar] [CrossRef]


| Fusion Methods | Modalities | Merits | Demerits |
|---|---|---|---|
| IHS and PCA | MRI-PET | Good spatial features and better color visualization in a fused image. | Low contrast and distorted boundaries. |
| Pyramid | MRI-CT | Preserves better outlines in the fused image. | Due to a lack of spatial orientation selectivity, the unwanted edges and blocking effects exist in the fused image. |
| SVD | MRI-CT | Provides better quality fused image. | Fails to show the clear boundaries of the tumor region. |
| DWT | MRI-CT, MRI-PET | Provides good localization in both time and frequency. | Has more complexity and lack of edges information. |
| CONT | MRI-CT | Fused image has better edges and is superior to DWT and Curvelet transform. | Does not provide the shift invariance, may cause blocking effects |
| NSCT | MRI-CT | Superior to traditional transform techniques in terms of directionality. | Complexity is high. |
| NSST | MRI-CT | Fusion process is superior to NSCT with lower complexity. | Low brightness and contrast due to uncertainties, and high computational time. |
| Medical Image Modality | Fusion Techniques | |||||||||
|---|---|---|---|---|---|---|---|---|---|---|
| Data Sets | PCA | DWTPCA | DWT + Fuzzy | CONT | Chaira’s IFS | Bala’s IFS | Sugeno’s IFS | PC-NSCT | Proposed Method | |
| MR T1–MR T2 | 1 | 48.53 | 48.55 | 47.66 | 61.52 | 55.65 | 56.62 | 67.11 | 52.92 | 70.9 |
| 2 | 40.94 | 40.79 | 43.4 | 49.59 | 44.69 | 45.4 | 54.38 | 43.77 | 57.77 | |
| 3 | 49.77 | 48.83 | 54.58 | 64.85 | 61.23 | 62.3 | 71.51 | 56.63 | 75.53 | |
| 4 | 56.54 | 35.73 | 42.57 | 57.2 | 53.15 | 54.23 | 63.11 | 48.66 | 67.15 | |
| MR-T1–MRA | 5 | 35.5 | 45.87 | 66.38 | 67.85 | 58.82 | 59.34 | 69.92 | 66.38 | 75.38 |
| MRI–CT | 6 | 52.74 | 32.67 | 55.24 | 60.79 | 55.99 | 56.23 | 70.58 | 55.77 | 76.85 |
| 7 | 49.54 | 39.47 | 21.87 | 60.33 | 59.92 | 60.36 | 67.93 | 58.52 | 72.23 | |
| MRI–PET | 8 | 17.86 | 9.01 | 17.92 | 18.16 | 27.29 | 27.96 | 25.85 | 17.89 | 27.17 |
| 9 | 25.81 | 13.01 | 25.92 | 26.04 | 37.31 | 37.45 | 39.41 | 25.88 | 41.21 | |
| 10 | 32.24 | 16.21 | 32.33 | 32.49 | 31.85 | 32.21 | 37.54 | 32.33 | 39.09 | |
| 11 | 62.82 | 31.56 | 62.98 | 63.22 | 57.32 | 58.07 | 76.55 | 62.96 | 79.4 | |
| MR-T2–SPECT | 12 | 36.24 | 18.22 | 36.34 | 36.42 | 40.9 | 41.47 | 49.69 | 36.28 | 53.57 |
| 13 | 34.87 | 17.54 | 34.96 | 35.11 | 41.7 | 42.18 | 49.21 | 34.95 | 52.07 | |
| 14 | 35.12 | 17.71 | 35.25 | 35.37 | 47.41 | 48.07 | 63.28 | 35.14 | 66.98 | |
| 15 | 41.89 | 21.06 | 42 | 42.15 | 39.6 | 40.24 | 51.23 | 42.01 | 54.05 | |
| 16 | 48.85 | 24.44 | 48.87 | 49.11 | 46.44 | 46.95 | 56.3 | 48.78 | 60.14 | |
| Average Value | 41.83 | 28.79 | 41.77 | 47.51 | 47.45 | 48.07 | 57.10 | 44.93 | 60.59 | |
| Medical Image Modality | Fusion Techniques | |||||||||
|---|---|---|---|---|---|---|---|---|---|---|
| Data Sets | PCA | DWTPCA | DWT + Fuzzy | CONT | Chaira’s IFS | Bala’s IFS | Sugeno’s IFS | PC-NSCT | Proposed Method | |
| MR T1–MR T2 | 1 | 58.73 | 58.71 | 64.74 | 78.34 | 70.36 | 71.75 | 80.51 | 69.79 | 83.83 |
| 2 | 55.21 | 55.02 | 60.17 | 67.04 | 61.2 | 62.32 | 74.36 | 61.79 | 78.16 | |
| 3 | 59.25 | 57.86 | 69.74 | 77.06 | 73.98 | 75.53 | 80.43 | 73.08 | 83.45 | |
| 4 | 57.79 | 46.16 | 57.5 | 72.55 | 69.02 | 70.84 | 76.46 | 68.38 | 79.83 | |
| MR-T1–MRA | 5 | 46.19 | 45.49 | 68.52 | 68.86 | 62.11 | 62.45 | 72.01 | 69.22 | 74.73 |
| MRI–CT | 6 | 54.1 | 34.95 | 56.9 | 61.73 | 60.37 | 60.89 | 68.77 | 60.03 | 69.87 |
| 7 | 61.41 | 47.21 | 32.58 | 73.7 | 73.22 | 73.88 | 75.45 | 73.42 | 78.27 | |
| MRI–PET | 8 | 41.83 | 21.04 | 40.47 | 41.61 | 54.01 | 55.71 | 57.6 | 41.98 | 59.54 |
| 9 | 44.92 | 22.61 | 44.84 | 44.89 | 68.6 | 68.87 | 72.23 | 45.46 | 74.12 | |
| 10 | 60.57 | 30.43 | 59.91 | 60.4 | 63.04 | 64.05 | 73.13 | 60.74 | 74.9 | |
| 11 | 75.98 | 38.16 | 75.01 | 75.93 | 76.97 | 78.37 | 85.24 | 76.18 | 86.72 | |
| MR-T2–SPECT | 12 | 47.11 | 23.67 | 46.61 | 47.13 | 50.84 | 51.69 | 57.39 | 47.24 | 60.38 |
| 13 | 53.72 | 26.98 | 53.33 | 53.75 | 58.7 | 59.33 | 64.67 | 53.85 | 67.1 | |
| 14 | 43.1 | 21.7 | 42.8 | 43.16 | 53.66 | 54.18 | 63.68 | 43.30 | 66.03 | |
| 15 | 58.44 | 29.36 | 58.03 | 58.49 | 55.09 | 56.19 | 66.97 | 58.60 | 69.4 | |
| 16 | 65.31 | 32.68 | 64.74 | 65.15 | 61.47 | 62.38 | 71.09 | 65.39 | 74.78 | |
| Average Value | - | 55.23 | 37.00 | 55.99 | 61.85 | 63.29 | 64.28 | 71.25 | 60.53 | 73.82 |
| Medical Image Modality | Fusion Techniques | |||||||||
|---|---|---|---|---|---|---|---|---|---|---|
| Data Sets | PCA | DWTPCA | DWT + Fuzzy | CONT | Chaira’s IFS | Bala’s IFS | Sugeno’s IFS | PC-NSCT | Proposed Method | |
| MR T1–MR T2 | 1 | 5.79 | 5.8 | 7.35 | 8.31 | 5.96 | 8.21 | 8.51 | 8.62 | 8.6 |
| 2 | 4.29 | 4.25 | 5.7 | 6.42 | 4.37 | 5.09 | 6.48 | 6.4 | 6.59 | |
| 3 | 8.32 | 8.15 | 10.6 | 11.25 | 8.38 | 11.73 | 12.1 | 12.05 | 12.1 | |
| 4 | 7.68 | 7.36 | 9.59 | 10.69 | 7.35 | 9.65 | 9.8 | 10.81 | 10.81 | |
| MR-T1–MRA | 5 | 7.4 | 6.43 | 9.11 | 9.78 | 7.37 | 9.38 | 11.03 | 10.18 | 11.33 |
| MRI–CT | 6 | 5.4 | 3.9 | 6.43 | 7.39 | 6.15 | 6.92 | 7.99 | 7.39 | 8.12 |
| 7 | 6.77 | 5.4 | 6.33 | 8.12 | 6.63 | 8.6 | 8.64 | 8.54 | 8.94 | |
| MRI–PET | 8 | 5.78 | 3.45 | 5.42 | 5.10 | 4.04 | 5.24 | 5.37 | 5.73 | 5.80 |
| 9 | 4.79 | 2.41 | 4.47 | 4.91 | 5.31 | 5.83 | 6.84 | 4.8 | 7.01 | |
| 10 | 7.86 | 3.96 | 7.24 | 8.04 | 6.22 | 7.37 | 8.5 | 7.92 | 8.58 | |
| 11 | 14.55 | 7.3 | 12.88 | 14.81 | 10.49 | 13.2 | 15.53 | 14.59 | 15.66 | |
| MR-T2–SPECT | 12 | 8.15 | 4.09 | 7.03 | 8.17 | 5.85 | 7.59 | 9.59 | 8.18 | 10.09 |
| 13 | 6.47 | 3.24 | 5.8 | 6.54 | 5.06 | 5.85 | 6.52 | 6.49 | 6.69 | |
| 14 | 6.93 | 3.48 | 5.79 | 7 | 4.97 | 6.65 | 7.55 | 6.97 | 7.88 | |
| 15 | 7.79 | 3.91 | 6.7 | 7.87 | 5.02 | 6.51 | 8.06 | 7.82 | 8.34 | |
| 16 | 7.41 | 3.71 | 6.52 | 7.37 | 5.58 | 7.23 | 8.43 | 7.42 | 8.57 | |
| Average Value | - | 6.75 | 4.57 | 6.90 | 7.78 | 5.82 | 7.36 | 8.28 | 7.91 | 8.53 |
| Medical Image Modality | Fusion Techniques | |||||||||
|---|---|---|---|---|---|---|---|---|---|---|
| Data Sets | PCA | DWTPCA | DWT + Fuzzy | CONT | Chaira’s IFS | Bala’s IFS | Sugeno’s IFS | PC-NSCT | Proposed Method | |
| MR T1–MR T2 | 1 | 20.18 | 20.28 | 22.27 | 26.25 | 22.99 | 27.81 | 29.42 | 26.01 | 30.04 |
| 2 | 14.23 | 14.02 | 18.64 | 19.99 | 15.95 | 19 | 21.55 | 20.23 | 22.05 | |
| 3 | 24.04 | 23.18 | 29.62 | 32.96 | 27.17 | 32.05 | 33 | 32.79 | 34.3 | |
| 4 | 20.82 | 23.36 | 28.76 | 31.37 | 26.98 | 33.25 | 34.05 | 30.9 | 34.6 | |
| MR-T1–MRA | 5 | 23.41 | 16.43 | 24.23 | 24.88 | 24.48 | 25.36 | 25.94 | 25.92 | 25.98 |
| MRI–CT | 6 | 13.69 | 10.25 | 16.91 | 18.65 | 16.9 | 17.69 | 19.3 | 18.67 | 19.3 |
| 7 | 17.16 | 13.07 | 15.31 | 21.45 | 18.68 | 21.55 | 22.19 | 20.66 | 22.27 | |
| MRI–PET | 8 | 21.22 | 14.16 | 22.49 | 24.9 | 16.85 | 23.23 | 23.91 | 24.31 | 24.92 |
| 9 | 16.2 | 8.14 | 15.88 | 16.17 | 20.71 | 22.03 | 25.71 | 16.26 | 26.54 | |
| 10 | 26.32 | 13.2 | 24.85 | 26.28 | 23.63 | 26.48 | 29.53 | 26.4 | 30.13 | |
| 11 | 37.92 | 19.02 | 34.77 | 37.93 | 31.99 | 37.49 | 41.97 | 38.01 | 42.6 | |
| MR-T2–SPECT | 12 | 19.57 | 9.82 | 17.85 | 19.56 | 15.64 | 18.84 | 22.93 | 19.62 | 24.02 |
| 13 | 19.04 | 9.55 | 17.76 | 18.97 | 16.41 | 18.28 | 20.2 | 19.08 | 21.84 | |
| 14 | 16.17 | 8.12 | 14.47 | 16.15 | 13.97 | 16.94 | 17.12 | 16.23 | 19.96 | |
| 15 | 21.52 | 10.79 | 19.43 | 21.44 | 15.54 | 18.97 | 23.24 | 21.57 | 24.16 | |
| 16 | 24.96 | 12.49 | 22.91 | 24.76 | 20.87 | 24.02 | 29.35 | 24.96 | 30.41 | |
| Average Value | - | 21.03 | 14.12 | 21.63 | 23.86 | 20.55 | 23.94 | 26.21 | 23.85 | 27.07 |
| Medical Image Modality | Fusion Techniques | |||||||||
|---|---|---|---|---|---|---|---|---|---|---|
| Data Sets | PCA | DWTPCA | DWT + Fuzzy | CONT | Chaira’s IFS | Bala’s IFS | Sugeno’s IFS | PC-NSCT | Proposed Method | |
| MR T1–MR T2 | 1 | 43.01 | 43.22 | 47.43 | 56.27 | 48.63 | 58.86 | 62.39 | 55.86 | 63.79 |
| 2 | 30.58 | 30.14 | 40.21 | 42.72 | 34.21 | 40.66 | 46.16 | 43.29 | 47.23 | |
| 3 | 50.81 | 49.05 | 63.05 | 69.36 | 57.43 | 69.59 | 71.51 | 69.04 | 72.04 | |
| 4 | 44.77 | 48.87 | 60.89 | 66.10 | 56.75 | 69.33 | 70.96 | 65.35 | 71.08 | |
| MR-T1–MRA | 5 | 48.95 | 35.35 | 52.49 | 53.99 | 52.28 | 55.25 | 55.36 | 55.12 | 55.45 |
| MRI–CT | 6 | 30.36 | 22.62 | 37.41 | 41.13 | 37.16 | 38.95 | 41.47 | 41.24 | 42.30 |
| 7 | 3.07 | 28.13 | 32.61 | 46.26 | 40.21 | 46.34 | 47.59 | 44.64 | 47.75 | |
| MRI–PET | 8 | 47.80 | 29.00 | 47.31 | 51.09 | 35.36 | 49.67 | 51.49 | 50.98 | 51.53 |
| 9 | 35.28 | 17.73 | 34.62 | 35.28 | 44.21 | 47.49 | 56.00 | 35.42 | 57.81 | |
| 10 | 56.70 | 28.44 | 53.89 | 56.69 | 50.47 | 56.82 | 63.72 | 56.86 | 64.95 | |
| 11 | 80.76 | 40.51 | 74.61 | 80.86 | 67.51 | 79.53 | 89.72 | 80.97 | 82.04 | |
| MR-T2–SPECT | 12 | 41.64 | 20.88 | 38.28 | 41.61 | 33.35 | 40.10 | 48.75 | 41.75 | 50.99 |
| 13 | 41.02 | 20.57 | 38.50 | 40.85 | 35.26 | 39.29 | 43.38 | 41.12 | 44.71 | |
| 14 | 34.14 | 17.14 | 30.96 | 34.10 | 29.82 | 35.80 | 40.35 | 34.26 | 42.02 | |
| 15 | 45.80 | 22.97 | 41.75 | 45.61 | 33.14 | 40.25 | 49.54 | 45.92 | 51.48 | |
| 16 | 52.94 | 26.48 | 48.95 | 52.46 | 44.21 | 50.98 | 62.13 | 52.94 | 64.32 | |
| Average Value | - | 42.98 | 30.07 | 46.44 | 50.90 | 43.75 | 51.18 | 56.28 | 50.92 | 56.84 |
| Medical Image Modality | Fusion Techniques | |||||||||
|---|---|---|---|---|---|---|---|---|---|---|
| Data Sets | PCA | DWTPCA | DWT + Fuzzy | CONT | Chaira’s IFS | Bala’s IFS | Sugeno’s IFS | PC-NSCT | Proposed Method | |
| MR T1–MR T2 | 1 | 0.92 | 0.9201 | 0.8523 | 0.8647 | 0.8905 | 0.8932 | 0.9093 | 0.8838 | 0.9089 |
| 2 | 0.9428 | 0.9433 | 0.9117 | 0.9214 | 0.9392 | 0.9381 | 0.9433 | 0.9323 | 0.9421 | |
| 3 | 0.9007 | 0.9064 | 0.8286 | 0.8725 | 0.8844 | 0.889 | 0.8892 | 0.8715 | 0.8849 | |
| 4 | 0.7583 | 0.7587 | 0.6296 | 0.6721 | 0.7572 | 0.7659 | 0.7585 | 0.7444 | 0.7553 | |
| MR-T1–MRA | 5 | 0.9012 | 0.9078 | 0.8457 | 0.9021 | 0.9152 | 0.9134 | 0.9129 | 0.9133 | 0.9157 |
| MRI–CT | 6 | 0.5444 | 0.6413 | 0.5305 | 0.6412 | 0.6439 | 0.6472 | 0.635 | 0.6348 | 0.6481 |
| 7 | 0.8007 | 0.445 | 0.7548 | 0.7951 | 0.8055 | 0.8127 | 0.8102 | 0.8043 | 0.8111 | |
| MRI–PET | 8 | 0.8132 | 0.8106 | 0.8116 | 0.7985 | 0.794 | 0.7951 | 0.7951 | 0.8034 | 0.8088 |
| 9 | 0.6912 | 0.6954 | 0.6795 | 0.6715 | 0.688 | 0.6901 | 0.5878 | 0.6936 | 0.5694 | |
| 10 | 0.691 | 0.6912 | 0.6724 | 0.6457 | 0.585 | 0.6609 | 0.6907 | 0.6911 | 0.6886 | |
| 11 | 0.574 | 0.5755 | 0.5494 | 0.6736 | 0.5662 | 0.6709 | 0.6695 | 0.5736 | 0.6907 | |
| MR-T2–SPECT | 12 | 0.5279 | 0.5296 | 0.4755 | 0.5137 | 0.5285 | 0.5228 | 0.5288 | 0.5236 | 0.5226 |
| 13 | 0.6283 | 0.6313 | 0.6858 | 0.6783 | 0.6906 | 0.6067 | 0.6567 | 0.6925 | 0.6966 | |
| 14 | 0.6476 | 0.6513 | 0.5901 | 0.6238 | 0.6112 | 0.6167 | 0.6137 | 0.6456 | 0.6165 | |
| 15 | 0.681 | 0.6819 | 0.6618 | 0.6736 | 0.6778 | 0.677 | 0.6819 | 0.6932 | 0.6867 | |
| 16 | 0.6541 | 0.6574 | 0.6495 | 0.6219 | 0.6567 | 0.6595 | 0.6595 | 0.662 | 0.6693 | |
| Average Value | - | 0.7298 | 0.7154 | 0.6956 | 0.7231 | 0.7271 | 0.735 | 0.7339 | 0.7352 | 0.7385 |
| Medical Image Modality | Fusion Techniques | |||||||||
|---|---|---|---|---|---|---|---|---|---|---|
| Data Sets | PCA | DWTPCA | DWT + Fuzzy | CONT | Chaira’s IFS | Bala’s IFS | Sugeno’s IFS | PC-NSCT | Proposed Method | |
| MR-T1–MR-T2 | 1 | 3.5405 | 3.2795 | 3.4464 | 2.3495 | 3.6865 | 4.8538 | 4.2121 | 3.8146 | 3.7825 |
| 2 | 3.2935 | 2.9621 | 3.7514 | 3.2415 | 3.4637 | 4.292 | 3.6564 | 2.9574 | 3.4782 | |
| 3 | 3.837 | 3.3622 | 3.9574 | 3.4521 | 3.5411 | 5.2866 | 4.2527 | 3.1686 | 3.9925 | |
| 4 | 4.0495 | 3.2325 | 3.7457 | 3.6848 | 3.4302 | 4.2621 | 4.2265 | 4.0854 | 4.3005 | |
| MR-T1–MRA | 5 | 5.0121 | 5.9402 | 5.2496 | 4.7354 | 5.6626 | 5.9854 | 5.2456 | 4.791 | 5.9928 |
| MRI–CT | 6 | 6.3918 | 5.2744 | 5.2314 | 6.2198 | 5.1325 | 6.5985 | 6.3305 | 4.3827 | 6.7901 |
| 7 | 4.2013 | 3.851 | 4.9572 | 4.947 | 4.3207 | 5.2971 | 6.1245 | 5.6228 | 6.165 | |
| MRI–PET | 8 | 3.0026 | 3.0452 | 2.2536 | 2.9358 | 3.0057 | 3.5067 | 3.2504 | 3.4873 | 3.5689 |
| 9 | 2.9769 | 3.0468 | 1.9956 | 2.785 | 2.3185 | 3.0095 | 3.1047 | 2.3645 | 2.9308 | |
| 10 | 2.8845 | 2.9636 | 1.9311 | 2.6831 | 2.2413 | 2.6624 | 2.7858 | 2.9416 | 2.9711 | |
| 11 | 4.3382 | 4.51 | 2.4966 | 3.8536 | 2.8213 | 4.8101 | 5.0956 | 4.6593 | 4.4321 | |
| MR-T2–SPECT | 12 | 5.0262 | 5.0045 | 3.1563 | 4.9574 | 3.9424 | 5.4231 | 7.0542 | 4.9962 | 7.1046 |
| 13 | 3.9957 | 3.8844 | 2.76 | 3.8614 | 3.9952 | 4.7176 | 5.027 | 4.9831 | 5.1158 | |
| 14 | 4.9323 | 4.9244 | 3.1878 | 4.7164 | 4.3146 | 5.5147 | 6.4363 | 6.6907 | 6.2446 | |
| 15 | 4.934 | 5.0671 | 3.2207 | 5.6416 | 4.3017 | 5.4551 | 6.0178 | 4.9347 | 6.0238 | |
| 16 | 3.2219 | 4.3176 | 2.2222 | 4.9135 | 4.2378 | 3.8704 | 4.394 | 3.8471 | 5.416 | |
| Average Value | - | 4.1024 | 4.0416 | 3.3477 | 4.0611 | 3.776 | 4.7216 | 4.8259 | 4.2329 | 4.8943 |
| Medical Image Modality | Fusion Techniques | |||||||||
|---|---|---|---|---|---|---|---|---|---|---|
| Data Sets | PCA | DWTPCA | DWT + Fuzzy | CONT | Chaira’s IFS | Bala’s IFS | Sugeno’s IFS | PC-NSCT | Proposed Method | |
| MR T1–MR T2 | 1 | 1.9552 | 1.9624 | 1.9516 | 1.9254 | 1.9515 | 1.9537 | 1.9597 | 1.9524 | 1.9655 |
| 2 | 1.9719 | 1.9719 | 1.9722 | 1.9837 | 1.9529 | 1.9259 | 1.771 | 1.991 | 1.647 | |
| 3 | 1.979 | 1.9854 | 1.8712 | 1.9165 | 1.9849 | 1.9641 | 1.928 | 1.9421 | 1.9238 | |
| 4 | 1.8551 | 1.8492 | 1.7968 | 1.8379 | 1.8432 | 1.8322 | 1.8483 | 1.8325 | 1.8573 | |
| MR-T1–MRA | 5 | 1.828 | 1.7857 | 1.8276 | 1.7975 | 1.8266 | 1.8319 | 1.815 | 1.7928 | 1.8358 |
| MRI–CT | 6 | 1.5796 | 1.5913 | 1.6012 | 1.6135 | 1.6028 | 1.6103 | 1.6156 | 1.6035 | 1.6172 |
| 7 | 1.7205 | 1.7257 | 1.7554 | 1.7635 | 1.7334 | 1.7877 | 1.7891 | 1.7765 | 1.7898 | |
| MRI–PET | 8 | 1.8301 | 1.469 | 1.8652 | 1.7963 | 1.8568 | 1.8373 | 1.8703 | 1.8407 | 1.8658 |
| 9 | 1.746 | 1.7579 | 1.7582 | 1.8274 | 1.9076 | 1.8856 | 1.9068 | 1.9349 | 1.8943 | |
| 10 | 1.7074 | 1.7367 | 1.7477 | 1.7852 | 1.8616 | 1.8304 | 1.8514 | 1.8564 | 1.8659 | |
| 11 | 1.6882 | 1.7435 | 1.7382 | 1.8276 | 1.9103 | 1.8464 | 1.883 | 1.8975 | 1.8897 | |
| MR-T2–SPECT | 12 | 1.7056 | 1.7132 | 1.382 | 1.8724 | 1.8928 | 1.8931 | 1.9341 | 1.713 | 1.9416 |
| 13 | 1.866 | 1.8576 | 1.4825 | 1.7948 | 1.8062 | 1.8309 | 1.8924 | 1.8869 | 1.8973 | |
| 14 | 1.814 | 1.8224 | 1.8123 | 1.8375 | 1.9058 | 1.8569 | 1.8891 | 1.8612 | 1.8924 | |
| 15 | 1.3545 | 1.7703 | 1.8891 | 1.8627 | 1.809 | 1.8819 | 1.8735 | 1.7543 | 1.935 | |
| 16 | 1.5295 | 1.6545 | 1.5409 | 1.6273 | 1.5826 | 1.6414 | 1.6217 | 1.6147 | 1.6559 | |
| Average Value | - | 1.7582 | 1.7748 | 1.7495 | 1.8168 | 1.8393 | 1.8381 | 1.8406 | 1.8282 | 1.8421 |
| Fusion Techniques | |||||||||
|---|---|---|---|---|---|---|---|---|---|
| Performance Measures | PCA | DWTPCA | DWT + Fuzzy | CONT | Chaira’s IFS | Bala’s IFS | Sugeno’s IFS | PC-NSCT | Proposed Method |
| API | 6 | 9 | 7 | 4 | 5 | 3 | 2 | 8 | 1 |
| SD | 8 | 9 | 7 | 5 | 4 | 3 | 2 | 6 | 1 |
| AG | 7 | 9 | 6 | 4 | 8 | 5 | 2 | 3 | 1 |
| SF | 7 | 9 | 6 | 5 | 8 | 4 | 2 | 3 | 1 |
| MSF | 8 | 9 | 6 | 5 | 7 | 4 | 2 | 3 | 1 |
| CC | 5 | 8 | 9 | 7 | 6 | 3 | 4 | 2 | 1 |
| MI | 5 | 7 | 9 | 6 | 8 | 3 | 2 | 4 | 1 |
| FS | 8 | 7 | 9 | 6 | 3 | 4 | 2 | 5 | 1 |
| Medical Image Modality | Fusion Techniques | ||||||||
|---|---|---|---|---|---|---|---|---|---|
| PCA | DWTPCA | DWT + Fuzzy | CONT | Chaira’s IFS | Bala’s IFS | Sugeno’s IFS | PC-NSCT | Proposed Method | |
| Average Value | 0.80 | 0.60 | 1.48 | 17.69 | 0.87 | 0.65 | 0.50 | 36.72 | 1.19 |
Disclaimer/Publisher’s Note: The statements, opinions and data contained in all publications are solely those of the individual author(s) and contributor(s) and not of MDPI and/or the editor(s). MDPI and/or the editor(s) disclaim responsibility for any injury to people or property resulting from any ideas, methods, instructions or products referred to in the content. |
© 2023 by the authors. Licensee MDPI, Basel, Switzerland. This article is an open access article distributed under the terms and conditions of the Creative Commons Attribution (CC BY) license (https://creativecommons.org/licenses/by/4.0/).
Share and Cite
Haribabu, M.; Guruviah, V. An Improved Multimodal Medical Image Fusion Approach Using Intuitionistic Fuzzy Set and Intuitionistic Fuzzy Cross-Correlation. Diagnostics 2023, 13, 2330. https://doi.org/10.3390/diagnostics13142330
Haribabu M, Guruviah V. An Improved Multimodal Medical Image Fusion Approach Using Intuitionistic Fuzzy Set and Intuitionistic Fuzzy Cross-Correlation. Diagnostics. 2023; 13(14):2330. https://doi.org/10.3390/diagnostics13142330
Chicago/Turabian StyleHaribabu, Maruturi, and Velmathi Guruviah. 2023. "An Improved Multimodal Medical Image Fusion Approach Using Intuitionistic Fuzzy Set and Intuitionistic Fuzzy Cross-Correlation" Diagnostics 13, no. 14: 2330. https://doi.org/10.3390/diagnostics13142330
APA StyleHaribabu, M., & Guruviah, V. (2023). An Improved Multimodal Medical Image Fusion Approach Using Intuitionistic Fuzzy Set and Intuitionistic Fuzzy Cross-Correlation. Diagnostics, 13(14), 2330. https://doi.org/10.3390/diagnostics13142330