Abstract
α(1,2)fucosyltransferase (Se enzyme) encoded by FUT2 is involved in the secretor status of ABH(O) blood group antigens. The sedel2 allele is one of the non-functional FUT2 (se) alleles in which 9.3 kb, containing the entire coding region of FUT2, is deleted by Alu-mediated nonhomologous recombination. In addition to this allele, three SNPs of FUT2, c.375A>G, c.385A>T, and c.571C>T, appear to be prevalent in certain Oceanian populations such as Polynesians. Recently, we developed an endpoint genotyping assay to determine sedel2 zygosity, using a FAM-labeled probe for detection of the sedel2 allele and a VIC-labeled probe for the detection of FUT2. In this study, instead of the VIC probe, a HEX-labeled probe covering both c.375A>G and c.385A>T and a Cy5-labeled probe covering c.571C>T were added to the sedel2 allele assay mixture to allow for the simultaneous detection of these four variations via endpoint genotyping for sedel2 zygosity and fluorescence melting curve analysis for c.375A>G, c.385A>T, and c.571C>T genotyping. The results obtained from 24 Samoan subjects using this method were identical to those obtained using previous methods. Therefore, it appears that the present method can accurately determine these four variations simultaneously.
1. Introduction
α(1,2)fucosyltransferase (Se enzyme) encoded by FUT2 is involved in the secretor status of ABH(O) blood group antigens [1,2,3]. Secretors carry at least one functional FUT2 (Se) allele, which encodes the active Se enzyme, and consequently expresses ABH antigens in their secretions. In contrast, individuals with only Se enzyme-deficient (se or Sew) alleles either do not express these antigens (non-secretors) or express them in their secretions weakly (weak secretors) [3]. FUT2 is located in the region of chromosome 19q13.3, together with a pseudogene (SEC1P) with high sequence similarity [4,5].
Several single-nucleotide polymorphisms (SNPs) of FUT2 have been identified [6]. Among these, the nonsense SNP at c.428G>T (W143X, rs601338) is responsible for Se enzyme inactivation of the se428 allele, which is found at approximately 50% frequency in Europe, Africa, and West Asia [6]. On the other hand, the missense SNP at c.385A>T (I129F, rs1047781) is responsible for partial inactivation of the Se enzyme in a representative Sew allele [6]. This allele is present in East and Southeast Asians at about 50% frequency, and is also common in certain Oceanian populations such as Polynesians [7]. The missense SNP at c.302 C>T (I101P, rs200157007) constitutes the se302 allele, which is common in South Asian populations [6]. The nonsense SNP at c.571C>T (R191X, rs1800028) constitutes the se571 allele, which is relatively common in Polynesian and Taiwanese populations [7,8,9,10]. The synonymous SNP at c.375A>G (rs1800026) has been found in certain New Guineans (Melanesians) with relatively high frequency (more than 20%) and in Africans and Samoans (Polynesians) with relatively low frequency (about 2%) [7,11].
In addition, five Se alleles resulting from non-allelic homologous recombination have been identified and shown to have a population-specific distribution [7,12]. The sefus allele occurs due to recombination between SEC1P and FUT2 and seems to be specific to the Japanese population [13], whereas the sedel, sedel2, sedel3, and sedel4 alleles are deletions of the entire coding region of FUT2, resulting from the recombination of two interspersed repeat elements [7,12]. The sedel allele is a 10 kb deletion that occurs due to recombination between two Alu elements and appears to be characteristic of South Asian populations, with frequencies ranging from 10 to 20%, while the sedel2 allele is a 9.3 kb deletion that occurs due to recombination between two Alu elements, different from the sedel allele, and appears to be characteristic of certain Oceanian populations such as Samoans (Polynesians) and New Guineans (Melanesians), with frequencies ranging from 10 to 20% [7,11]. The Alu elements are the most abundant repeat elements, each approximately 300 bp in length, and occupy about 10% of the human genome. Based on their abundance and sequence similarity, the Alu elements are thought to be involved in genomic rearrangements in the human genome [14,15,16]. The sedel3 and sedel4 alleles are very rare, currently found in only one Chinese and one Peruvian [12].
TaqMan assays using dual-labeled fluorescence oligonucleotide probes (TaqMan probes) allow for real-time PCR monitoring for DNA and RNA quantification and the detection of SNPs [17]. This is because when the probe hybridizes to the complementary target DNA, it is cleaved by the 5’-3’ exonuclease activity of Taq polymerase, causing the quencher to separate from the fluorophore and emit fluorescence [17]. Recently, we developed an endpoint genotyping assay using two TaqMan probes, which were a FAM-labeled probe for detection of the sedel2 allele and a VIC-labeled probe for detection of the FUT2 coding region [12]. The TaqMan probes are also available for fluorescence melting curve analysis (FMCA) to detect SNPs [18,19,20,21]. FMCA is one of the most robust SNP detection methods [18]. Unlike the TaqMan assay, it would be desirable for FMCA to have no degradation of the fluorescent probe. However, it has been reported that Taq polymerases both with and without 5’-3’ exonuclease activity are suitable for FMCA under asymmetric PCR conditions, probably because suppressing primer extension of the sense strand of the probe inhibits probe hydrolysis [19].
In this study, we attempted to develop a multiplex FMCA for the purpose of developing a genetic analysis method that enables simple and rapid estimation of the secretor status of Oceanians. Since HEX is the most widely used fluorophore that can be used in the same filters as VIC, HEX probes were used instead of VIC. Therefore, a HEX-labeled probe covering c.375A>G and c.385A>T and a Cy5-labeled probe covering c.571C>T were added to the assay mixture of the FAM-labeled probe for detection of the sedel2 allele, allowing for the determination of sedel2 zygosity via endpoint genotyping, and three SNPs of FUT2 via FMCA could be identified in a single tube.
2. Materials and Methods
The research protocol was reviewed and approved by the ethical committee of Kurume University School of Medicine (approval No. 22158).
2.1. DNA Samples
Genomic DNA from 24 Samoans in Apia was used. Their sedel2 zygosity and all SNPs in the FUT2 coding region were previously determined via conventional PCR for amplification of the 2.6 kb junction region of the sedel2 allele and the direct Sanger sequencing of PCR products [7].
2.2. Probes and Primers Used in This Study
The nucleotide position numbers for FUT2 and SEC1P follow those reported by Kelly et al. [4]. Because FUT2 and SEC1P have high DNA sequence similarity, we selected primers of FUT2 that would not amplify SEC1 [4].
For detection of the sedel2 allele, we used the FAM-labeled hydrolysis probe (sedel2-probe; 5′-FAM-CCAGTCTGGCCAACAT-MGB-3′) and a set of primers (sedel2-F primer; 5′-CCGCAATAGAAAGACGTGGA-3′ and sedel2-R primer; 5′-CCAGGTTCAAGCGATTCTTC-3′) that were the same as those described previously and are indicated in Figure 1 A and B [12]. The primers and probes for the detection of c.375A>G, c.385A>T, and c.571C>T are indicated in Table 1 and Figure 1C. Primers for amplification of the FUT2 fragment surrounding c.571C>T were designed using Primer3Plus (https://www.bioinformatics.nl/cgi-bin/primer3plus/primer3plus.cgi, accessed on 1 March 2023) [22]. Either a HEX-labeled 385-probe—identical to 411–435 bp of SEC1P and 369–393 bp of the 385A allele of FUT2 but one base different from the 385T allele and 375G allele (wild-type, 385A allele with 375G substitution)—or a HEX-labeled 375-probe—identical to the 411–435 bp of SEC1P and 369–393 bp of the 375G allele of FUT2, but one base different from the wild-type, 385A allele and two bases different from the 385T allele—was used for the detection of c.375A>G and c.385A>T. In addition, a Cy5-labeled FUT2-571C probe was used for the detection of c.571C>T. We also compared FMCA using a 281-bp PCR amplicon from 337 to 617 bp of FUT2 and 76-bp PCR amplicon from 337 to 412 bp of FUT2, plus a 79 bp amplicon from 539 to 617 bp of FUT2.
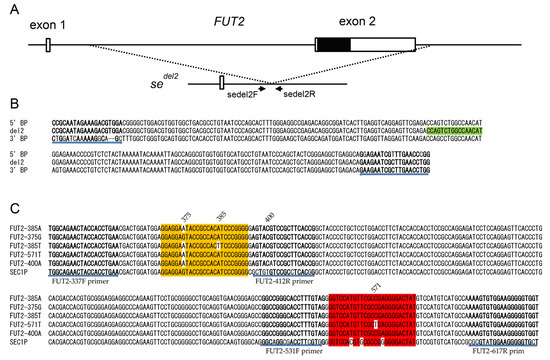
Figure 1.
(A) Genetic structures of FUT2 and sedel2. Two exons are indicated by white boxes, and the protein coding region is indicated by a black box. Positions of PCR primers for duplex real-time PCR are shown by arrows. (B) Alignment of DNA sequences of amplified regions of 231 bp surrounding the sedel2 breakpoint. DNA sequences of the 5’ breakpoint (5’ BP), 3’ breakpoint (3’ BP), and junction region (del2) are indicated. Primer sequences are shown in bold, and the hydrolysis probe sequence (sedel2-FAM) is boxed in light green. The positions and directions of the primers are indicated by arrows below the alignment. (C) Alignment of DNA sequences of five FUT2 alleles (FUT2-385A, -375G, -385T, -571T, and -400A) and corresponding regions of SEC1P are indicated. Primer sequences are shown in bold, the 375-probe sequence is highlighted in orange, and the 571-probe sequence is highlighted in red. Mismatched nucleotides in each probe are shown without highlighting. The positions and directions of the primers are indicated by arrows below the alignment.

Table 1.
Primers and probes for detection of c.375A>G, c.385A>T, and c.571C>T of FUT2.
2.3. Probe Selection for Detection of c.375A>G and c.385A>T by FMCA
To select probes for the detection of c.375A>G and c.385A>T, asymmetric real-time PCR and FMCA were performed with the following reaction mixture (10 μL total): 5 ng genomic DNA, 5 µL of Premix Ex Taq™ (Probe qPCR) (Takara, Tokyo, Japan) containing Taq polymerases with 5’-3’ exonuclease activity, 50 nM FUT2-337F primer, 500 nM FUT2-412R primer, and 200 nM HEX-labeled 385-probe or HEX-labeled 375-probe. The FUT2-337F and FUT2-412R primers were identical to those used for 385A>T detection via unlabeled probe HRM analysis [23].
2.4. Evaluation of the Number of Amplicons in Genotyping of c.375A>G, c.385A>T, and c.571C>T of FUT2 via FMCA
To compare one amplicon and two amplicons in the genotyping of c.375A>G, c.385A>T, and c.571C>T of FUT2 via FMCA, asymmetric real-time PCR and FMCA were performed with the following reaction mixture (10 μL total): 5 ng genomic DNA, 5 µL of Premix Ex Taq (Probe qPCR), 200 nM HEX-labeled 375-probe, and 200 nM Cy5-labeled 571 probe. In addition, 50 nM FUT2-337F primer and 500 nM FUT2-617R primer were included for the 281 bp amplicon. Alternatively, 50 nM FUT2-337F primer and 500 nM FUT2-412R primer for the 76 bp amplicon and 50 nM FUT2-531F primer and FUT2-617R primer for the 79 bp amplicon were included.
2.5. Detection of c.375A>G, c.385A>T, and c.571C>T via FMCA and Detection of sedel2 via Endpoint Genotyping in a Single Tube
To detect c.375A>G, c.385A>T, c.571C>T, and the sedel2 allele in a single tube, real-time PCR, FMCA, and endpoint genotyping were performed with the following reaction mixture (10 μL total): 5 ng genomic DNA, 5 µL of Premix Ex Taq (Probe qPCR), 50 nM each of sedel2-F and sedel2-R primers, and 100 nM of sedel2-probe; 50 nM FUT2-337F primer and 500 nM FUT2-617R primer; and 200 nM HEX-labeled 375-probe and 200 nM Cy5-labeled 571 probe.
2.6. Real-Time PCR Monitoring, FMCA, and Endpoint Genotyping
In this study, real-time PCR monitoring, FMCA, and endpoint genotyping were all performed using the LightCycler 480 instrument II (Roche Diagnostics, Tokyo, Japan). The thermal conditions for all PCRs were identical: preheating at 95 °C for 30 s, followed by 45 cycles of denaturation at 95 °C for 5 s, and annealing/extension at 63 °C for 15 s. The fluorescence data were collected at the end of the annealing/extension step of each cycle using a FAM (465 nm excitation and 510 nm emission), VIC/HEX/Yellow 555 (533 nm excitation and 580 nm emission), and/or Cy5/Cy5.5 (618 nm excitation and 660 nm emission) filters.
For melting curve genotyping, PCR products were heated to 95 °C for 1 min and rapidly cooled to 40 °C for 1 min, and then, the fluorescence data were collected over a range of 50 to 80 °C, increasing at 0.10 °C/s with 2 to 6 acquisitions/s using the same filters. Endpoint genotyping, melting curve genotyping, and melting temperature (Tm) calculation were performed using LightCycler 480 gene scanning software with default settings.
3. Results
3.1. Probe Selection for Genotyping of c.375A>G and c.385A>T via FMCA
As mentioned above, in Oceanian populations, including Samoans, a synonymous SNP at c.375A>G of FUT2 has been observed. In fact, one of our Samoan subjects was heterozygous for c.375A>G (375A/G), and the remaining twenty-three Samoan samples were all homozygous for 375A (375A/A) [7]. The 375A allele is further segregated into 385A and 385T alleles at c.385A>T; the nucleotide at position 385 of the 375A allele is an A, indicating that the 375A/G subjects are heterozygous for the 375G and 385A alleles. We first examined whether c.385A>T and c.375A>G could be separated using a 25 bp hydrolysis (TaqMan) probe, 385-probe, for the same sequence as the 385A (wild-type) allele used previously [24]. As shown in Figure 2A, the Tm value of the 385A allele was around 72 °C and clearly separated from the 385T allele and the 375G allele; however, the Tm values of the 385T and 375G alleles were both around 67 °C when using this probe. Although the peak height of the 375G allele seems to be slightly lower than that of the 385T allele, accurate separation is considered difficult. Therefore, we next examined the 375-probe, which has the same sequence as the 375G allele of FUT2 and SEC1P previously used for the simultaneous detection of 385A>T and the sefus allele [13]. The 385A allele peak with a Tm around 68 °C could be separated from the 375G allele peak with a Tm around 74 °C and the 385T allele peak with a Tm around 62 °C (Figure 2B). Although the peak with a Tm around 74 °C might also be generated if a corresponding region of the SEC1P was amplified, the primers used in this study amplified only FUT2 and not SEC1P, allowing us to examine the presence of the 375G allele and separate it from the 385A and 385T alleles. Therefore, in this study, we used the 375-probe instead of the 385-probe for the detection of c.375A>G and c.385A>T.
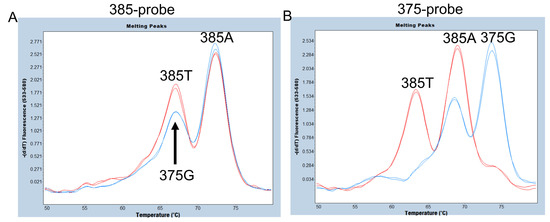
Figure 2.
Melting peak profiles of the 385-probe (A) and of the 375-probe (B) for heterozygotes of c.385A>T (385A/T) (red) and c.375A>G (375A/G) (blue). Duplicated results using two samples are shown. (A) The peak height of 375G seems to be slightly lower than that of 385T, but accurate separation is considered difficult using a 385-probe. (B) The three melting peaks corresponding to 375G, 385A, and 385T alleles were completely separated using the 375-probe.
3.2. Evaluation of the Number of Amplicons in Genotyping of c.375A>G, c.385A>T, and c.571C>T of FUT2 via FMCA
We then compared the FMCA results using a 281 bp PCR amplicon from 337 to 617 bp of FUT2 (one amplicon) and a 76 bp PCR amplicon from 337 to 412 bp of FUT2, plus a 79 bp amplicon from 539 to 617 bp of FUT2 (two amplicons). The primers used for PCR amplification are listed in Table 1. As shown in Figure 3A, we were able to separate the 571C allele signal with a Tm around 72 °C from the 571T allele signal with a Tm around 64 °C, and the peak heights of the 571-probe obtained with two amplicons and those with one amplicon are almost equivalent. Although none of the 24 Samoans were 571T/T subjects, one 571T hemizygote (571T/sedel2 subject) showed only one melting peak corresponding to 571T. The melting peak pattern of this subject is considered identical to that of the 571T/T subject. Therefore, it would be possible to detect the 571T/T subject. On the other hand, the peaks of the 375-probe obtained with the two amplicons were higher than those obtained with one amplicon, but smaller peaks were observed with the two amplicons that were almost identical to the Tm value of the 375G allele. In addition, as shown in Figure 1, the FUT2-412R primer for two PCR amplicons contained a c.400G>A SNP (V134I, rs370886251), which is relatively common in Melanesians such as New Guineans, but is rarely present in peripheral populations such as Polynesians and almost always absent in other populations [7,11]. In fact, one of the 24 Samoans was heterozygous for 400G/A (G is on 385T allele and A is on 385A allele), and the peak height corresponding to 385A was quite low in this subject when using two amplicons in FMCA (Figure 3C), probably due to a single base mismatch in the FUT2-412R primer. Therefore, there would be a risk of misdiagnosis with a homozygote 385T allele in this subject. For these reasons, we decided to perform FMCA with one amplicon instead of two amplicons in this study.
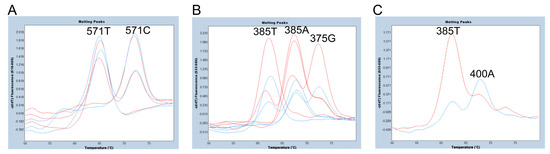
Figure 3.
Melting peak profiles of the 571-probe (A) and the 375-probe (B,C) for selected subjects using one or two amplicons. (A) Melting peak profiles of the 571-probe obtained from 571C/C, 571C/T, and 571T/sedel2 subjects with two amplicons (red) and those with one amplicon (blue). The peak heights obtained with two amplicons and those with one amplicon are almost equivalent. (B) Melting peak profiles of the 375-probe obtained from 385A/A, 385A/T, 385T/T, and 385A/375G subjects with two amplicons (red) and those with one amplicon (blue). The peak heights obtained with two amplicons are higher than those with one amplicon. (C) Melting peak profiles of the 375-probe obtained from one heterozygote of 400G/A with two amplicons (red) and one amplicon (blue). The peak height corresponding to 385A (400A allele) is quite low in this subject when using two amplicons, while the melting peak profile is similar to that of the 385A/T heterozygote when using one amplicon.
3.3. Genotyping of c.375A>G, c.385A>T, and c.571C>T of FUT2 via FMCA and Endpoint Genotyping of the sedel2 Allele in a Single Tube
Finally, we evaluated a simultaneous assay of FMCA genotyping of c.375A>G, c.385A>T, and c.571C>T of FUT2 and endpoint genotyping of the sedel2 allele using 24 Samoans whose sedel2 zygosity and all SNPs in the FUT2 coding region had been previously determined via direct sequencing of PCR products using Sanger sequencing [7]. The representative Sanger sequencing results for the wild-type homozygote, heterozygote, and variant-type homozygote of c.385A>T and c.571C>T, respectively, are shown in supplementary Figure S1. As mentioned above, we clearly identified the 375G, 385A, and 385T alleles using the VIC/HEX/Yellow 555 filter (Figure 4A), and the 571C and 571T alleles using the Cy5/Cy5.5 filter (Figure 4B).
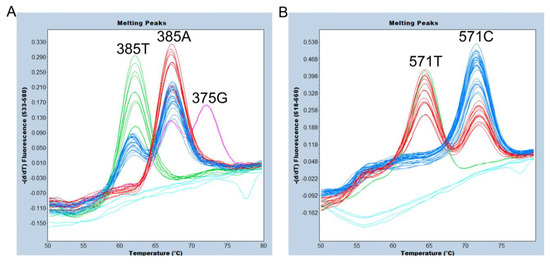
Figure 4.
Melting peak profiles of the 375-probe (A) and of the 571-probe (B) for 24 Samoans. Duplicated results are shown. (A) The subjects with 385A/A (red), A/T (blue), and T/T (green) genotypes were completely separated. In addition, one 375G/385A (pink) heterozygote was clearly separated. Negative controls and one sedel2 homozygote are indicated by light blue. (B) The subjects with 571C/C (blue), C/T (red), and T/T (green) genotypes were completely separated. Negative controls and one sedel2 homozygote are indicated by light blue.
Endpoint genotyping was then performed using the same primer sets previously reported for detection of the sedel2 allele and the HEX-labeled 375 probe or Cy5-labeled 571 probe, instead of the FUT2-specific VIC probe, for detection of the FUT2 signal [12]. In the present assay, the sedel2 allele was detected using a FAM-labeled probe, and the FUT2 alleles were detected using a HEX-labeled probe or a Cy5-labeled probe. This method completely discriminated the three genotypes, one homozygote of the sedel2 allele (only FAM signal), three heterozygotes of the sedel2 allele (with FAM, HEX, and Cy5 signals), and 20 subjects without the sedel2 allele (without FAM signal and with HEX and Cy5 signals) for 24 Samoans. Scatter plots of endpoint genotyping are shown in Figure 5A,B. The subjects with 385A/- (385A/sedel2) were separated from those with 385T/- (385T/sedel2) in a dual-color scatter plot of fluorescence signals because the HEX/FAM signal ratios of 385A/sedel2 were approximately 3 times higher than those of 385T/sedel2 (Figure 5A). This may be because the 375-probe dissociates mostly from the T allele, whereas it binds completely to the A allele at 63 °C, which is the temperature of annealing/extension that collects the real-time PCR fluorescence signal. On the other hand, no such differences were observed between the subjects with 571C/sedel2 and 571T/sedel2 (Figure 5B). During all events, the results of the sedel2 zygosity determined using this method were also in perfect agreement with those determined using previous genotyping methods [7].
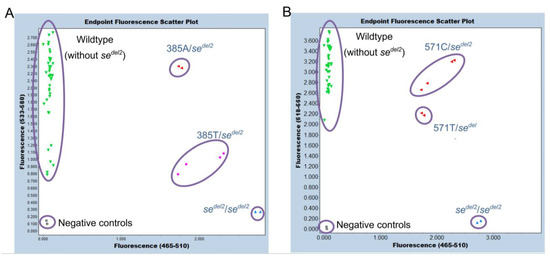
Figure 5.
Endpoint genotyping of sedel2. Duplicated results for genomic DNA from 24 Samoans are shown. (A) The results of a dual-color scatter plot of fluorescence signals by 465–510 nm/533–580 nm. The subjects of wild types—without sedel2 (green), sedel2 heterozygotes—385A/- (red), sedel2 heterozygotes—385T/- (pink), and sedel2 homozygotes (blue) are separated. Negative controls are indicated by gray. (B) The results of a dual-color scatter plot of fluorescence signals by 465–510 nm/618–660 nm. The subjects of wild types—without sedel2 (green), sedel2 heterozygotes—both 571C/- and 571T/- (red), and sedel2 homozygotes (blue) are separated. Negative controls are indicated by gray.
4. Discussion
Recently, we developed endpoint genotyping to determine sedel2 zygosity using primers and a FAM-labeled sedel2-probe for the amplification and detection of sedel2 and primers, and a VIC-labeled probe for FUT2 [12]. In this study, we applied this method to the determination of three SNPs of FUT2 (c.375A>G, c.385A>T, and c.571C>T), as well as the determination of sedel2 zygosity. The present method appears to be advantageous in terms of cost and time savings compared to the previous method that determined only the sedel2 zygosity, because the present method could estimate the secretor status of Polynesian subjects in a single assay [12]. The direct Sanger sequencing of PCR products is the gold standard method for the detection and discovery of SNPs [25]. However, its disadvantage is that it requires rather complicated post-PCR operation. On the other hand, FMCA is a robust and simple method for the detection of known SNPs, is capable of multiplex assays, and is suitable for relatively large-scale analysis, but it is not suitable for the detection of unknown SNPs [19]. Another real-time PCR-based method that does not use labeled probes, high-resolution melting analysis, is faster, simple, and particularly suitable for detecting heterozygotes, making it an excellent method for determining infrequent SNPs, and can also detect unknown SNPs within the amplified region [26]. The disadvantage of this method, however, is that the difference in Tm between wild-type and variant-type homozygotes is often small, within 1 °C, making it unsuitable for separating each homozygote. Therefore, it is necessary to use these methods differently depending on the distribution of variations. The limitations of this method are that it cannot detect Se alleles other than Sew, se571, and sedel2, and it is not very useful for FUT2 polymorphism analysis outside of Oceania.
Given the characteristic distribution of Se alleles due to non-allelic homologous recombination events, it is likely that the sefus allele was generated in Japan and the sedel allele in South Asia [7,13]. On the other hand, the origin of the sedel2 allele was unclear in some respects because the history of the Oceania population is complex. We first found this allele in a Samoan population (Polynesians, also called Remote Oceanians) and later in several New Guinean populations (Melanesians, also called Near Oceanians) [7,11]. Previous studies suggested that Polynesians have genetically interbred with East Asians (Taiwanese) and indigenous Melanesians many times [27,28,29]. The sedel2 allele has been found in Papuan- and Austronesian-speaking peoples of Irian Jaya (West Papua, Indonesia) and in mixed highland and coastal Papua New Guineans, but not in New Guinean highlanders (Dani peoples) [11]. Polynesians had a high frequency of c.385A>T and c.571C>T, which are common in Taiwanese populations, while these two alleles were rare or almost absent in Melanesians with or without the sedel2 allele [7,8,10,30]. In addition, the sedel2 allele does not to appear to be present in peoples from East and Southeast Asia, such as the Taiwanese and Indonesians [9,10]. Therefore, the sedel2 allele is thought to have originated in an Oceanian population, rather than in an Asian population. However, it is still unclear whether the sedel2 allele originated from Near or Remote Oceania. It would be desirable to conduct a large-scale study of the distribution of the sedel2 allele in various populations in Oceanian and neighboring areas in order to determine the distribution and origin of this allele.
In addition, the c.375A>G in FUT2 is a very interesting SNP. This is because in gorillas and orangutans, the nucleotide at position 375 in FUT2 is G, while in chimpanzees and humans, it is A. Therefore, it is assumed that the substitution from G to A occurred in the common ancestor of chimpanzees and humans, and that the re-substitution from A to G occurred once again in humans. Furthermore, c.375A>G appears to be relatively unique to Papuan-speaking Melanesian populations, although it was also present Austronesian-speaking Melanesian populations and Polynesian populations with a relatively low frequency [11]. In addition, c.375A>G and c.571C>T have recently been found in two late Neanderthals who lived in Russia and Croatia about 500,000 to 800,000 years ago [31]. However, these two Neanderthals had c.375A>G accompanied by c.571C>T, whereas in the Samoan and Taiwanese c.571C>T, it was not accompanied by c.375A>G [7,8,9,10,31]. Furthermore, one late Neanderthal in Altai and one Denisovan without c.571C>T also had c.375A>G as a homozygous state. One Denisovan had a c.400G>A as a heterozygous state. However, as with c.571C>T, the Denisovan c.400G>A was accompanied by c375A>G, but the Oceanian c.400G>A was not accompanied by c375A>G [11,31]. c.400G>A and c.375A>G were found at relatively high frequencies in Melanesians but were quite rare or not found in other populations [11].
Previous studies have suggested that a complex pattern of natural selection, such as balancing selection or positive selection in different populations, might act on the FUT2 locus [6]. The selective force is presumed to be several pathogens. In fact, non-secretors have been reported to be highly resistant to noroviruses and rotaviruses, and more recently, to COVID-19 infection, albeit weakly [32,33,34]. In addition, recent studies have suggested that secretor status affects susceptibility to a variety of clinical conditions, including some infectious diseases, inflammatory bowel disease, and reduced plasma vitamin B12 levels [35,36,37,38,39,40,41,42]. Therefore, to understand the complex evolutionary history of the FUT2 locus, it is very important to know the origin of these alleles and their relationship to the late Neanderthals, Denisovans, and Melanesians. From these perspectives, the present method is useful for estimating the origin of these variations by knowing their distribution.
5. Conclusions
In this study, we developed a method for the simultaneous detection of c.375A>G, c.385A>T, and c.571C>T, as well as the sedel2 allele, via FMCA and an endpoint genotyping assay in a single tube. The present FMCA and endpoint genotyping method appeared to be reliable high-throughput methods for detecting c.375A>G, c.385A>T, and c.571C>T, as well as the sedel2 allele, and for estimating secretor status in Oceanian populations. In addition, this method may be useful for examining the distribution and origin of these alleles.
Supplementary Materials
The following supporting information can be downloaded at: https://www.mdpi.com/article/10.3390/diagnostics13122022/s1, Figure S1: The representative Sanger sequencing results for the variations.
Author Contributions
Conceptualization, Y.K.; methodology, Y.K.; investigation, M.S. and Y.K.; resources, M.S. and Y.K.; writing—original draft preparation, M.S.; writing—review and editing, Y.K.; supervision, Y.K. All authors have read and agreed to the published version of the manuscript.
Funding
This research received no external funding.
Institutional Review Board Statement
The study was conducted in accordance with the Declaration of Helsinki and approved by the ethical committee of Kurume University (approval no. 22158, approved date: 31 October 2022).
Informed Consent Statement
The need for patient consent was waived due to the use of existing and already anonymized DNA samples.
Data Availability Statement
The data presented in this study are available upon request from the corresponding author.
Acknowledgments
We thank Katherine Ono for editing the English in this manuscript.
Conflicts of Interest
The authors declare no conflict of interest.
References
- Oriol, R.; Danilovs, J.; Hawkins, B.R. A new genetic model proposing that the Se gene is a structural gene closely linked to the H gene. Am. J. Hum. Genet. 1981, 33, 421–431. [Google Scholar] [PubMed]
- Clausen, H.; Hakomori, S. ABH and related histo-blood group antigens; immunochemical differences in carrier isotypes and their distribution. Vox Sang. 1989, 56, 1–20. [Google Scholar] [CrossRef] [PubMed]
- Daniels, G.; Abo, H. Lewis Systems. In Human Blood Groups, 3rd ed.; Daniels, G., Ed.; Wiley-Blackwell: West Sussex, UK, 2013; pp. 11–95. [Google Scholar]
- Kelly, R.J.; Rouquier, S.; Giorgi, D.; Lennon, G.G.; Lowe, J.B. Sequence and expression of a candidate for the human Secretor blood group alpha(1,2)fucosyltransferase gene (FUT2). Homozygosity for an enzyme-inactivating nonsense mutation commonly correlates with the non-secretor phenotype. J. Biol. Chem. 1995, 270, 4640–4649. [Google Scholar] [CrossRef] [PubMed]
- Rouquier, S.; Lowe, J.B.; Kelly, R.J.; Fertitta, A.L.; Lennon, G.G.; Giorgi, D. Molecular cloning of a human genomic region containing the H blood group alpha(1,2)fucosyltransferase gene and two H locus-related DNA restriction fragments. Isolation of a candidate for the human Secretor blood group locus. J. Biol. Chem. 1995, 270, 4632–4639. [Google Scholar] [CrossRef] [PubMed]
- Ferrer-Admetlla, A.; Sikora, M.; Laayouni, H.; Esteve, A.; Roubinet, F.; Blancher, A.; Calafell, F.; Bertranpetit, J.; Casals, F. A natural history of FUT2 polymorphism in humans. Mol. Biol. Evol. 2009, 26, 1993–2003. [Google Scholar] [CrossRef]
- Pang, H.; Fujitani, N.; Soejima, M.; Koda, Y.; Islam, M.N.; Islam, A.K.; Kimura, H. Two distinct Alu-mediated deletions of the human ABO-secretor (FUT2) locus in Samoan and Bangladeshi populations. Hum. Mutat. 2000, 16, 274. [Google Scholar] [CrossRef]
- Henry, S.; Mollicone, R.; Lowe, J.B.; Samuelsson, B.; Larson, G. A second nonsecretor allele of the blood group alpha(1,2)fucosyl-transferase gene (FUT2). Vox Sang. 1996, 70, 21–25. [Google Scholar] [CrossRef]
- Yu, L.C.; Chu, C.C.; Chan, Y.S.; Chang, C.Y.; Twu, Y.C.; Lee, H.L.; Lin, M. Polymorphism and distribution of the Secretor alpha(1,2)-fucosyltransferase gene in various Taiwanese populations. Transfusion 2001, 41, 1279–1284. [Google Scholar] [CrossRef]
- Chang, J.G.; Ko, Y.C.; Lee, J.C.; Chang, S.J.; Liu, T.C.; Shih, M.C.; Peng, C.T. Molecular analysis of mutations and polymorphisms of the Lewis secretor type alpha(1,2)-fucosyltransferase gene reveals that Taiwan aborigines are of Austronesian derivation. J. Hum. Genet. 2002, 47, 60–65. [Google Scholar] [CrossRef]
- Koda, Y.; Ishida, T.; Tachida, H.; Wang, B.; Pang, H.; Soejima, M.; Soemantri, A.; Kimura, H. DNA sequence variation of the human ABO-secretor locus ( FUT2) in New Guinean populations: Possible early human migration from Africa. Hum. Genet. 2003, 113, 534–541. [Google Scholar] [CrossRef]
- Soejima, M.; Koda, Y. Real-time PCR-based detection of the Alu-mediated deletion of FUT2 (se(del2)). Leg. Med. 2022, 54, 101986. [Google Scholar] [CrossRef] [PubMed]
- Soejima, M.; Koda, Y. Estimation of Lewis Blood Group Status by Fluorescence Melting Curve Analysis in Simultaneous Genotyping of c.385A>T and Fusion Gene in FUT2 and c.59T>G and c.314C>T in FUT3. Diagnostics 2023, 13, 931. [Google Scholar] [CrossRef]
- Schmid, C.W.; Jelinek, W.R. The Alu family of dispersed repetitive sequences. Science 1982, 216, 1065–1070. [Google Scholar] [CrossRef]
- Sen, S.K.; Han, K.; Wang, J.; Lee, J.; Wang, H.; Callinan, P.A.; Dyer, M.; Cordaux, R.; Liang, P.; Batzer, M.A. Human genomic deletions mediated by recombination between Alu elements. Am. J. Hum. Genet. 2006, 79, 41–53. [Google Scholar] [CrossRef]
- Kim, S.; Cho, C.S.; Han, K.; Lee, J. Structural Variation of Alu Element and Human Disease. Genom. Inform. 2016, 14, 70–77. [Google Scholar] [CrossRef]
- Heid, C.A.; Stevens, J.; Livak, K.J.; Williams, P.M. Real time quantitative PCR. Genome Res. 1996, 6, 986–994. [Google Scholar] [CrossRef] [PubMed]
- El Housni, H.; Heimann, P.; Parma, J.; Vassart, G. Single-nucleotide polymorphism genotyping by melting analysis of dual-labeled probes: Examples using factor V Leiden and prothrombin 20210A mutations. Clin. Chem. 2003, 49, 1669–1672. [Google Scholar] [CrossRef]
- Huang, Q.; Liu, Z.; Liao, Y.; Chen, X.; Zhang, Y.; Li, Q. Multiplex fluorescence melting curve analysis for mutation detection with dual-labeled, self-quenched probes. PLoS ONE 2011, 6, e19206. [Google Scholar] [CrossRef] [PubMed]
- Chen, K.Y.; Xu, J.X.; Wang, M.M.; Hu, D.; Xie, F.; Huang, D.; Chen, J.; Yang, T.; Zhang, J.; Song, F.; et al. Single probe PCR melting curve analysis MTHFR C677T SNP sites. Anal. Biochem. 2021, 619, 114102. [Google Scholar] [CrossRef]
- Zhang, L.; Liu, D.; Li, B.; Xie, J.; Liu, J.; Zhang, Z. Single nucleotide polymorphism genotyping of ALDH2 gene based on asymmetric PCR and fluorescent probe-mediated melting curves. Anal. Biochem. 2021, 642, 114509. [Google Scholar] [CrossRef]
- Untergasser, A.; Cutcutache, I.; Koressaar, T.; Ye, J.; Faircloth, B.C.; Remm, M.; Rozen, S.G. Primer3--new capabilities and interfaces. Nucleic Acids Res. 2012, 40, e115. [Google Scholar] [CrossRef] [PubMed]
- Soejima, M.; Koda, Y. Detection of the weak-secretor rs1047781 (385A>T) single nucleotide polymorphism using an unlabeled probe high-resolution melting-based method. Electrophoresis 2021, 42, 1362–1365. [Google Scholar] [CrossRef]
- Soejima, M.; Koda, Y. Simultaneous genotyping of three major Se enzyme inactivating SNPs of FUT2 based on a triplex probe-based fluorescence melting-curve analysis. Clin. Chim. Acta 2022, 530, 50–54. [Google Scholar] [CrossRef] [PubMed]
- Hippman, C.; Nislow, C. Pharmacogenomic Testing: Clinical Evidence and Implementation Challenges. J. Pers. Med. 2019, 9, 40. [Google Scholar] [CrossRef]
- Wittwer, C.T. High-resolution DNA melting analysis: Advancements and limitations. Hum. Mutat. 2009, 30, 857–859. [Google Scholar] [CrossRef]
- Kimura, R.; Ohashi, J.; Matsumura, Y.; Nakazawa, M.; Inaoka, T.; Ohtsuka, R.; Osawa, M.; Tokunaga, K. Gene flow and natural selection in oceanic human populations inferred from genome-wide SNP typing. Mol. Biol. Evol. 2008, 25, 1750–1761. [Google Scholar] [CrossRef] [PubMed]
- Wollstein, A.; Lao, O.; Becker, C.; Brauer, S.; Trent, R.J.; Nurnberg, P.; Stoneking, M.; Kayser, M. Demographic history of Oceania inferred from genome-wide data. Curr. Biol. 2010, 20, 1983–1992. [Google Scholar] [CrossRef]
- Choin, J.; Mendoza-Revilla, J.; Arauna, L.R.; Cuadros-Espinoza, S.; Cassar, O.; Larena, M.; Ko, A.M.; Harmant, C.; Laurent, R.; Verdu, P.; et al. Genomic insights into population history and biological adaptation in Oceania. Nature 2021, 592, 583–589. [Google Scholar] [CrossRef]
- Henry, S.; Mollicone, R.; Fernandez, P.; Samuelsson, B.; Oriol, R.; Larson, G. Molecular basis for erythrocyte Le(a+ b+) and salivary ABH partial-secretor phenotypes: Expression of a FUT2 secretor allele with an A-->T mutation at nucleotide 385 correlates with reduced alpha(1,2) fucosyltransferase activity. Glycoconj. J. 1996, 13, 985–993. [Google Scholar] [CrossRef]
- Condemi, S.; Mazieres, S.; Faux, P.; Costedoat, C.; Ruiz-Linares, A.; Bailly, P.; Chiaroni, J. Blood groups of Neandertals and Denisova decrypted. PLoS ONE 2021, 16, e0254175. [Google Scholar] [CrossRef]
- Loureiro Tonini, M.A.; Pires Goncalves Barreira, D.M.; Bueno de Freitas Santolin, L.; Bondi Volpini, L.P.; Gagliardi Leite, J.P.; Le Moullac-Vaidye, B.; Le Pendu, J.; Cruz Spano, L. FUT2, Secretor Status and FUT3 Polymorphisms of Children with Acute Diarrhea Infected with Rotavirus and Norovirus in Brazil. Viruses 2020, 12, 1084. [Google Scholar] [CrossRef]
- Nishida, N.; Sugiyama, M.; Kawai, Y.; Naka, I.; Iwamoto, N.; Suzuki, T.; Suzuki, M.; Miyazato, Y.; Suzuki, S.; Izumi, S.; et al. Genetic association of IL17 and the importance of ABO blood group antigens in saliva to COVID-19. Sci. Rep. 2022, 12, 3854. [Google Scholar] [CrossRef]
- Moslemi, C.; Saekmose, S.; Larsen, R.; Brodersen, T.; Didriksen, M.; Hjalgrim, H.; Banasik, K.; Nielsen, K.R.; Bruun, M.T.; Dowsett, J.; et al. A large cohort study of the effects of Lewis, ABO, 13 other blood groups, and secretor status on COVID-19 susceptibility, severity, and long COVID-19. Transfusion 2023, 63, 47–58. [Google Scholar] [CrossRef] [PubMed]
- Hazra, A.; Kraft, P.; Selhub, J.; Giovannucci, E.L.; Thomas, G.; Hoover, R.N.; Chanock, S.J.; Hunter, D.J. Common variants of FUT2 are associated with plasma vitamin B12 levels. Nat. Genet. 2008, 40, 1160–1162. [Google Scholar] [CrossRef] [PubMed]
- McGovern, D.P.; Jones, M.R.; Taylor, K.D.; Marciante, K.; Yan, X.; Dubinsky, M.; Ippoliti, A.; Vasiliauskas, E.; Berel, D.; Derkowski, C.; et al. Fucosyltransferase 2 (FUT2) non-secretor status is associated with Crohn's disease. Hum. Mol. Genet. 2010, 19, 3468–3476. [Google Scholar] [CrossRef] [PubMed]
- Parmar, A.S.; Alakulppi, N.; Paavola-Sakki, P.; Kurppa, K.; Halme, L.; Farkkila, M.; Turunen, U.; Lappalainen, M.; Kontula, K.; Kaukinen, K.; et al. Association study of FUT2 (rs601338) with celiac disease and inflammatory bowel disease in the Finnish population. Tissue Antigens 2012, 80, 488–493. [Google Scholar] [CrossRef]
- Cooling, L. Blood Groups in Infection and Host Susceptibility. Clin. Microbiol. Rev. 2015, 28, 801–870. [Google Scholar] [CrossRef]
- Hu, D.; Zhang, D.; Zheng, S.; Guo, M.; Lin, X.; Jiang, Y. Association of Ulcerative Colitis with FUT2 and FUT3 Polymorphisms in Patients from Southeast China. PLoS ONE 2016, 11, e0146557. [Google Scholar] [CrossRef]
- Mottram, L.; Wiklund, G.; Larson, G.; Qadri, F.; Svennerholm, A.M. FUT2 non-secretor status is associated with altered susceptibility to symptomatic enterotoxigenic Escherichia coli infection in Bangladeshis. Sci. Rep. 2017, 7, 10649. [Google Scholar] [CrossRef]
- Santos-Cortez, R.L.P.; Chiong, C.M.; Frank, D.N.; Ryan, A.F.; Giese, A.P.J.; Bootpetch Roberts, T.; Daly, K.A.; Steritz, M.J.; Szeremeta, W.; Pedro, M.; et al. FUT2 Variants Confer Susceptibility to Familial Otitis Media. Am. J. Hum. Genet. 2018, 103, 679–690. [Google Scholar] [CrossRef]
- Colston, J.M.; Francois, R.; Pisanic, N.; Penataro Yori, P.; McCormick, B.J.J.; Olortegui, M.P.; Gazi, M.A.; Svensen, E.; Ahmed, M.M.M.; Mduma, E.; et al. Effects of Child and Maternal Histo-Blood Group Antigen Status on Symptomatic and Asymptomatic Enteric Infections in Early Childhood. J. Infect. Dis. 2019, 220, 151–162. [Google Scholar] [CrossRef] [PubMed]


Disclaimer/Publisher’s Note: The statements, opinions and data contained in all publications are solely those of the individual author(s) and contributor(s) and not of MDPI and/or the editor(s). MDPI and/or the editor(s) disclaim responsibility for any injury to people or property resulting from any ideas, methods, instructions or products referred to in the content. |
© 2023 by the authors. Licensee MDPI, Basel, Switzerland. This article is an open access article distributed under the terms and conditions of the Creative Commons Attribution (CC BY) license (https://creativecommons.org/licenses/by/4.0/).