
Preliminary Report on Optical Coherence Tomography Angiography Biomarkers in Non-Responders and Responders to Intravitreal Anti-VEGF Injection for Diabetic Macular Oedema

 , , , ,
  and
and 
Abstract
1. Introduction
2. Materials and Methods
2.1. Acquisition of Images
2.2. OCTA Analysis
2.3. DCP Measurements
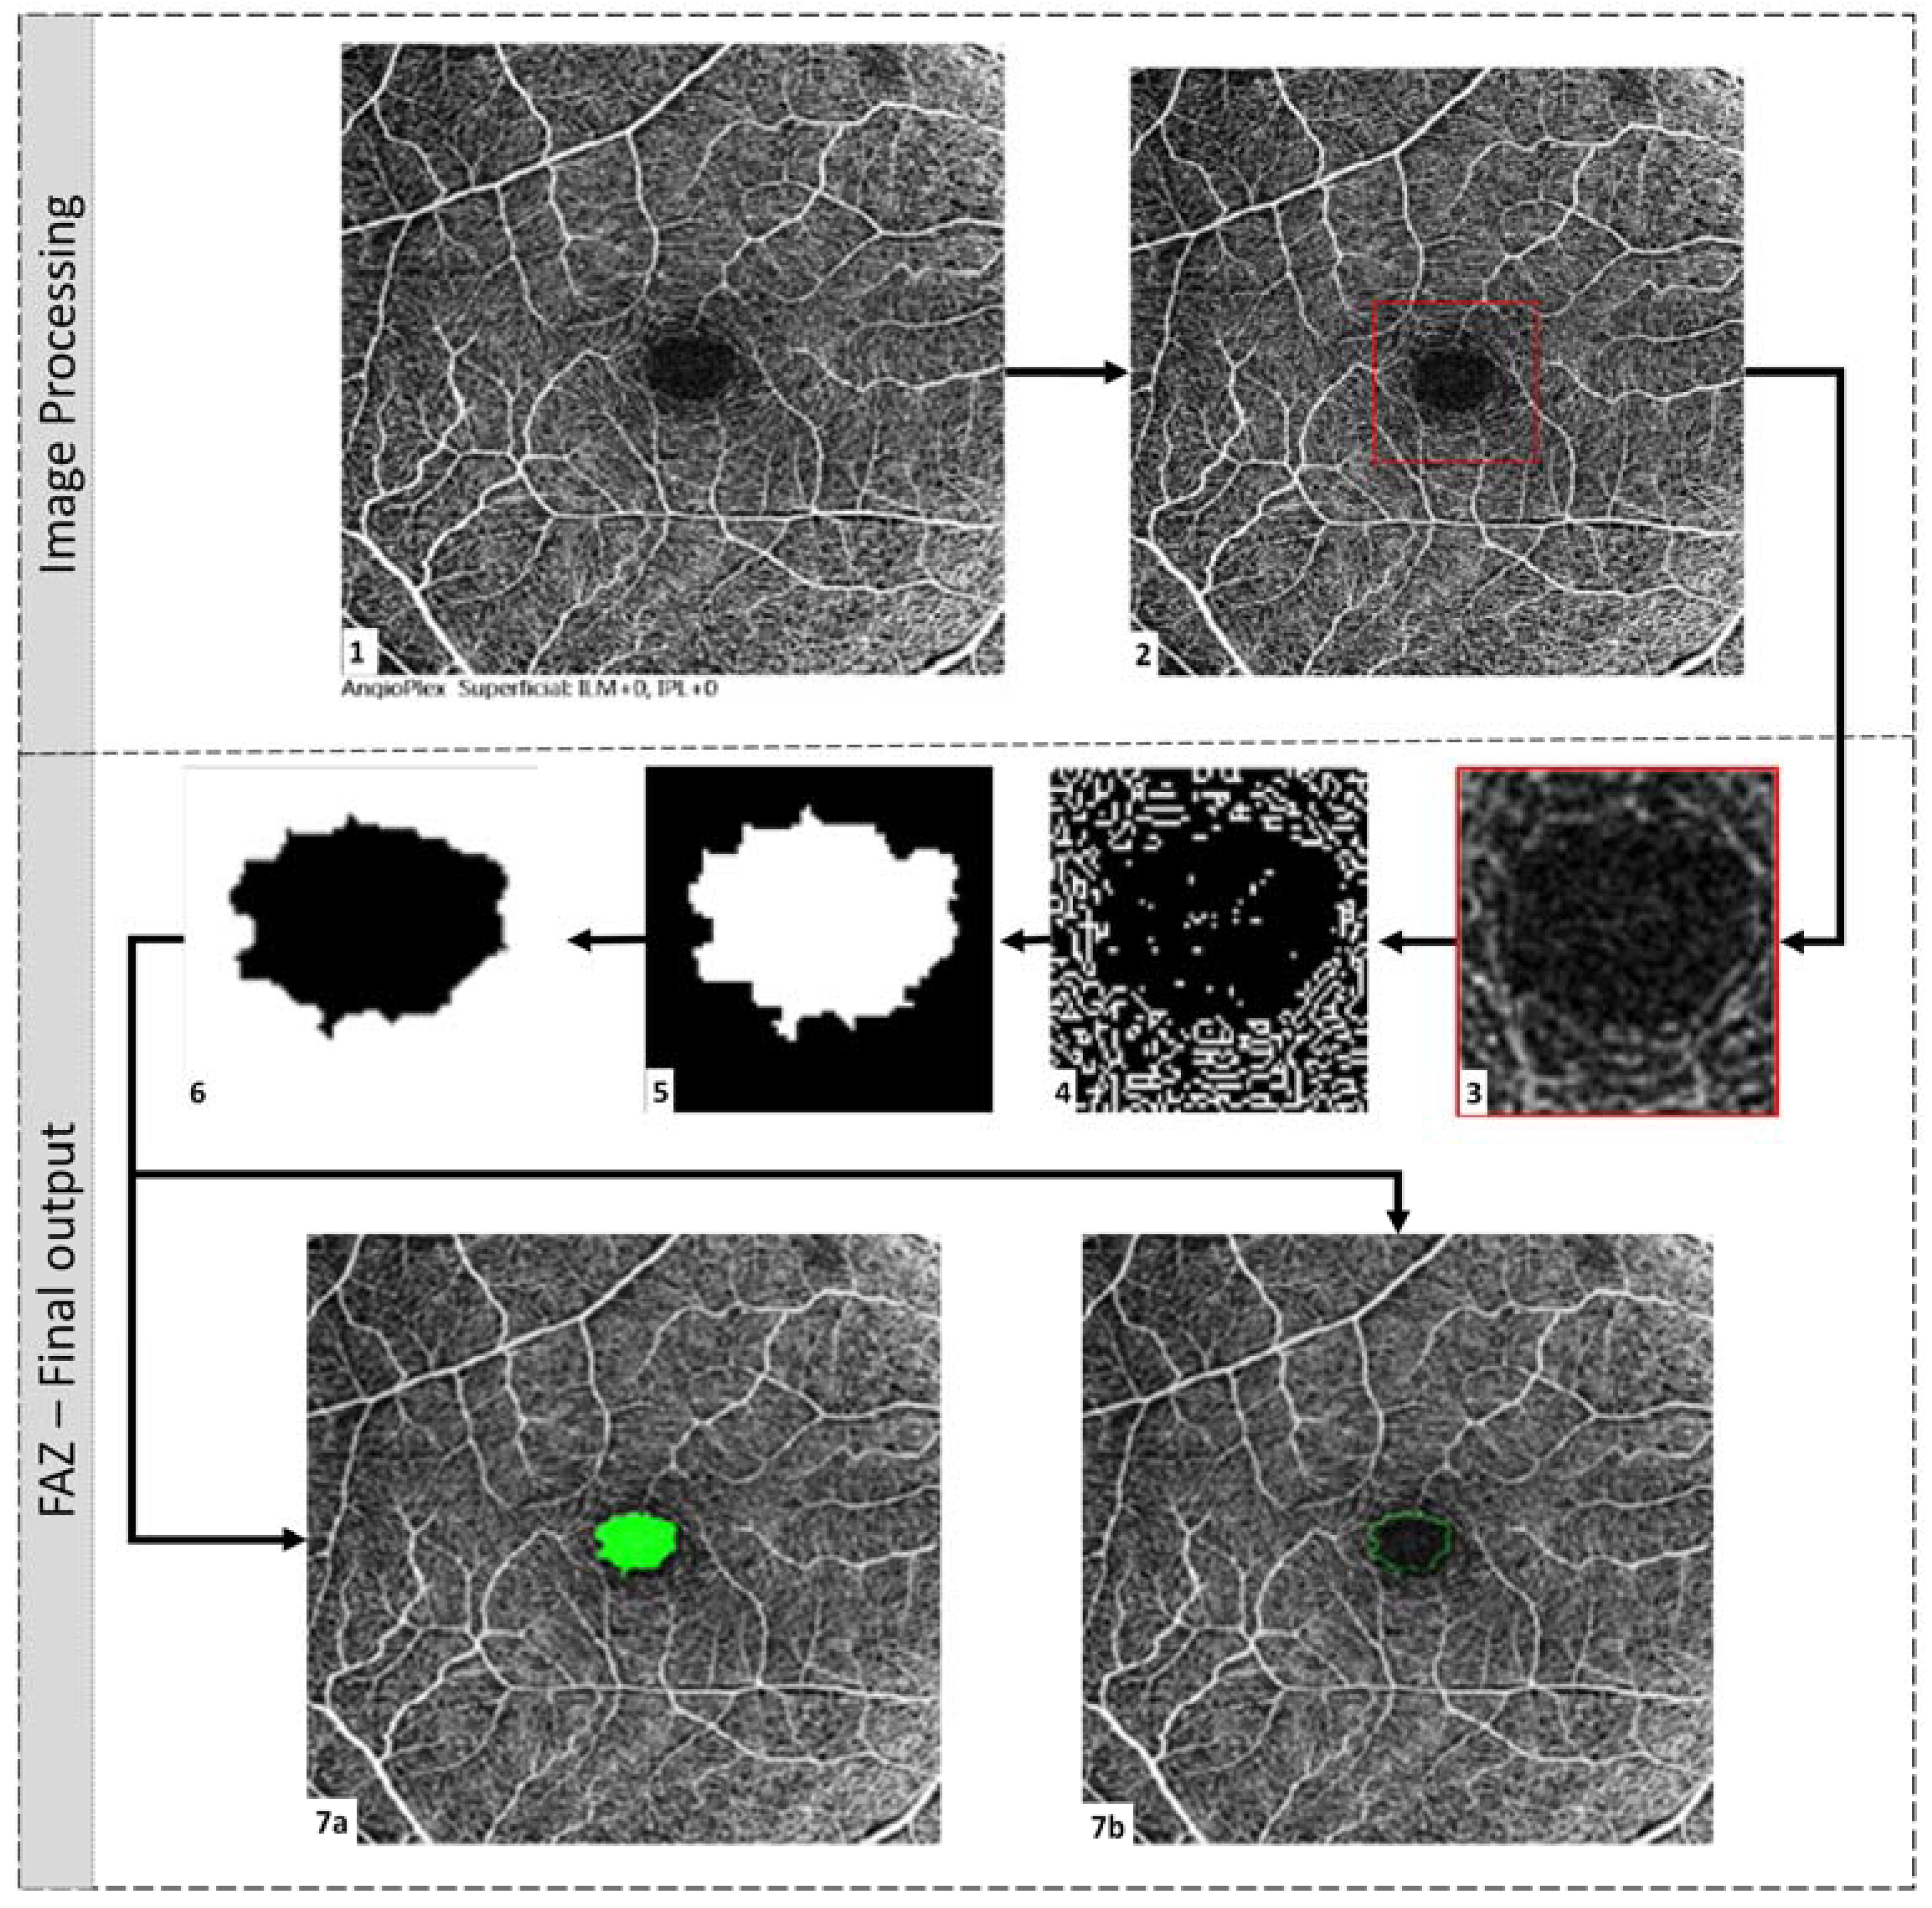
2.4. FAZ Parametric Calculations
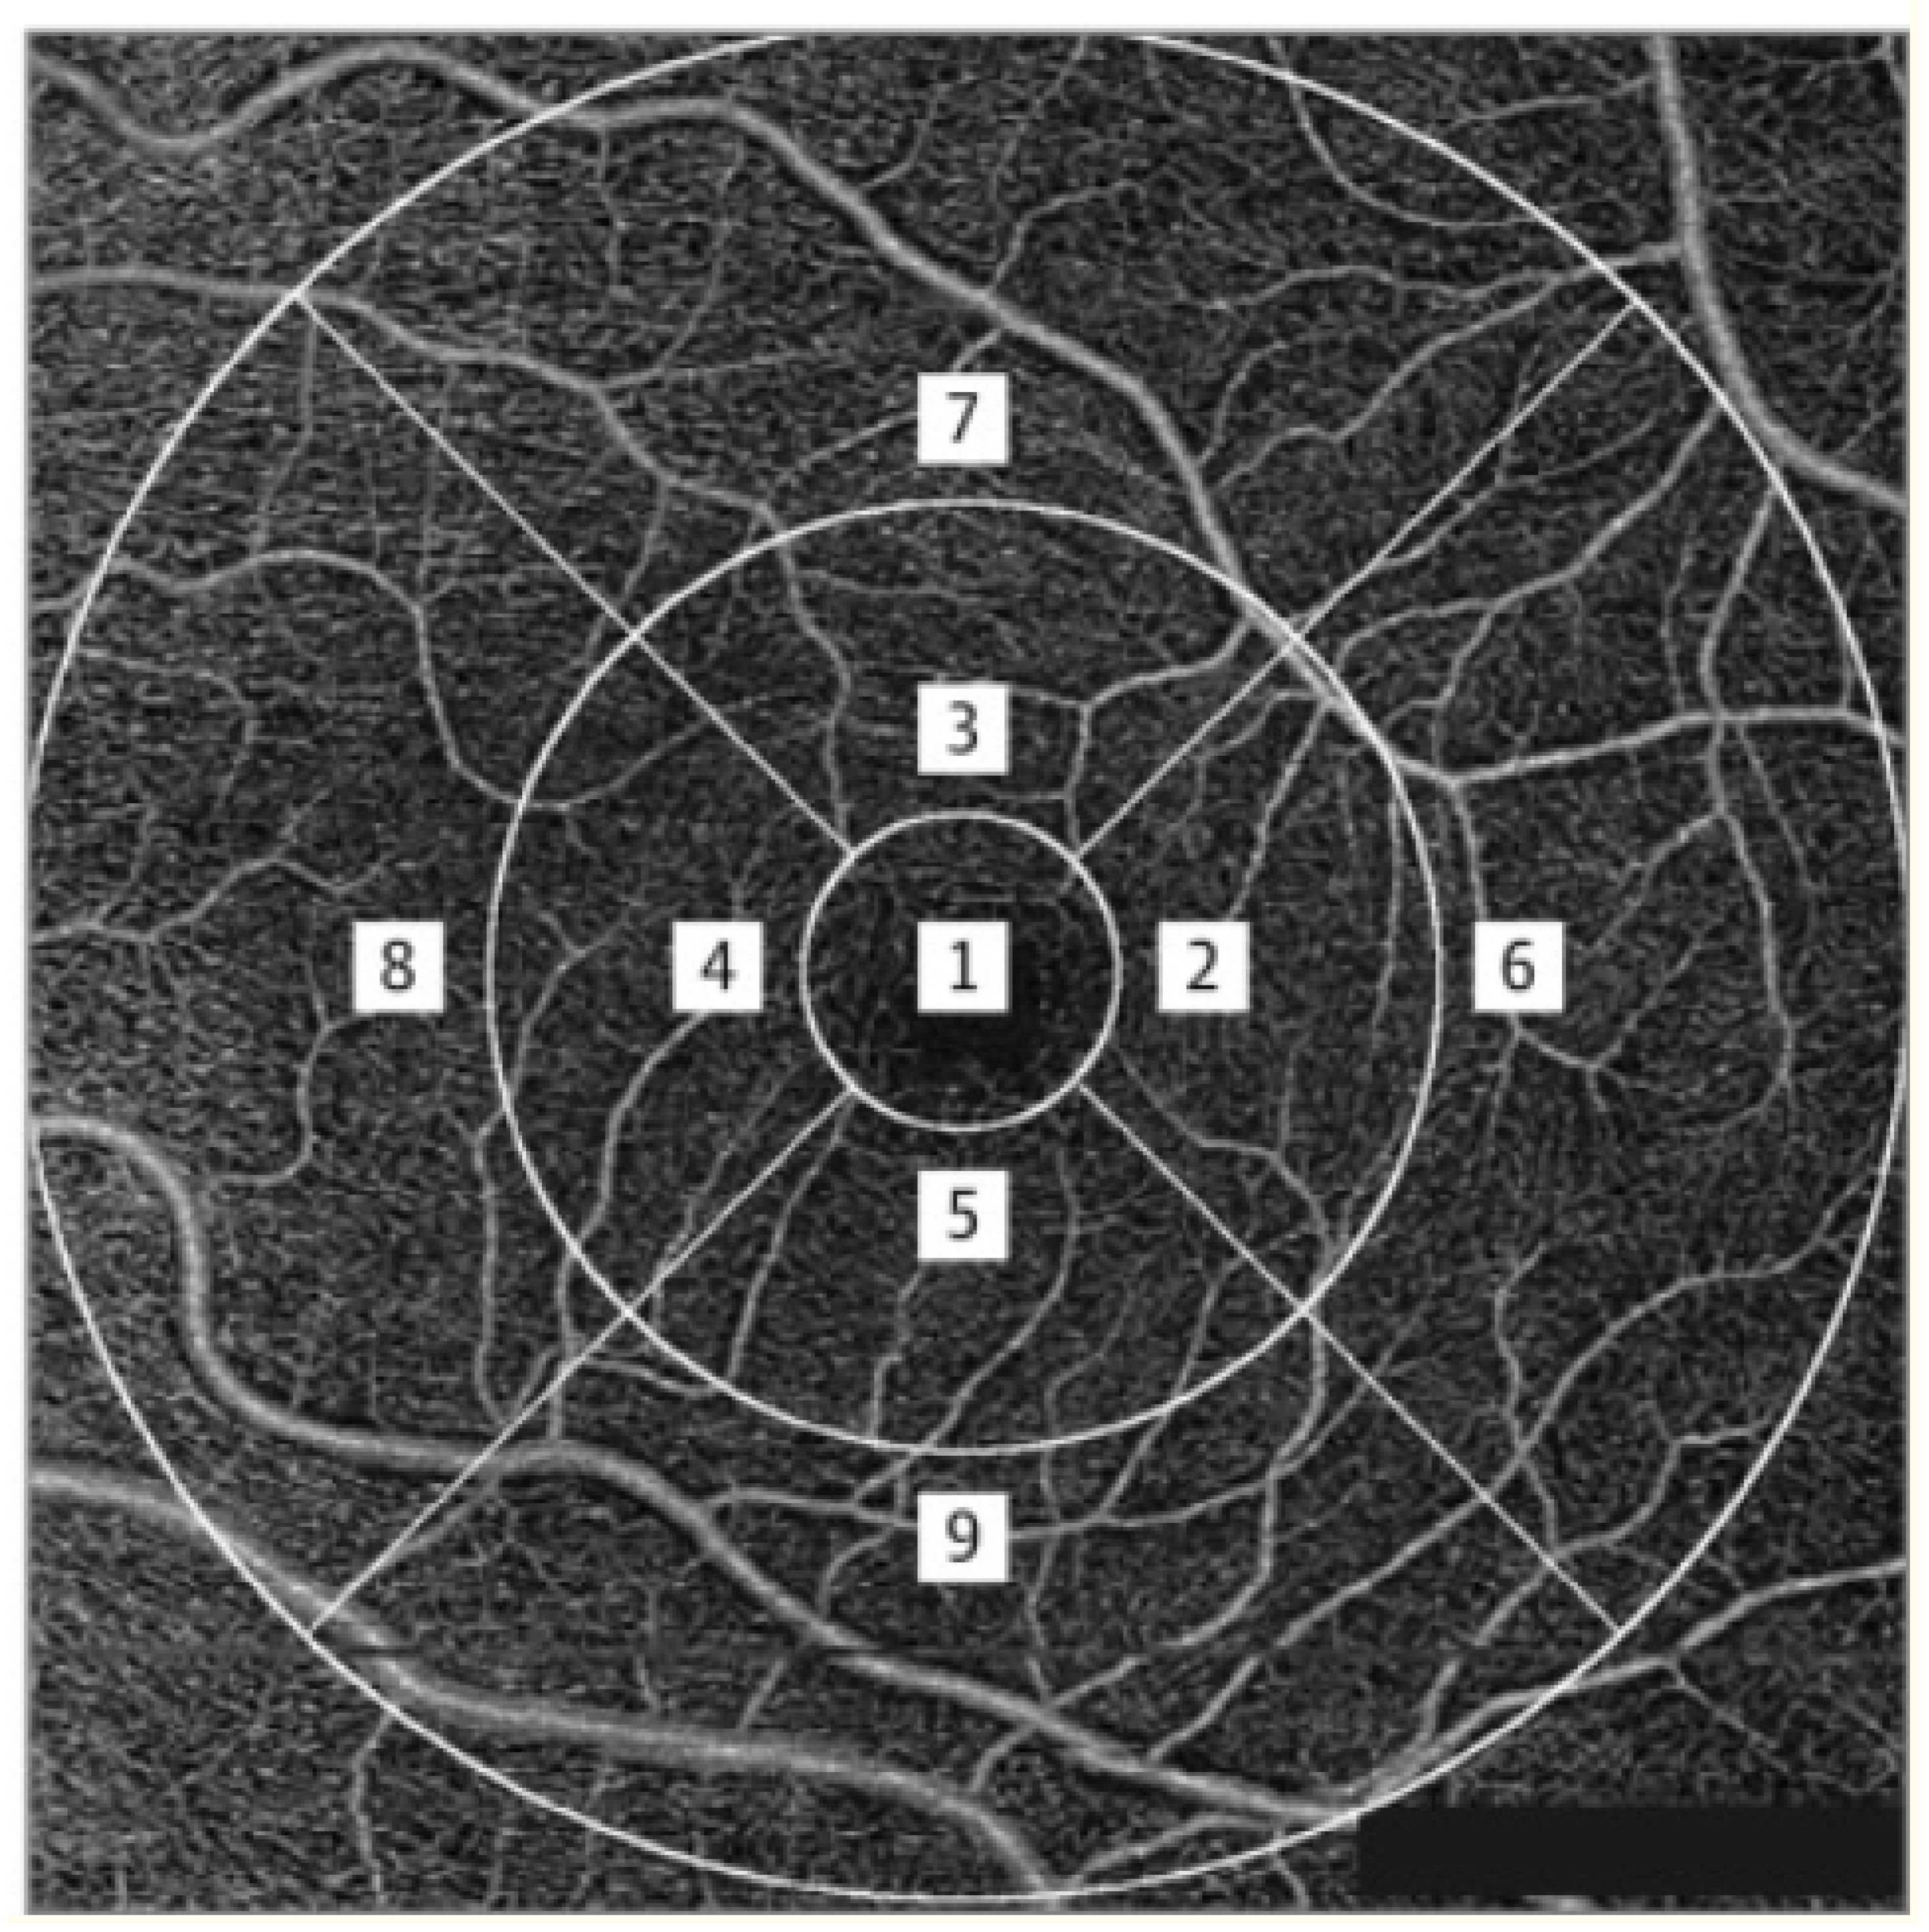
- Area (mm2): Area of FAZ, as shown in Figure 3, filled with green colour.
- Diameter (mm): The corresponding diameter of the circle with the same area.
- Major Axis (mm): Length (in pixels) of the ellipse’s major axis that has the same normalised second central moments as the FAZ region.
- Minor Axis (mm): Minor axis length of the same ellipse.
- Perimeter (mm): Length of the FAZ boundary.
- Eccentricity (mm): Measure of the departure of the region from circularity. For a circular region, eccentricity is essentially zero.
- Fmin (mm): Dimension of the most petite side of all rectangles that can completely contain FAZ, with every side of the rectangle tangent to the region.
- Fmax (mm): Dimension of the largest side of all rectangles that can completely contain FAZ, with every side of the rectangle tangent to the region.
- Inner circle radius (mm): The radius of the largest circle that can be inscribed in the FAZ region.
- Circumcircle radius (mm): The radius of the smallest circle circumscribing the FAZ region.
- Orientation of the major axis (degrees): The angle the ellipse makes with the horizontal axis.
- Blood vessel tortuosity (Dimensionless): Tortuosity describes the curve’s curvature based on twists and turns. Studies suggest that the thickness of the curve plays an important role in assessing tortuosity. The method indicated by Trucco et al. was used in this study to quantify tortuosity [11].
- Vessel diameter index (mm): The area occupied by the blood vessel from the binarised image over the total length of the blood vessel from the skeletonised image [12]. Qualitatively, it is the average diameter of all the vessels in the fundus image.
- Vessel avascular density (Dimensionless): Area occupied by vessels from the binarised image over the total area of the image. It is the density of vessels in the fundus image [12].
- Circularity index (Dimensionless): This dimension was calculated using both area and perimeter [13].
2.5. Statistical Analysis
3. Results
3.1. General Characteristics
3.2. Association of SCP with Response to Treatment with Intravitreal Anti-VEGF Injection
3.3. Association of DCP with Response to Treatment with Intravitreal Anti-VEGF Injection
3.4. Association of Characteristics of FAZ with Response to Treatment with Intravitreal Anti-VEGF Injection
4. Discussion
Author Contributions
Funding
Institutional Review Board Statement
Informed Consent Statement
Data Availability Statement
Acknowledgments
Conflicts of Interest
References
- Romero-Aroca, P. Targeting the pathophysiology of diabetic macular edema. Diabetes Care 2010, 33, 2484–2485. [Google Scholar] [CrossRef] [PubMed]
- Sang, D.N.; D’Amore, P.A. Is blockade of vascular endothelial growth factor beneficial for all types of diabetic retinopathy? Diabetologia 2008, 51, 1570–1573. [Google Scholar] [CrossRef] [PubMed]
- Diabetic Retinopathy Clinical Research Network; Wells, J.A.; Glassman, A.R.; Ayala, A.R.; Jampol, L.M.; Aiello, L.P.; Antoszyk, A.N.; Arnold-Bush, B.; Baker, C.W.; Bressler, N.M.; et al. Aflibercept, bevacizumab, or ranibizumab for diabetic macular edema. N. Engl. J. Med. 2015, 372, 1193–1203. [Google Scholar] [CrossRef] [PubMed]
- Tang, F.Y.; Chan, E.O.; Sun, Z.; Wong, R.; Lok, J.; Szeto, S.; Chan, J.C.; Lam, A.; Tham, C.C.; Ng, D.S.; et al. Clinically relevant factors associated with quantitative optical coherence tomography angiography metrics in deep capillary plexus in patients with diabetes. Eye Vis. 2020, 7, 7. [Google Scholar] [CrossRef] [PubMed]
- AttaAllah, H.R.; Mohamed, A.A.M.; Ali, M.A. Macular vessels density in diabetic retinopathy: Quantitative assessment using optical coherence tomography angiography. Int. Ophthalmol. 2019, 39, 1845–1859. [Google Scholar] [CrossRef] [PubMed]
- Lee, J.; Moon, B.G.; Cho, A.R.; Yoon, Y.H. Optical Coherence Tomography Angiography of DME and Its Association with Anti-VEGF Treatment Response. Ophthalmology 2016, 123, 2368–2375. [Google Scholar] [CrossRef] [PubMed]
- Parravano, M.; De Geronimo, D.; Scarinci, F.; Virgili, G.; Querques, L.; Varano, M.; Bandello, F.; Querques, G. Progression of Diabetic Microaneurysms According to the Internal Reflectivity on Structural Optical Coherence Tomography and Visibility on Optical Coherence Tomography Angiography. Am. J. Ophthalmol. 2019, 198, 8–16. [Google Scholar] [CrossRef] [PubMed]
- Busch, C.; Wakabayashi, T.; Sato, T.; Fukushima, Y.; Hara, C.; Shiraki, N.; Winegarner, A.; Nishida, K.; Sakaguchi, H.; Nishida, K. Retinal Microvasculature and Visual Acuity after Intravitreal Aflibercept in Diabetic Macular Edema: An Optical Coherence Tomography Angiography Study. Sci. Rep. 2019, 9, 1561. [Google Scholar] [CrossRef]
- Agarwal, A.; Jothi Balaji, J.; Lakshminarayanan, V. Agarwal, A.; Jothi Balaji, J.; Lakshminarayanan, V. A new technique for estimating the foveal avascular zone dimensions. In Proceedings Volume 11218, Ophthalmic Technologies XXX; SPIE: Bellingham, DC, USA, 2020; Volume 112181R. [Google Scholar]
- Viekash, V.K.; Jothi Balaji, J.; Lakshminarayanan, V. FAZSeg: A New Software for Quantification of the Foveal Avascular Zone. Clin. Ophthalmol. 2021, 15, 4817–4827. [Google Scholar] [CrossRef]
- Trucco, E.; Azegrouz, H.; Dhillon, B. Modeling the tortuosity of retinal vessels: Does caliber play a role? IEEE Trans. Bio-Med. Eng. 2010, 57, 2239–2247. [Google Scholar] [CrossRef]
- Kim, A.Y.; Chu, Z.; Shahidzadeh, A.; Wang, R.K.; Puliafito, C.A.; Kashani, A.H. Quantifying Microvascular Density and Morphology in Diabetic Retinopathy Using Spectral-Domain Optical Coherence Tomography Angiography. Investig. Ophthalmol. Vis. Sci. 2016, 57, OCT362–OCT370. [Google Scholar] [CrossRef] [PubMed]
- Choi, J.; Kwon, J.; Shin, J.W.; Lee, J.; Lee, S.; Kook, M.S. Quantitative optical coherence tomography angiography of macular vascular structure and foveal avascular zone in glaucoma. PLoS ONE 2017, 12, e0184948. [Google Scholar] [CrossRef]
- Nesper, P.L.; Roberts, P.K.; Onishi, A.C.; Chai, H.; Liu, L.; Jampol, L.M.; Fawzi, A.A. Quantifying Microvascular Abnormalities With Increasing Severity of Diabetic Retinopathy Using Optical Coherence Tomography Angiography. Investig. Ophthalmol. Vis. Sci. 2017, 58, BIO307–BIO315. [Google Scholar] [CrossRef] [PubMed]
- Durbin, M.K.; An, L.; Shemonski, N.D.; Soares, M.; Santos, T.; Lopes, M.; Neves, C.; Cunha-Vaz, J. Quantification of retinal microvascular density in optical coherence tomographic angiography images in diabetic retinopathy. JAMA Ophthalmol. 2017, 135, 370–376. [Google Scholar] [CrossRef]
- Veiby, N.C.B.B.; Simeunovic, A.; Heier, M.; Brunborg, C.; Saddique, N.; Moe, M.C.; Dahl-Jørgensen, K.; Margeirsdottir, H.D.; Petrovski, G. Associations between Macular OCT Angiography and Nonproliferative Diabetic Retinopathy in Young Patients with Type 1 Diabetes Mellitus. J. Diabetes Res. 2020, 2020, 8849116. [Google Scholar] [CrossRef]
- Hsieh, Y.T.; Alam, M.N.; Le, D.; Hsiao, C.C.; Yang, C.H.; Chao, D.L.; Yao, X. OCT Angiography Biomarkers for Predicting Visual Outcomes after Ranibizumab Treatment for Diabetic Macular Edema. Ophthalmol. Retin. 2019, 3, 826–834. [Google Scholar] [CrossRef]
- Park, Y.G.; Park, Y.H. Quantitative Analysis of Retinal Microvascular Perfusion and Novel Biomarkers of the Treatment Response in Diabetic Macular Edema. J. Diabetes Res. 2020, 2020, 2132037. [Google Scholar] [CrossRef] [PubMed]
- Cheong, K.X.; Lee, S.Y.; Ang, M.; Teo, K.Y.C. Vessel Density Changes on Optical Coherence Tomography Angiography after Vascular Endothelial Growth Factor Inhibitor Treatment for Diabetic Macular Edema. Turk. J. Ophthalmol. 2020, 50, 343–350. [Google Scholar] [CrossRef]
- Bresnick, G.H.; Condit, R.; Syrjala, S.; Palta, M.; Groo, A.; Korth, K. Abnormalities of the foveal avascular zone in diabetic retinopathy. Arch. Ophthalmol. 1984, 102, 1286–1293. [Google Scholar] [CrossRef]
- Hartnett, M.E.; Martiniuk, D.; Byfield, G.; Geisen, P.; Zeng, G.; Bautch, V.L. Neutralizing VEGF decreases tortuosity and alters endothelial cell division orientation in arterioles and veins in a rat model of ROP: Relevance to plus disease. Investig. Ophthalmol. Vis. Sci. 2008, 49, 3107–3114. [Google Scholar] [CrossRef]
- Sasongko, M.B.; Wong, T.Y.; Nguyen, T.T.; Cheung, C.Y.; Shaw, J.E.; Wang, J.J. Retinal vascular tortuosity in persons with diabetes and diabetic retinopathy. Diabetologia 2011, 54, 2409–2416. [Google Scholar] [CrossRef] [PubMed]
- Weiler, D.L.; Engelke, C.B.; Moore, A.L.; Harrison, W.W. Arteriole tortuosity associated with diabetic retinopathy and cholesterol. Optom. Vis. Sci. Off. Publ. Am. Acad. Optom. 2015, 92, 384–391. [Google Scholar] [CrossRef] [PubMed]


| Parameter | Responder | Non-Responder | p-Value |
|---|---|---|---|
| (N = 30) | (N = 31) | ||
| Age (years) | 57.50 ± 6.50 | 60.10 ± 8.43 | 0.187 |
| Gender | |||
| Male | 20 (66.7) | 22 (73.3) | 0.637 |
| Female | 10 (33.3) | 8 (26.7) | |
| Duration of diabetes (in years) | 13.83 ± 7.52 | 14.79 ± 9.48 | 0.669 |
| CST (in microns) | 494.0 ± 161.50 | 421.7 ± 121.68 | 0.042 |
| BCVA (logMAR) | 0.5 ± 0.3 | 0.6 ± 0.3 | 0.198 |
| Parameter | Responder | Non-Responder | p-Value |
|---|---|---|---|
| (N = 30) | (N = 31) | ||
| SCP parameters | |||
| Vessel density central ring | 10.18 ± 4.41 | 9.69 ± 4.58 | 0.806 |
| Vessel density inner ring | 15.11 ± 2.92 | 14.28 ± 3.59 | 0.247 |
| Vessel density outer ring | 15.5 ± 2.2 | 14.55 ± 3.57 | 0.022 |
| Vessel density full ring | 15.29 ± 2.4 | 14.24 ± 3.51 | 0.077 |
| Perfusion density central ring | 22.89 ± 10.06 | 21.66 ± 10.87 | 0.756 |
| Perfusion density inner ring | 36.96 ± 7.81 | 34.1 ± 9.48 | 0.281 |
| Perfusion density outer ring | 38.79 ± 5.9 | 36.17 ± 9.6 | 0.012 |
| Perfusion density full ring | 37.93 ± 6.22 | 35.41 ± 9.32 | 0.044 |
| Vessel tortuosity | 1.34 ± 0.39 | 1.37 ± 0.28 | 0.306 |
| Vessel avascular density | 0.47 ± 0.14 | 0.43 ± 0.10 | 0.354 |
| Vessel diameter index | 28.85 ± 8.63 | 29.29 ± 6.67 | 0.464 |
| DCP parameters | |||
| Vessel tortuosity | 1.38 ± 0.29 | 1.32 ± 0.27 | 0.376 |
| Vessel avascular density | 0.35 ± 0.10 | 0.33 ± 0.08 | 0.276 |
| Vessel diameter index | 27.01 ± 7.88 | 33.56 ± 16.95 | 0.000 |
| SCP–FAZ Characteristics | DCP–FAZ Characteristics | |||||
|---|---|---|---|---|---|---|
| Parameter | Responder | Non Responder | p-Value | Responder | Non Responder | p-Value |
| (N = 30) | (N = 31) | (N = 30) | (N = 31) | |||
| Equiv. diameter | 572.87 ± 231.42 | 582.96 ± 217.95 | 0.864 | 872.13 ± 331.82 | 909.08 ± 355.06 | 0.682 |
| Major axis length | 645.78 ± 289.11 | 663.61 ± 297.77 | 0.813 | 1036.76 ± 536.33 | 1134.09 ± 487.41 | 0.461 |
| Minor axis length | 497.63 ± 230.54 | 507.2 ± 208.75 | 0.866 | 734.01 ± 287.09 | 769.76 ± 296.48 | 0.641 |
| Eccentricity | 77.5 ± 43.29 | 85.87 ± 48.82 | 0.482 | 145.07 ± 101.36 | 160.25 ± 97.76 | 0.554 |
| F minimum | 510.89 ± 237.74 | 522.27 ± 214.88 | 0.845 | 704.66 ± 337.75 | 796.44 ± 300.9 | 0.267 |
| F maximum | 690.35 ± 273.28 | 717.16 ± 282.43 | 0.713 | 1141.52 ± 470.48 | 1184.95 ± 519.21 | 0.739 |
| Inner circle radius | 229.85 ± 96.91 | 234.35 ± 86.75 | 0.851 | 335.49 ± 133.96 | 356.26 ± 144.49 | 0.571 |
| Circumference of circle radius | 347.47 ± 137.61 | 362.22 ± 141.4 | 0.687 | 573.25 ± 234.8 | 594.07 ± 259.11 | 0.749 |
| Orientation | −9.87 ± 37.51 | −2.56 ± 47.17 | 0.514 | −5.42 ± 34.84 | 5.16 ± 32.63 | 0.233 |
| Area | 0.3 ± 0.2 | 0.3 ± 0.24 | 0.955 | 0.68 ± 0.51 | 0.74 ± 0.53 | 0.643 |
| Perimeter | 1918.45 ± 872.91 | 1976.29 ± 842.98 | 0.793 | 2984.53 ± 1428.02 | 3317.63 ± 1405.74 | 0.362 |
| Circularity | 0.77 ± 0.24 | 0.79 ± 0.19 | 0.382 | 0.73 ± 0.20 | 0.75 ± 0.20 | 0.742 |
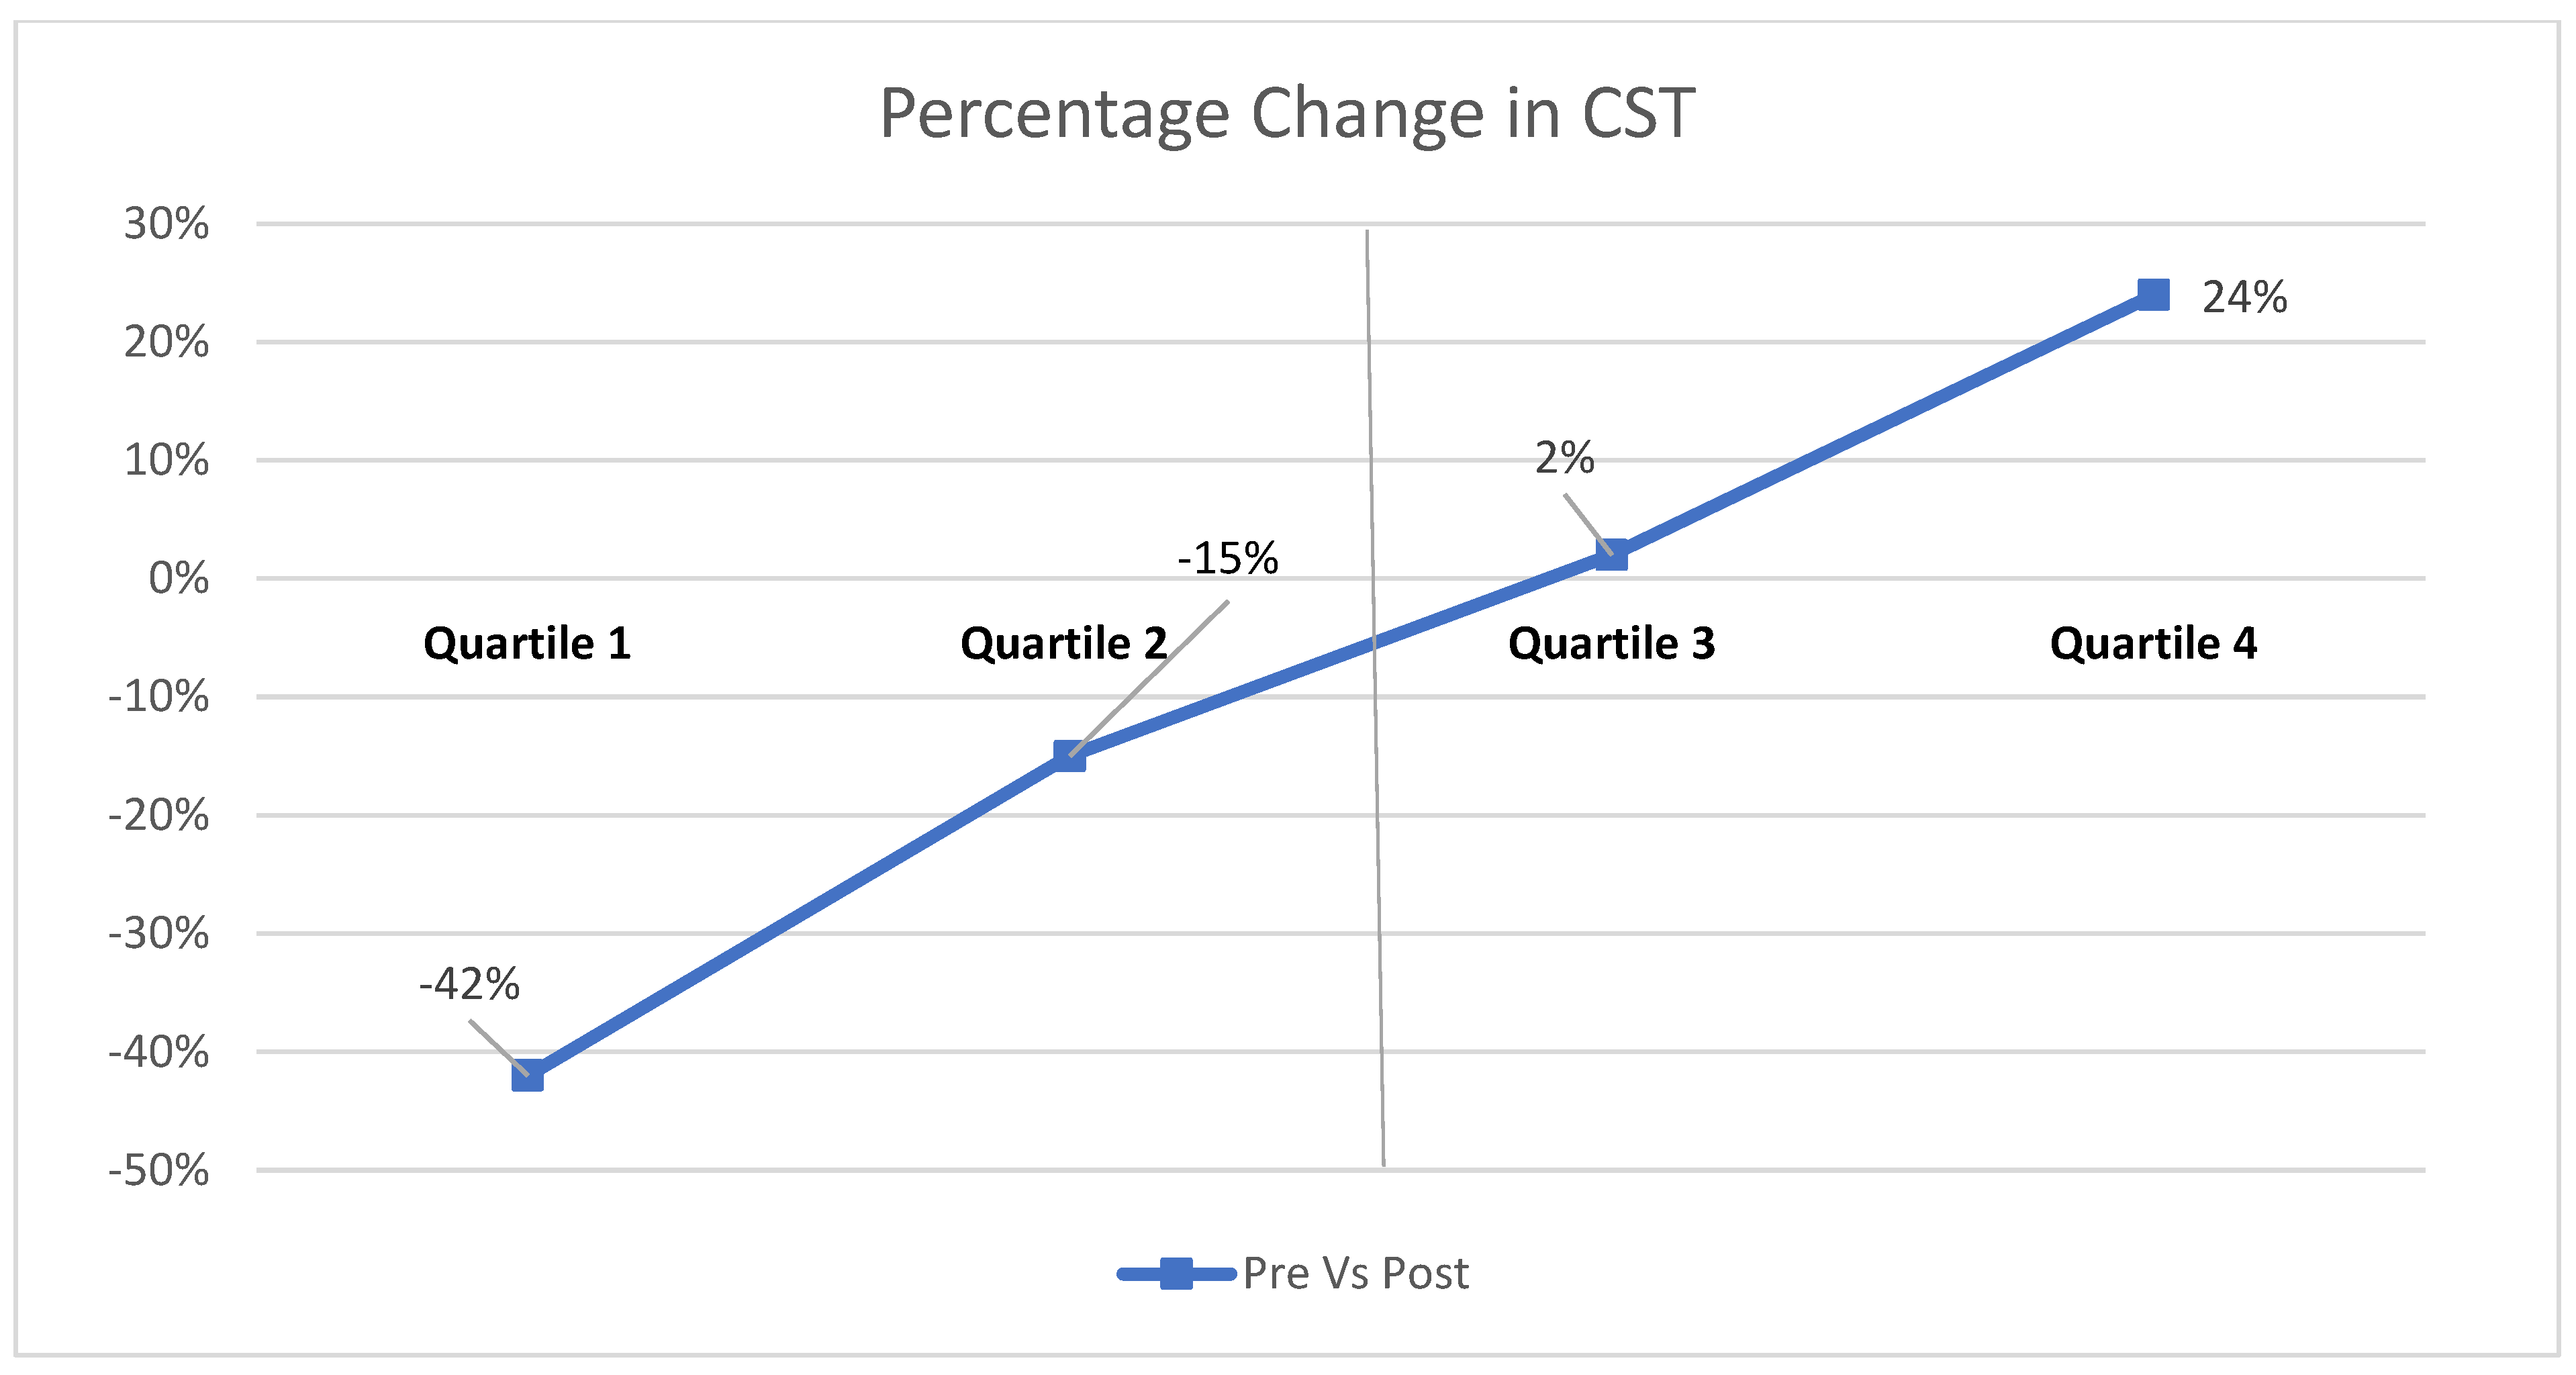
| Parameter | Responder | Non-Responder | Mean Difference | Percentage Decrease % | Status |
|---|---|---|---|---|---|
| Vessel density outer ring | 15.5 | 14.55 | 0.95 | −6.13 | Decreased |
| Vessel density full ring | 15.29 | 14.24 | 1.05 | −6.87 | Decreased |
| Perfusion density full ring | 37.93 | 35.41 | 2.52 | −6.64 | Decreased |
| Foveal avascular zone circularity | 0.51 | 0.49 | 0.02 | −3.92 | Decreased |
| Vessel diameter index in deep capillary plexus | 26.75 | 34.26 | −7.51 | 28.07 | Increased |
Disclaimer/Publisher’s Note: The statements, opinions and data contained in all publications are solely those of the individual author(s) and contributor(s) and not of MDPI and/or the editor(s). MDPI and/or the editor(s) disclaim responsibility for any injury to people or property resulting from any ideas, methods, instructions or products referred to in the content. |
© 2023 by the authors. Licensee MDPI, Basel, Switzerland. This article is an open access article distributed under the terms and conditions of the Creative Commons Attribution (CC BY) license (https://creativecommons.org/licenses/by/4.0/).
Share and Cite
Chouhan, S.; Kalluri Bharat, R.P.; Surya, J.; Mohan, S.; Balaji, J.J.; Viekash, V.K.; Lakshminarayanan, V.; Raman, R. Preliminary Report on Optical Coherence Tomography Angiography Biomarkers in Non-Responders and Responders to Intravitreal Anti-VEGF Injection for Diabetic Macular Oedema. Diagnostics 2023, 13, 1735. https://doi.org/10.3390/diagnostics13101735
Chouhan S, Kalluri Bharat RP, Surya J, Mohan S, Balaji JJ, Viekash VK, Lakshminarayanan V, Raman R. Preliminary Report on Optical Coherence Tomography Angiography Biomarkers in Non-Responders and Responders to Intravitreal Anti-VEGF Injection for Diabetic Macular Oedema. Diagnostics. 2023; 13(10):1735. https://doi.org/10.3390/diagnostics13101735
Chicago/Turabian StyleChouhan, Sanjana, Rekha Priya Kalluri Bharat, Janani Surya, Sashwanthi Mohan, Janarthanam Jothi Balaji, V. K. Viekash, Vasudevan Lakshminarayanan, and Rajiv Raman. 2023. "Preliminary Report on Optical Coherence Tomography Angiography Biomarkers in Non-Responders and Responders to Intravitreal Anti-VEGF Injection for Diabetic Macular Oedema" Diagnostics 13, no. 10: 1735. https://doi.org/10.3390/diagnostics13101735
APA StyleChouhan, S., Kalluri Bharat, R. P., Surya, J., Mohan, S., Balaji, J. J., Viekash, V. K., Lakshminarayanan, V., & Raman, R. (2023). Preliminary Report on Optical Coherence Tomography Angiography Biomarkers in Non-Responders and Responders to Intravitreal Anti-VEGF Injection for Diabetic Macular Oedema. Diagnostics, 13(10), 1735. https://doi.org/10.3390/diagnostics13101735