Abstract
This paper introduces a new method for real-time high-density impulsive noise elimination applied to medical images. A double process aimed at the enhancement of local data composed of Nested Filtering followed by a Morphological Operation (NFMO) is proposed. The major problem with heavily noisy images is the lack of color information around corrupted pixels. We show that the classic replacement techniques all come up against this problem, resulting in average restoration quality. We only focus on the corrupt pixel replacement phase. For the detection itself, we use the Modified Laplacian Vector Median Filter (MLVMF). To perform pixel replacement, two-window nested filtering is suggested. All noise pixels in the neighborhood scanned by the first window are investigated using the second window. This investigation phase increases the amount of useful information within the first window. The remaining useful information that the second window failed to produce in the case of a very strong connex noise concentration is then estimated using a morphological operation of dilatation. To validate the proposed method, NFMO is first evaluated on the standard image Lena with a range of 10% to 90% impulsive noise. Using the Peak Signal-to-Noise Ratio metric (PSNR), the image denoising quality obtained is compared to the performance of a wide variety of existing approaches. Several noisy medical images are subjected to a second test. In this test, the computation time and image-restoring quality of NFMO are assessed using the PSNR and the Normalized Color Difference (NCD) criteria. Finally, an optimized design for a field-programmable gate array (FPGA) is suggested to implement the proposed method for real-time processing. The proposed solution performs excellent quality restoration for images with high-density impulsive noise. When the proposed NFMO is used on the standard Lena image with 90% impulsive noise, the PSNR reaches 29.99 dB. Under the same noise conditions, NFMO completely restores medical images in an average time of 23 milliseconds with an average PSNR of 31.62 dB and an average NCD of 0.10.
1. Introduction
Noise reduction is a critical process in image processing. It is necessary to reduce the level of noise present in an image to obtain clear, distinguishable shapes and structures. Achieving this requires understanding the sources of noise in the image and using various techniques to reduce these sources. Impulsive noise, also known as salt and pepper noise, is a type of noise with a high dynamic range that results from extreme pixel values. It is caused by errors in transmission, analog-to-digital conversion, and data acquisition. Impulsive noise can be quite challenging to reduce from an image, as it is typically randomly distributed, making it difficult to distinguish from the true image features. One strategy for reducing impulsive noise is using median filtering, which replaces each pixel with the median value of its neighbors [1,2,3,4,5]. This reduces the effect of impulsive noise while preserving other image features. Another option is to use a non-linear filter, such as a morphological filter [6,7,8,9]. This smooths the edges of objects while preserving their shapes and is effective at removing impulsive noise. Depending on the type of image to be processed, the amount of noise in the image, or the constraints on the execution time, several more sophisticated approaches have emerged. The weighted vector filters [10,11], adaptive vector filters [12,13,14,15,16,17,18,19], hybrid vector filters [20,21], fuzzy vector filters [22,23,24], and vector filters based on neural networks [25,26,27,28] are the most notable examples.
Our objective in this study is to create a real-time architecture that can restore, as accurately as possible, medical images with high-density impulsive noise. The classification accuracy of these kinds of images is directly related to the quality of the restoration that is performed. Indeed, a variety of types of noise can distort medical images. Impulsive noise, Rician noise, Gaussian noise as well as quantum mottle noise are among the most common [29,30,31,32]. We are particularly interested here in impulsive noise. The classification of medical images has received increased interest from scientists over the past three decades [33]. In several clinical applications, medical images based on Magnetic Resonance (MRI), Computed Tomography (CT), or Positron Emission Tomography (PET) allow the diagnosis of pathologies, sometimes even very early. This allows the right plan for healing to be put in place [34].
Recent literature contains a multitude of methods for denoising images with high-density impulsive noise. There are first the methods employing the median filter. These methods are the most prevalent in published works. The goal is to improve the median filter’s ability to detect and restore corrupted pixels. Among these methods, we can specifically mention the Adaptive Switching Weighted Median Filter (ASWM) [35], the Noise Adaptive Fuzzy Switching Median Filter (NAFSM) [36], the Modified Decision-Based Un-symmetric Trimmed Median Filter (MDBUTMF) [37], and the Adaptive Dynamically Weighted Median Filter (ADWMF) [38]. There are also interpolation-based methods, such as the Adaptive Decision Based Inverse Distance Weighted Interpolation (DBIDWI) [39] and the Adaptive Decision based Kriging Interpolation Filter (ADKIF) [40]. A third family of methods exploits probability and statistical calculations to restore high-density impulsive noise images. Probabilistic Decision Based Filter (PDBF) [41], Adaptive Probability Filter (APF) [42], and Based-on-Pixel Density Filter (BPDF) [43] are distinguished members of this family. There are also proposals for methods that are less conventional, such as the Adaptive Content based Closer Proximity Pixel Replacement Algorithm (ACCPPRA) [44] based on a heuristic decision tree, the Adaptive Weighted Mean Filter (AWMF) [45] where the noise candidate is replaced by the weighted mean of a specific window, and the Adaptive Cardinal B-Spline Algorithm (ACBSA) [46] which perform a local cardinal B-spline proprieties analysis. All of the methods listed here aim to restore images with significant noise. They each exploit the neighborhood in their own way. This neighborhood is severely lacking in data, with the majority of pixels being corrupted. Even though these methods implicitly invoke an increase in useful information, none has explicitly proposed a thorough investigation of the neighborhood with the intention of restoring it before estimating the central corrupted pixel.
In this paper, we propose a deep investigation of the area around corrupted pixels in order to obtain more useful information. Our algorithm performs a nested filtering process using two windows. The first, called the main window, will be centered around the noisy pixel. It will identify neighboring pixels in order to estimate its new value. These neighboring pixels are mainly noisy and do not participate in the estimation of the final value. To remedy this, a second window called the secondary window is launched around each corrupt neighboring pixel. The mission of the secondary window is to collect as much information as possible around each corrupt neighboring pixel and deduce its possible value from the median of this information. This process will increase the amount of non-noisy information around the main pixel to be corrected. Ideally, all noisy neighbors should be corrected. This is not always the case when the noise is very loud. At this moment, a morphological operation intervenes to complete the missing information. The nested filtering process leaves gaps that a proposed addition operation in the sense of Minkowski fills [47]. The proposed method is referred to as “NFMO” (Nested Filtering followed by a Morphological Operation) in the rest of this paper.
To evaluate the performance of the proposed NFMO, we proceed in two steps. Initial evaluation of NFMO is performed on the standard images Lena, Boat, and Baboon with 10% to 90% impulsive noise. Using the PSNR metric, the quality of images restoration is compared to the performances of ASWM, NAFSM, MDBUTMF, ADWMF, DBIDWI, ADKIF, PDBF, APF, BPDF, ACCPPRA, AWMF, and ACBSA in the case of Lena image. For Boat and Baboon images, the comparison using the PSNR metric is performed with MDBUTMF, DBIDWI, ADKIF, ACCPPRA, AWMF, and ACBSA. These methods were chosen for three reasons: They deal with the issue of denoising images highly contaminated by impulsive noise, are part of recent literature, and belong to a variety of families. A second, more specific evaluation of the NFMO’s performance is proposed in this work. In fact, in addition to the major contribution proposed by the NFMO, another substantial contribution is introduced. A hardware implementation of the NFMO is proposed. Our goal is to provide an embedded denoising algorithm that can be applied to medical images. As a result, a second evaluation is carried out on a set of high-density impulsive noisy medical images. The performance of the proposed NFMO is evaluated in terms of processing time and quality of image restoration as measured by the PSNR and the NCD metrics.
Hardware acceleration has been utilized by the scientific community to minimize implementation complexity. In [48], the authors employ two distinct hardware designs to create conventional and multi-level median filters. Ref.[49] presents a unique window median filtering approach based on a bit-serial sorting algorithm with fast operating speed and minimal hardware complexity. In [50] is detailed a hardware implementation of the Vector Median-Rational Hybrid Filters for color images. Using approximations, this hardware design simplifies the implementation of relational functions. For effective Vector Median Filter implementation, ref.[51] suggests a fast parallel design. Vector Median Filter implementations in this design resemble L2 norms. Nevertheless, the creation of these hardware designs takes longer, and they cannot be modified. These systems are constructed and implemented using Low-Level Synthesis and Hardware Description Language (HDL) on a Field-Programmable Gate Array (FPGA) circuit. Using a Low-Level Synthesis design, the Register Transfer Level (RTL) description may be adjusted to generate an excellent and efficient netlist. Developing an RTL description is arduous and time-consuming, particularly for complicated applications [52,53,54]. In fact, each low-level circuit’s operations must be specified. Complex systems can only be developed by hardware designers with specific knowledge and abilities. In order to simplify the complexity of the FPGA design, Low-Level Synthesis must be replaced by High-Level Synthesis (HLS) [55,56,57]. Using software high-level languages (systemC, C/C + +, etc.), the HLS tool transforms coded algorithms into a structural and behavioral RTL hardware description. As a consequence, various commercial and academic HLS tools, such as Xilinx Vivado HLS, Intel OpenCL, Catapult-C, and ROCCC, are being developed. Thus, the goal of this research is to build several hardware designs for the NFMO’s proposed denoising algorithm utilizing HLS flow. When creating these designs, the cost and speed of the FPGA were considered. Using the Xilinx Zynq FPGA, the best-designed architecture will be built and evaluated.
This paper is organized as follows: In Section 2, MLVMF-based impulsive noise detection is presented. This algorithm will be used to detect corrupted pixels in the image. Proposed local data enhancement by nested filtering is the subject of Section 3, while Section 4 explains the missing information estimation process performed by the morphological tools. Section 5 shows the proposed NFMO performances using the standard images Lena, Boat, and Baboon, as well as a set of medical images. Finally, Section 6 describes the HLS designs for the proposed NFMO.
2. MLVMF-Based Impulsive Noise Detection
The impulsive noise removal process consists of two main steps: finding the noise and replacing the noisy pixel. Our first contribution in this work is to propose a method for replacing noisy pixels. For the detection phase, we are inspired by the very recent MLVMF method [58]. We have shown in [58] that the MLVMF has a high accuracy of impulsive noise detection, especially when the density of this noise is very high. In addition, the MLVMF has been designed for a hardware implementation, which fits perfectly with our final objective: to propose an embedded algorithm for the denoising of highly corrupted medical images.
MLVMF uses a modified Laplacian filter with a rotation step of π/8 to observe the intensity variations around each pixel of an image. Classic Laplacian filters typically employ rotation steps of π/2 or π/4. Reducing the angle of rotation around the pixel enables the use of additional information about its surrounding area. Figure 1 shows the first set of filters used by the MLVMF to identify corrupted pixels. However, the identification process can still fail in the presence of a significant amount of impulsive noise. Two or more pixels with identical intensities (0 or 255) can be 4-connected or 8-connected if they are noisy. The local second derivative surrounding this type of pixel will be incapable of detecting significant variations. A second round of searching is initiated to identify the neighboring noisy pixels. A second set of filters, described in Figure 2, calculates, in eight directions, the intensity variations surrounding each pixel of the image, ignoring the eight pixels that are immediately adjacent.
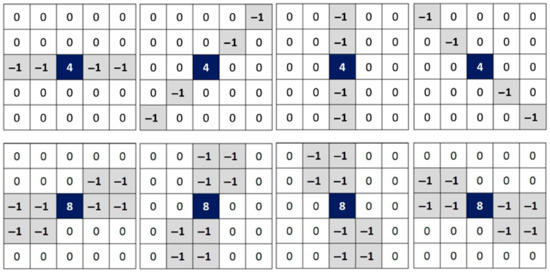
Figure 1.
The first set of filters used by the MLVMF to identify corrupted pixels [58]. Eight kernels are proposed. From left to right from top to bottom: at , at , at , at , at , at , at , and at .
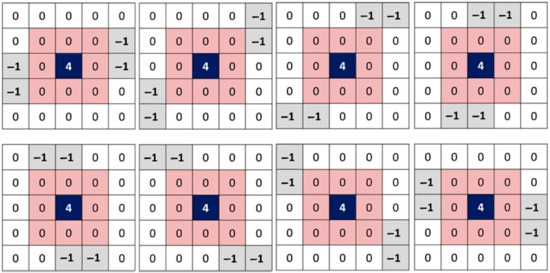
Figure 2.
The second set of filters used by the MLVMF to identify corrupted pixels [58]. Eight more kernels are proposed. From left to right from top to bottom: to .
For each position in the color image , MLVMF compute the absolute value of the convolution product noted between the kernel and the image .
where varies from to , such as is the image red component, is image green component, and is the image blue component. The scan of the image is performed in the first round with filters to , and in the second round with filters to . For each image pixel, we, therefore, obtain measurements of variation by round. To judge the importance of the intensity variation around a pixel , we proceed as follows (Algorithm 1):
| Algorithm 1. Thresholding process. |
if % T is a predefined threshold then else if then end end if then end |
3. Local Data Enhancement by Nested Filtering
Once the MLVMF has detected all of the pixels corrupted by impulsive noise, two windows of sizes and are created. The process of increasing information around each noise pixel is as follows: Centered at each noise pixel , the main window of size will identify the neighborhood of this pixel. For each noise pixel in this neighborhood, the secondary window (the nested window) of size centered at will be used to search for all the non-noisy pixels. The noisy pixel is replaced by the median value of the non-noisy pixels found by the secondary window if it exists. When the secondary window is done looking at the whole area outlined by the main window, two options become clear: the first option occurs when the neighborhood defined by the main window is completely restored. Typically, this occurs when the impulsive noise present in the image is of low density. The second option takes place when part of the neighborhood defined by the main window is restored while the rest of the corrupted neighborhood keeps its noisy values. This option is more common when the impulsive noise present in the image is of high density. Edge handling is performed using the mirror technique. Mirror size is defined by: .
Figure 3 shows an example of how nested filters can add to the information when the density of impulse noise is 90%. In Figure 3, the double filtering process is used on a part of the Lena standard image (red layer) that has 90% noise. Corrupted pixels are assigned the value zero. The main filter of size (in green) is centered on the noisy pixel with coordinates (also in green). Three useful values (in black) among the 48 scanned by this filter are available. The rest of the pixels are noisy. It is the role of the secondary filter of size (in blue) to position itself around these noisy pixels in order to estimate their respective values if possible. 38 of the 45 noisy pixels were restored thanks to this operation (new values in blue). The remaining 7 pixels keep their noisy values (in red). The impulsive noise around these 7 pixels is so dense that no useful value appears in the neighborhood created by the nested (secondary) filter. Several experimental tests were carried out to measure the effect of the choice of sizes and of the main and secondary windows. For an image of size , the best restoration results are given by and . It is true that increasing the size of these two windows can bring back more information, but at the risk of accentuating the redundancy. Thus, a smoothing phenomenon may arise and bias the quality of the final image by eliminating important details. On the other hand, if there is a lot of noise around a pixel and the size of the windows is decreased, the useful information around the pixel will be reconstructed at a very slow rate.
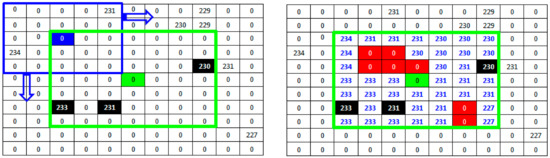
Figure 3.
Double filtering process applied on a part of the 512 × 512 Lena standard image with 90% noise. The main filter (window) is in green. The nested (secondary) filter (window) is in blue.
4. Missing Information Estimation by Morphological Operations
As mentioned in Section 3, if there is a lot of noise in an image, the process of adding more useful information around each noise pixel may not be enough. An additional operation is required for nested filtering. If we consider the set of pixels provided by the secondary window scan in addition to the already existing non-noisy pixels as an “object” set, and if we consider the remainder of the noise-corrupted pixels as a “non-object” set, then the binary configuration for the morphological operators is very appropriate. Let us consider as a 4-connex structuring element:
where the origin of . For each remaining noise pixel of the nested filtering phase, we propose a particular dilatation operation in order to estimate a new value of this pixel. Let denote the set of pixels provided by the secondary window scan in addition to the already existing non-noisy pixels. Let denote the space including all pixels inside the main window. Proposed dilatation process starts when the structuring element , located by its origin, is moved on all positions of the space . For each position corresponding to a non-restored pixel , we check if intersect . The non-noisy pixels belonging to this intersection are candidates to replace the non-restored pixel . To avoid information redundancy during this dilatation phase, the choice of the replacing pixel will be made by alternating the maximum and minimum of the candidate values. Figure 4 shows an example of the proposed dilatation operation. Based on the result provided by the nested filtering processing of Figure 3, the structuring element B (in black) is positioned on the first non-restituted pixel of the previous phase. Two useful values are detected: 231 and 234. Starting the alternation with the maximum, the new value of the pixel will be estimated at 234. The process continues from left to right and from top to bottom for all the noisy pixels until scanning the entire main window (in green). Figure 4 also shows that inside the main window (in green), centered on the noisy pixel (also in green), all the information has been reconstructed, first by nested filtering and then by the morphological operation of dilatation. Initially, only three useful values among the 48 possible values in the neighborhood of the corrupted pixel are available to replace it. The proposed approach succeeds after a deep investigation of the neighborhood to provide an estimate of the remaining 45 values. It is now enough to replace the noisy pixel with the median value of its new neighborhood. In the example of Figure 4, the new value of the noisy pixel will be 231.
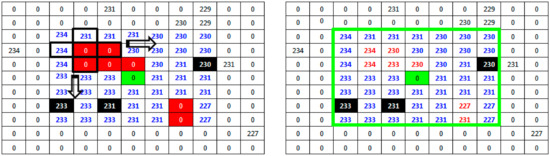
Figure 4.
Dilatation operation applied on a part of the 512 × 512 Lena standard image with 90% noise. The main filter (window) is in green. The structuring element B is in black.
5. NFMO Performances
5.1. NFMO Performances Evaluation Using the Standard Lena Image
Performance evaluation denoising is typically done using the PSNR metric. By comparing the original image to the denoised image and measuring the amount of distortion, the PSNR provides a measure of the quality of the denoising process. For further analysis, the PSNR of a denoised image should typically be between 22 and 24 dB, with higher values indicating better denoising performance. As a result, it is an excellent metric for assessing the performance of denoising algorithms. Equations (3)–(5) define the PSNR:
where is the color channel index of a color image (). The initial image is denoted by . The filtered image is denoted by . is the number of rows and is the number of columns in an image. First, a PSNR comparison is performed between our proposed NFMO and the MLVMF. The MLVMF is based on the detection of noisy pixels by investigating the surroundings of each pixel of the image thanks to the 16 Laplacian filters presented in Figure 1 and Figure 2. Once noisy pixels are detected, the median is used to replace each of these pixels. The proposed NFMO uses the same approach to detect noisy pixels. Then, two nested filters and a dilation operation are used to estimate all pixels in the neighborhood and derive the replacement value. Table 1 shows PSNR values for both MLVMF and NFMO applied to the Lena standard image corrupted with different impulsive noise densities (from 10% to 90%). We notice, thanks to Table 1, that the two methods give very close PSNR values up to a noise density equal to 30%. Beyond this value, the proposed NFMO becomes more and more efficient as the noise density increases. This result validates our proposition. The increase in useful information around noisy pixels has more impact when the neighborhood is poor (i.e., when the noise density is high).

Table 1.
Performances of the MLVMF and performances of the proposed NFMO method at different noise densities (from 10% to 90%) for PSNR on the Lena standard image.
The quality of the proposed NFMO image restoration is now compared to the performances of ASWM, NAFSM, MDBUTMF, ADWMF, DBIDWI, ADKIF, PDBF, APF, BPDF, ACCPPRA, AWMF, and ACBSA using the PSNR metric. Three factors influenced the selection of these methods: They deal with the problem of denoising images that have been heavily contaminated by impulsive noise, they are recent, and they belong to a variety of families. In Table 2, the chosen methods are listed, along with a description of how they work. The Lena standard image is used in this step. Table 3 shows the PSNR performances of selected methods as well as the performances of the proposed NFMO method at different noise densities (from 10% to 90%) on the Lena standard image. Figure 5 illustrates the PSNR variation as a function of the impulsive noise density injected into the Lena image. The PSNR variations of the 12 selected methods are presented in grayscale. The proposed NFMO method’s PSNR variation is displayed in red. The proposed method works, as shown by the results in Table 3 and Figure 5. Beyond 50% impulsive noise, the NFMO gives the best PSNR and, therefore, the best denoising quality of all the methods. The local data enhancement proposed in the case of an image too poor in useful pixels succeeds in providing the best estimate of the corrupted pixels. Additionally, the deep investigation that the NFMO performs makes more sense when the noise is very loud. Indeed, below 50% of the impulsive noise injected, the NFMO gives a very good result without being exceptional. The lower the noise, the more useful information is available. The increase in information, in this case, loses its meaning. Figure 6 shows a visual qualitative evaluation of the performance of the NFMO applied to the Lena 512 × 512 color image with impulsive noise of density 10%, 30%, 50%, 70%, and 90%. We can clearly notice the very good reconstruction of the image with all its details.
Table 2.
Operational principles of the selected methods: Performances evaluation phase.
Table 3.
Performances of selected methods and performances of the proposed NFMO method at different noise densities (from 10% to 90%) for PSNR on the Lena standard image.
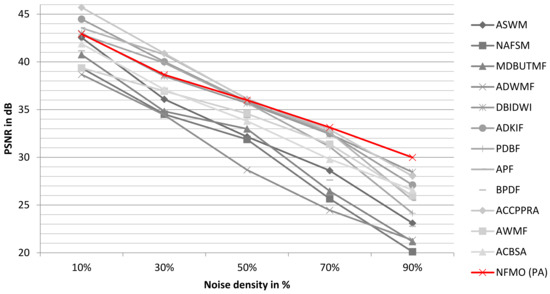
Figure 5.
The variation of the PSNR according to the impulsive noise density injected into the Lena image. In grayscale, the PSNR variations of the 12 selected methods. The PSNR variation for the proposed NFMO method is shown in red.
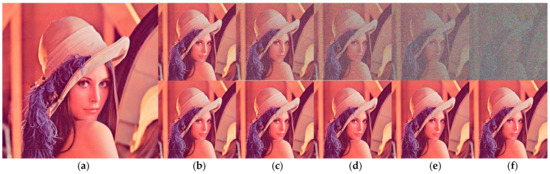
Figure 6.
Qualitative evaluation of the NFMO performances applied to the Lena color image. (a) Original Lena image. Top (b–f) Noised Lena images with noise density 10%, 30%, 50%, 70%, and 90%. Down (b–f) Filtered Lena Images by NFMO.
To better observe the performance of the proposed algorithm, we performed two additional tests on the standard images “Boat” and “Baboon”. We compare the PSNR performance of our proposed NFMO with the MDBUTMF, DBIDWI, ADKIF, ACCPPRA, AWMF, and ACBSA methods. Table 4 shows the PSNR performances of these methods as well as the PSNR performances of the proposed NFMO method at different noise densities (from 10% to 90%) on the Boat standard image. Table 5 shows the same comparison study performed on the Baboon standard image. Figure 7 and Figure 8 illustrate the PSNR variation as a function of the impulsive noise density injected, respectively, into the Boat and Baboon images. The PSNR variations of the six selected methods are presented in grayscale. The proposed NFMO method’s PSNR variation is displayed in red. Figure 9 and Figure 10 show a visual qualitative evaluation of the performance of the NFMO applied, respectively, to the Boat and Baboon 512 × 512 images with impulsive noise of density 10%, 30%, 50%, 70%, and 90%. These two test sets confirm the results obtained on the Lena image. The NFMO is efficient in the case of a low noise density and becomes more and more efficient when the noise density increases, giving the best values of PSNR among the other methods. It is, however, necessary to specify that a statistical validation of the proposed method to confirm the very satisfactory results found would be important. This requires further statistical study using a dataset of at least 100 images.
Table 4.
Performances of selected methods and performances of the proposed NFMO method at different noise densities (from 10% to 90%) for PSNR on the Boat standard image.
Table 5.
Performances of selected methods and performances of the proposed NFMO method at different noise densities (from 10% to 90%) for PSNR on the Baboon standard image.
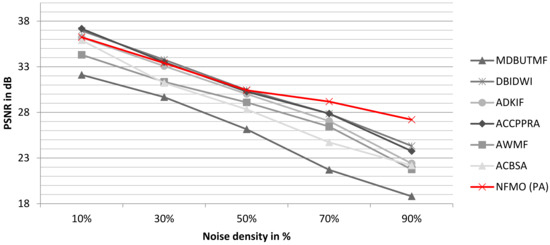
Figure 7.
The variation of the PSNR according to the impulsive noise density injected into the Boat image. In grayscale, the PSNR variations of the selected methods. The PSNR variation for the proposed NFMO method is shown in red.
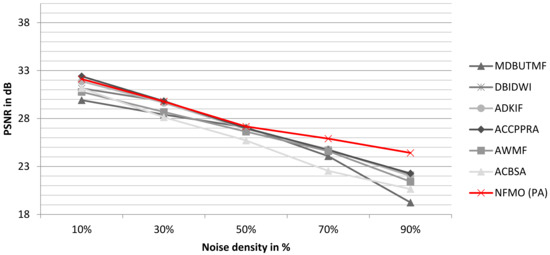
Figure 8.
The variation of the PSNR according to the impulsive noise density injected into the Baboon image. In grayscale, the PSNR variations of the selected methods. The PSNR variation for the proposed NFMO method is shown in red.
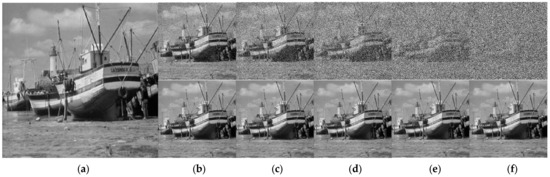
Figure 9.
Qualitative evaluation of the NFMO performances applied to the Boat image. (a) Original Boat image. Top (b–f) Noised Boat images with noise density 10%, 30%, 50%, 70%, and 90%. Down (b–f) Filtered Boat Images by NFMO.
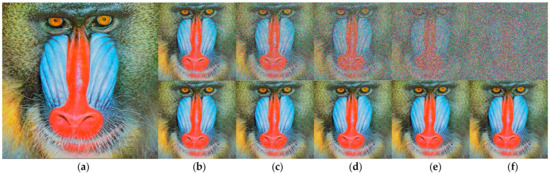
Figure 10.
Qualitative evaluation of the NFMO performances applied to the Baboon color image. (a) Original Baboon image. Top (b–f) Noised Baboon images with noise density 10%, 30%, 50%, 70%, and 90%. Down (b–f) Filtered Baboon Images by NFMO.
5.2. NFMO Performances Evaluation with Medical Images
The objective of this work is to provide a real-time filtering tool for medical images presenting strong impulsive noise. We have proposed a new method for replacing noisy pixels capable of restoring highly noisy images with very good quality. We are interested here in the quantitative and qualitative evaluation of the performance of the NFMO algorithm applied to a set of medical images. Medical images are selected from the Retinal Fundus Multi-Disease Image Dataset (RFMiD) 2.0 [59], the Alzheimer’s Dataset available in the Kaggle platform [60], and the COVID-19 Image Repository [61]. Six images were chosen to perform the experimental tests. CI1 and CI2 consist of brain MRI images with moderate dementia. CI3 and CI4 show color retina fundus: CI3 shows an anterior ischemic optic neuropathy, while CI4 shows coloboma in the macula and optic disc. CI5 and CI6 are chest x-ray images presenting, respectively, a moderate case and an advanced case of COVID-19. All these images have been normalized to a size of . Figure 7 shows the selected images.
The performance evaluation of the NFMO on the selected medical images is carried out using two measures: the PSNR, which provides a measure of the quality of the denoising process, and the NCD (Normalized Color Difference), which provides a measure of the color distortion caused by the pixel replacement process. The value of the NCD is inversely proportional to the quality of restoration. The closer the colors in the filtered image are to the colors of the original image, the lower the NCD. NCD is calculated as follows:
where is luminance of the original image, is the luminance of the filtered image, and are the chrominance components of the original image, and are the chrominance components of the filtered image. Figure 11 also shows that the selected medical images can be color images or grayscale images. This does not affect our algorithm. Indeed, we have defined as the input of the proposed code a color image, which is therefore presented in the form of three layers: R, G, and B. A test is carried out during the reading of the image. If the image has a single layer, then it is a grayscale image. The algorithm then adds two other similar layers, and the noising and denoising processes can then begin. By adding these two layers, the image remains the same in terms of visual appearance, i.e., a grayscale image, but the noise can still attack any pixel of any layer. As for the NCD metric, it still remains valid since it requires three layers, which is the case thanks to the test phase explained above. The NCD provides a measure of the color distortion caused by the pixel replacement process, which remains valid even in the case of a grayscale image as long as it is presented in three layers and the noise affects these three layers independently. Table 6 shows measurements of the PSNR and NCD for the six medical images with different amounts of impulsive noise (from 10% to 90%). Figure 12 and Figure 13 reproduce the results of Table 6, highlighting the evolution of the PSNR and NCD measurements when the density of the impulsive noise increases. Figure 14 shows a visual qualitative evaluation of the performance of the NFMO applied to the selected medical images with impulsive noise of density equal to 90%.
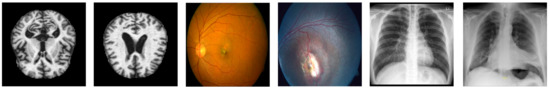
Figure 11.
Medical images selected from the Retinal Fundus Multi-Disease Image Dataset (RFMiD) 2.0, Alzheimer’s Dataset available in the Kaggle platform, and COVID-19 Image Repository. From left to right: CI1, CI2, CI3, CI4, CI5, and CI6.
Table 6.
Performances of NFMO in terms of PSNR and NCD were applied to six medical images at different noise densities.
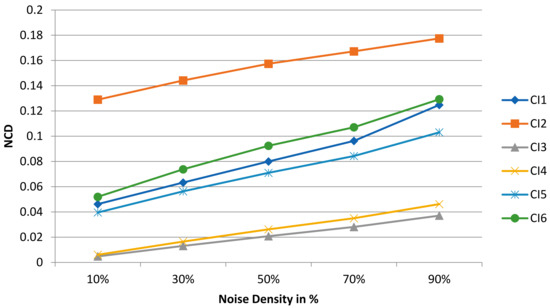
Figure 12.
The evolution of the NCD when the impulsive noise density increases for CI1, CI2, CI3, CI4, CI5, and CI6.
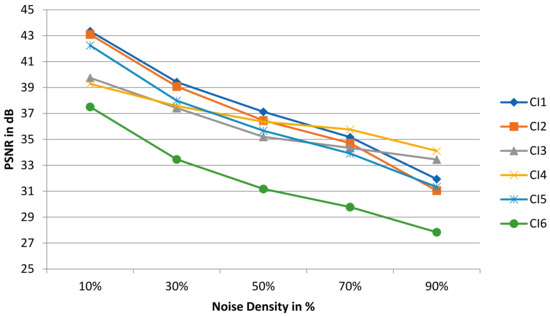
Figure 13.
The evolution of the PSNR when the impulsive noise density increases for CI1, CI2, CI3, CI4, CI5, and CI6.
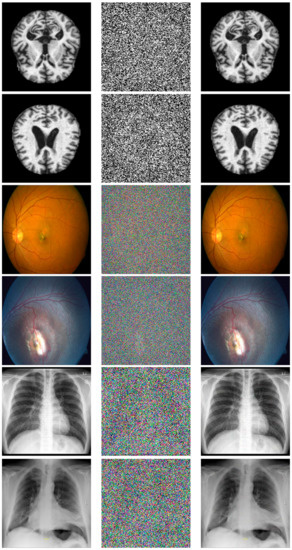
Figure 14.
Qualitative evaluation of the NFMO performances applied to the selected medical images. First column: Original images Middle column: Original images corrupted by impulsive noise at 90%. Last column: Filtered images.
The filtering operation by the proposed approach on medical images succeeded in restoring the original visual information even in the presence of very high-density impulsive noise. The CI3 and CI4 images present the best results in terms of denoising quality (high PSNR) and color fidelity (low NCD). This result makes perfect sense given the low frequency of repeating patterns in CI3 and CI4 compared to the rest of the test images. However, even though the CI1, CI2, CI5, and CI6 images all have a dominant texture, the measured PSNRs are still high, and the color distortion (NCD) is low. The visual evaluation presented in Figure 14 confirms the measurements in Table 6. We can note the great similarity between the original images and the filtered images, even in the absence of 90% of useful pixels. This is precisely the point of the local data enhancement offered by the NFMO. The average execution time of the proposed NFMO under Core™i7–1165g7@2.80ghz Intel processor reaches 471 sec per 256 × 256 color image when corrupted by 90% density noise. Deep investigation based on nested double filtering is indeed very costly in terms of computation time. Additionally, this calculation time is proportional to the density of the injected noise since the number of pixels to be corrected is greater when the density of the injected noise is high. Section 6 describes a proposed High-Level Synthesis (HLS) architecture for the NFMO filter to reduce execution time and enable real-time computation.
6. NFMO Real-Time Implementation
When combined with FPGA, the HLS process gives engineers a useful tool for quickly exploring the design space based on a high-level programming language (such as SystemC or C/C++) that describes how the system works. So, the HLS has turned into a useful and effective tool that could increase the amount of work that can be done during the design process and shorten the time it takes to finish a design cycle. In this situation, a number of HLS tools have been made, such as the Xilinx Vivado HLS tool, which gives a number of steps or directives for making the best hardware design for every algorithm. In fact, the RESOURCE directive makes it possible to construct arrays either as registers or as memory. In addition to this, the ALLOCATION directive may be used to improve the efficiency with which the arithmetic operation is performed. In addition to this, the ALLOCATION directive may be used to improve the efficiency with which the arithmetic operation is performed. Additionally, the loops can be pipelined, not unrolled, or fully/partially unrolled using the PIPELINE and UNROLL directives to improve the speed of loop iterations (i.e., to reach a higher throughput). Figure 15 displays the block diagram of the NFMO filter’s built hardware architecture. From a specified C/C + + code, the Xilinx Vivado HLS 18.1 tool performs the generating process. In order to boost the throughput of our NFMO filter, our architecture employs 5 DMA (Direct Memory Access) to transmit 5 images lines in parallel. The suggested NFMO’s hardware design is composed of and nested filters. Each denoised 24-bit RGB pixel is concatenated and stored in -bit internal memory. Certain directives (such as PARTITION and PIPELINE) are progressively added to the NFMO C/C++ code to improve the architecture. Thus, we build numerous NFMO hardware designs. Then, we preserve the optimal design, which strikes a balance between hardware cost and processing time. The hardware requirements for the various NFMO designs on the Zynq XCZU9EG FPGA in terms of Lookup-Table (LUT), Flip-Flops (FF), BRAM blocks, and DSP blocks are presented in Table 7.
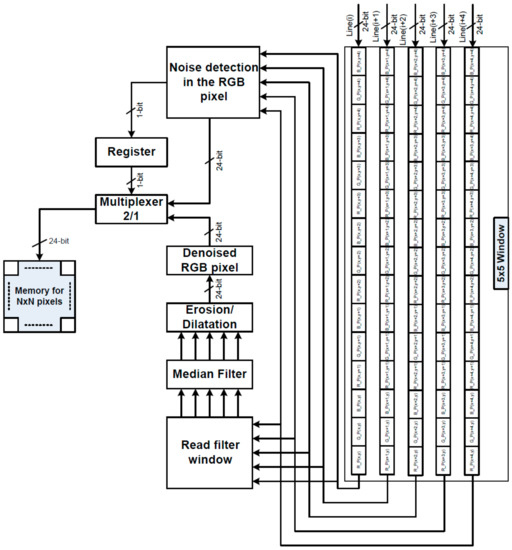
Figure 15.
Proposed NFMO filter block diagram.
Table 7.
FPGA resources and NFMO-designed architectures’ performance.
Table 7 displays Solution 1’s hardware design without optimization. It is evident that this technique is not resource-hungry, but filtering the entire image needs a huge number of clock cycles. Solution 1 requires 1913 milliseconds for color image with a clock frequency of 115 MHz and 90% density noise. We propose to implement the PIPELINE directive in Solution 2. The cost of hardware grows yet remains significantly below the system’s maximum capacity. In contrast, the number of clock cycles drops by 97.5%. Hence, an image may be processed in 48 milliseconds. In order to further reduce the number of clock cycles, Solution 3 includes the PARTITION directive, which allows the filtering window (Figure 15) to be divided into tiny blocks and promotes parallel data access. Solution 3 achieves a computation time of 23 milliseconds, which is 83 times quicker than Solution 1. More hardware resources will be required, yet hardware capacity will not be exceeded. Lastly, it should be noted that the software implementation of Section 5 yielded the same filtering quality with both Solution 2 and Solution 3.
7. Conclusions
In this work, a real-time tool for the elimination of high-density impulsive noise is proposed. Applied to heavily corrupted medical images, the proposed algorithm achieves excellent restoration quality. Two major contributions are at the center of this paper. The first consists of a new algorithm for replacing noisy pixels. This algorithm increases the useful local information to allow a better estimation of the pixel. This operation is based on double-nested filtering followed by a morphological operation of dilation, hence the name of this new method: the NFMO. Nested filtering is very efficient. The NFMO achieves the best performance in terms of denoising quality (PSNR) among the most recent and best-known methods in the literature when impulsive noise density exceeds 50%. Applied to medical images, NFMO restores color information with excellent PSNR and NCD metrics. These images are characterized by the presence of repetitive patterns and, in some cases, a predominantly black background. Visual information is, therefore, not very diversified. The results obtained in this paper show that the performance of the NFMO increases with the density of the impulsive noise injected while also being very good when this density is low. This is a very original result, opening perspectives on the uses of the NFMO in several other fields in addition to medical imaging. The very good quality of denoising obtained by the NFMO has, however, a cost. The nested nature of the proposed method required quite a lot of computational time. The second contribution in this paper solves this problem. A hardware architecture is proposed, allowing the filtering of corrupted images with 90% impulsive noise in an average of 23 milliseconds. When integrated into the medical image acquisition chain, the proposed tool can guarantee excellent filtered image quality, allowing for better manual or artificial intelligence-based diagnosis.
In this work, we are interested in impulsive noise that can bias medical images. However, other types of noise can also attack these images. In particular, the Rician noise, which is very common in MRI images, or even the quantum mottle noise, which attacks CT and X-ray images. How will our proposed NFMO behave in front of these types of noises? If the reconstitution of the signal by the NFMO must logically work since it is based on useful existing information, the detection by the modified Laplacian filters of Rician-type noises or even quantum mottle noise remains to be validated. It is quite possible that slight or deep modifications must be made to the detection phase. Future work will focus on deepening the investigation into this issue.
Author Contributions
Conception, T.M.A. and K.K.; Methodology, K.K. and K.B.; Software, A.B.A., K.K. and M.A.; Validation, T.M.A. and A.S.; Writing—original draft preparation, T.M.A. and K.B.; Writing—review and editing, K.K., A.B.A. and A.S.; Supervision, T.M.A. and K.K.; Project administration, T.M.A., K.B. and M.A.; Funding acquisition, T.M.A. All authors have read and agreed to the published version of the manuscript.
Funding
The authors extend their appreciation to the Deputyship for Research and Innovation, Ministry of Education in Saudi Arabia for funding this research work through the project number 223202.
Institutional Review Board Statement
Not applicable.
Informed Consent Statement
Not applicable.
Data Availability Statement
Not applicable.
Conflicts of Interest
The authors declare that the research was conducted in the absence of any commercial or financial relationships that could be construed as a potential conflict of interest.
References
- Astola, J.; Haavisto, P.; Neuvo, Y. Vector median filters. Proc. IEEE 1990, 78, 678–689. [Google Scholar] [CrossRef]
- Smolka, B. Robust Sharpening Vector Median Filter. In Proceedings of the International Automatic Control Conference (CACS), Taoyuan, Taiwan, 4–7 November 2018; pp. 1–6. [Google Scholar] [CrossRef]
- Smolka, B.; Szczepanski, M.; Plataniotis, K.; Venetsanopoulos, A. On the fast modified vector median filter. In Proceedings of the Canadian Conference on Electrical and Computer Engineering 2001, Toronto, ON, Canada, 13–16 May 2001; Volume 2, pp. 1315–1320. [Google Scholar] [CrossRef]
- Viero, T.; Oistamo, K.; Neuvo, Y. Three-dimensional median-related filters for color image sequence filtering. IEEE Trans. Circuits Syst. Video Technol. 1994, 4, 129–142, 208. [Google Scholar] [CrossRef]
- Lukac, R.; Smolka, B.; Plataniotis, K.N. Sharpening vector median filters. Signal Process. 2007, 87, 2085–2099. [Google Scholar] [CrossRef]
- Naveen, Y.; Gupta, S. Removal of Salt and Pepper Noise Using Sparse Representation. In Proceedings of the 2012 Eighth International Conference on Signal Image Technology and Internet Based Systems, Naples, Italy, 26–29 November 2012; pp. 58–63. [Google Scholar] [CrossRef]
- Elamaran, V.; Upadhyay, H.N.; Narasimhan, K.; Priestley, J.J. A Case Study of Impulse Noise Reduction Using Morphological Image Processing with Structuring Elements. Asian J. Sci. Res. 2015, 8, 291–303. [Google Scholar] [CrossRef]
- Lei, T.; Wang, Y.; Luo, W. Multivariate Self-Dual Morphological Operators Based on Extremum Constraint. Math. Probl. Eng. 2015, 2015, 596348. [Google Scholar] [CrossRef]
- Ruchay, A.; Kober, V. Impulsive Noise Removal from Color Images with Morphological Filtering. In Analysis of Images, Social Networks and Texts: 6th International Conference, AIST 2017, Moscow, Russia, July 27–29, 2017, Revised Selected Papers 6; Springer International Publishing: New York, NY, USA, 2017; pp. 280–291. [Google Scholar] [CrossRef]
- Lukac, R. Another generalisation of vector filters. In Proceedings of the International Symposium on VIPromCom Video/Image Processing and Multimedia Communications, Zadar, Croatia, 16–19 June 2002; pp. 273–278. [Google Scholar] [CrossRef]
- Smolka, B. Efficient Modification of the Central Weighted Vector Median Filter. In Joint Pattern Recognition Symposium; DAGM 2002; Lecture Notes in Computer Science; Springer: Berlin/Heidelberg, Germany, 2002; Volume 2449. [Google Scholar] [CrossRef]
- Lukac, R. Adaptive vector median filtering. Pattern Recognit. Lett. 2003, 24, 1889–1899. [Google Scholar] [CrossRef]
- Plataniotis, K.; Androutsos, D.; Venetsanopoulos, A. Color image processing using adaptive vector directional filters. In IEEE Transactions on Circuits and Systems II: Analog and Digital Signal Processing; Institute of Electrical and Electronics Engineers Inc.: New York, NY, USA, 1998; Volume 45, pp. 1414–1419. [Google Scholar] [CrossRef]
- Singh, K.; Bora, P.; Singh, S. Rank-ordered mean filter for removal of impulse noise from images. In Proceedings of the 2002 IEEE International Conference on Industrial Technology, 2002. IEEE ICIT ‘02, Bangkok, Thailand, 11–14 December 2002; Volume 2. pp. 980–985. [CrossRef]
- Peris-Fajarnés, G.; Roig, B.; Vidal, A. Rank-Ordered Differences Statistic Based Switching Vector Filter. In Image Analysis and Recognition; ICIAR 2006; Lecture Notes in Computer Science; Campilho, A., Kamel, M.S., Eds.; Springer: Berlin/Heidelberg, Germany, 2006; Volume 4141. [Google Scholar] [CrossRef]
- Morillas, S.; Gregori, V.; Sapena, A. Adaptive Marginal Median Filter for Colour Images. Sensors 2011, 11, 3205–3213. [Google Scholar] [CrossRef]
- Singh, K.M.; Bora, P.K. Switching vector median filters based on non-causal linear prediction for detection of impulse noise. Imaging Sci. J. 2013, 62, 313–326. [Google Scholar] [CrossRef]
- Roy, A.; Singha, J.; Manam, L.; Laskar, R.H. Combination of adaptive vector median filter and weighted mean filter for removal of high density impulse noise from color images. IET Image Process. 2017, 11, 352–361. [Google Scholar] [CrossRef]
- Zhang, Z.; Han, D.; Dezert, J.; Yang, Y. A New Adaptive Switching Median Filter for Impulse Noise Reduction with Pre-Detection Based on Evidential Reasoning. Signal Process. 2018, 147, 173–189. [Google Scholar] [CrossRef]
- Khriji, L.; Gabbouj, M. Adaptive fuzzy order statistics-rational hybrid filters for color image processing. Fuzzy Sets Syst. 2002, 128, 35–46. [Google Scholar] [CrossRef]
- Abid, I.; Boudabous, A.; Ben Atitallah, A. A new adaptive vector median rational hybrid filter for impulsive noise suppression. In Proceedings of the 16th International Conference on Sciences and Techniques of Automatic Control and Computer Engineering (STA), Monastir, Tunisia, 21–23 December 2015; pp. 417–421. [Google Scholar] [CrossRef]
- Plataniotis, K.; Androutsos, D.; Venetsanopoulos, A. Adaptive fuzzy systems for multichannel signal processing. Proc. IEEE 1999, 87, 1601–1622. [Google Scholar] [CrossRef]
- Wang, G.; Zhu, H.; Wang, Y. Fuzzy decision filter for color images denoising. Optik 2015, 126, 2428–2432. [Google Scholar] [CrossRef]
- Roy, A.; Manam, L.; Laskar, R.H. Region Adaptive Fuzzy Filter: An Approach for Removal of Random-Valued Impulse Noise. IEEE Trans. Ind. Electron. 2018, 65, 7268–7278. [Google Scholar] [CrossRef]
- Kong, H.; Guan, L. A neural network adaptive filter for the removal of impulse noise in digital images. Neural Netw. 1996, 9, 373–378. [Google Scholar] [CrossRef]
- Solovyeva, E. Cellular neural network as a non-linear filter of impulse noise. In Proceedings of the 2017 20th Conference of Open Innovations Association (FRUCT), St. Petersburg, Russia, 3–7 April 2017; pp. 420–426. [Google Scholar] [CrossRef]
- Radlak, K.; Malinski, L.; Smolka, B. Deep Learning Based Switching Filter for Impulsive Noise Removal in Color Images. Sensors 2020, 20, 2782. [Google Scholar] [CrossRef]
- Liang, S.-F.; Lu, S.-M.; Chang, J.-Y.; Lin, C.-T. A Novel Two-Stage Impulse Noise Removal Technique Based on Neural Networks and Fuzzy Decision. IEEE Trans. Fuzzy Syst. 2008, 16, 863–873. [Google Scholar] [CrossRef]
- Bell, D. Salt and Pepper Sign (MRI Artifact). Salt and Pepper Noise (MRI Artifact)|Radiology Reference Article|Radiopaedia.Org. 2021. Available online: https://radiopaedia.org/articles/salt-and-pepper-noise-mri-artifact?lang=us (accessed on 1 April 2023). [CrossRef]
- Nyrhinen, M.; Souza, V.H.; Korhonen, J.; Sinisalo, H.; Paasonen, J.; Nieminen, J.O.; Gröhn, O.; Ilmoniemi, R.J.; Lin, F.-H. The Impulse Noise of TMS inside a 3 T and 9.4 T MRI. Brain Stimul. 2021, 14, 1606. [Google Scholar] [CrossRef]
- Goyal, B.; Dogra, A.; Agrawal, S.; Sohi, B.S. Noise Issues Prevailing in Various Types of Medical Images. Biomed. Pharmacol. J. 2018, 11, 1227–1237. [Google Scholar] [CrossRef]
- Das, J.B.A.; Sarangi, A.; Mishra, D.; Mohanty, M.N. Design of RAMF for Impulsive Noise Cancelation from Chest X-ray Image. In Advances in Intelligent Computing and Communication, Lecture Notes in Networks and Systems; Springer: Singapore, 2022; Volume 430. [Google Scholar] [CrossRef]
- Arora, S.; Hanmandlu, M.; Gupta, G. Filtering Impulse Noise in Medical Images Using Information Sets. Pattern Recognit. Lett. 2020, 139, 1–9. [Google Scholar] [CrossRef]
- Owais, M.; Arsalan, M.; Choi, J.; Park, K.R. Effective Diagnosis and Treatment through Content-Based Medical Image Retrieval (CBMIR) by Using Artificial Intelligence. J. Clin. Med. 2019, 8, 462. [Google Scholar] [CrossRef] [PubMed]
- Faragallah, O.S.; Ibrahem, H.M. Adaptive Switching Weighted Median Filter Framework for Suppressing Salt-and-pepper Noise. AEU Int. J. Electron. Commun. 2016, 70, 1034–1040. [Google Scholar] [CrossRef]
- Toh, K.K.V.; Isa, N.A.M. Noise Adaptive Fuzzy Switching Median Filter for Salt-and-Pepper Noise Reduction. IEEE Signal Process. Lett. 2010, 17, 281–284. [Google Scholar] [CrossRef]
- Esakkirajan, S.; Veerakumar, T.; Subramanyam, A.N.; PremChand, C.H. Removal of High Density Salt and Pepper Noise Through Modified Decision Based Unsymmetric Trimmed Median Filter. IEEE Signal Process. Lett. 2011, 18, 287–290. [Google Scholar] [CrossRef]
- Khan, S.; Lee, D.-H. An Adaptive Dynamically Weighted Median Filter for Impulse Noise Removal. EURASIP J. Adv. Signal Process. 2017, 2017, 1–14. [Google Scholar] [CrossRef]
- Kishorebabu, V.; Packyanathan, G.; Kamatham, H.; Shankar, V. An Adaptive Decision Based Interpolation Scheme for the Removal of High Density Salt and Pepper Noise in Images. EURASIP J. Image Video Process. 2017, 2017, 67. [Google Scholar] [CrossRef]
- Varatharajan, R.; Vasanth, K.; Gunasekaran, M.; Priyan, M.; Gao, X.Z. An Adaptive Decision Based Kriging Interpolation Algorithm for the Removal of High Density Salt and Pepper Noise in Images. Comput. Electr. Eng. 2018, 70, 447–461. [Google Scholar] [CrossRef]
- Balasubramanian, G.; Chilambuchelvan, A.; Vijayan, S.; Gowrison, G. Probabilistic Decision Based Filter to Remove Impulse Noise Using Patch Else Trimmed Median. AEU Int. J. Electron. Commun. 2016, 70, 471–481. [Google Scholar] [CrossRef]
- Chen, J.; Zhan, Y.; Cao, H.; Wu, X. Adaptive Probability Filter for Removing Salt and Pepper Noises. IET Image Process. 2018, 12, 863–871. [Google Scholar] [CrossRef]
- Erkan, U.; Gökrem, L. A New Method Based on Pixel Density in Salt and Pepper Noise Removal. Turk. J. Electr. Eng. Comput. Sci. 2018, 26, 162–171. [Google Scholar] [CrossRef]
- Vasanth, K.; Varatharajan, R. An Adaptive Content Based Closer Proximity Pixel Replacement Algorithm for High Density Salt and Pepper Noise Removal in Images. J. Ambient. Intell. Humaniz. Comput. 2020, 1–15. [Google Scholar] [CrossRef]
- Zhang, P.; Li, F. A New Adaptive Weighted Mean Filter for Removing Salt-and-Pepper Noise. IEEE Signal Process. Lett. 2014, 21, 1280–1283. [Google Scholar] [CrossRef]
- Jayasree, P.S.; Raj, P.; Kumar, P.; Siddavatam, R.; Ghrera, S.P. A Fast Novel Algorithm for Salt and Pepper Image Noise Cancellation Using Cardinal, B.-Splines. Signal Image Video Process. 2012, 7, 1145–1157. [Google Scholar] [CrossRef]
- Soille, P. Morphological Image Analysis: Principles and Applications; Springer: Berlin/Heidelberg, Germany, 1999. [Google Scholar] [CrossRef]
- Hu, Y.; Ji, H. Research on Image Median Filtering Algorithm and Its FPGA Implementation. In Proceedings of the 2009 WRI Global Congress on Intelligent Systems, Washington, DC, USA, 19–21 May 2009; pp. 226–230. [Google Scholar] [CrossRef]
- Lee, T.W.; Lee, J.H.; Cho, S.B. FPGA Implementation of a 3/spl times/3 window median filter based on a new efficient bit-serial sorting algorithm. In Proceedings of the 7th Korea-Russia International Symposium on Science and Technology, Proceedings KORUS 2003. (IEEE Cat. No.03EX737), Ulsan, Republic of Korea, 28 June–6 July 2003; Volume 2, pp. 237–242. [Google Scholar]
- Boudabous, A.; Ben Atitallah, A.B.; Khriji, L.; Kadionik, P.; Masmoudi, N. HW/SW design- based implementation of vector median rational hybrid filter. Int. Arab J. Inf. Technol. 2010, 7, 70–74. [Google Scholar]
- Boudabous, A.; Khriji, L.; Ben Atitallah, A.B.; Kadionik, P.; Masmoudi, N. Efficient architecture and implementation of vector median filter in co-design context. RadioEng. Prague 2007, 16, 113–119. [Google Scholar]
- Kthiri, M.; Le Gal, B.; Kadionik, P.; Ben Atitallah, A. A Very High Throughput Deblocking Filter for H.264/AVC. J. Signal Process. Syst. 2013, 73, 189–199. [Google Scholar] [CrossRef]
- Ben Atitallah, A.; Kadionik, P.; Ghozzi, F.; Nouel, P.; Masmoudi, N.; Marchegay, P. Optimization and Implementation on Fpga of the DCT/IDCT Algorithm. In Proceedings of the 2006 IEEE International Conference on Acoustics Speech and Signal Processing Proceedings, Toulouse, France, 14–19 May 2006; p. III. [Google Scholar] [CrossRef]
- Ben Atitallah, A.; Abid, I.; Boudabous, A.; Loukil, H. A new hardware architecture of the adaptive vector median filter and validation in a hardware/software environment. Int. J. Circuit Theory Appl. 2021, 49, 2329–2347. [Google Scholar] [CrossRef]
- Ben Atitallah, A.; Kammoun, M.; Ali, K.M.; Ben Atitallah, R. An FPGA comparative study of high-level and low-level combined designs for HEVC intra, inverse quantization, and IDCT/IDST 2D modules. Int. J. Circuit Theory Appl. 2020, 48, 1274–1290. [Google Scholar] [CrossRef]
- Kammoun, M.; Ben Atitallah, A.; Ali, K.M.A.; Ben Atitallah, R. Case study of an HEVC decoder application using high-level synthesis: Intraprediction, dequantization, and inverse transform blocks. J. Electron. Imaging 2019, 28, 033010. [Google Scholar] [CrossRef]
- Alanazi, T.M.; Ben Atitallah, A.; Abid, I. An Optimized SW/HW AVMF Design Based on High-Level Synthesis Flow for Color Images. Comput. Mater. Contin. 2021, 68, 2925–2943. [Google Scholar] [CrossRef]
- Rashid, N.; Berriri, K.; Albekairi, M.; Kaaniche, K.; Ben Atitallah, A.; Khan, M.A.; El-Hamrawy, O.I. New Real-Time Impulse Noise Removal Method Applied to Chest X-Ray Images. Diagnostics 2022, 12, 2738. [Google Scholar] [CrossRef] [PubMed]
- Panchal, S.; Naik, A.; Kokare, M.; Pachade, S.; Naigaonkar, R.; Phadnis, P.; Bhange, A. Retinal Fundus Multi-Disease Image Dataset (RFMiD) 2.0: A Dataset of Frequently and Rarely Identified Diseases. Data 2023, 8, 29. [Google Scholar] [CrossRef]
- Alzheimer’s Dataset (4 Class of Images). Available online: https://www.kaggle.com/datasets/tourist55/alzheimers-dataset-4-class-of-images (accessed on 7 January 2023).
- Winther, H.B.; Laser, H.; Gerbel, S.; Maschke, S.K.; Hinrichs, J.B.; Vogel-Claussen, J.; Wacker, F.K.; Höper, M.M.; Meyer, B.C. COVID-19 Image Repository. Figshare Dataset 2020. Available online: https://github.com/ml-workgroup/covid-19-image-repository (accessed on 12 August 2022).
Disclaimer/Publisher’s Note: The statements, opinions and data contained in all publications are solely those of the individual author(s) and contributor(s) and not of MDPI and/or the editor(s). MDPI and/or the editor(s) disclaim responsibility for any injury to people or property resulting from any ideas, methods, instructions or products referred to in the content. |
© 2023 by the authors. Licensee MDPI, Basel, Switzerland. This article is an open access article distributed under the terms and conditions of the Creative Commons Attribution (CC BY) license (https://creativecommons.org/licenses/by/4.0/).