
Risk Predictors of Advanced Fibrosis in Non-Alcoholic Fatty Liver Disease

 , ,
, ,  ,
,  and
and 
Abstract
1. Introduction
2. Materials and Methods
Study Protocol
3. Results
3.1. Analysis of the Grade of Steatosis and Fibrosis in the Study Group
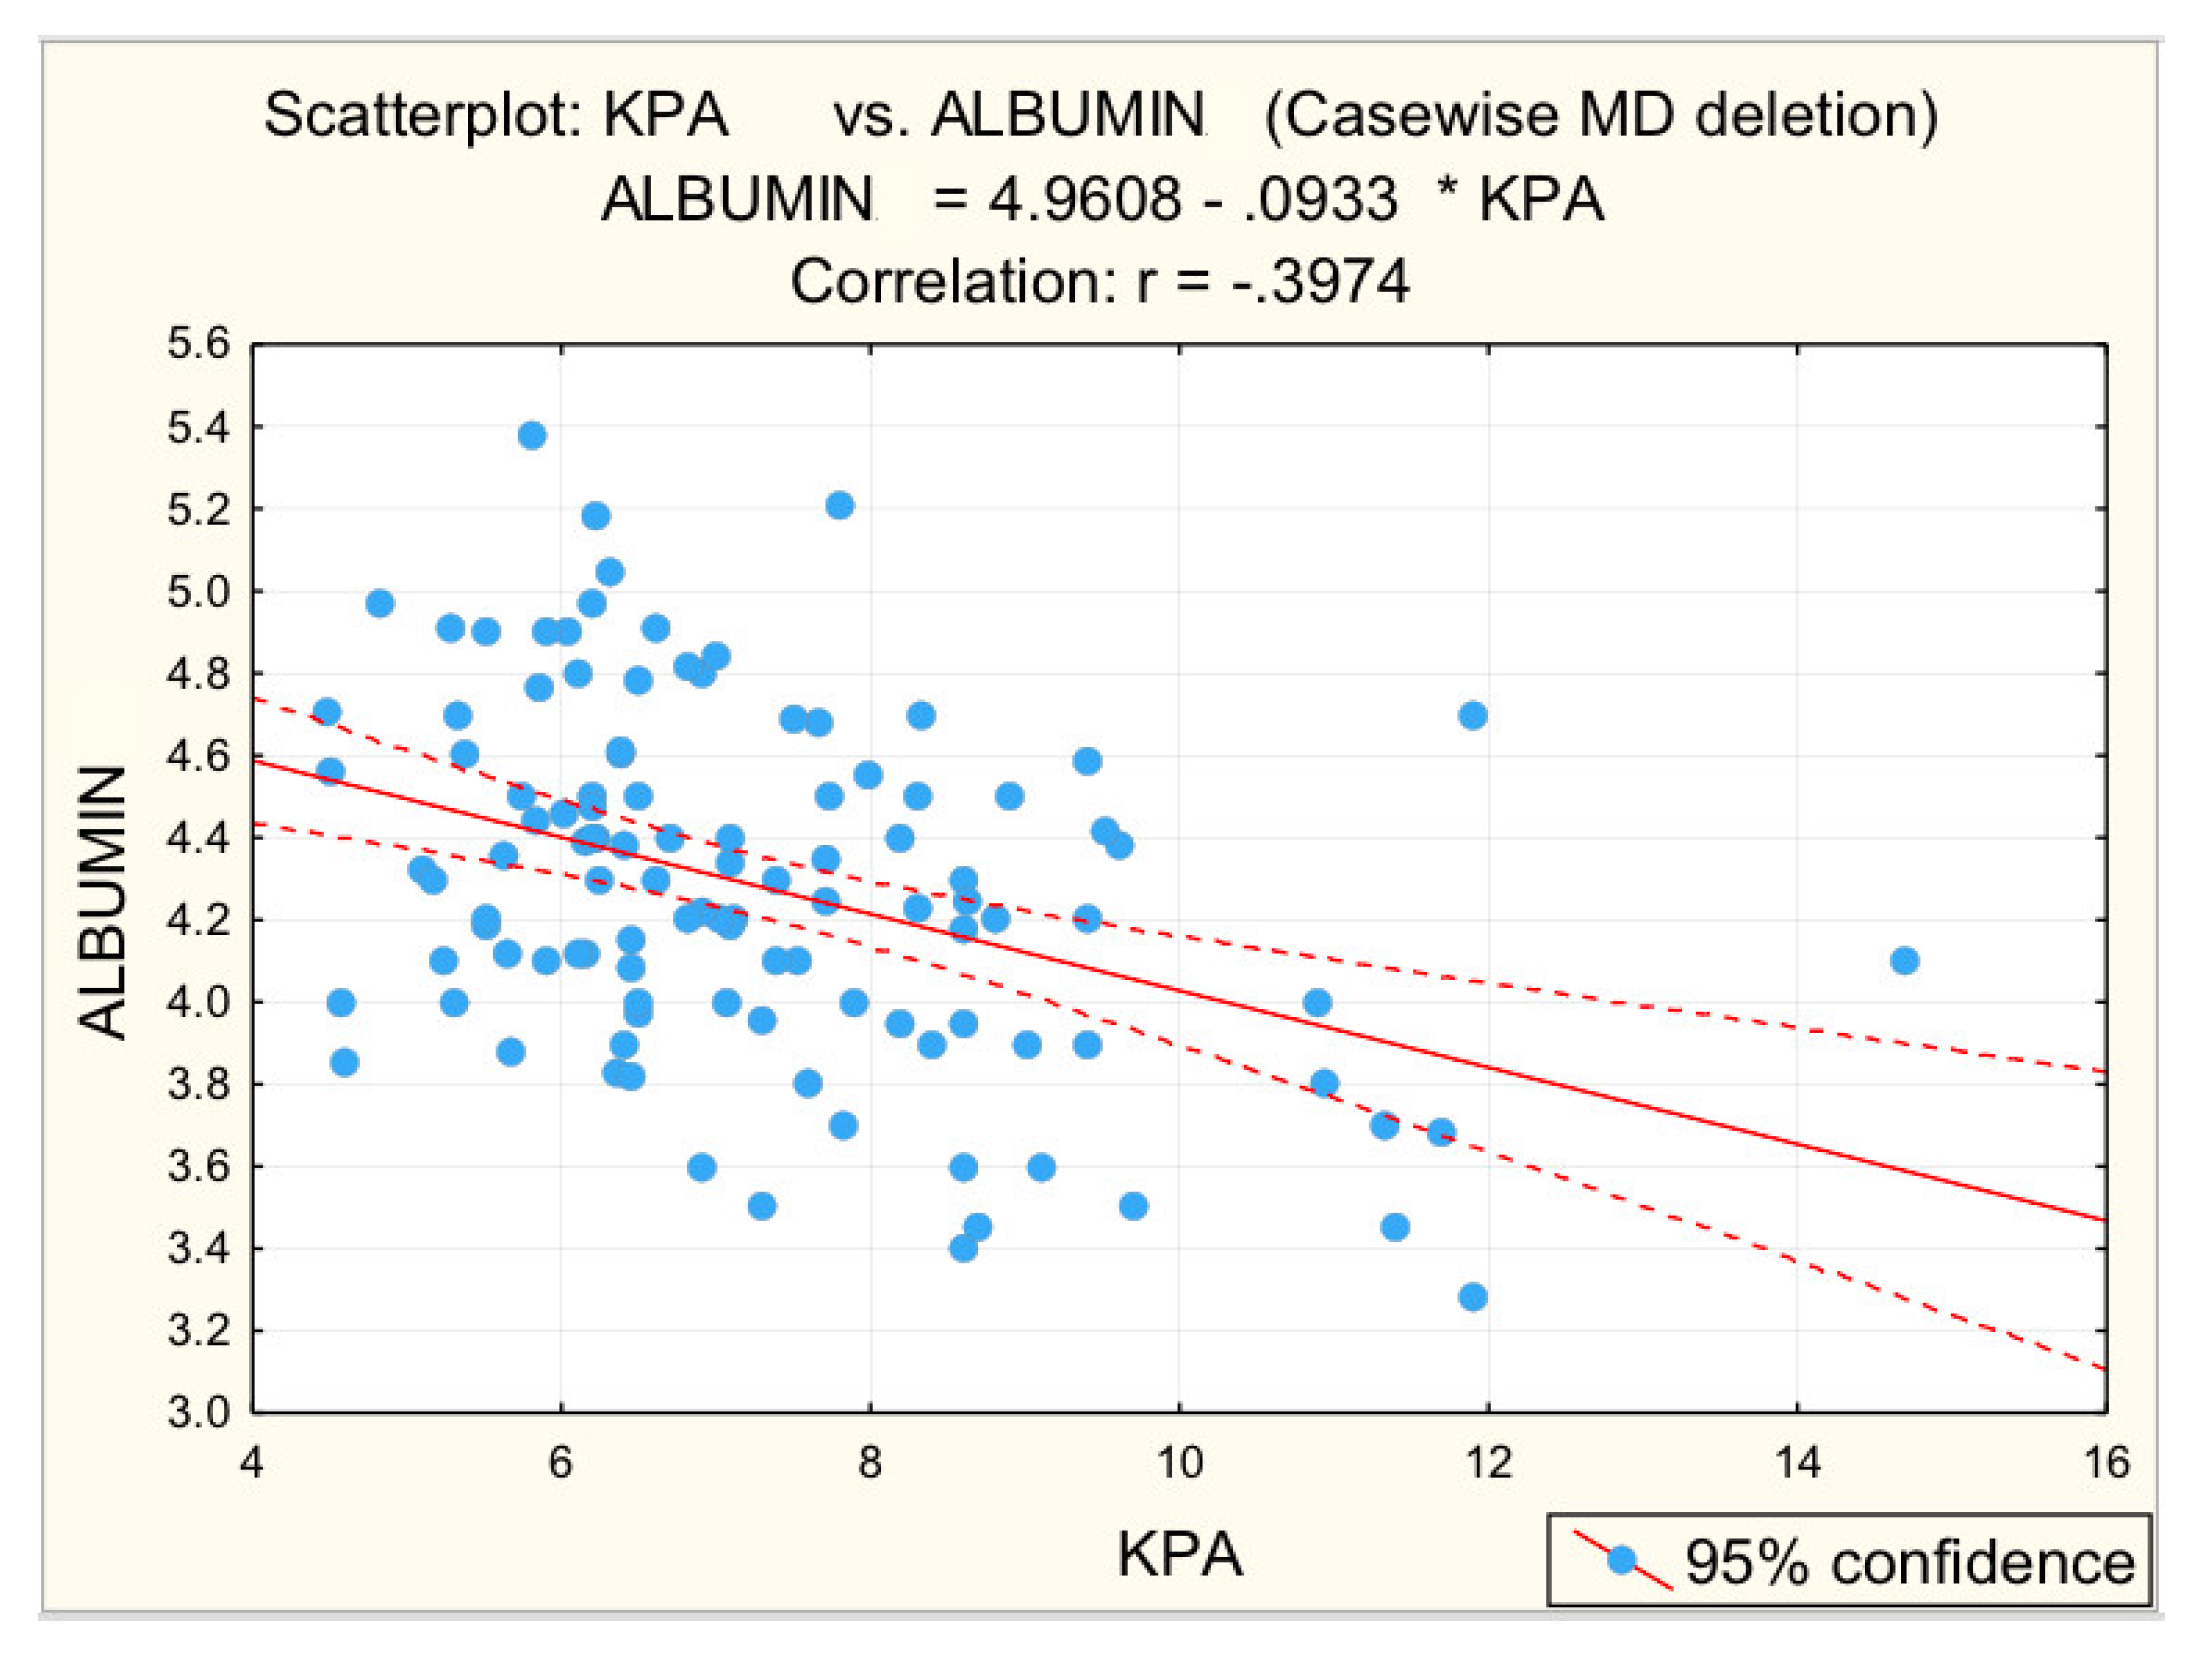
3.2. Analysis of Correlations between the Risk Values of Some Measured Parameters and Liver Stiffness
3.3. Distribution of the Risk Values of the Parameters Analyzed
- for grade F0–F1, the most common risk values were for parameters: cholesterol (56%), GGT (44.0%), BMI (40.0%);
- for grade F2, the most common risk values were for parameters: BMI (76.7%), cholesterol (70%), triglycerides (60%), RLD (60%), GGT (46.7%);
- for grade F3–F4, the most common risk values were for parameters: BMI (83.9%), platelets (74.0%), RLD (71.0%), PV (71.0%), BSD (67.7%), GGT (61.3%), cholesterol (54.8%), triglycerides (54.8%).
3.4. Determination of a Logistic Regression Equation
- BMI: OR = 4.474–high risk;
- Platelets: OR = 9.230–very high risk;
- RLD: OR = 2.841-high risk;
- PV: OR = 6.868–very high risk;
- BSD: OR = 4.900–high risk.
- Platelet counts below the risk threshold with a risk of 10.874:
- Dilated PV above the risk threshold, with an associated risk of 8.234:
4. Discussion
5. Conclusions
Author Contributions
Funding
Institutional Review Board Statement
Informed Consent Statement
Data Availability Statement
Conflicts of Interest
Abbreviations
References
- Younossi, Z.M. Non-alcoholic fatty liver disease—A global public health perspective. J. Hepatol. 2019, 70, 531–544. [Google Scholar] [CrossRef] [PubMed]
- Castera, L.; Friedrich-Rust, M.; Loomba, R. Noninvasive Assessment of Liver Disease in Patients With Nonalcoholic Fatty Liver Disease. Gastroenterology 2019, 156, 1264–1281. [Google Scholar] [CrossRef] [PubMed]
- European Association for Study of Liver (EASL). EASL-ALEH Clinical Practice Guidelines: Non-invasive tests for evaluation of liver disease severity and prognosis. J. Hepatol. 2015, 63, 237–264. [Google Scholar] [CrossRef] [PubMed]
- Dietrich, C.F.; Bamber, J.; Berzigotti, A.; Bota, S.; Cantisani, V.; Castera, L.; Cosgrove, D.; Ferraioli, G.; Friedrich-Rust, M.; Gilja, O.H.; et al. EFSUMB guidelines and recommendations on the clinical use of liver ultrasound elastography, Update 2017 (Long Version). Eur. J. Ultrasound 2017, 38, 16–47. [Google Scholar]
- Stern, C.; Castera, L. Non-invasive diagnosis of hepatic steatosis. Hepatol. Int. 2017, 11, 70–78. [Google Scholar] [CrossRef]
- Martínez, S.M.; Crespo, G.; Navasa, M.; Forns, X. Noninvasive assessment of liver fibrosis. Hepatology 2011, 53, 325–335. [Google Scholar] [CrossRef]
- Fitzpatrick, E.; Dhawan, A. Noninvasive biomarkers in non-alcoholic fatty liver disease: Current status and a glimpse of the future. World J. Gastroenterol. 2014, 20, 10851–10863. [Google Scholar] [CrossRef]
- Patel, K.; Shackel, N.A. Current status of fibrosis markers. Curr. Opin. Gastroenterol. 2014, 30, 253–259. [Google Scholar] [CrossRef]
- Sharma, S.; Khalili, K.; Nguyen, G.C. Non-invasive diagnosis of advanced fibrosis and cirrhosis. World J. Gastroenterol. 2014, 20, 16820. [Google Scholar] [CrossRef]
- Alkhouri, N.; Feldstein, A.E. Noninvasive diagnosis of nonalcoholic fatty liver disease: Are we there yet? Metabolism 2016, 65, 1087–1095. [Google Scholar] [CrossRef]
- Platon, M.L.; Stefanescu, H.; Muresan, D.; Florea, M.; Szász, M.E.; Maniu, A.; Badea, R. Noninvasive assessment of liver steatosis using ultrasound methods. Med. Ultrason 2014, 16, 236–245. [Google Scholar]
- Kim, S.G.; Yoo, J.J.; Kim, Y.S.; Lee, B.; Jeong, S.W.; Jang, J.Y.; Lee, H.S.; Kim, Y.D.; Cheon, G.J.; Kim, B.S. The validity of two-dimensional shear wave ultrasound for assessing fibrosis stage in patients with chronic liver disease. Hepatology 2016, 64, 329A. [Google Scholar]
- Lonardo, A.; Bellentani, S.; Argo, C.K.; Ballestri, S.; Byrne, C.D.; Caldwell, S.H.; Cortez-Pinto, H.; Grieco, A.; Machado, M.V.; Miele, L.; et al. Epidemiological modifiers of non-alcoholic fatty liver disease: Focus on high-risk groups. Dig. Liver Dis. 2015, 47, 997–1006. [Google Scholar] [CrossRef] [PubMed]
- Camhi, S.M.; Bray, G.A.; Bouchard, C.; Greenway, F.L.; Johnson, W.D.; Newton, R.L.; Ravussin, E.; Ryan, D.H.; Smith, S.R.; Katzmarzyk, P.T. The relationship between waist circumference and BMI to visceral, subcutaneous, and total body fat; sex and race differences. Obesity 2011, 19, 402–408. [Google Scholar] [CrossRef]
- Ciećko-Michalska, I.; Szczepanek, M.; Wierzbicka-Tutka, I.; Zahradnik-Bilska, J.; Mach, T. Non-invasive diagnosis of steatosis, inflammatory changes and liver fibrosis in patients with non-alcoholic fatty liver diseases. Pilot study. Arch. Med. Sci. Atheroscler. Dis. 2018, 28, 179–183. [Google Scholar] [CrossRef] [PubMed][Green Version]
- McPherson, S.; Stewart, S.F.; Henderson, E.; Burt, A.D.; Day, C.P. Simple non-invasive fibrosis scoring systems can reliably exclude advanced fibrosis in patients with non-alcoholic fatty liver disease. Gut 2010, 59, 1265–1269. [Google Scholar] [CrossRef]
- De Castro, P.C.S.; Alberton, H.C.P.; Pedroso, M.L.A.; Morsoletto, D.B.G.; Junior, A.P.; Ivantes, C.A.P. Evaluation of progression of hepatic fibrosis in a group of patients with non-alcoholic fatty liver disease accompanied for 10 years. Arq. Gastroenterol. 2019, 56, 256–260. [Google Scholar] [CrossRef]
- Engin, A. Non-Alcoholic Fatty Liver Disease. Adv. Exp. Med. Biol. 2017, 960, 443–467. [Google Scholar]
- Cusi, K. Nonalcoholic fatty liver disease in type 2 diabetes mellitus. Curr. Opin. Endocrinol. Diabetes Obes. 2009, 16, 141–149. [Google Scholar] [CrossRef]
- Byrne, C.D.; Tangher, G. NAFLD a multisystemic disease. J. Hepatol. 2016, 62 (Suppl. 1), 47–64. [Google Scholar] [CrossRef]
- Younossi, Z.; Anstee, Q.M.; Marietti, M.; Hardy, T.; Henry, L.; Eslam, M.; George, J.; Bugianesi, E. Global burden of NAFLD and NASH: Trends, predictions, risk factors and prevention. Nat. Rev. Gastroenerol. Hepatol. 2018, 15, 11–20. [Google Scholar] [CrossRef] [PubMed]
- Younossi, Z.M.; Marchesini, G.; Pinto-Cortez, H.; Petta, S. Epidemiology of Nonalcoholic Fatty Liver Disease and Nonalcoholic Steatohepatitis: Implications for Liver Transplantation. Transplantation 2019, 103, 22–27. [Google Scholar] [CrossRef] [PubMed]
- Mofrad, P.; Contos, M.J.; Haque, M.; Sargeant, C.; Fisher, R.A.; Luketic, V.A.; Sterling, R.K.; Shiffman, M.L.; Stravitz, R.T.; Sanyal, A.J. Clinical and histological spectrum of nonalcoholic fatty liver disease associated with normal ALT values. Hepatology 2003, 37, 1286–1292. [Google Scholar] [CrossRef] [PubMed]
- Friedrich–Rust, M.; Ong, M.F.; Martens, S.; Sarrazin, C.; Bojunga, J.; Zeuzem, S.; Herrmann, E. Performance of transient elastography for the staging of liver fibrosis: A meta-analysis. Gastroenterology 2008, 134, 960–974. [Google Scholar] [CrossRef] [PubMed]
- Perumpail, B.J.; Khan, M.A.; Yoo, E.R.; Cholankeril, G.; Kim, D.; Ahmed, A. Clinical epidemiology and disease burden of nonalcoholic fatty liver disease. World J. Gastroenterol. 2017, 23, 8263–8276. [Google Scholar] [CrossRef] [PubMed]
- Rastogi, A.; Shasthry, S.M.; Agarwal, A.; Bihari, C.; Jain, P.; Jindal, A.; Sarin, S. Non-alcoholic fatty liver disease—Histological scoring systems: A large cohort single-center, evaluation study. APMIS 2017, 125, 962–973. [Google Scholar] [CrossRef] [PubMed]
- Verma, S.; Jensen, D.; Hart, J.; Mohanty, S.R. Predictive value of ALT levels for non-alcoholic steatohepatitis (NASH) and advanced fibrosis in non-alcoholic fatty liver disease (NAFLD). Liver Int. 2013, 33, 1398–1405. [Google Scholar] [CrossRef]
- Haring, R.; Wallaschofski, H.; Nauck, M.; Dörr, M.; Baumeister, S.E.; Völzke, H. Ultrasonographic hepatic steatosis increases prediction of mortality risk from elevated serum gamma-glutamyl transpeptidase levels. Hepatology 2009, 50, 1403–1411. [Google Scholar] [CrossRef]
- Stepanova, M.; Rafiq, N.; Younossi, Z.M. Components of metabolic syndrome are independent predictors of mortality in patients with chronic liver disease: A population-based study. Gut 2010, 59, 1410–1415. [Google Scholar] [CrossRef]
- Kawaguchi, K.; Sakai, Y.; Terashima, T.; Shimode, T.; Seki, A.; Orita, N.; Takeshita, Y.; Shimakami, T.; Takatori, H.; Arai, K.; et al. Decline in serum albumin concentration is a predictor of serious events in nonalcoholic fatty liver disease. Medicine 2021, 100, e26835. [Google Scholar] [CrossRef]


| Parameter | Mean Value | Standard Deviation | Standard Error | Min | Max | Shapiro–Wilk Test | |
|---|---|---|---|---|---|---|---|
| W | p | ||||||
| BMI | 31.466 | 4.4437 | 0.4218 | 21.500 | 45.000 | 0.96478 | 0.005 * |
| Platelets (/mm3) | 246,450.450 | 61,862.860 | 5871.763 | 112,000 | 445,000 | 0.98723 | 0.377 |
| ASAT (U/L) | 26.850 | 14.799 | 1.405 | 10.000 | 128.000 | 0.682 | 0.000 * |
| ALAT (U/L) | 37.54 | 23.694 | 2.249 | 6.000 | 112.000 | 0.847 | 0.000 * |
| ASAT/ALAT | 0.8142 | 0.311 | 0.030 | 0.400 | 1.600 | 0.928 | 0.000 * |
| GGT (U/L) | 57.14 | 47.179 | 4.478 | 13.000 | 334.000 | 0.747 | 0.000 * |
| Albumin (g/L) | 4.2817 | 0.426 | 0.041 | 3.280 | 5.380 | 0.994 | 0.933 |
| Blood glucose (mg/dL) | 118.26 | 49.631 | 4.711 | 75.000 | 358.000 | 0.650 | 0.000 * |
| Serum cholesterol (mg/dL) | 214.60 | 44.424 | 4.217 | 126.000 | 356.000 | 0.989 | 0.517 |
| Serum triglycerides (mg/dL) | 186.10 | 109.676 | 10.410 | 42.000 | 512.000 | 0.879 | 0.000 * |
| RLD (mm) | 143.550 | 15.353 | 1.457 | 112.000 | 187.000 | 0.957 | 0.001 * |
| Portal vein caliber (mm) | 12.482 | 1.671 | 0.159 | 9.000 | 17.800 | 0.988 | 0.397 |
| BSD (mm) | 115.280 | 15.780 | 1.498 | 80.000 | 155.000 | 0.983 | 0.135 |
| Parameter | Mean ± SD | p | |||
|---|---|---|---|---|---|
| Total | F0–F1 | F2 | F3–F4 | ||
| BMI | 31.466 ± 4.444 | 29.670 ± 4.135 | 31.797 ± 3.444 | 34.042 ± 4.547 | 0.000 * |
| Platelets (/mm3) | 246,450.45 ± 61,862.86 | 261,340.00 ± 61,821.537 | 248,200.00 ± 53,308.730 | 220,741.94 ± 63,145.318 | 0.000 * |
| ASAT (U/L) | 26.850 ± 14.799 | 23.360 ± 6.375 | 28.100 ± 12.400 | 31.260 ± 23.368 | 0.312 |
| ALAT (U/L) | 37.540 ± 23.694 | 32.880 ± 20.239 | 40.230 ± 22.071 | 42.450 ± 29.158 | 0.122 |
| ASAT/ALAT | 0.814 ± 0.311 | 0.8526 ± 0.338 | 0.760 ± 0.262 | 0.8048 ± 0.312 | 0.551 |
| GGT (U/L) | 57.140 ± 47.179 | 48.240 ± 3.415 | 56.630 ± 41.536 | 71.970 ± 65.654 | 0.122 |
| Albumin (g/L) | 4.282 ± 0.4263 | 4.429 ± 0.385 | 4.3037 ± 0.398 | 4.0230 ± 0.406 | 0.000 * |
| Blood glucose (mg/dL) | 118.260 ± 49.631 | 102.000 ± 17.131 | 100.100 ± 14.884 | 162.060 ± 74.735 | 0.015 * |
| Serum cholesterol (mg/dL) | 214.600 ± 44.424 | 212.360 ± 38.017 | 224.330 ± 47.098 | 208.810 ± 50.927 | 0.354 |
| Serum triglycerides (mg/dL) | 186.100 ± 109.676 | 162.160 ± 90.569 | 198.770 ± 122.890 | 212.450 ± 119.482 | 0.128 |
| RLD (mm) | 143.550 ± 15.353 | 139.820 ± 14.245 | 144.970 ± 13.283 | 148.190 ± 17.742 | 0.048 * |
| Portal vein caliber (mm) | 12.482 ± 1.6709 | 11.960 ± 1.374 | 12.237 ± 1.8922 | 13.561 ± 1.4049 | 0.000 * |
| BSD (mm) | 115.280 ± 15.780 | 108.18 ± 14.026 | 114.930 ± 13.272 | 127.060 ± 13.921 | 0.000 * |
| Fibrosis (kPa) vs. | Total | F3–F4 | ||
|---|---|---|---|---|
| r | p | r | p | |
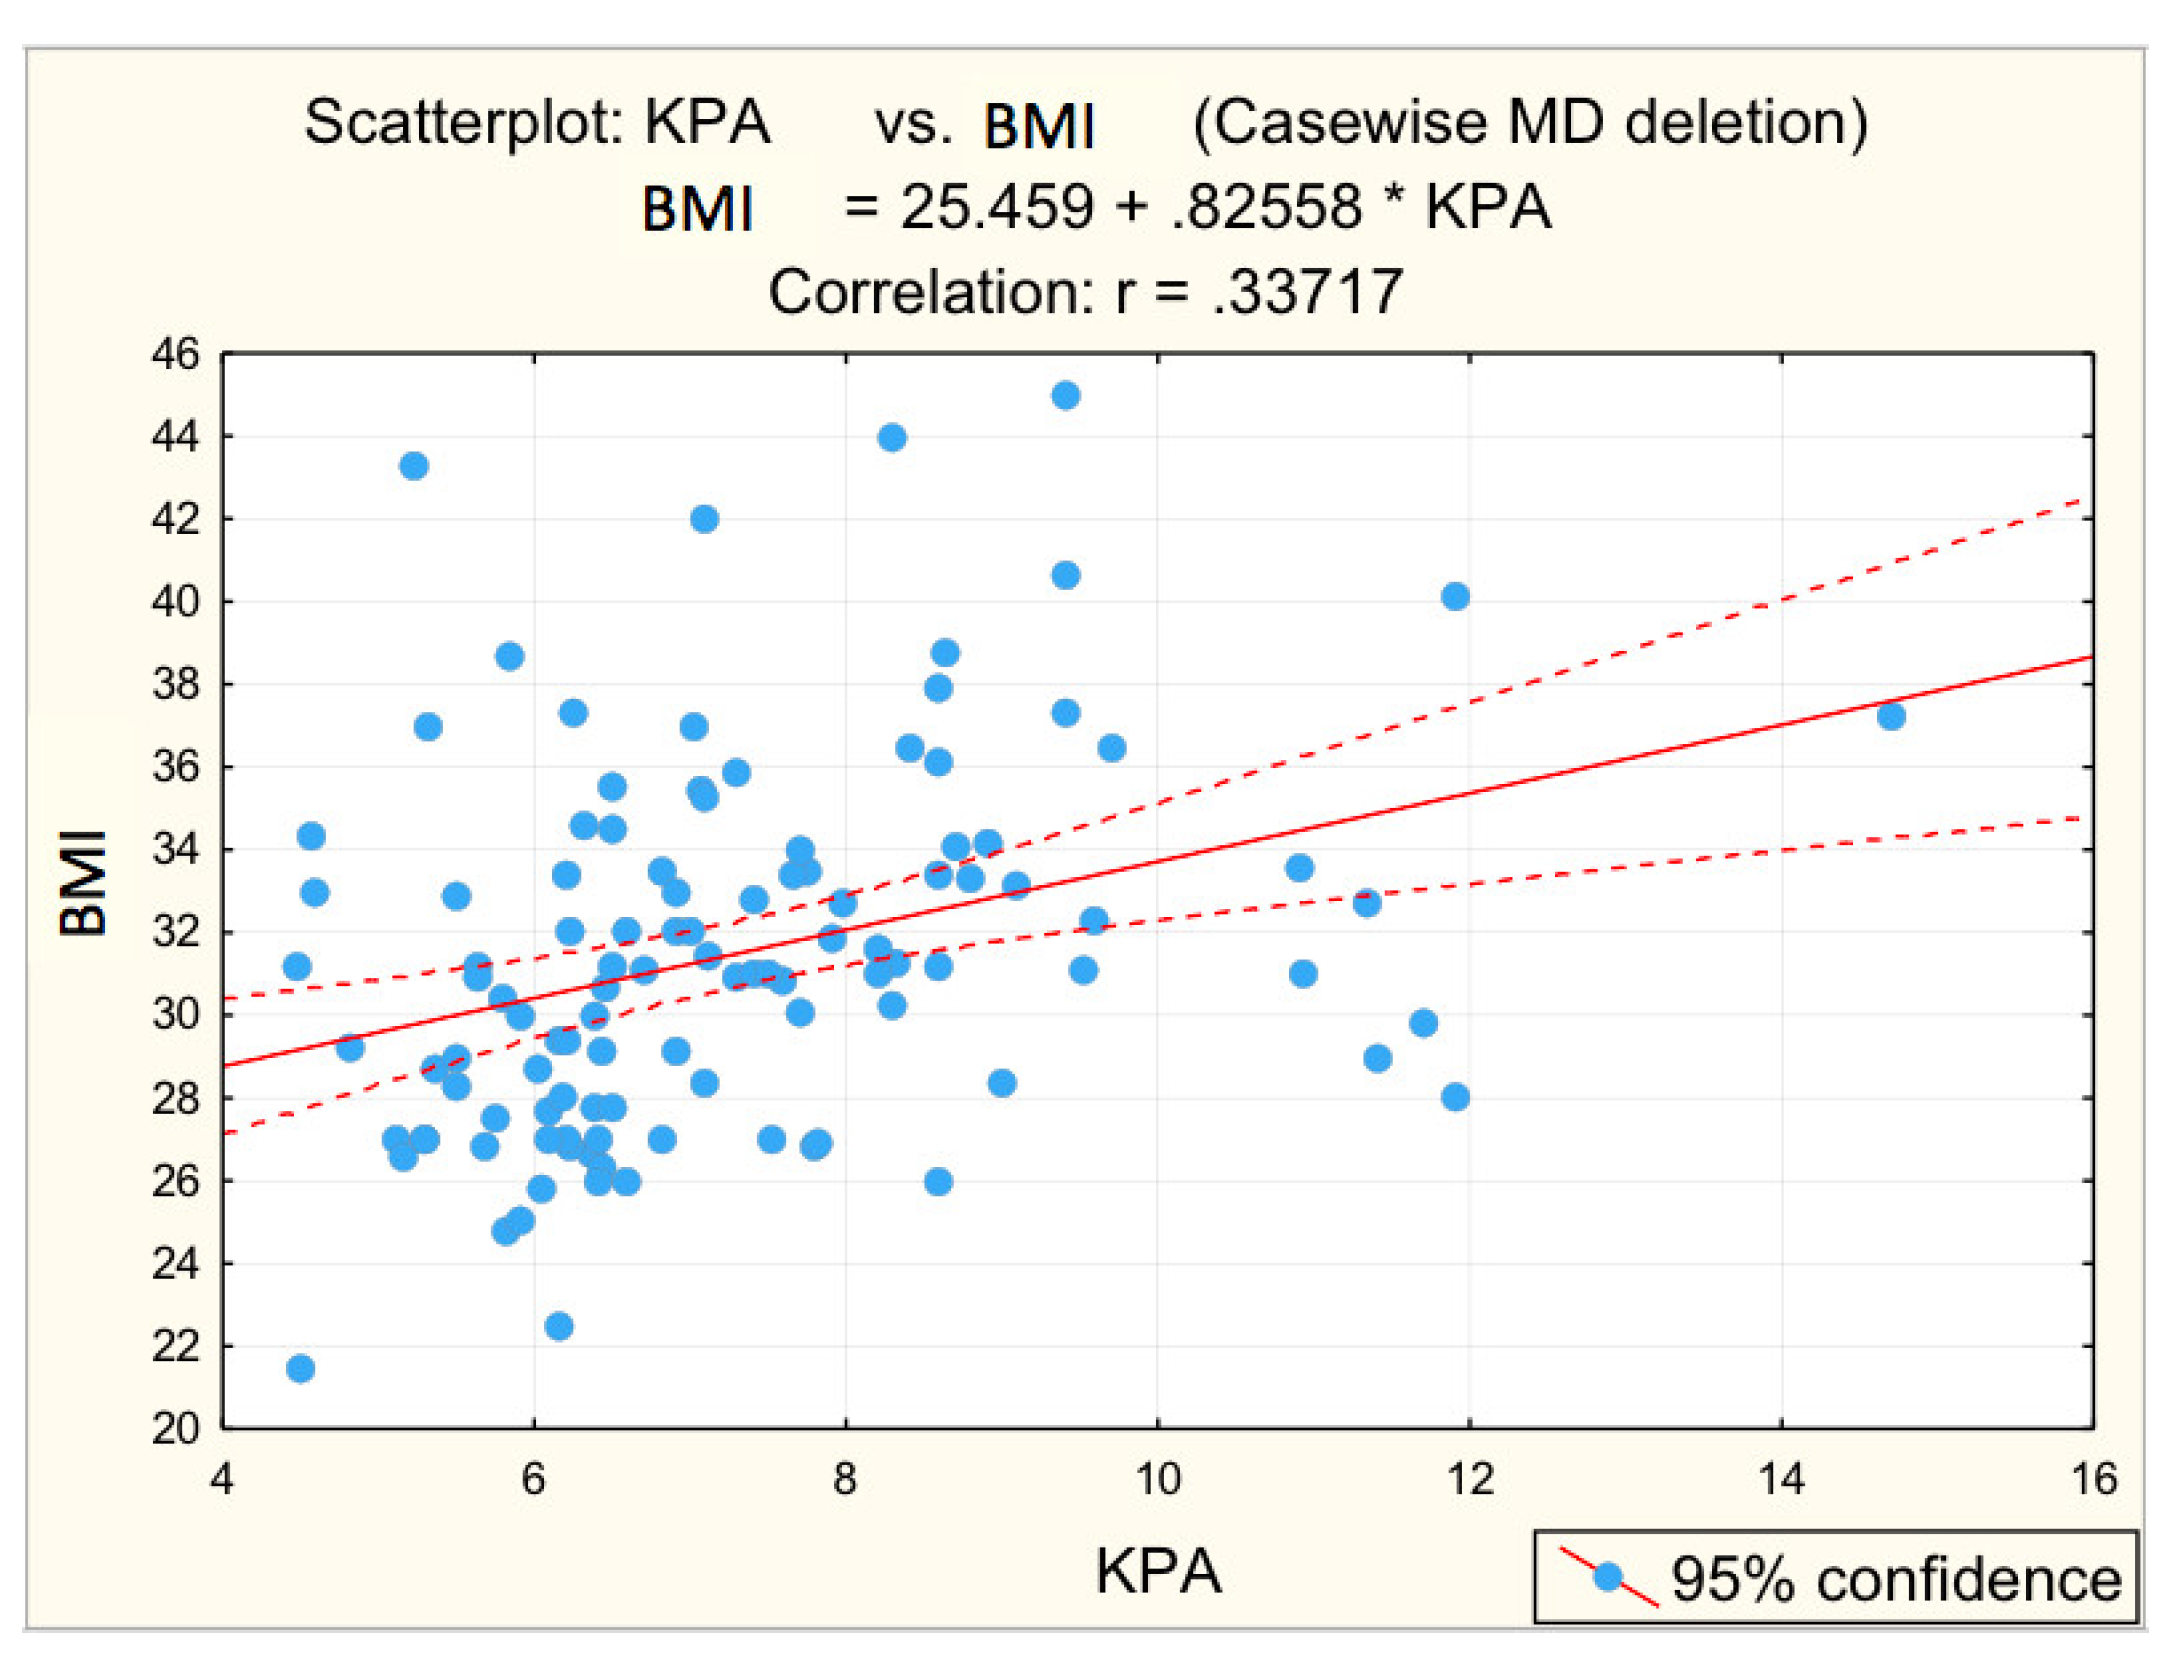
| BMI | 0.337 | 0.000 * | 0.1508 | 0.234 |
| Platelets (/mm3) | −0.362 | 0.000 * | −0.3450 | 0.005 * |
| ASAT (U/L) | 0.130 | 0.173 | 0.138 | 0.278 |
| ALAT (U/L) | 0.067 | 0.487 | 0.036 | 0.777 |
| ASAT/ALAT | 0.012 | 0.901 | 0.174 | 0.168 |
| GGT (U/L) | 0.203 | 0.033 * | 0.234 | 0.063 |
| Albumin (g/L) | −0.397 | 0.000 * | −0.416 | 0.001 * |
| Blood glucose (mg/dL) | 0.442 | 0.000 * | 0.2984 | 0.017 * |
| Serum cholesterol (mg/dL) | −0.103 | 0.281 | −0.221 | 0.079 |
| Serum triglycerides (mg/dL) | 0.187 | 0.050 * | 0.142 | 0.263 |
| RLD (mm) | 0.211 | 0.026 * | 0.125 | 0.325 |
| Portal vein caliber (mm) | 0.412 | 0.000 * | 0.3612 | 0.003 * |
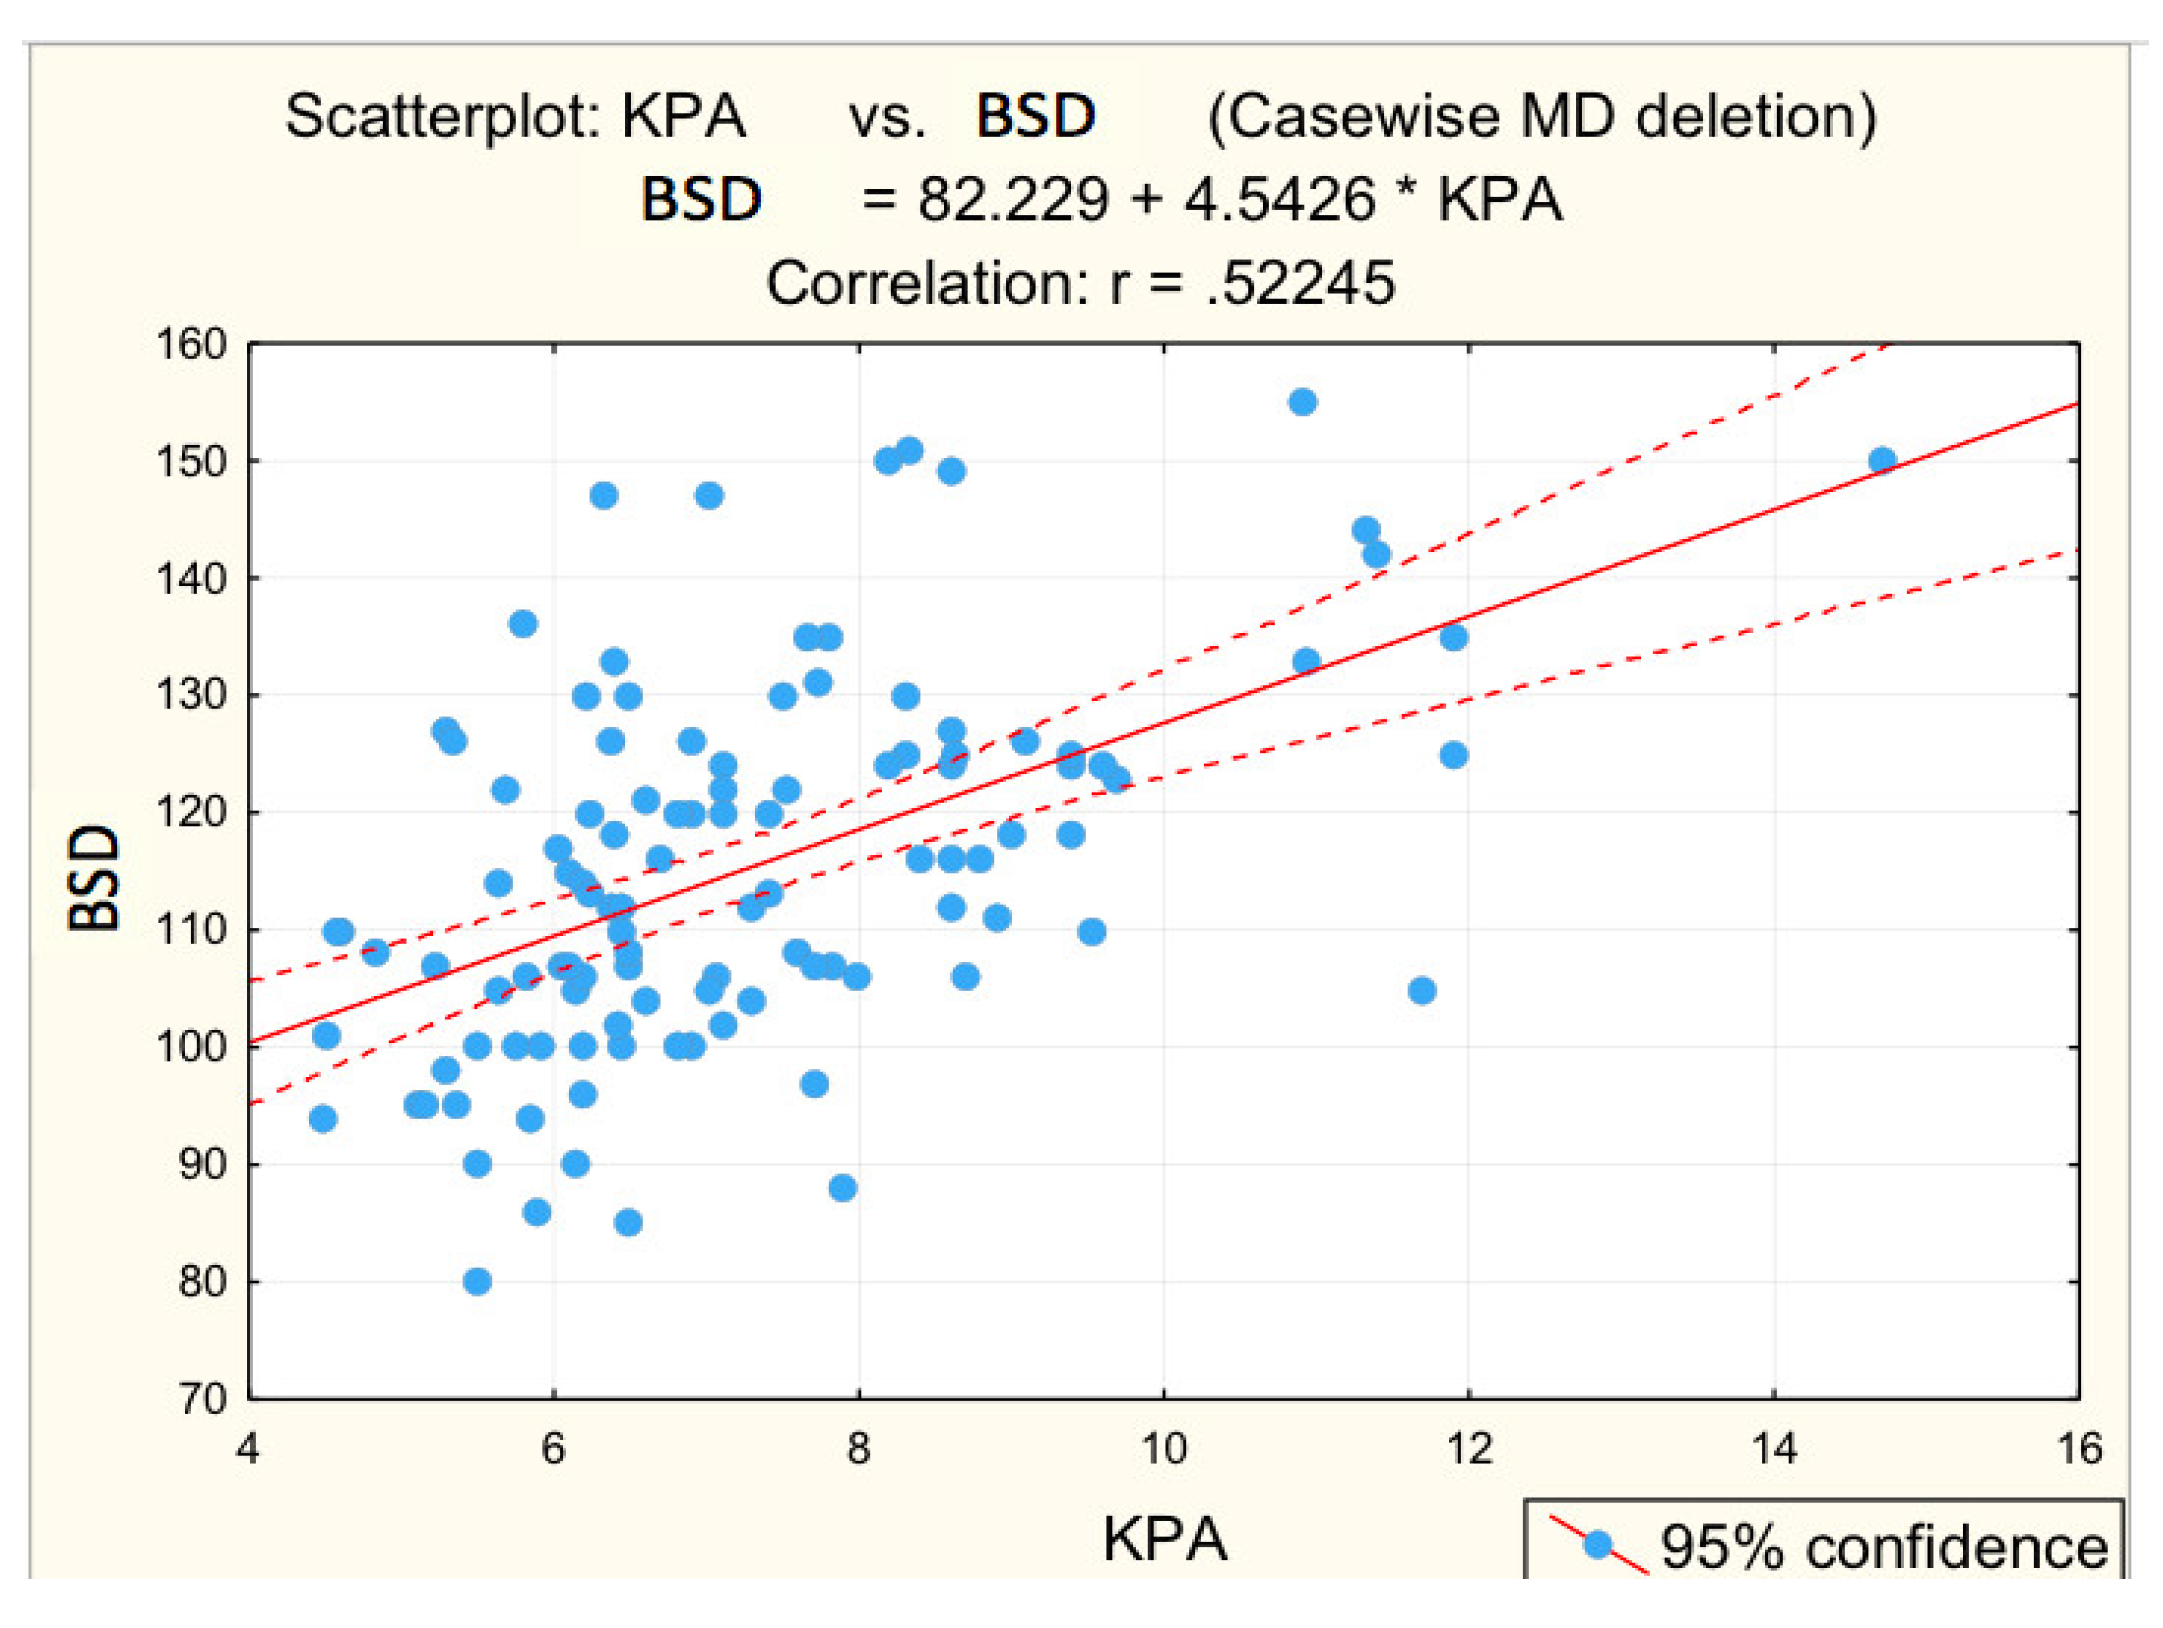
| BSD (mm) | 0.522 | 0.000 * | 0.386 | 0.002 * |
| Risk Values | Advanced Fibrosis | Pearson CHISQ | p | Odds Ratio | OR: 95% CI | ||||
|---|---|---|---|---|---|---|---|---|---|
| YES | NO | Min | Max | ||||||
| n | % | n | % | ||||||
| BMI | 26 | 83.9% | 43 | 53.8% | 8.619 | 0.003 * | 4.474 | 1.561 | 12.827 |
| Platelets (/mm3) | 23 | 74.2% | 19 | 23.8% | 24.171 | 0.000 * | 9.230 | 3.551 | 23.991 |
| ASAT (U/L) | 8 | 25.8% | 10 | 12.5% | 2.912 | 0.088 | 2.435 | 0.859 | 6.904 |
| ALAT (U/L) | 12 | 38.7% | 24 | 30.0% | 0.773 | 0.379 | 1.474 | 0.620 | 3.506 |
| ASAT/ALAT | 7 | 22.6% | 19 | 23.8% | 0.017 | 0.896 | 0.936 | 0.349 | 2.512 |
| GGT (U/L) | 19 | 61.3% | 36 | 45.0% | 2.372 | 0.124 | 1.935 | 0.830 | 4.511 |
| Albumin (g/L) | 4 | 12.9% | 0 | 0.0% | 0.005 | 0.005 * | - | - | - |
| Blood glucose (mg/dL) | 5 | 16.1% | 4 | 5.0% | 3.714 | 0.054 | 3.654 | 0.912 | 14.642 |
| Serum cholesterol (mg/dL) | 17 | 54.8% | 49 | 61.3% | 0.381 | 0.537 | 0.768 | 0.332 | 1.776 |
| Serum triglycerides (mg/dL) | 17 | 54.8% | 36 | 45.0% | 0.867 | 0.352 | 1.484 | 0.645 | 3.415 |
| RLD (mm) | 22 | 71.0% | 37 | 46.3% | 5.482 | 0.019 * | 2.841 | 1.165 | 6.928 |
| PV (mm) | 22 | 71.0% | 21 | 26.3% | 18.826 | 0.000 * | 6.868 | 2.732 | 17.262 |
| BSD (mm | 21 | 67.7% | 24 | 30.0% | 13.203 | 0.000 * | 4.900 | 2.008 | 11.956 |
| B | S.E. | Wald | df | p | Exp (B) | 95% C.I. for EXP(B) | ||
|---|---|---|---|---|---|---|---|---|
| Lower | Upper | |||||||
| Platelets | 2.386 | 0.558 | 18.292 | 1 | 0.000 * | 10.874 | 3.643 | 32.457 |
| PV | 2.108 | 0.555 | 14.406 | 1 | 0.000 * | 8.234 | 2.772 | 24.456 |
Publisher’s Note: MDPI stays neutral with regard to jurisdictional claims in published maps and institutional affiliations. |
© 2022 by the authors. Licensee MDPI, Basel, Switzerland. This article is an open access article distributed under the terms and conditions of the Creative Commons Attribution (CC BY) license (https://creativecommons.org/licenses/by/4.0/).
Share and Cite
Olteanu, V.-A.; Balan, G.G.; Timofte, O.; Dascalu, C.G.; Gologan, E.; Gilca-Blanariu, G.-E.; Diac, M.-M.; Sandu, I.; Stefanescu, G. Risk Predictors of Advanced Fibrosis in Non-Alcoholic Fatty Liver Disease. Diagnostics 2022, 12, 2136. https://doi.org/10.3390/diagnostics12092136
Olteanu V-A, Balan GG, Timofte O, Dascalu CG, Gologan E, Gilca-Blanariu G-E, Diac M-M, Sandu I, Stefanescu G. Risk Predictors of Advanced Fibrosis in Non-Alcoholic Fatty Liver Disease. Diagnostics. 2022; 12(9):2136. https://doi.org/10.3390/diagnostics12092136
Chicago/Turabian StyleOlteanu, Vasile-Andrei, Gheorghe G. Balan, Oana Timofte, Cristina Gena Dascalu, Elena Gologan, Georgiana-Emanuela Gilca-Blanariu, Madalina-Maria Diac, Ion Sandu, and Gabriela Stefanescu. 2022. "Risk Predictors of Advanced Fibrosis in Non-Alcoholic Fatty Liver Disease" Diagnostics 12, no. 9: 2136. https://doi.org/10.3390/diagnostics12092136
APA StyleOlteanu, V.-A., Balan, G. G., Timofte, O., Dascalu, C. G., Gologan, E., Gilca-Blanariu, G.-E., Diac, M.-M., Sandu, I., & Stefanescu, G. (2022). Risk Predictors of Advanced Fibrosis in Non-Alcoholic Fatty Liver Disease. Diagnostics, 12(9), 2136. https://doi.org/10.3390/diagnostics12092136