
Papillary and Trabecular Muscles Have Substantial Impact on Quantification of Left Ventricle in Patients with Hypertrophic Obstructive Cardiomyopathy

 ,
,
Abstract
:1. Introduction
2. Methods
2.1. Study Population
2.2. CMR Imaging
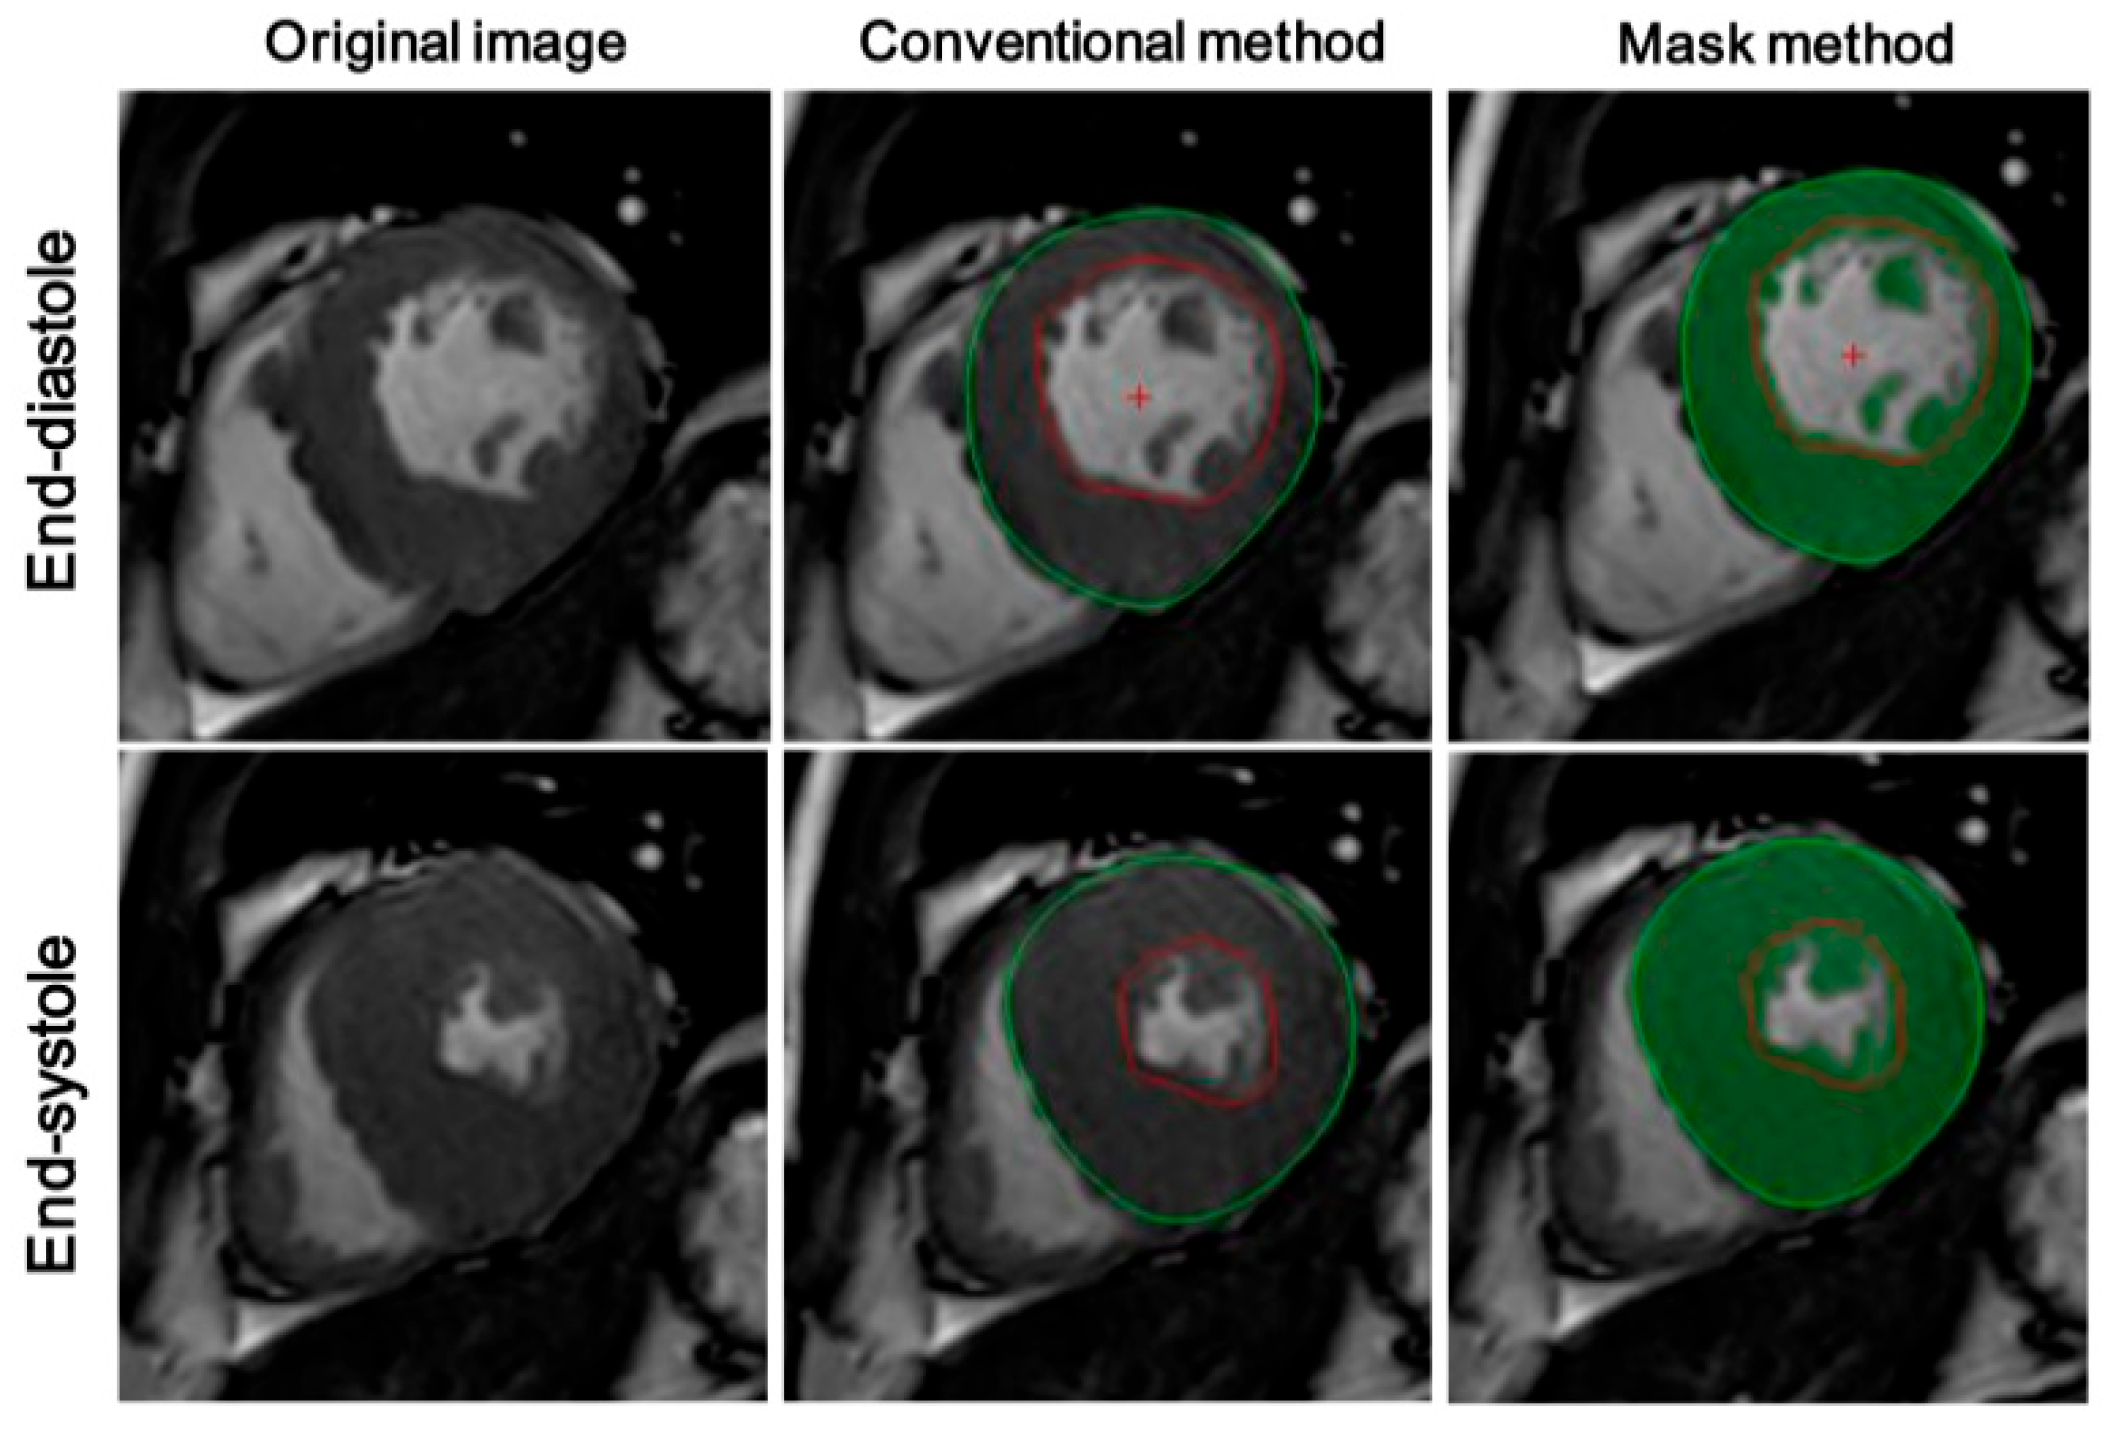
2.3. CMRI Analysis
2.4. Laboratory Measurements
2.5. Statistical Analysis
3. Results
4. Discussion
5. Conclusions
Author Contributions
Funding
Institutional Review Board Statement
Informed Consent Statement
Data Availability Statement
Conflicts of Interest
References
- Maron, B.J.; Desai, M.Y.; Nishimura, R.A.; Spirito, P.; Rakowski, H.; Towbin, J.A.; Rowin, E.J.; Maron, M.S.; Sherrid, M.V. Diagnosis and Evaluation of Hypertrophic Cardiomyopathy: JACC State-of-the-Art Review. J. Am. Coll. Cardiol. 2022, 79, 372–389. [Google Scholar] [CrossRef] [PubMed]
- Tang, B.; Song, Y.; Cui, H.; Ji, K.; Yu, Q.; Zhu, C.; Zhao, S.; Wang, S. Prognosis of adult obstructive hypertrophic cardiomyopathy patients with different morphological types after surgical myectomy. Eur. J. Cardio Thorac. Surg. 2018, 54, 310–317. [Google Scholar] [CrossRef] [PubMed]
- Monda, E.; Palmiero, G.; Lioncino, M.; Rubino, M.; Cirillo, A.; Fusco, A.; Caiazza, M.; Verrillo, F.; Diana, G.; Mauriello, A.; et al. Multimodality Imaging in Cardiomyopathies with Hypertrophic Phenotypes. J. Clin. Med. 2022, 11, 868. [Google Scholar] [CrossRef] [PubMed]
- Sivalokanathan, S. The Role of Cardiovascular Magnetic Resonance Imaging in the Evaluation of Hypertrophic Cardiomyopathy. Diagnostics 2022, 12, 314. [Google Scholar] [CrossRef]
- Moody, W.E.; Vijapurapu, R.; Steeds, R.P. Impact of Myocardial Contouring Method on the Cardiac MRI Assessment of Left Ventricular Mass in Hypertrophied Hearts. Radiol. Cardiothorac. Imaging 2020, 2, e200416. [Google Scholar] [CrossRef]
- Moody, W.E.; Hudsmith, L.E.; Holloway, B.; Treibel, T.A.; Davies, R.; Kozor, R.; Hamilton-Craig, C.; Edwards, N.C.; Bradlow, W.M.; Moon, J.C.; et al. Variation in cardiovascular magnetic resonance myocardial contouring: Insights from an international survey. J. Magn. Reson. Imaging 2019, 50, 1336–1338. [Google Scholar] [CrossRef] [Green Version]
- Wang, S.; Cui, H.; Yu, Q.; Chen, H.; Zhu, C.; Wang, J.; Xiao, M.; Zhang, Y.; Wu, R.; Hu, S. Excision of anomalous muscle bundles as an important addition to extended septal myectomy for treatment of left ventricular outflow tract obstruction. J. Thorac. Cardiovasc. Surg. 2016, 152, 461–468. [Google Scholar] [CrossRef] [Green Version]
- Yang, C.; Zhang, C.; Jia, R.; Qiao, S.; Yuan, J.; Jin, Z. Significance and Determinants of Plasma Apelin in Patients With Obstructive Hypertrophic Cardiomyopathy. Front. Cardiovasc. Med. 2022, 9, 904892. [Google Scholar] [CrossRef]
- Rajiah, P.; Fulton, N.L.; Bolen, M. Magnetic resonance imaging of the papillary muscles of the left ventricle: Normal anatomy, variants, and abnormalities. Insights Imaging 2019, 10, 83. [Google Scholar] [CrossRef] [Green Version]
- Dohy, Z.; Szabo, L.; Toth, A.; Czimbalmos, C.; Horvath, R.; Horvath, V.; Suhai, F.I.; Geller, L.; Merkely, B.; Vago, H. Prognostic significance of cardiac magnetic resonance-based markers in patients with hypertrophic cardiomyopathy. Int. J. Cardiovasc. Imaging 2021, 37, 2027–2036. [Google Scholar] [CrossRef]
- Lentz, C.J.; Schaff, H.V.; Morris, C.S.; Nishimura, R.A.; Ommen, S.R.; Maleszewski, J.J.; Dearani, J.A. Anomalous papillary muscles-Implications in the surgical treatment of hypertrophic obstructive cardiomyopathy. J. Thorac. Cardiovasc. Surg. 2022, 163, 83–89. [Google Scholar] [CrossRef] [PubMed]
- Elliott, P.M.; Anastasakis, A.; Borger, M.A.; Borggrefe, M.; Cecchi, F.; Charron, P.; Hagege, A.A.; Lafont, A.; Limongelli, G.; Mahrholdt, H.; et al. 2014 ESC Guidelines on diagnosis and management of hypertrophic cardiomyopathy: The Task Force for the Diagnosis and Management of Hypertrophic Cardiomyopathy of the European Society of Cardiology (ESC). Eur. Heart J. 2014, 35, 2733–2779. [Google Scholar]
- Yang, C.; Zhang, C.; Yuan, J.; Cui, J.; Qiao, S. Prevalence and determinants of elevated D-dimer in patients with hypertrophic cardiomyopathy. Biomark. Med. 2020, 14, 131–140. [Google Scholar] [CrossRef] [PubMed]
- Schulz-Menger, J.; Bluemke, D.A.; Bremerich, J.; Flamm, S.D.; Fogel, M.A.; Friedrich, M.G.; Kim, R.J.; von Knobelsdorff-Brenkenhoff, F.; Kramer, C.M.; Pennell, D.J.; et al. Standardized image interpretation and post processing in cardiovascular magnetic resonance: Society for Cardiovascular Magnetic Resonance (SCMR) board of trustees task force on standardized post processing. J. Cardiovasc. Magn. Reson. 2013, 15, 35. [Google Scholar] [CrossRef] [Green Version]
- Chuang, M.L.; Gona, P.; Hautvast, G.L.; Salton, C.J.; Blease, S.J.; Yeon, S.B.; Breeuwer, M.; O’Donnell, C.J.; Manning, W.J. Correlation of trabeculae and papillary muscles with clinical and cardiac characteristics and impact on CMR measures of LV anatomy and function. JACC Cardiovasc. Imaging 2012, 5, 1115–1123. [Google Scholar] [CrossRef] [Green Version]
- Gommans, D.H.; Bakker, J.; Cramer, G.E.; Verheugt, F.W.; Brouwer, M.A.; Kofflard, M.J. Impact of the papillary muscles on cardiac magnetic resonance image analysis of important left ventricular parameters in hypertrophic cardiomyopathy. Neth. Heart J. 2016, 24, 326–331. [Google Scholar] [CrossRef] [PubMed] [Green Version]
- Han, Y.; Osborn, E.A.; Maron, M.S.; Manning, W.J.; Yeon, S.B. Impact of papillary and trabecular muscles on quantitative analyses of cardiac function in hypertrophic cardiomyopathy. J. Magn. Reson. Imaging 2009, 30, 1197–1202. [Google Scholar] [CrossRef] [PubMed]
- Harrigan, C.J.; Appelbaum, E.; Maron, B.J.; Buros, J.L.; Gibson, C.M.; Lesser, J.R.; Udelson, J.E.; Manning, W.J.; Maron, M.S. Significance of papillary muscle abnormalities identified by cardiovascular magnetic resonance in hypertrophic cardiomyopathy. Am. J. Cardiol. 2008, 101, 668–673. [Google Scholar] [CrossRef]
- Murphy, S.P.; Ibrahim, N.E.; Januzzi, J.J. Heart Failure With Reduced Ejection Fraction: A Review. JAMA 2020, 324, 488–504. [Google Scholar] [CrossRef]
- Janik, M.; Cham, M.D.; Ross, M.I.; Wang, Y.; Codella, N.; Min, J.K.; Prince, M.R.; Manoushagian, S.; Okin, P.M.; Devereux, R.B.; et al. Effects of papillary muscles and trabeculae on left ventricular quantification: Increased impact of methodological variability in patients with left ventricular hypertrophy. J. Hypertens. 2008, 26, 1677–1685. [Google Scholar] [CrossRef]
- Park, E.A.; Lee, W.; Kim, H.K.; Chung, J.W. Effect of papillary muscles and trabeculae on left ventricular measurement using cardiovascular magnetic resonance imaging in patients with hypertrophic cardiomyopathy. Korean J. Radiol. 2015, 16, 4–12. [Google Scholar] [CrossRef] [PubMed] [Green Version]
- Schulz-Menger, J.; Abdel-Aty, H.; Rudolph, A.; Elgeti, T.; Messroghli, D.; Utz, W.; Boye, P.; Bohl, S.; Busjahn, A.; Hamm, B.; et al. Gender-specific differences in left ventricular remodelling and fibrosis in hypertrophic cardiomyopathy: Insights from cardiovascular magnetic resonance. Eur. J. Heart Fail. 2008, 10, 850–854. [Google Scholar] [CrossRef] [PubMed] [Green Version]
- Affronti, A.; Pruna-Guillen, R.; Sandoval, E.; Pereda, D.; Alcocer, J.; Castella, M.; Quintana, E. Surgery for Hypertrophic Obstructive Cardiomyopathy: Comprehensive LVOT Management beyond Septal Myectomy. J. Clin. Med. 2021, 10, 4397. [Google Scholar] [CrossRef] [PubMed]
- Zhang, C.; Liu, R.; Yuan, J.; Cui, J.; Hu, F.; Yang, W.; Zhang, Y.; Yang, C.; Qiao, S. Significance and Determinants of Cardiac Troponin I in Patients With Obstructive Hypertrophic Cardiomyopathy. Am. J. Cardiol. 2015, 116, 1744–1751. [Google Scholar] [CrossRef] [PubMed]
- Stein, E.J.; Fearon, W.F.; Elmariah, S.; Kim, J.B.; Kapadia, S.; Kumbhani, D.J.; Gillam, L.; Whisenant, B.; Quader, N.; Zajarias, A.; et al. Left Ventricular Hypertrophy and Biomarkers of Cardiac Damage and Stress in Aortic Stenosis. J. Am. Heart Assoc. 2022, 11, e23466. [Google Scholar] [CrossRef]
- Zhu, L.; Li, C.; Liu, Q.; Xu, W.; Zhou, X. Molecular biomarkers in cardiac hypertrophy. J. Cell. Mol. Med. 2019, 23, 1671–1677. [Google Scholar] [CrossRef]
- Zhang, Q.; Burrage, M.K.; Lukaschuk, E.; Shanmuganathan, M.; Popescu, I.A.; Nikolaidou, C.; Mills, R.; Werys, K.; Hann, E.; Barutcu, A.; et al. Toward Replacing Late Gadolinium Enhancement With Artificial Intelligence Virtual Native Enhancement for Gadolinium-Free Cardiovascular Magnetic Resonance Tissue Characterization in Hypertrophic Cardiomyopathy. Circulation 2021, 144, 589–599. [Google Scholar] [CrossRef]
- Wang, S.; Chauhan, D.; Patel, H.; Amir-Khalili, A.; Da, S.I.; Sojoudi, A.; Friedrich, S.; Singh, A.; Landeras, L.; Miller, T.; et al. Assessment of right ventricular size and function from cardiovascular magnetic resonance images using artificial intelligence. J. Cardiovasc. Magn. Reson. 2022, 24, 27. [Google Scholar] [CrossRef]


| Variable | Total (n = 74) | Men (n = 47) | Women (n = 27) |
|---|---|---|---|
| Age, years | 47.0 ± 14.3 | 44.9 ± 12.7 | 50.8 ± 16.3 |
| NYHA functional class Ⅲ or Ⅳ, n (%) | 16 (21.6%) | 8 (17.0%) | 8 (29.6%) |
| Body mass index (BMI), kg/m2 | 25.6 ± 3.6 | 26.2 ± 3.6 | 24.5 ± 3.3 |
| Systolic blood pressure, mmHg | 121.8 ± 15.2 | 121.7 ± 15.6 | 121.9 ± 14.9 |
| Diastolic blood pressure, mmHg | 73.7 ± 10.4 | 74.1 ± 10.6 | 73.0 ± 10.3 |
| Heart rate, beats/min | 72.3 ± 11.3 | 73.4 ± 11.5 | 67.9 ± 6.7 |
| Hypertension, n (%) | 18 (24.3%) | 11 (23.4%) | 7 (25.9%) |
| Atrial fibrillation, n (%) | 15 (20.3%) | 11 (23.4%) | 4 (14.9%) |
| β-Blockers, n (%) | 52 (70.3%) | 33 (70.2%) | 19 (70.4%) |
| Calcium channel blockers, n (%) | 24 (25.5%) | 18 (38.3%) | 6 (22.2%) |
| ACEI/ARB, n (%) | 6 (8.1%) | 4 (8.5%) | 2 (7.4%) |
| LVOTG at rest (mmHg) | 81.8 ± 38.2 | 77.9 ± 30.9 | 88.3 ± 47.9 |
| NT-proBNP (pmol/L) | 1113 (497–2201) | 863 (398–1646) | 2261 (1032–3592) |
| Ln (NT-proBNP) | 6.9 ± 1.1 | 6.6 ± 1.0 | 7.4 ± 1.1 |
| CK-MB (IU/L) | 12.0 ± 3.5 | 12.2 ± 3.4 | 11.6 ± 3.6 |
| Total | Men | Women | |||||||
|---|---|---|---|---|---|---|---|---|---|
| Conventional Method | Mask Method | Relative Difference | Conventional Method | Mask Method | Relative Difference | Conventional Method | Mask Method | Relative Difference | |
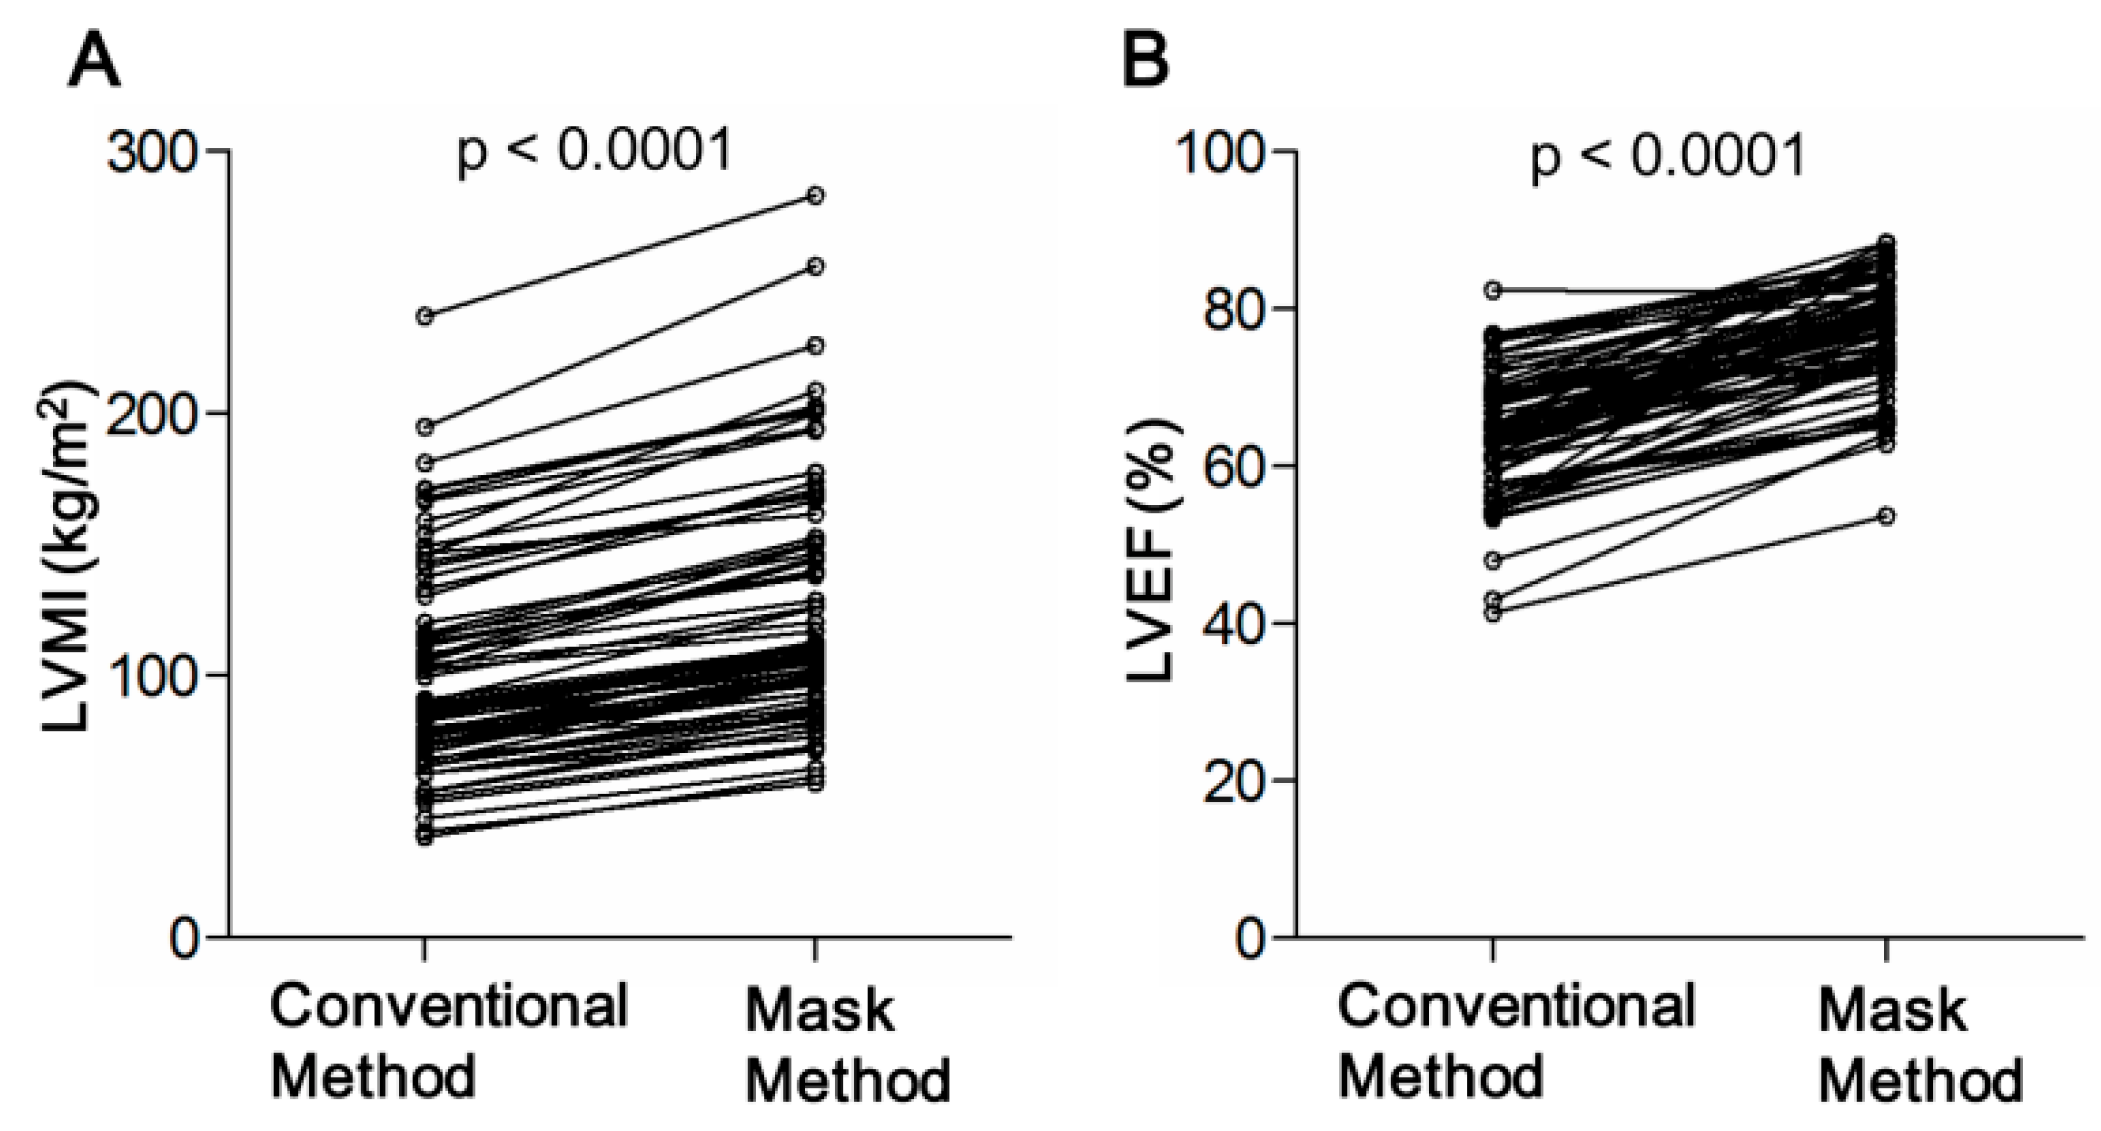
| LVM | 179.5 ± 75.7 | 227.4 ± 89.0 * | +26.9% | 195.5 ± 71.0 | 244.7 ± 84.1 * | +25.2% | 151.8 ± 76.9 | 197.4 ± 90.7 * | +30.0% |
| LV-EDV | 150.0 ± 38.4 | 103.1 ± 25.9 * | −45.5% | 156.3 ± 36.5 | 109.4 ± 26.8 * | −30.0% | 139.2 ± 39.7 | 92.1 ± 20.5 * | −33.8% |
| LV-ESV | 53.1 ± 18.2 | 23.2 ± 8.1 * | −56.3% | 55.8 ± 18.7 | 24.9 ± 7.9 * | −55.4% | 48.5 ± 16.5 | 20.1 ± 7.8 * | −58.6% |
| CO | 6.4 ± 1.9 | 5.3 ± 1.6 * | −20.8% | 6.7 ± 1.9 | 5.6 ± 1.6 * | −16.4% | 5.7 ± 1.8 | 4.7 ± 1.5 * | −17.5% |
| LVEF | 64.3 ± 7.9 | 77.2 ± 7.1 * | +20.1% | 64.2 ± 8.3 | 76.7 ± 7.1 * | +19.5% | 64.4 ± 7.2 | 78.0 ± 7.2 * | +21.1% |
| LVMI | 99.4 ± 39.8 | 126.4 ± 46.6 * | +27.2% | 103.5 ± 36.4 | 130.1 ± 43.4 * | +25.7% | 92.1 ± 44.8 | 119.9 ± 51.9 * | +30.2% |
| LV-EDVI | 82.5 ± 17.1 | 57.5 ± 12.4 * | −30.3% | 82.9 ± 17.8 | 58.3 ± 13.2 * | −29.7% | 81.9 ± 16.3 | 55.9 ± 10.9 * | −31.7% |
| LV-ESVI | 29.5 ± 9.3 | 12.9 ± 4.3 * | −56.3% | 29.6 ± 9.5 | 13.3 ± 4.1 * | −55.1% | 29.4 ± 9.1 | 12.3 ± 4.5 * | −58.2% |
| CI | 3.5 ± 1.0 | 3.0 ± 0.8 * | −14.3% | 3.6 ± 1.0 | 3.0 ± 0.8 * | −16.7% | 3.5 ± 1.0 | 2.9 ± 0.9 * | −17.1% |
| Variable | MOPTM | |
|---|---|---|
| r | p Value | |
| Age, y | 0.064 | 0.588 |
| BMI, kg/m2 | 0.278 | 0.017 |
| SBP, mmHg | 0.154 | 0.192 |
| Septal wall thickness, mm | 0.539 | <0.001 |
| LVM, g | 0.645 | <0.001 |
| LV-EDV, mL | 0.719 | <0.001 |
| LV-ESV, mL | 0.767 | <0.001 |
| LVEF, % | −0.287 | 0.013 |
| Left atrium volume, mL | 0.164 | 0.163 |
| LVOTG at rest, mmHg | 0.114 | 0.342 |
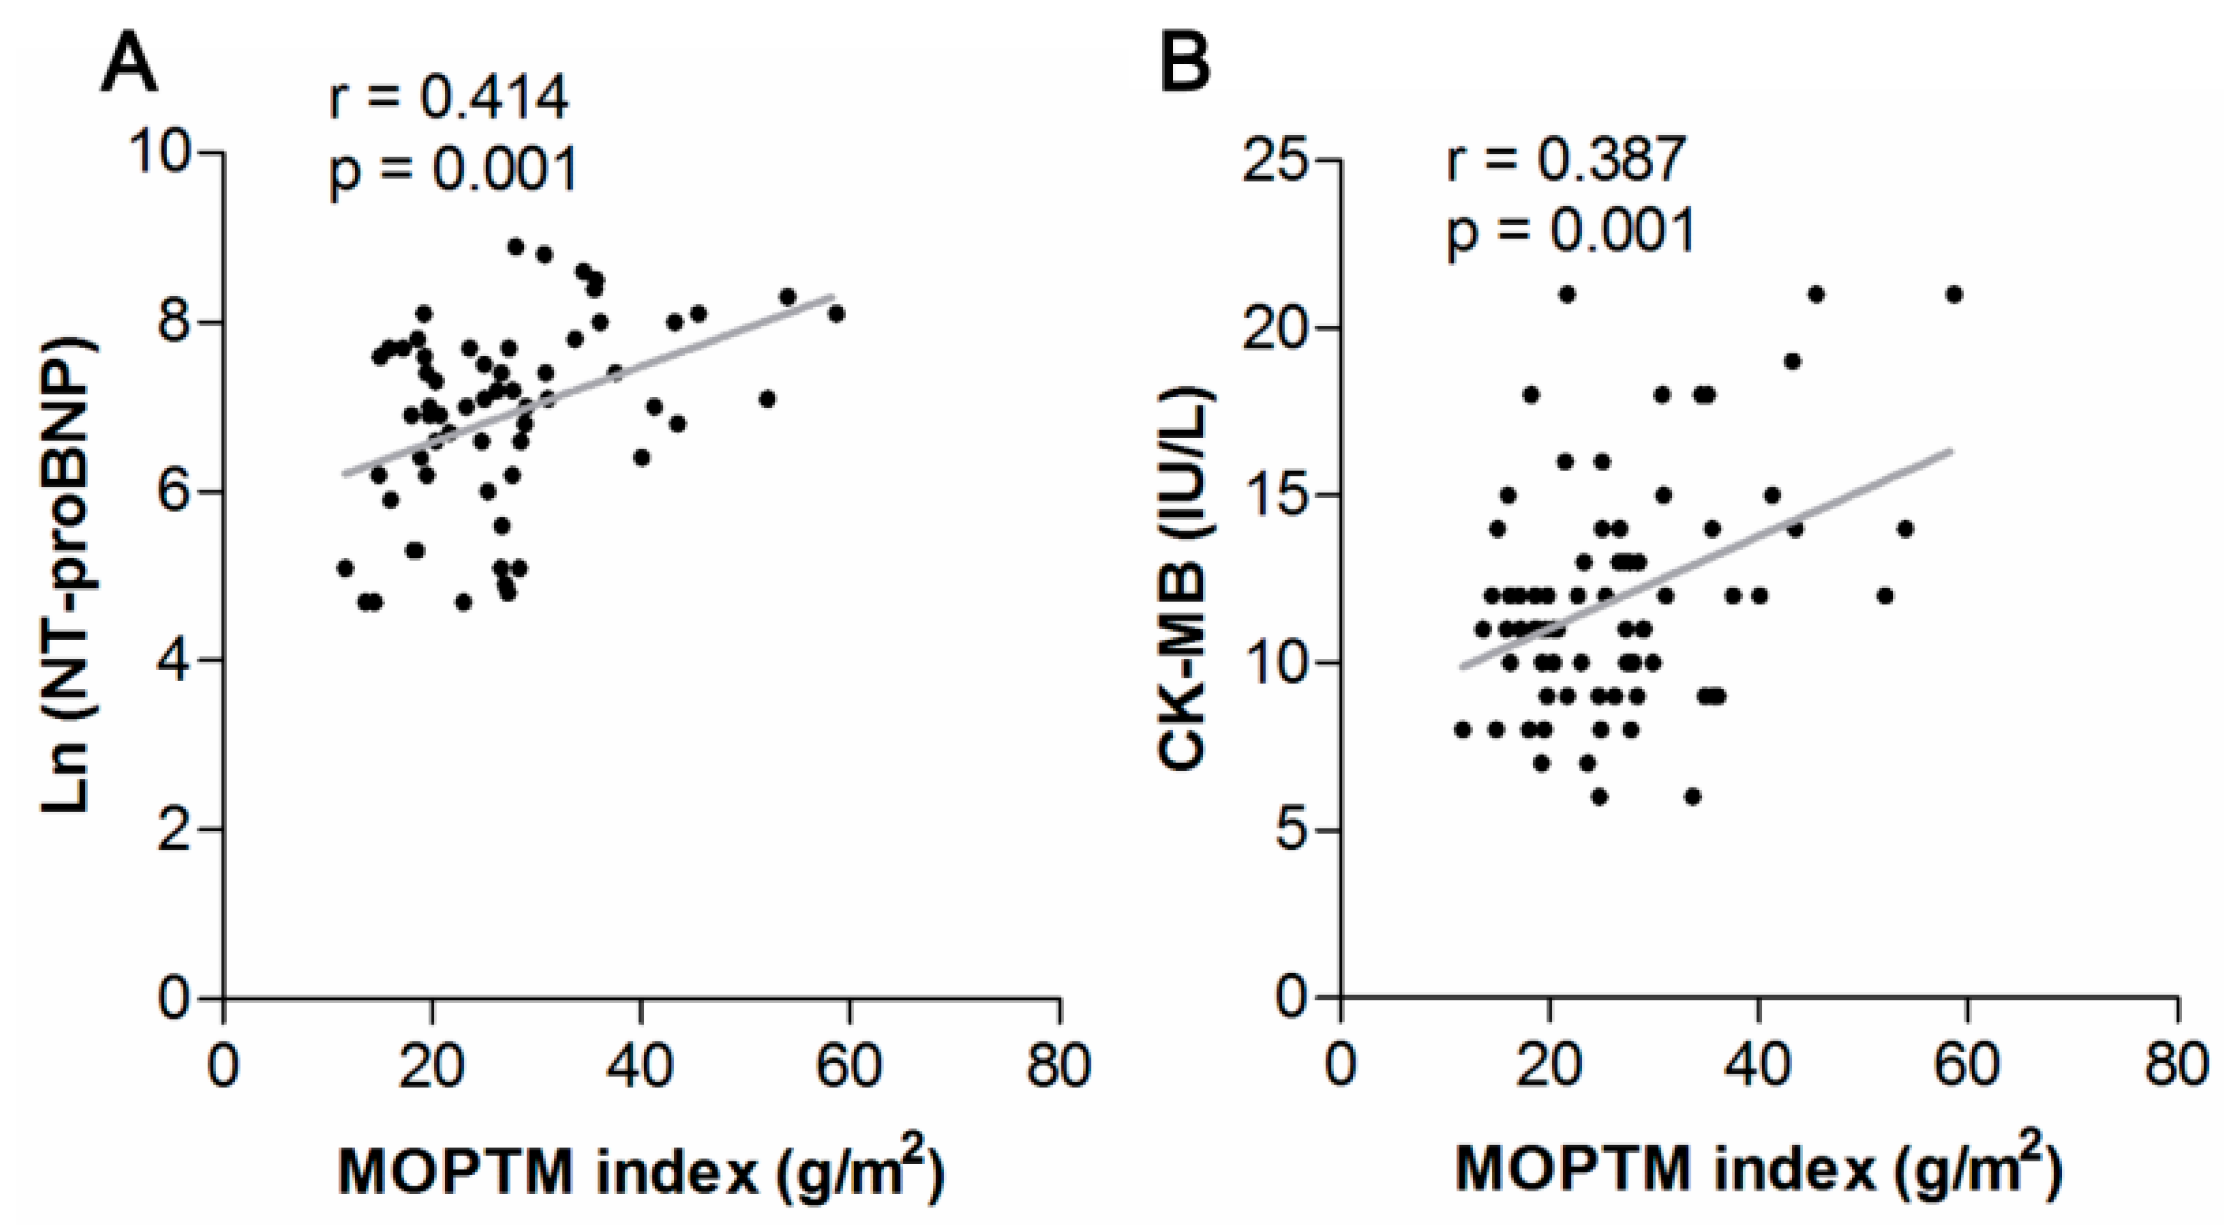
| NT-proBNP | 0.265 | 0.039 |
| CK-MB | 0.356 | 0.002 |
| Conventional Method | Mask Method | p Value | |||
|---|---|---|---|---|---|
| Mean ± SD | r | Mean ± SD | r | ||
| Intra-observer | |||||
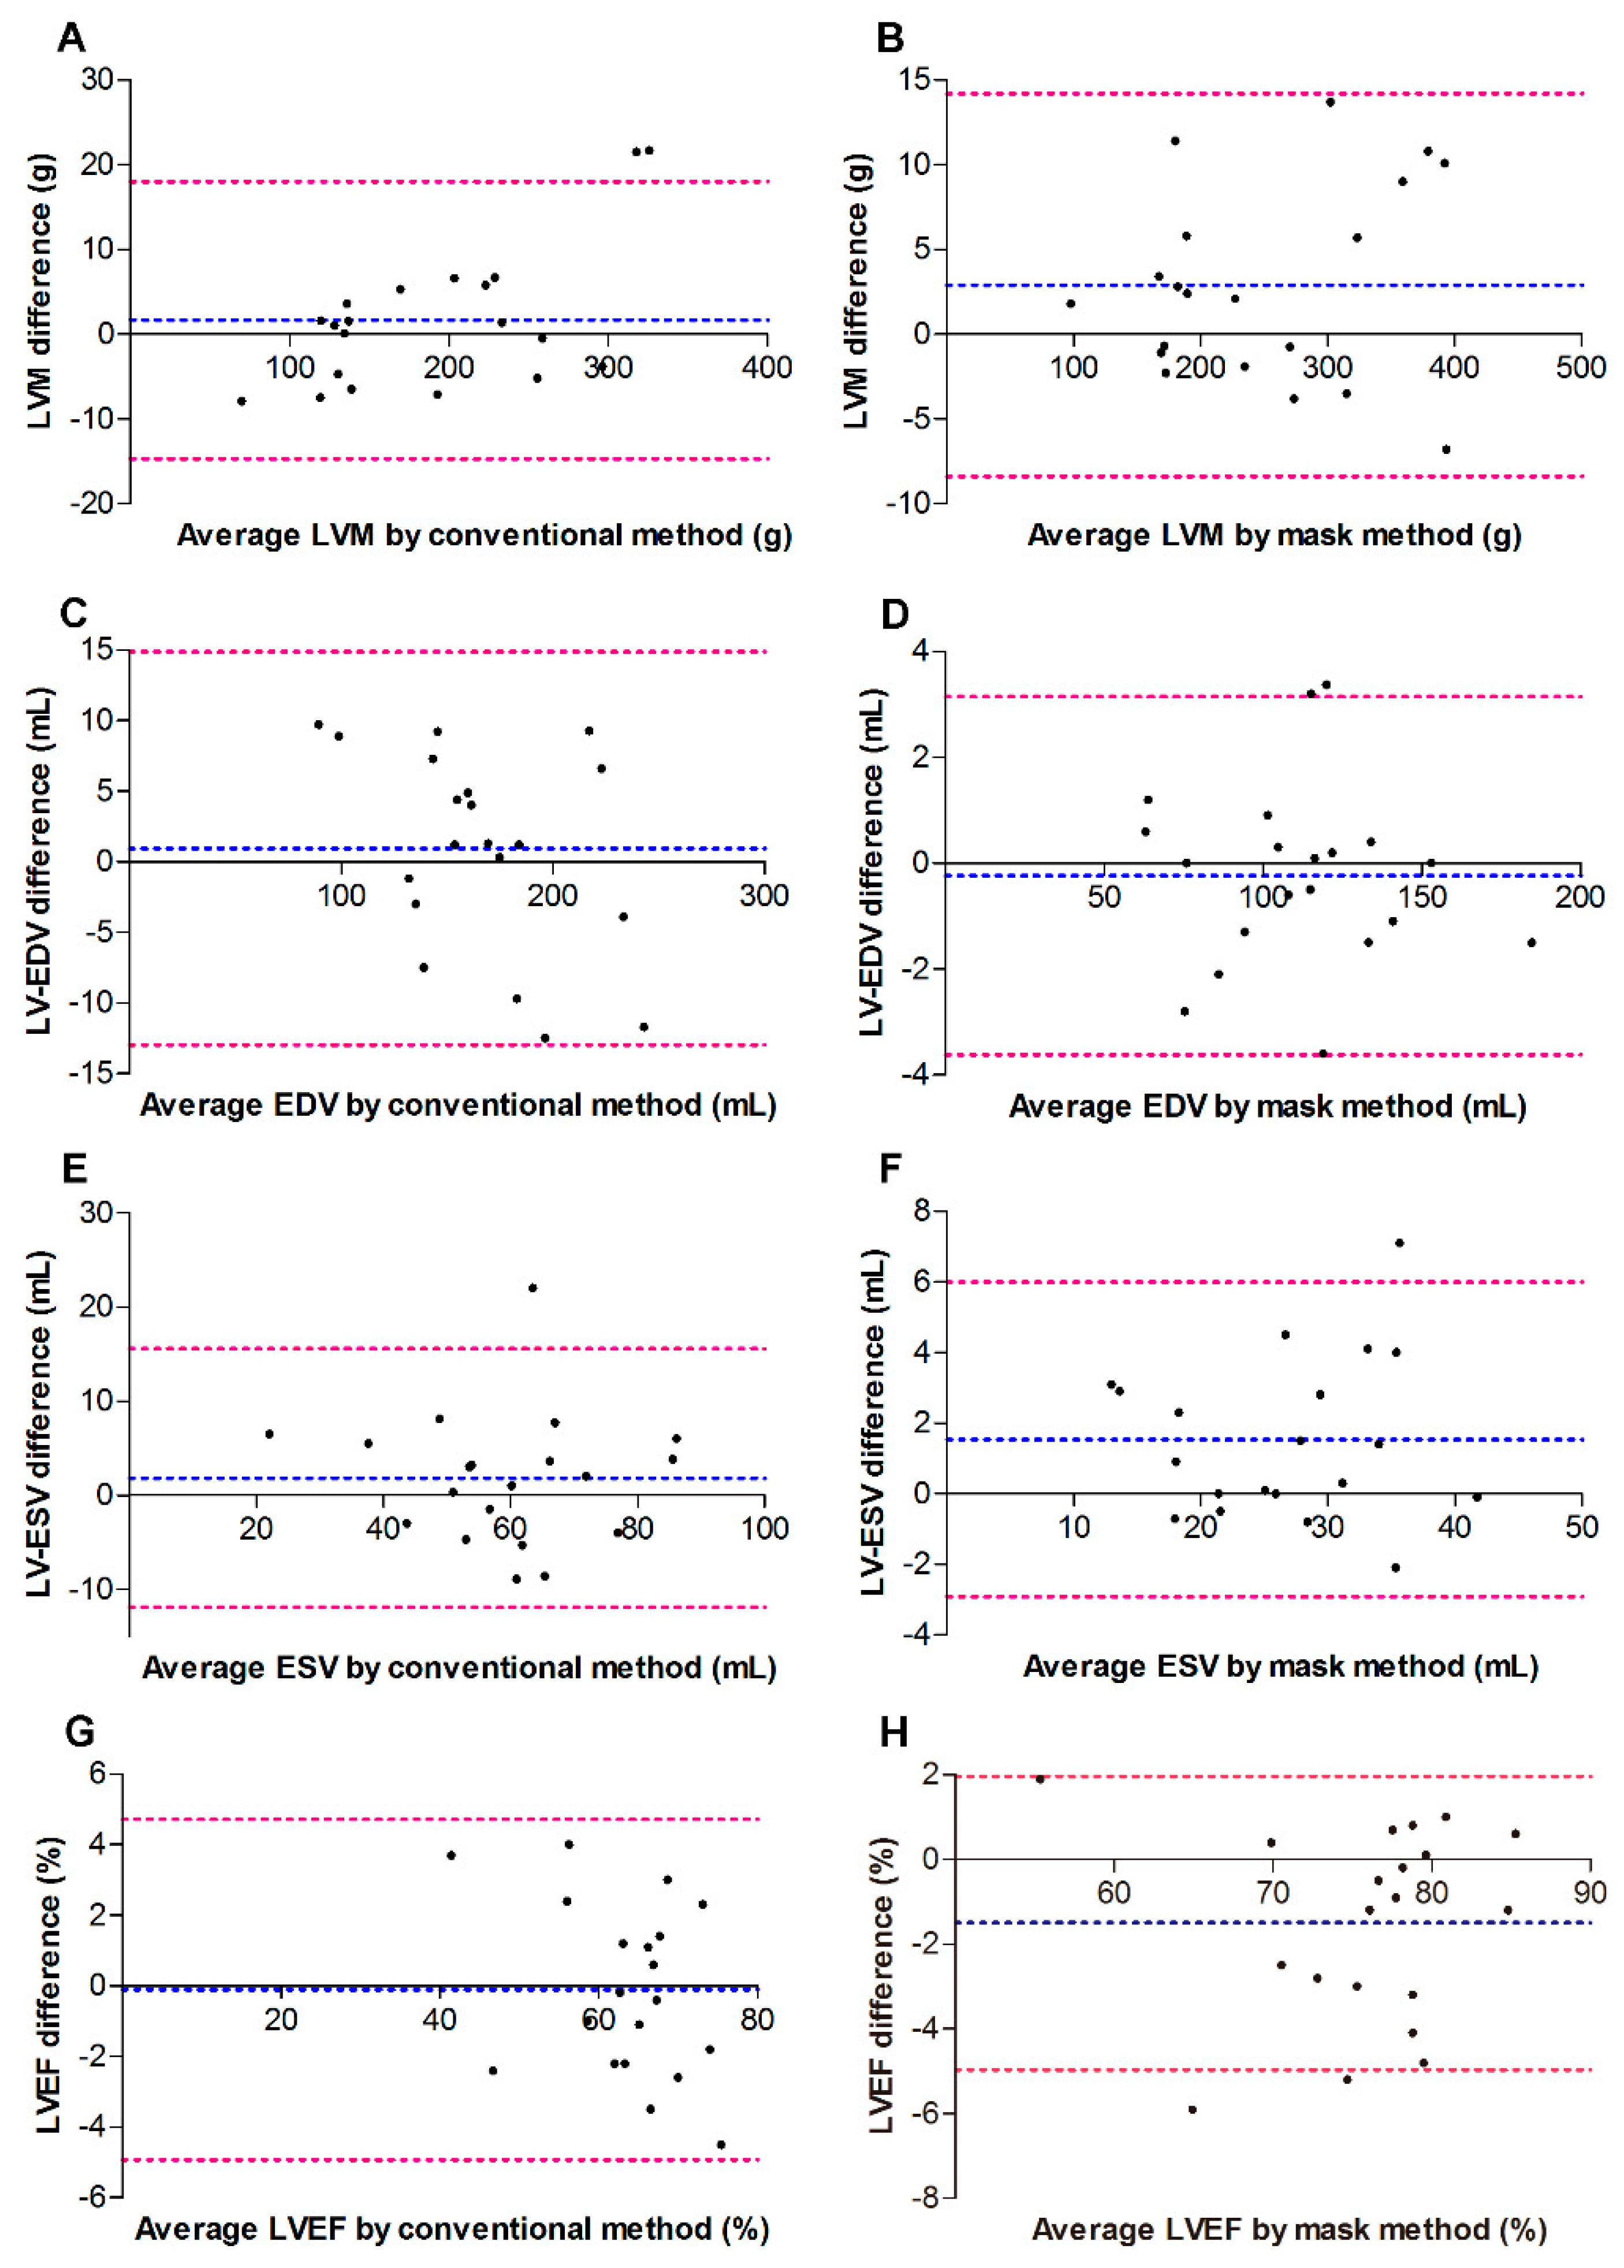
| LVM (g) | 1.68 ± 8.34 | 0.996 | 2.91 ± 5.76 | 0.998 | 0.59 |
| LV-EDV (mL) | 0.94 ± 7.10 | 0.988 | −0.24 ± 1.73 | 0.998 | 0.48 |
| LV-ESV (mL) | 1.84 ± 7.0 | 0.900 | 1.54 ± 2.27 | 0.961 | 0.86 |
| LVEF (%) | −0.11 ± 2.46 | 0.964 | −1.50 ± 2.30 | 0.944 | 0.07 |
| Inter-observer | |||||
| LVM (g) | −6.43 ± 14.55 | 0.995 | −6.57 ± 12.87 | 0.996 | 0.97 |
| LV-EDV (mL) | 5.84 ± 17.0 | 0.927 | 5.77 ± 10.29 | 0.949 | 0.99 |
| LV-ESV (mL) | 1.89 ± 13.81 | 0.773 | 0.11 ± 9.71 | 0.696 | 0.64 |
| LVEF (%) | −0.01 ± 7.13 | 0.713 | 2.05 ± 9.06 | 0.673 | 0.43 |
Publisher’s Note: MDPI stays neutral with regard to jurisdictional claims in published maps and institutional affiliations. |
© 2022 by the authors. Licensee MDPI, Basel, Switzerland. This article is an open access article distributed under the terms and conditions of the Creative Commons Attribution (CC BY) license (https://creativecommons.org/licenses/by/4.0/).
Share and Cite
Yang, C.; Xu, H.; Qiao, S.; Jia, R.; Jin, Z.; Yuan, J. Papillary and Trabecular Muscles Have Substantial Impact on Quantification of Left Ventricle in Patients with Hypertrophic Obstructive Cardiomyopathy. Diagnostics 2022, 12, 2029. https://doi.org/10.3390/diagnostics12082029
Yang C, Xu H, Qiao S, Jia R, Jin Z, Yuan J. Papillary and Trabecular Muscles Have Substantial Impact on Quantification of Left Ventricle in Patients with Hypertrophic Obstructive Cardiomyopathy. Diagnostics. 2022; 12(8):2029. https://doi.org/10.3390/diagnostics12082029
Chicago/Turabian StyleYang, Chengzhi, Haobo Xu, Shubin Qiao, Ruofei Jia, Zening Jin, and Jiansong Yuan. 2022. "Papillary and Trabecular Muscles Have Substantial Impact on Quantification of Left Ventricle in Patients with Hypertrophic Obstructive Cardiomyopathy" Diagnostics 12, no. 8: 2029. https://doi.org/10.3390/diagnostics12082029
APA StyleYang, C., Xu, H., Qiao, S., Jia, R., Jin, Z., & Yuan, J. (2022). Papillary and Trabecular Muscles Have Substantial Impact on Quantification of Left Ventricle in Patients with Hypertrophic Obstructive Cardiomyopathy. Diagnostics, 12(8), 2029. https://doi.org/10.3390/diagnostics12082029