Author Contributions
Conceptualization, C.-Y.C. and L.-K.M.; methodology, C.-Y.C. and L.-K.M.; software, L.-K.M.; validation, C.-Y.C. and L.-K.M.; formal analysis, L.-K.M.; investigation, C.-Y.C., M.-H.H., C.-H.L. and L.-K.M.; resources, C.-Y.C., M.-H.H., C.-H.L. and Y.-N.S.; data curation, C.-Y.C., M.-H.H., C.-H.L. and L.-K.M.; writing—original draft preparation, L.-K.M.; writing—review and editing, C.-Y.C., M.-H.H., C.-H.L., Y.-N.S. and L.-K.M.; visualization, L.-K.M.; supervision, C.-Y.C., Y.-N.S. All authors have read and agreed to the published version of the manuscript.
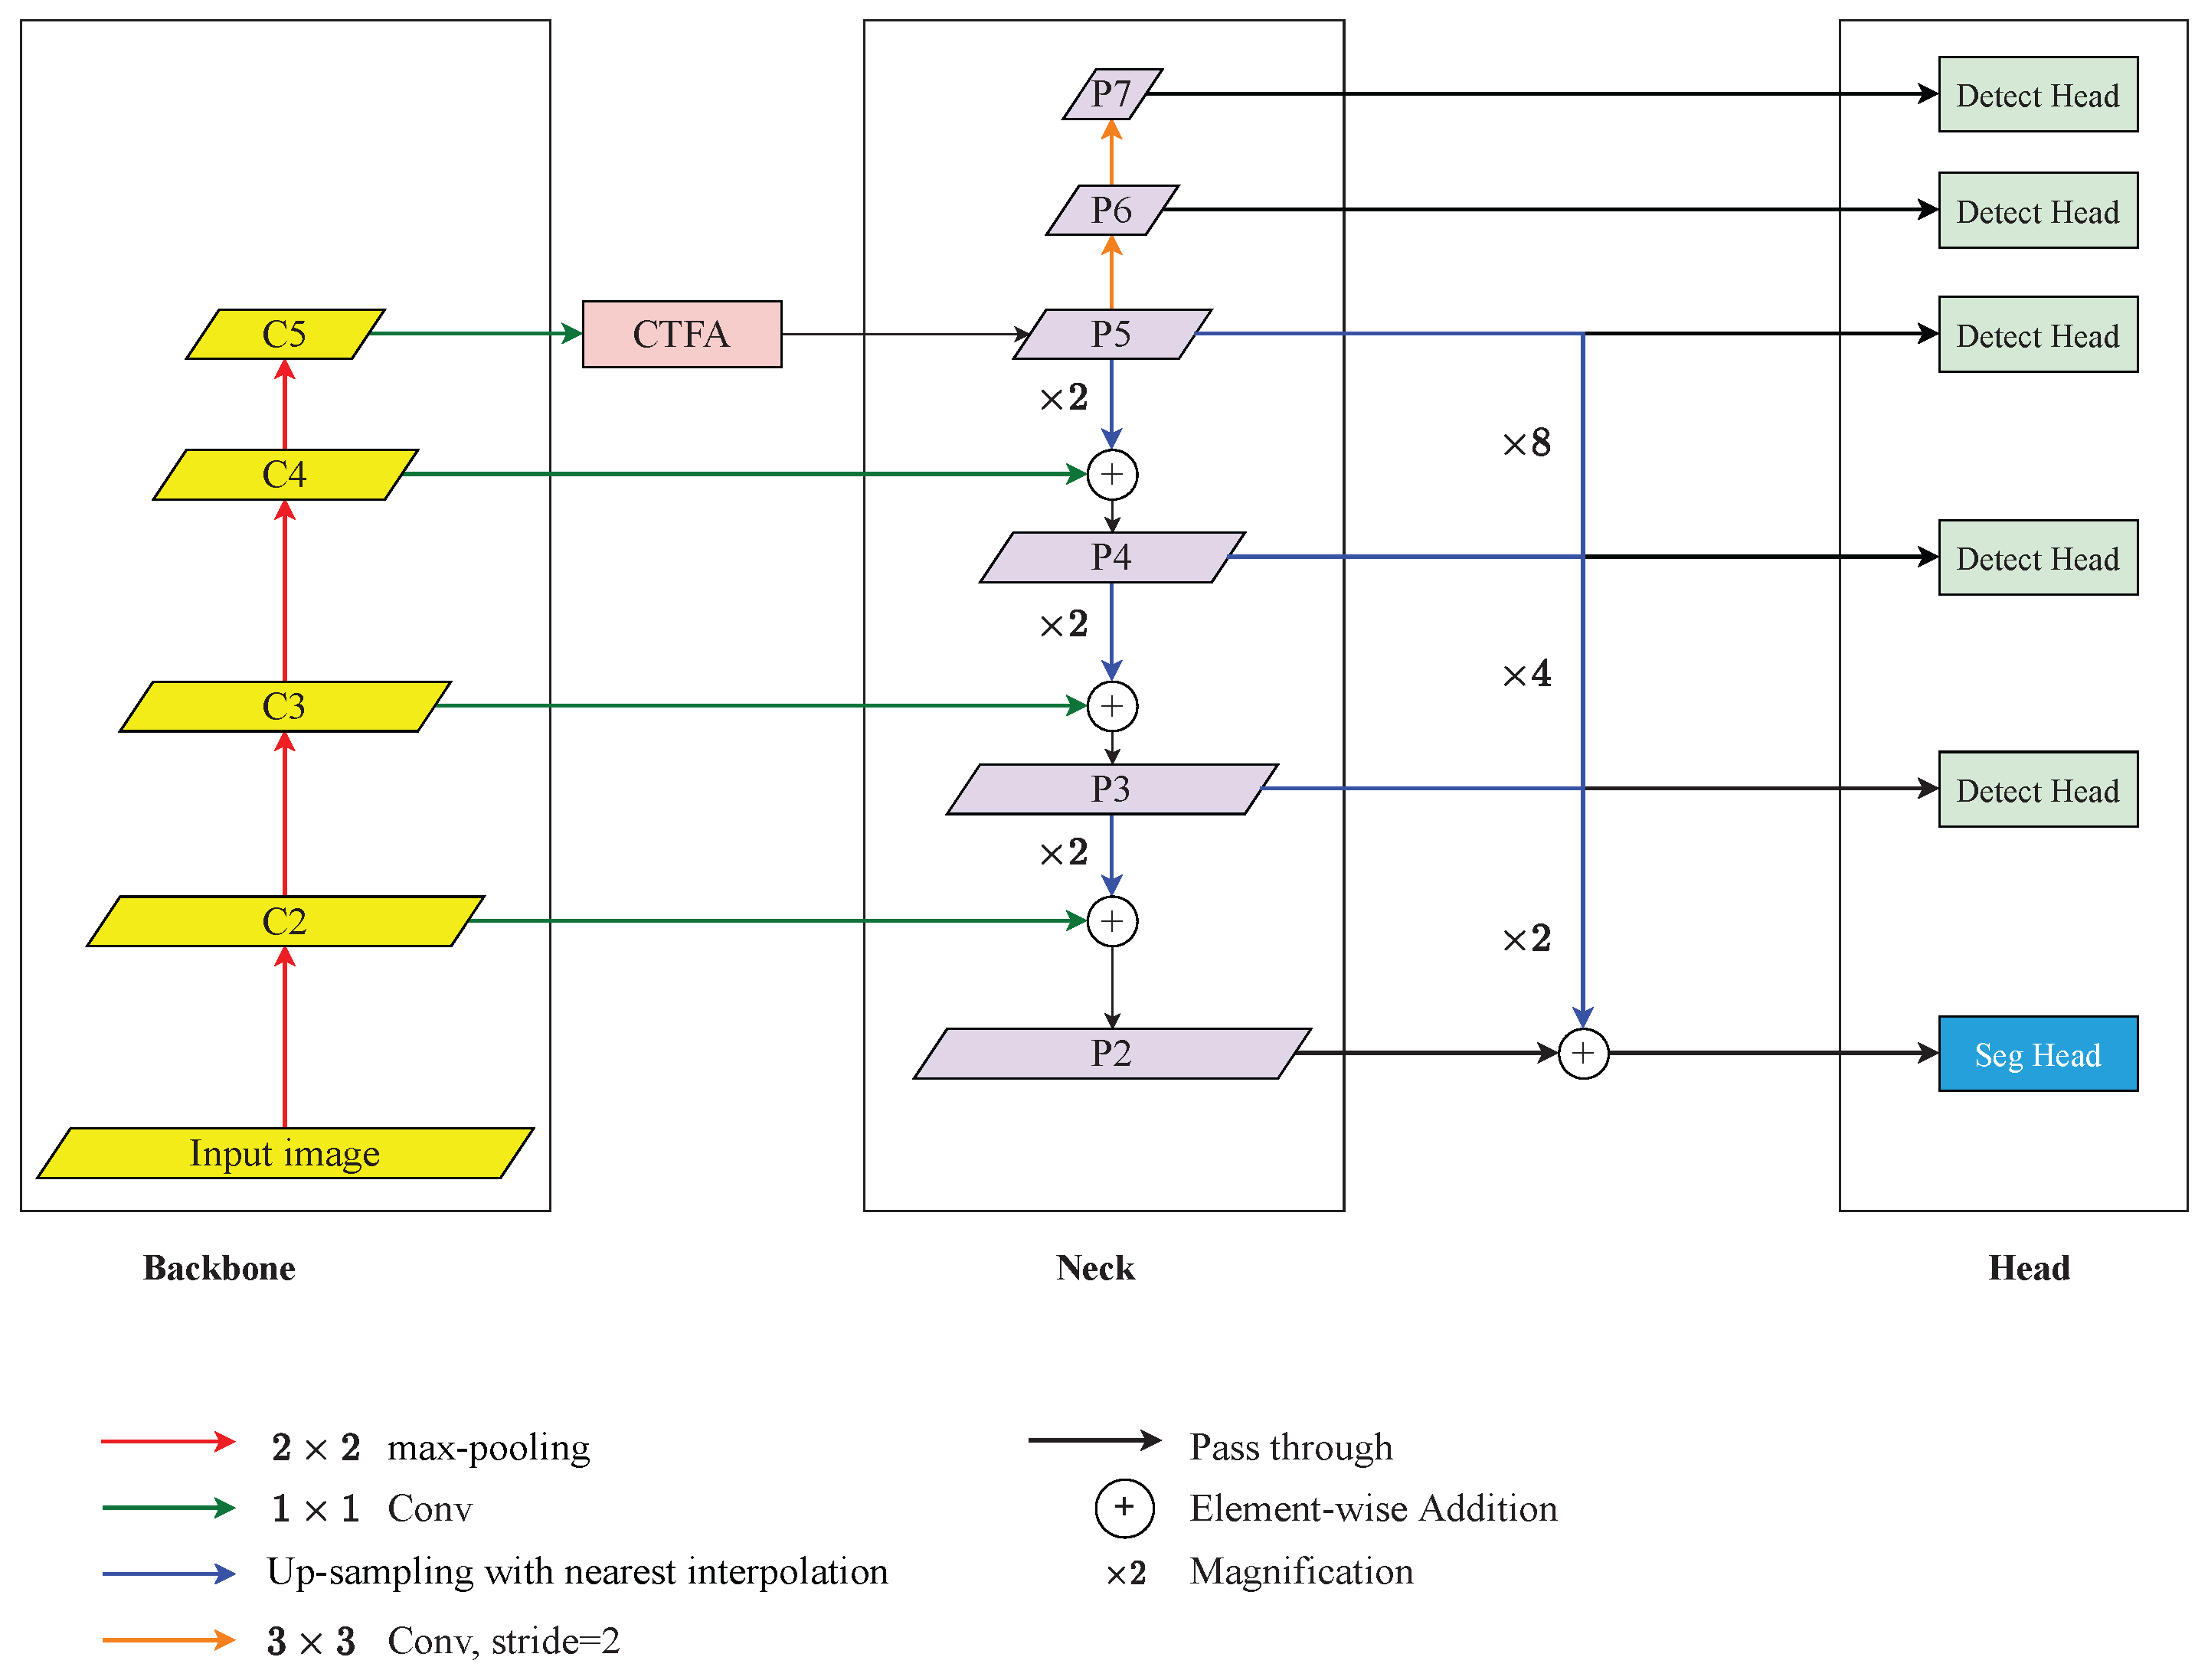
Figure 1.
An overview of the proposed architecture for detecting the malposition. It consists of a ResNet-based backbone, Coarse-to-Fine Attention (CTFA), FPN-based neck, FCOS-based detection head, and segmentation head. The legends below demonstrate the operations above.
Figure 1.
An overview of the proposed architecture for detecting the malposition. It consists of a ResNet-based backbone, Coarse-to-Fine Attention (CTFA), FPN-based neck, FCOS-based detection head, and segmentation head. The legends below demonstrate the operations above.
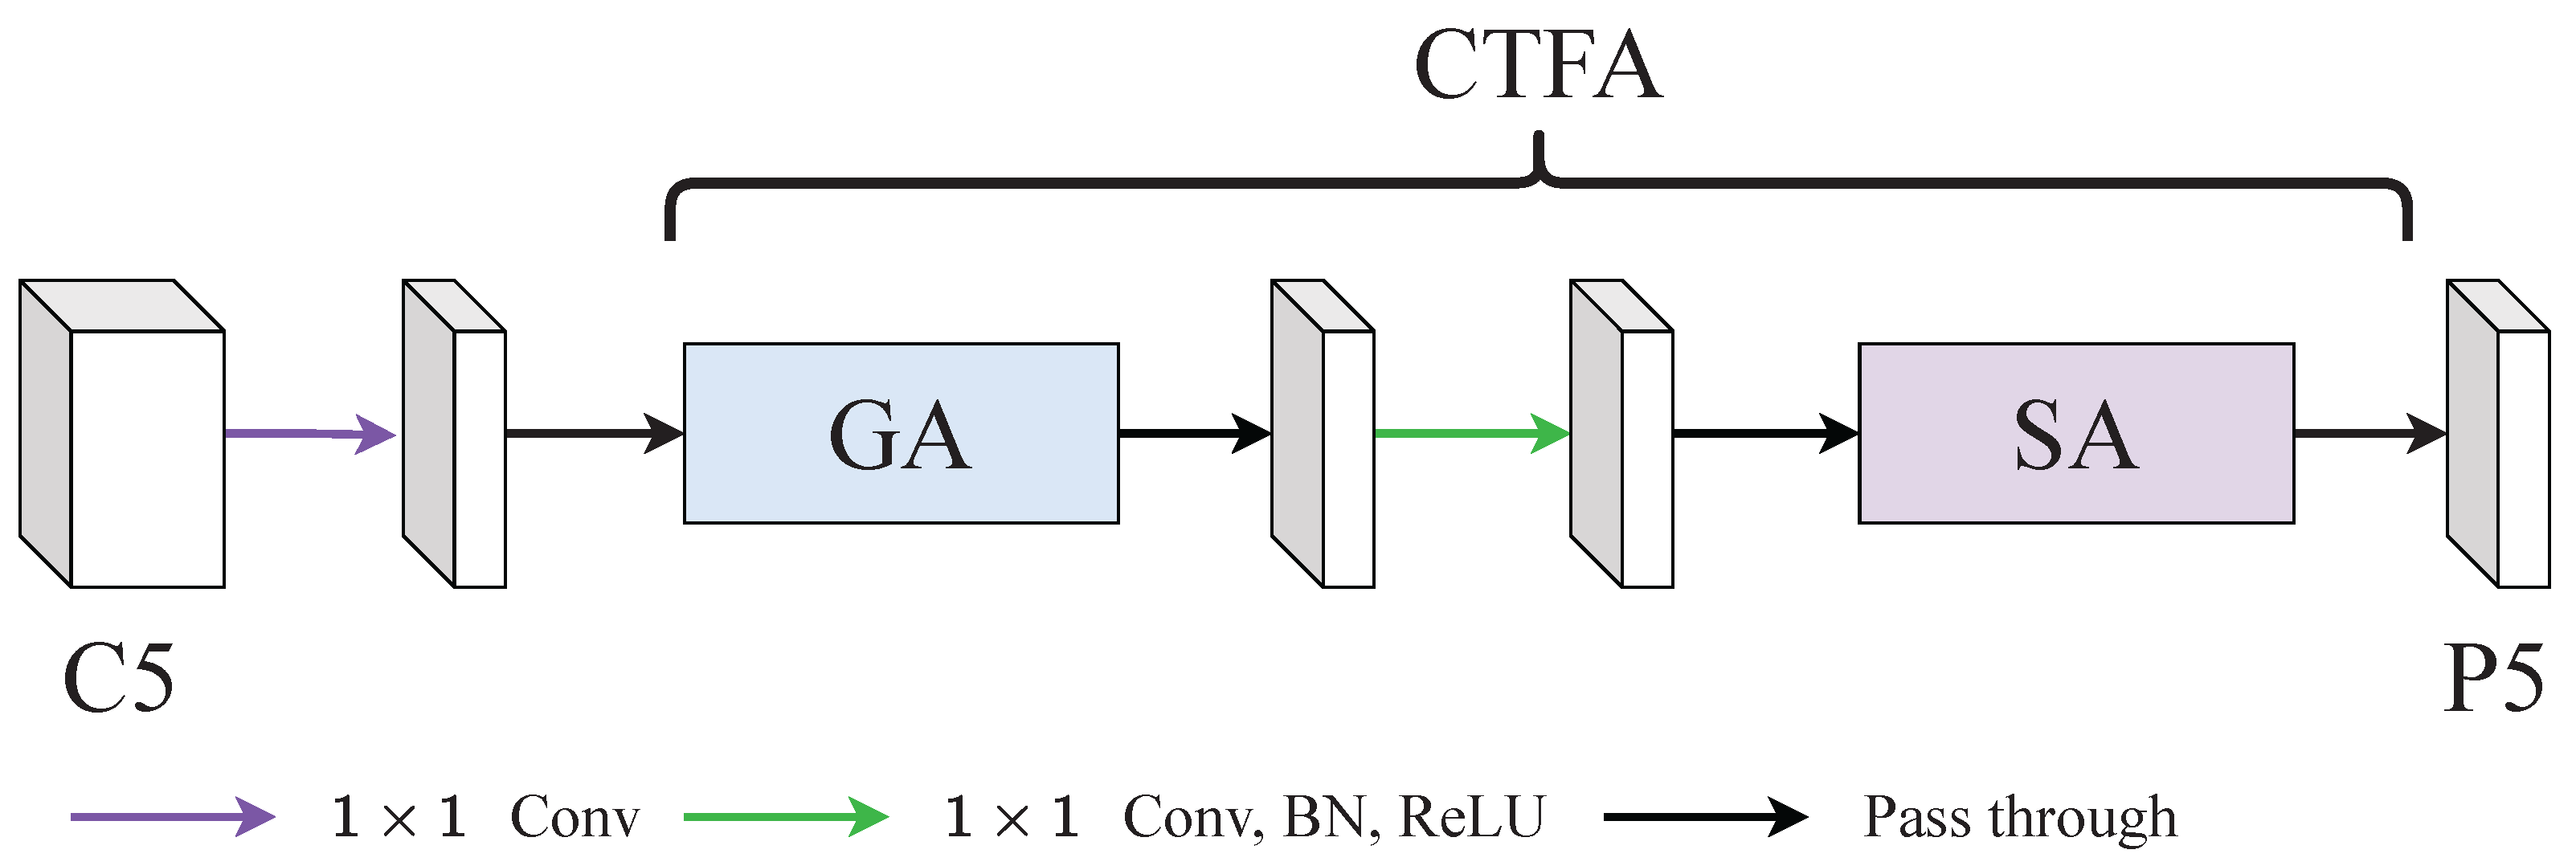
Figure 2.
An illustration of coarse-to-fine attention (CTFA). CTFA consisted of a global-modelling attention (GA) and a scale attention (SA). GA was aimed at capturing long-range relationships and SA was aimed at reweighting with local relationships.
Figure 2.
An illustration of coarse-to-fine attention (CTFA). CTFA consisted of a global-modelling attention (GA) and a scale attention (SA). GA was aimed at capturing long-range relationships and SA was aimed at reweighting with local relationships.
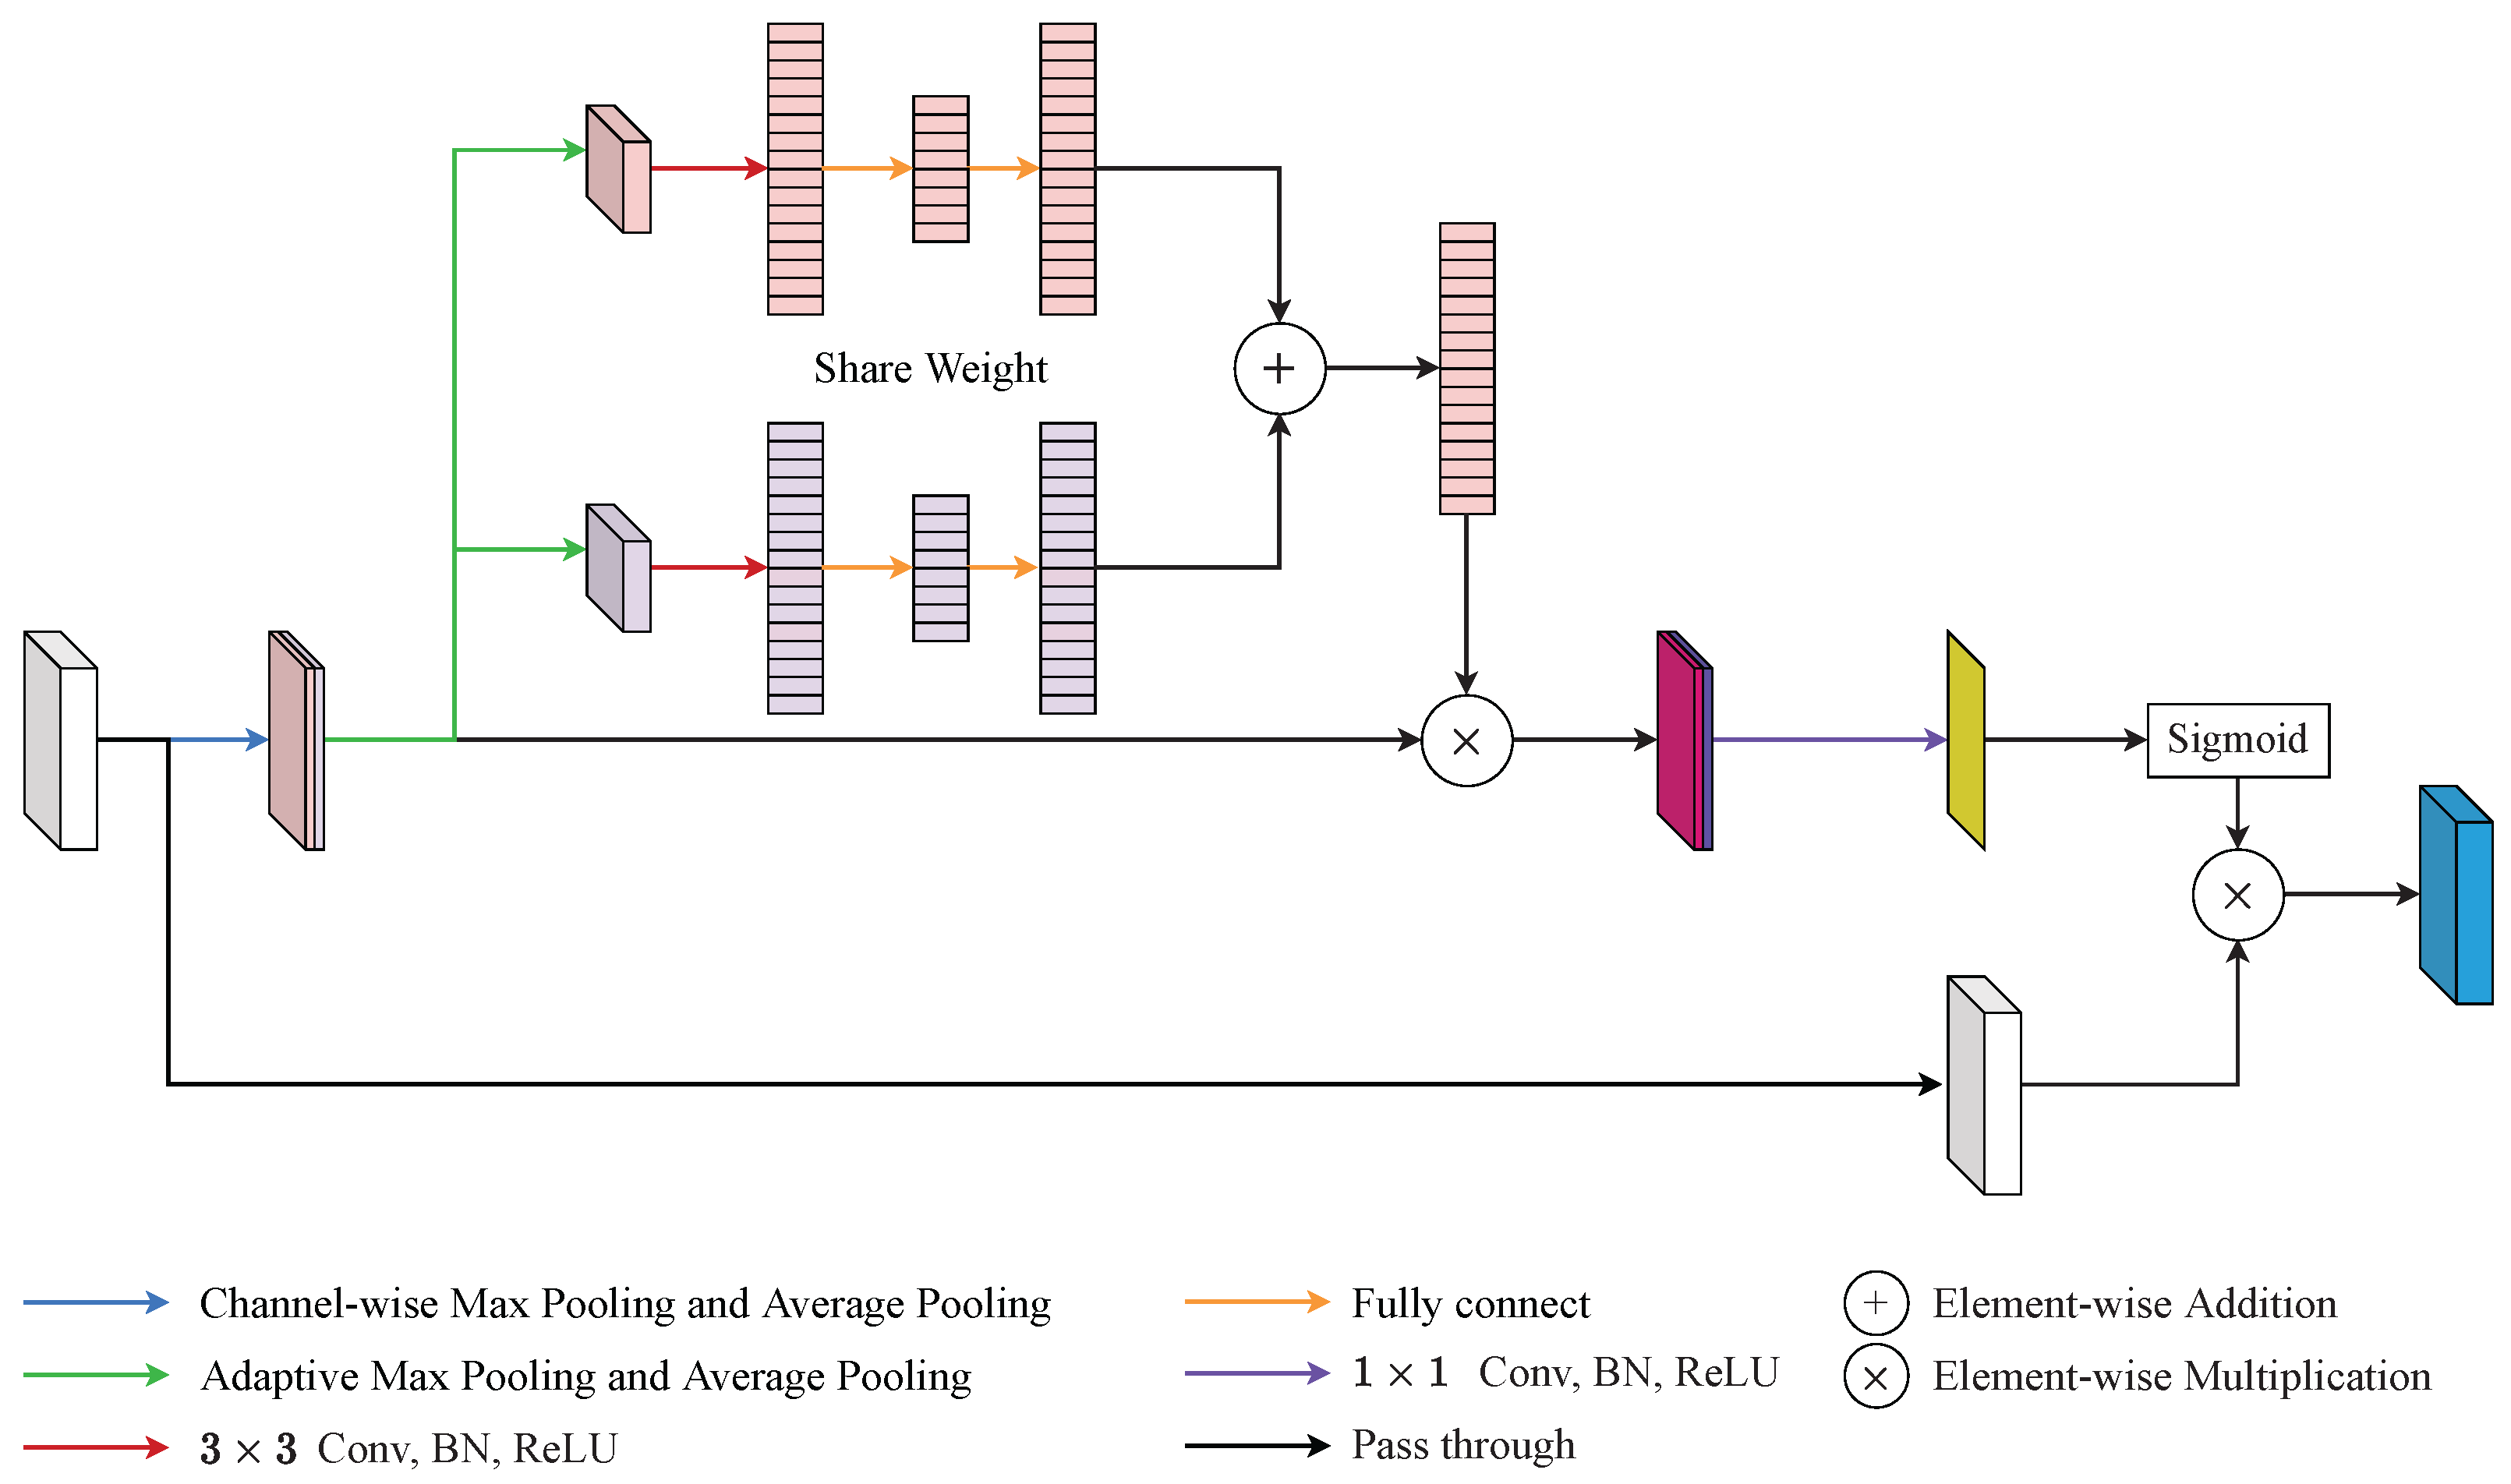
Figure 3.
An illustration of global-modelling attention (GA). GA generated long-range relationships through two branches. The upper branch was aimed at capturing long-range context information and the lower branch was aimed at grabbing local context information. Then, this information is integrated by a series of operations.
Figure 4.
An illustration of scale attention (SA). SA addressed the defects of convolutional block attention module (CBAM) by adaptive channel pooling and squeeze-and-excitation (SE) block.
Figure 4.
An illustration of scale attention (SA). SA addressed the defects of convolutional block attention module (CBAM) by adaptive channel pooling and squeeze-and-excitation (SE) block.
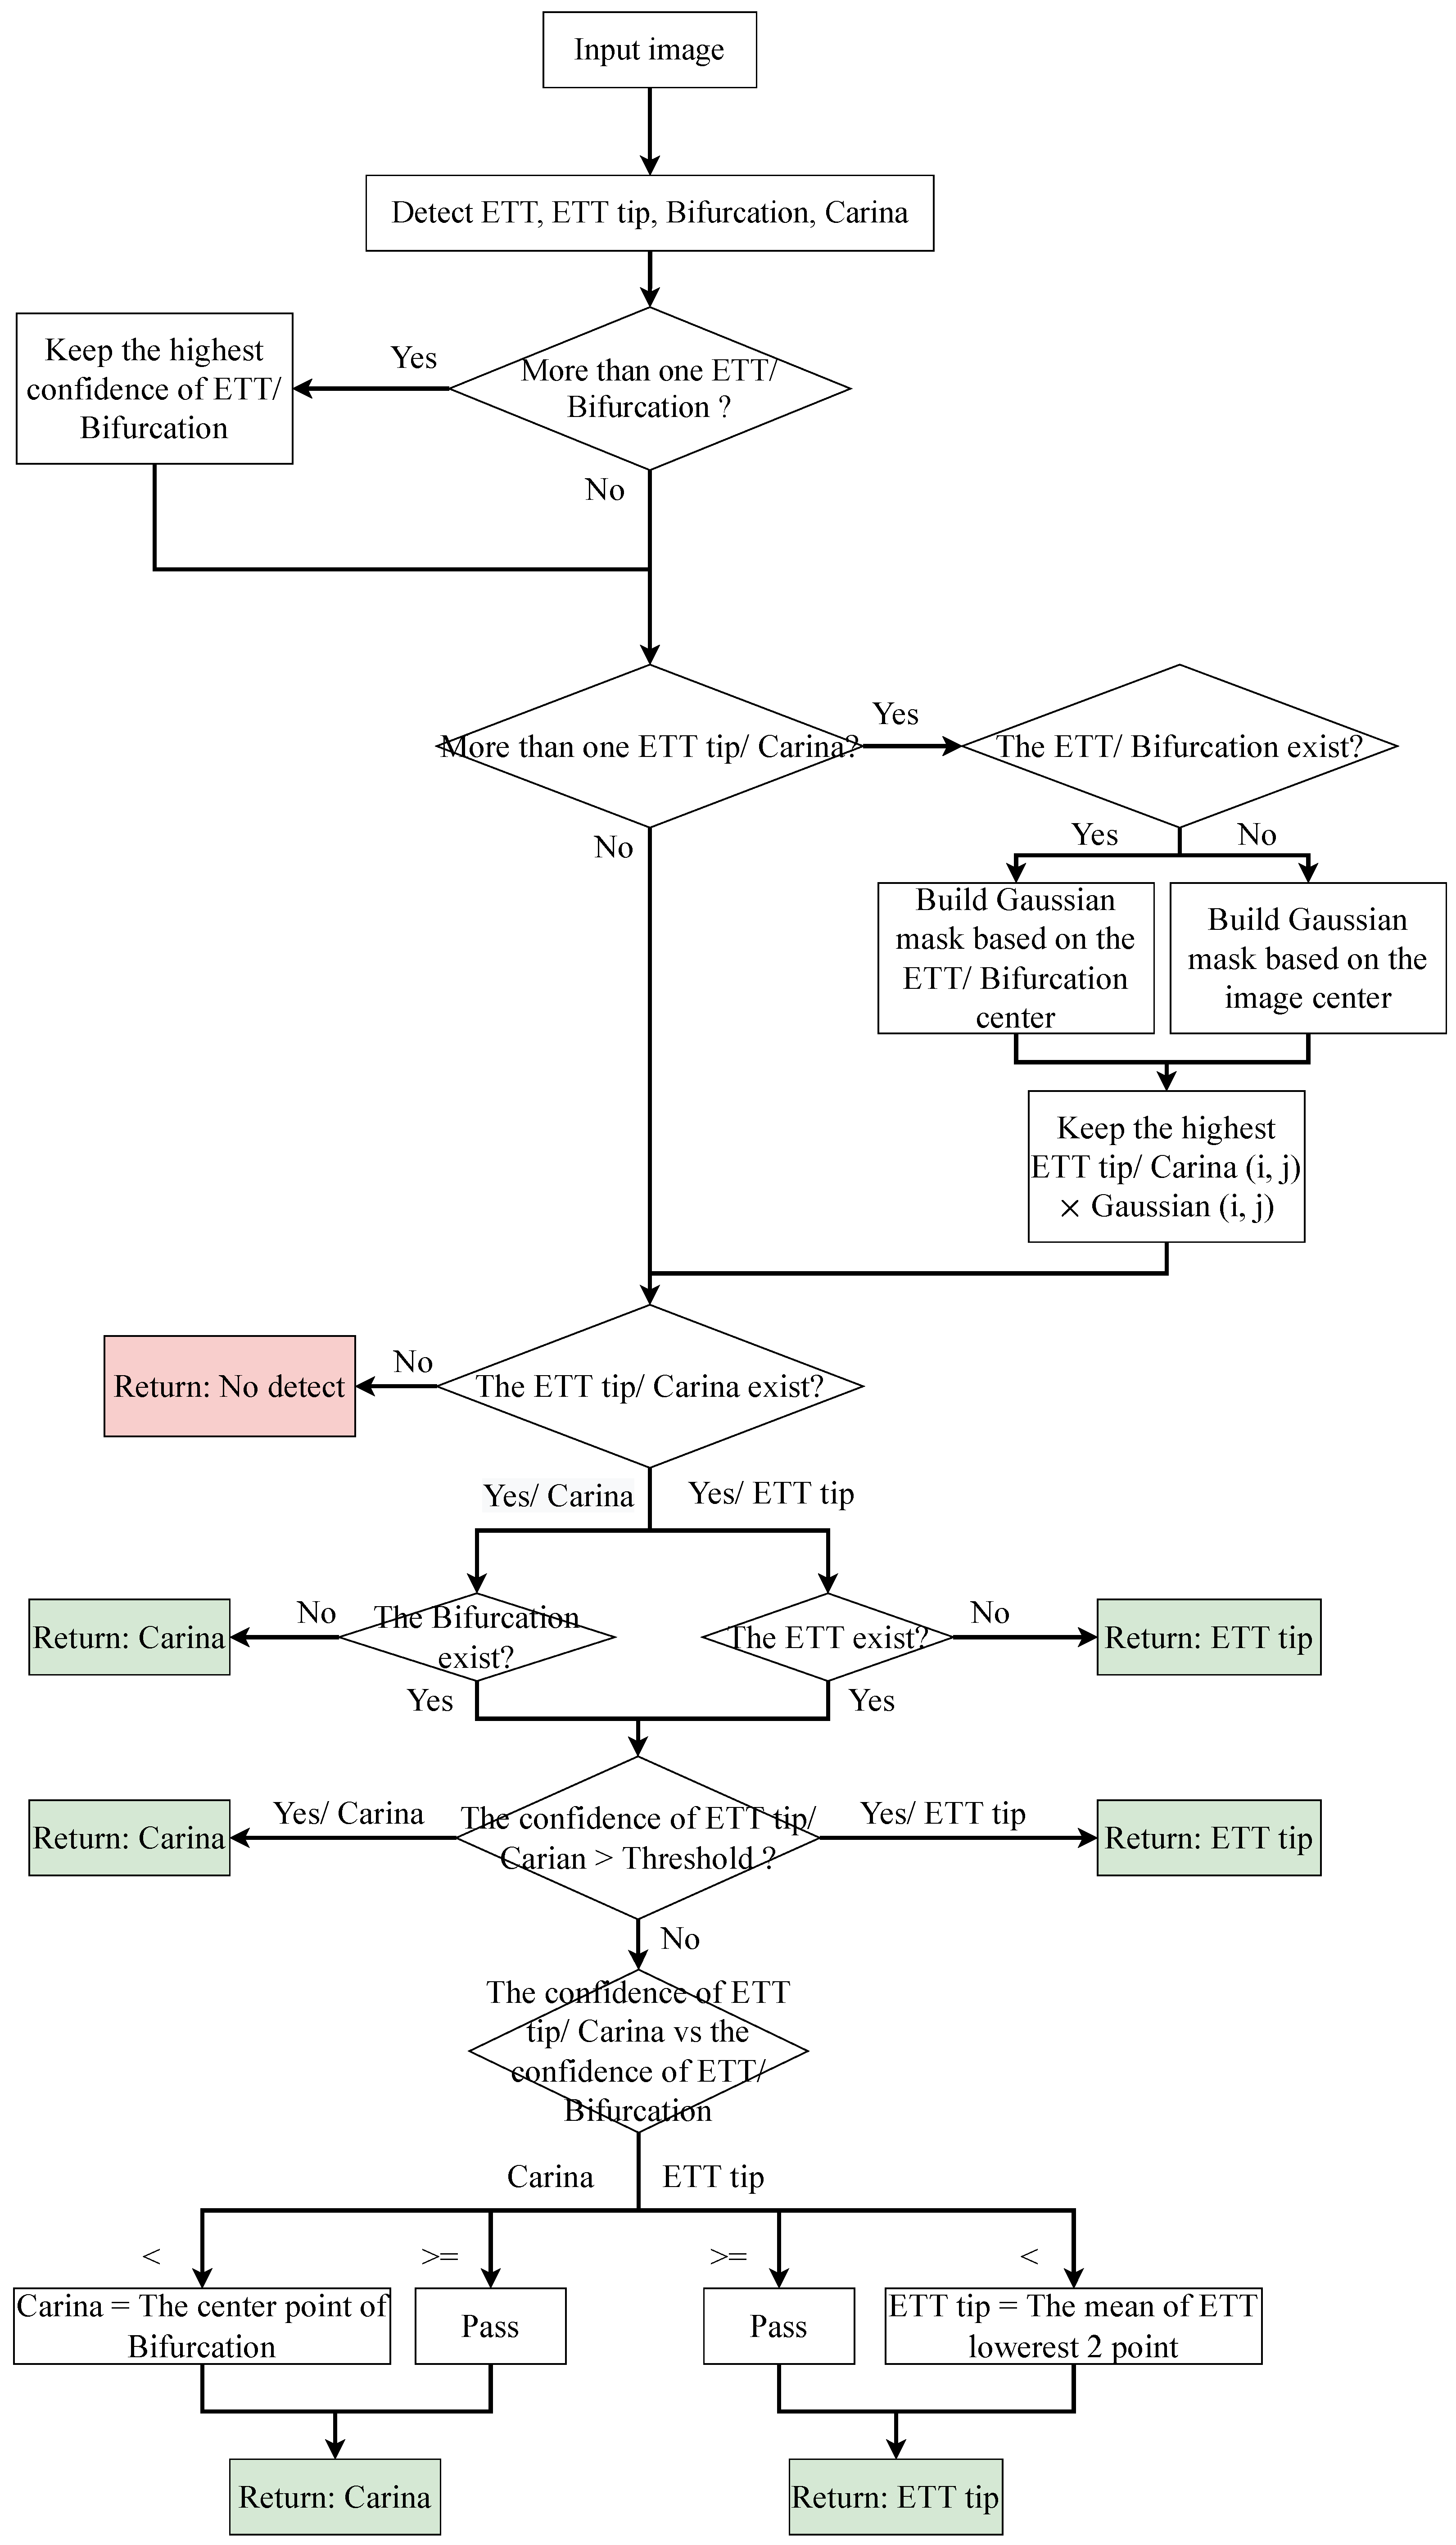
Figure 5.
An illustration of post-process.
Figure 5.
An illustration of post-process.
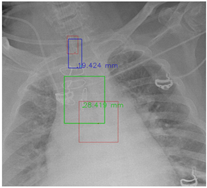
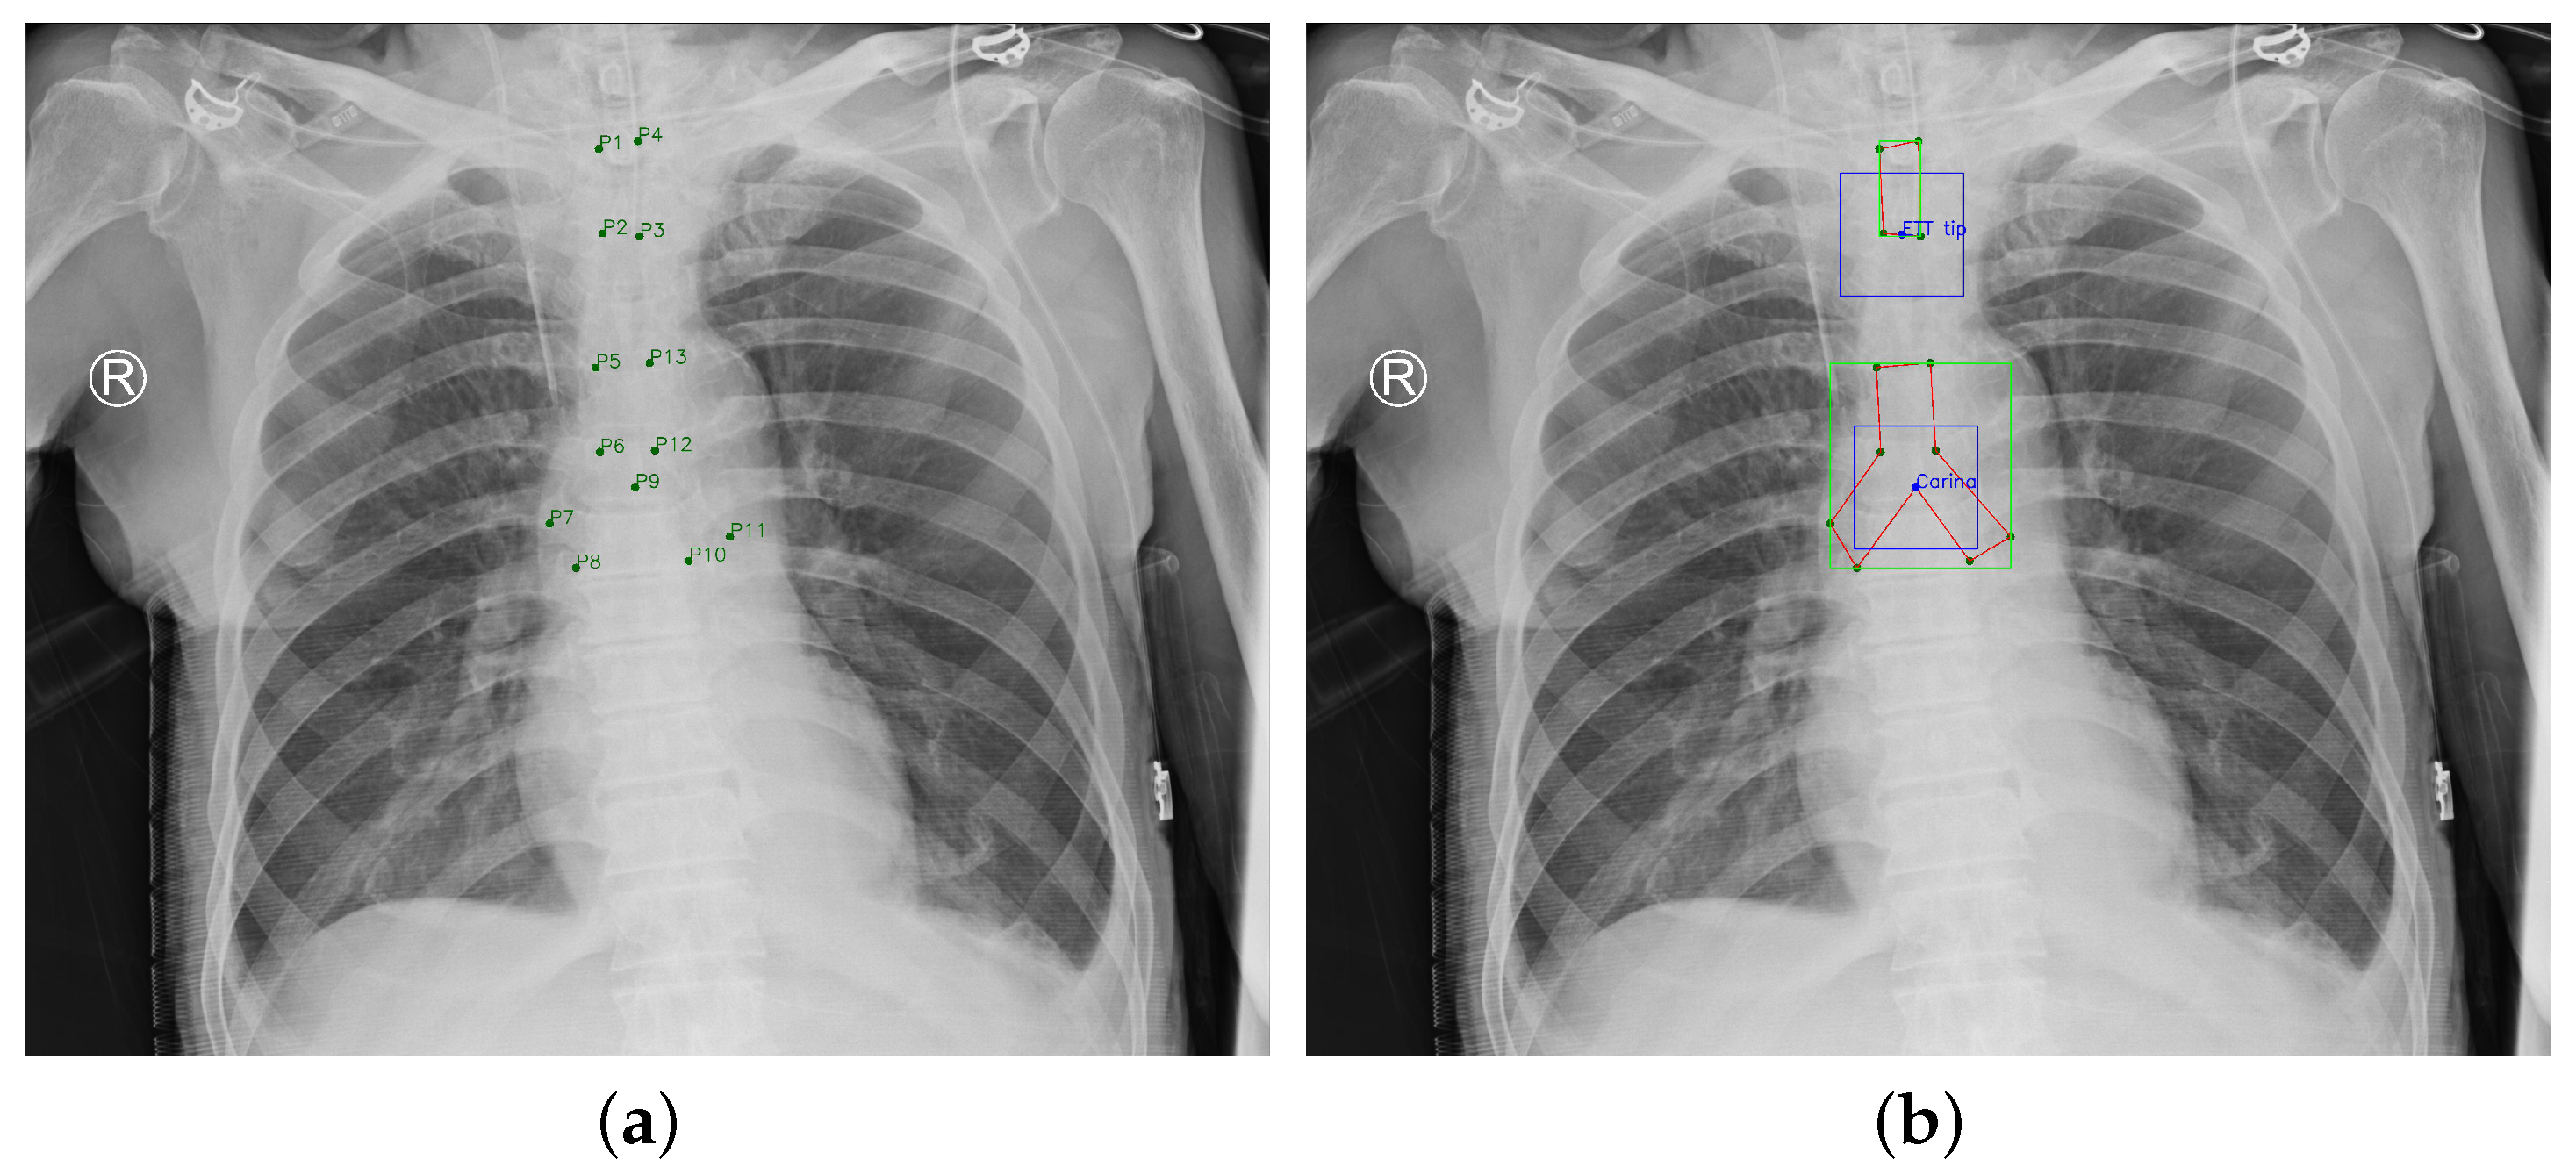
Figure 6.
Ground Truth. (a) Original ground truth. (b) Pre-processed ground truth.
Figure 6.
Ground Truth. (a) Original ground truth. (b) Pre-processed ground truth.
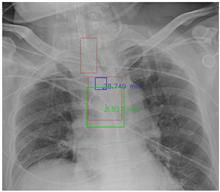
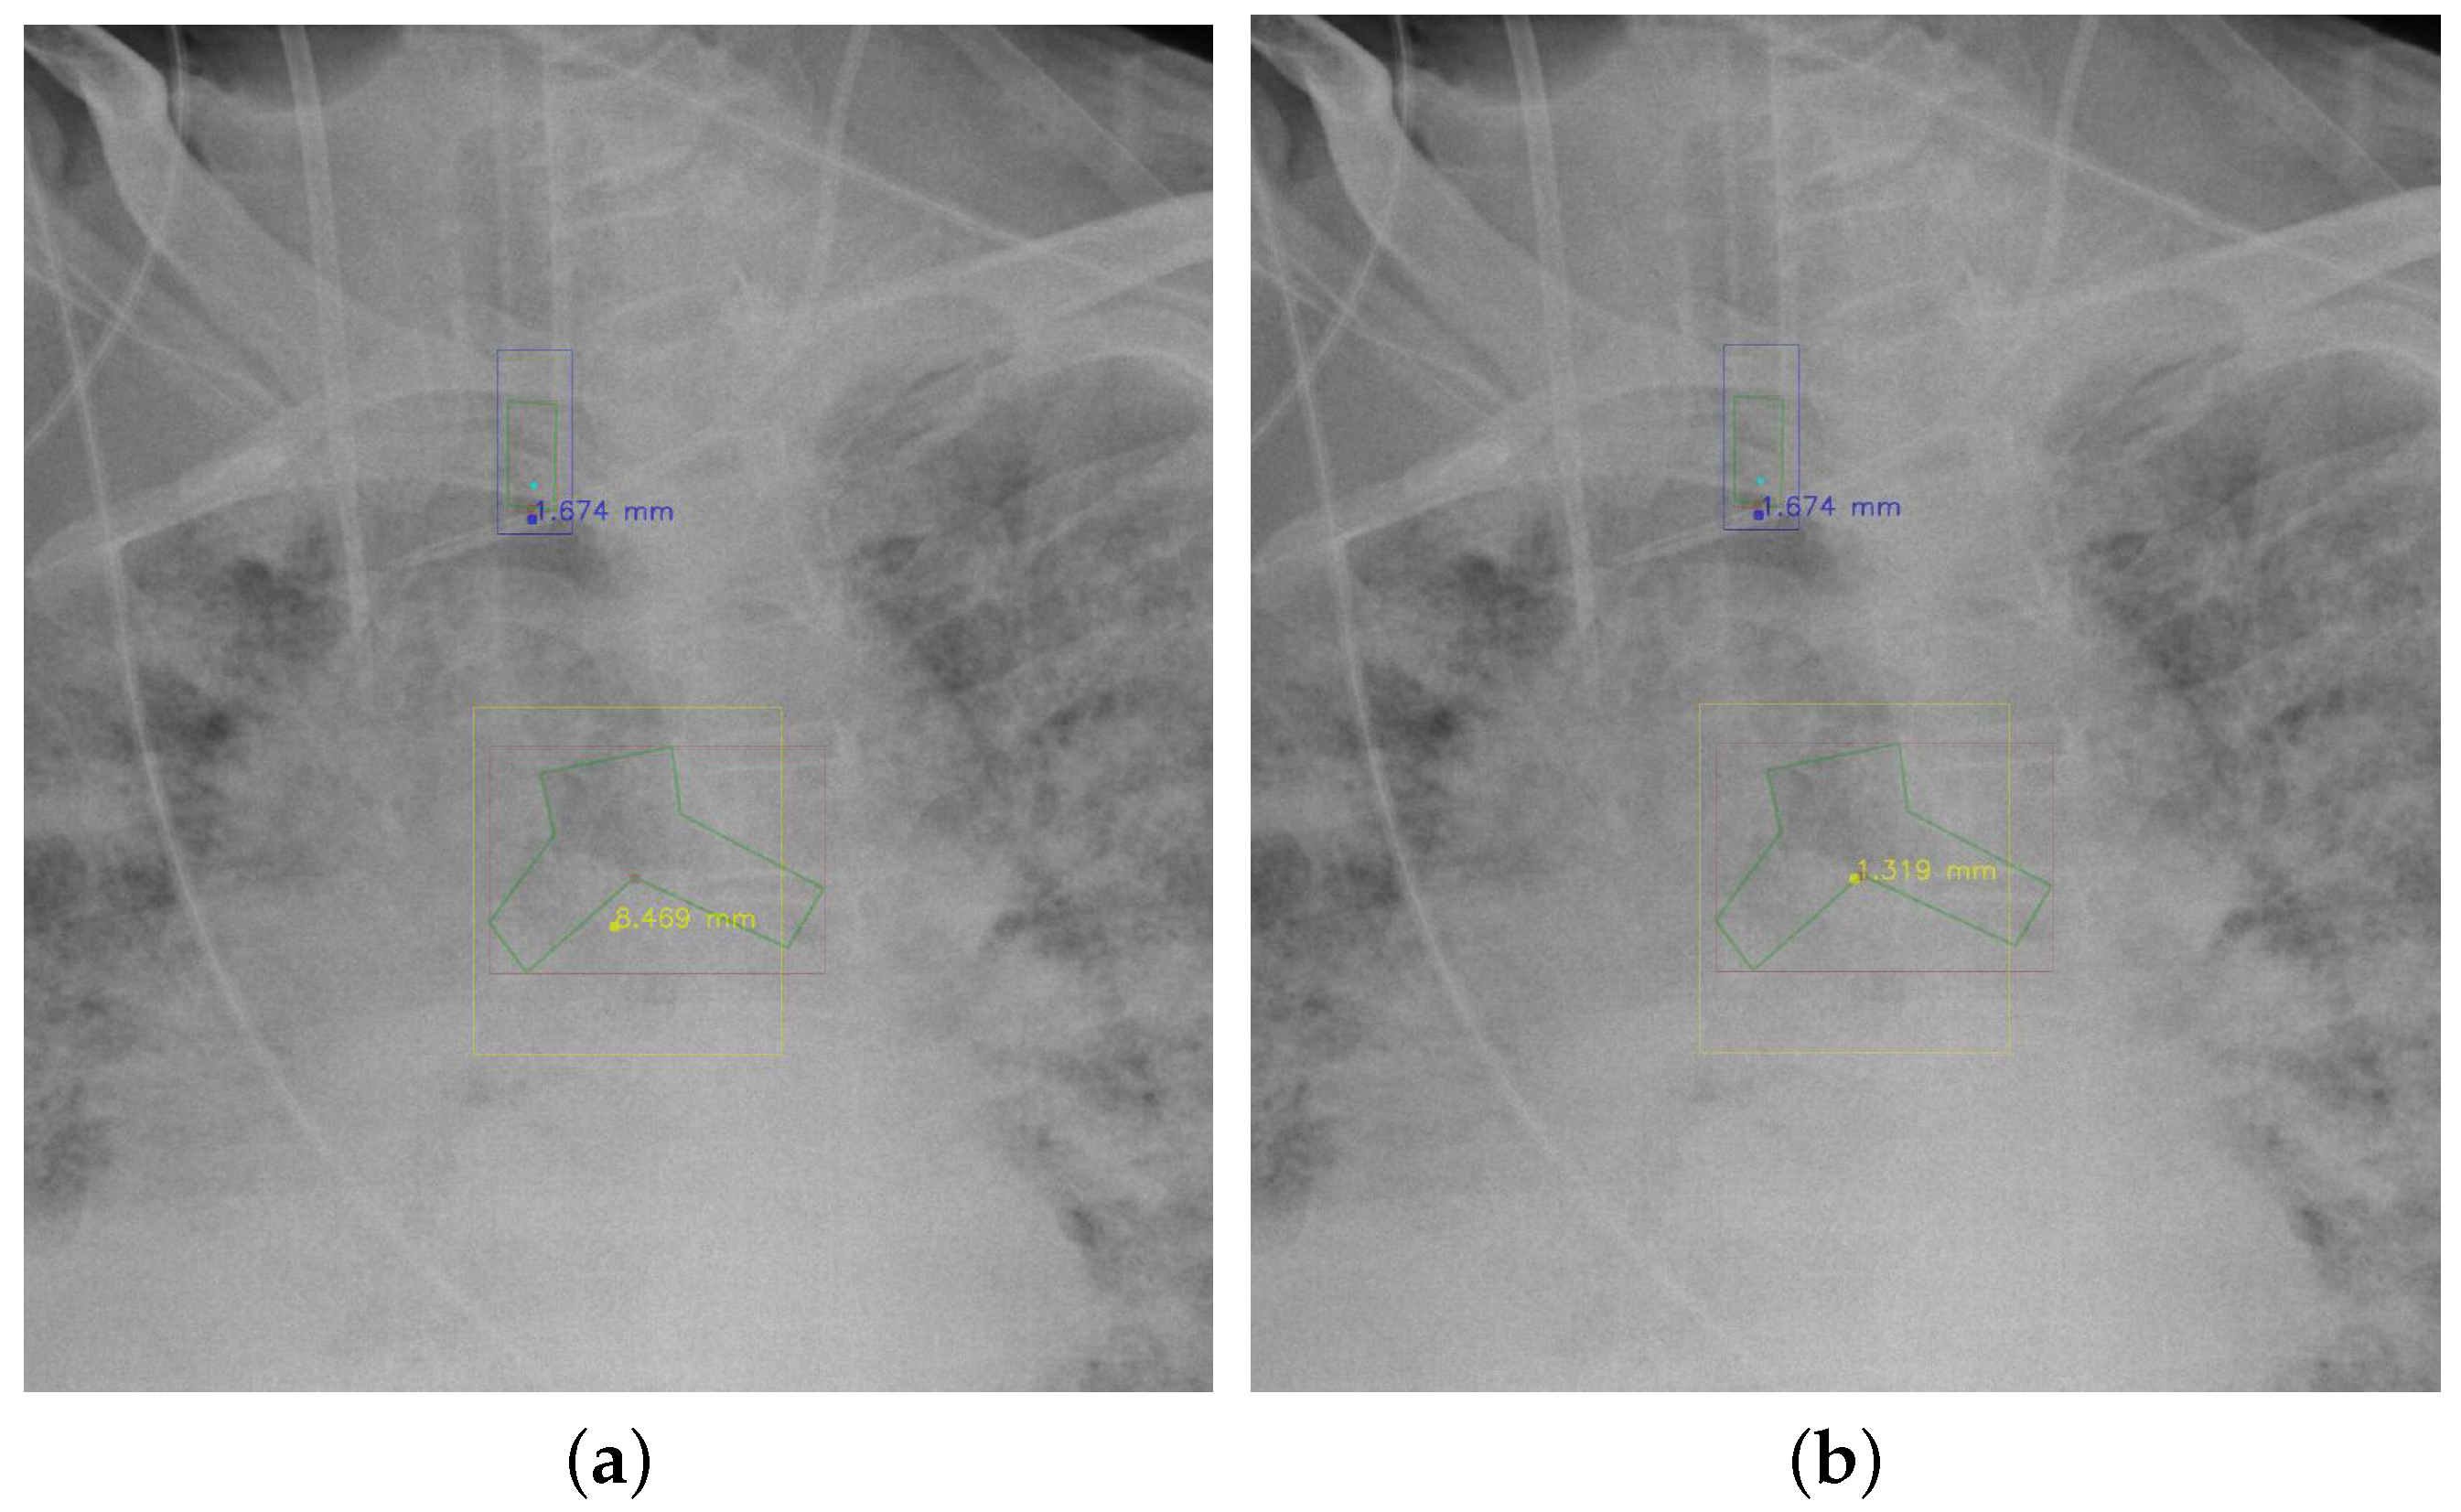
Figure 7.
Ensuring at most one ETT tip/Carina left. (a) Without post-process. (b) With post-process.
Figure 7.
Ensuring at most one ETT tip/Carina left. (a) Without post-process. (b) With post-process.
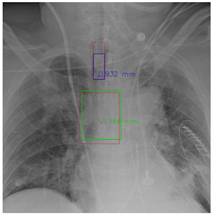
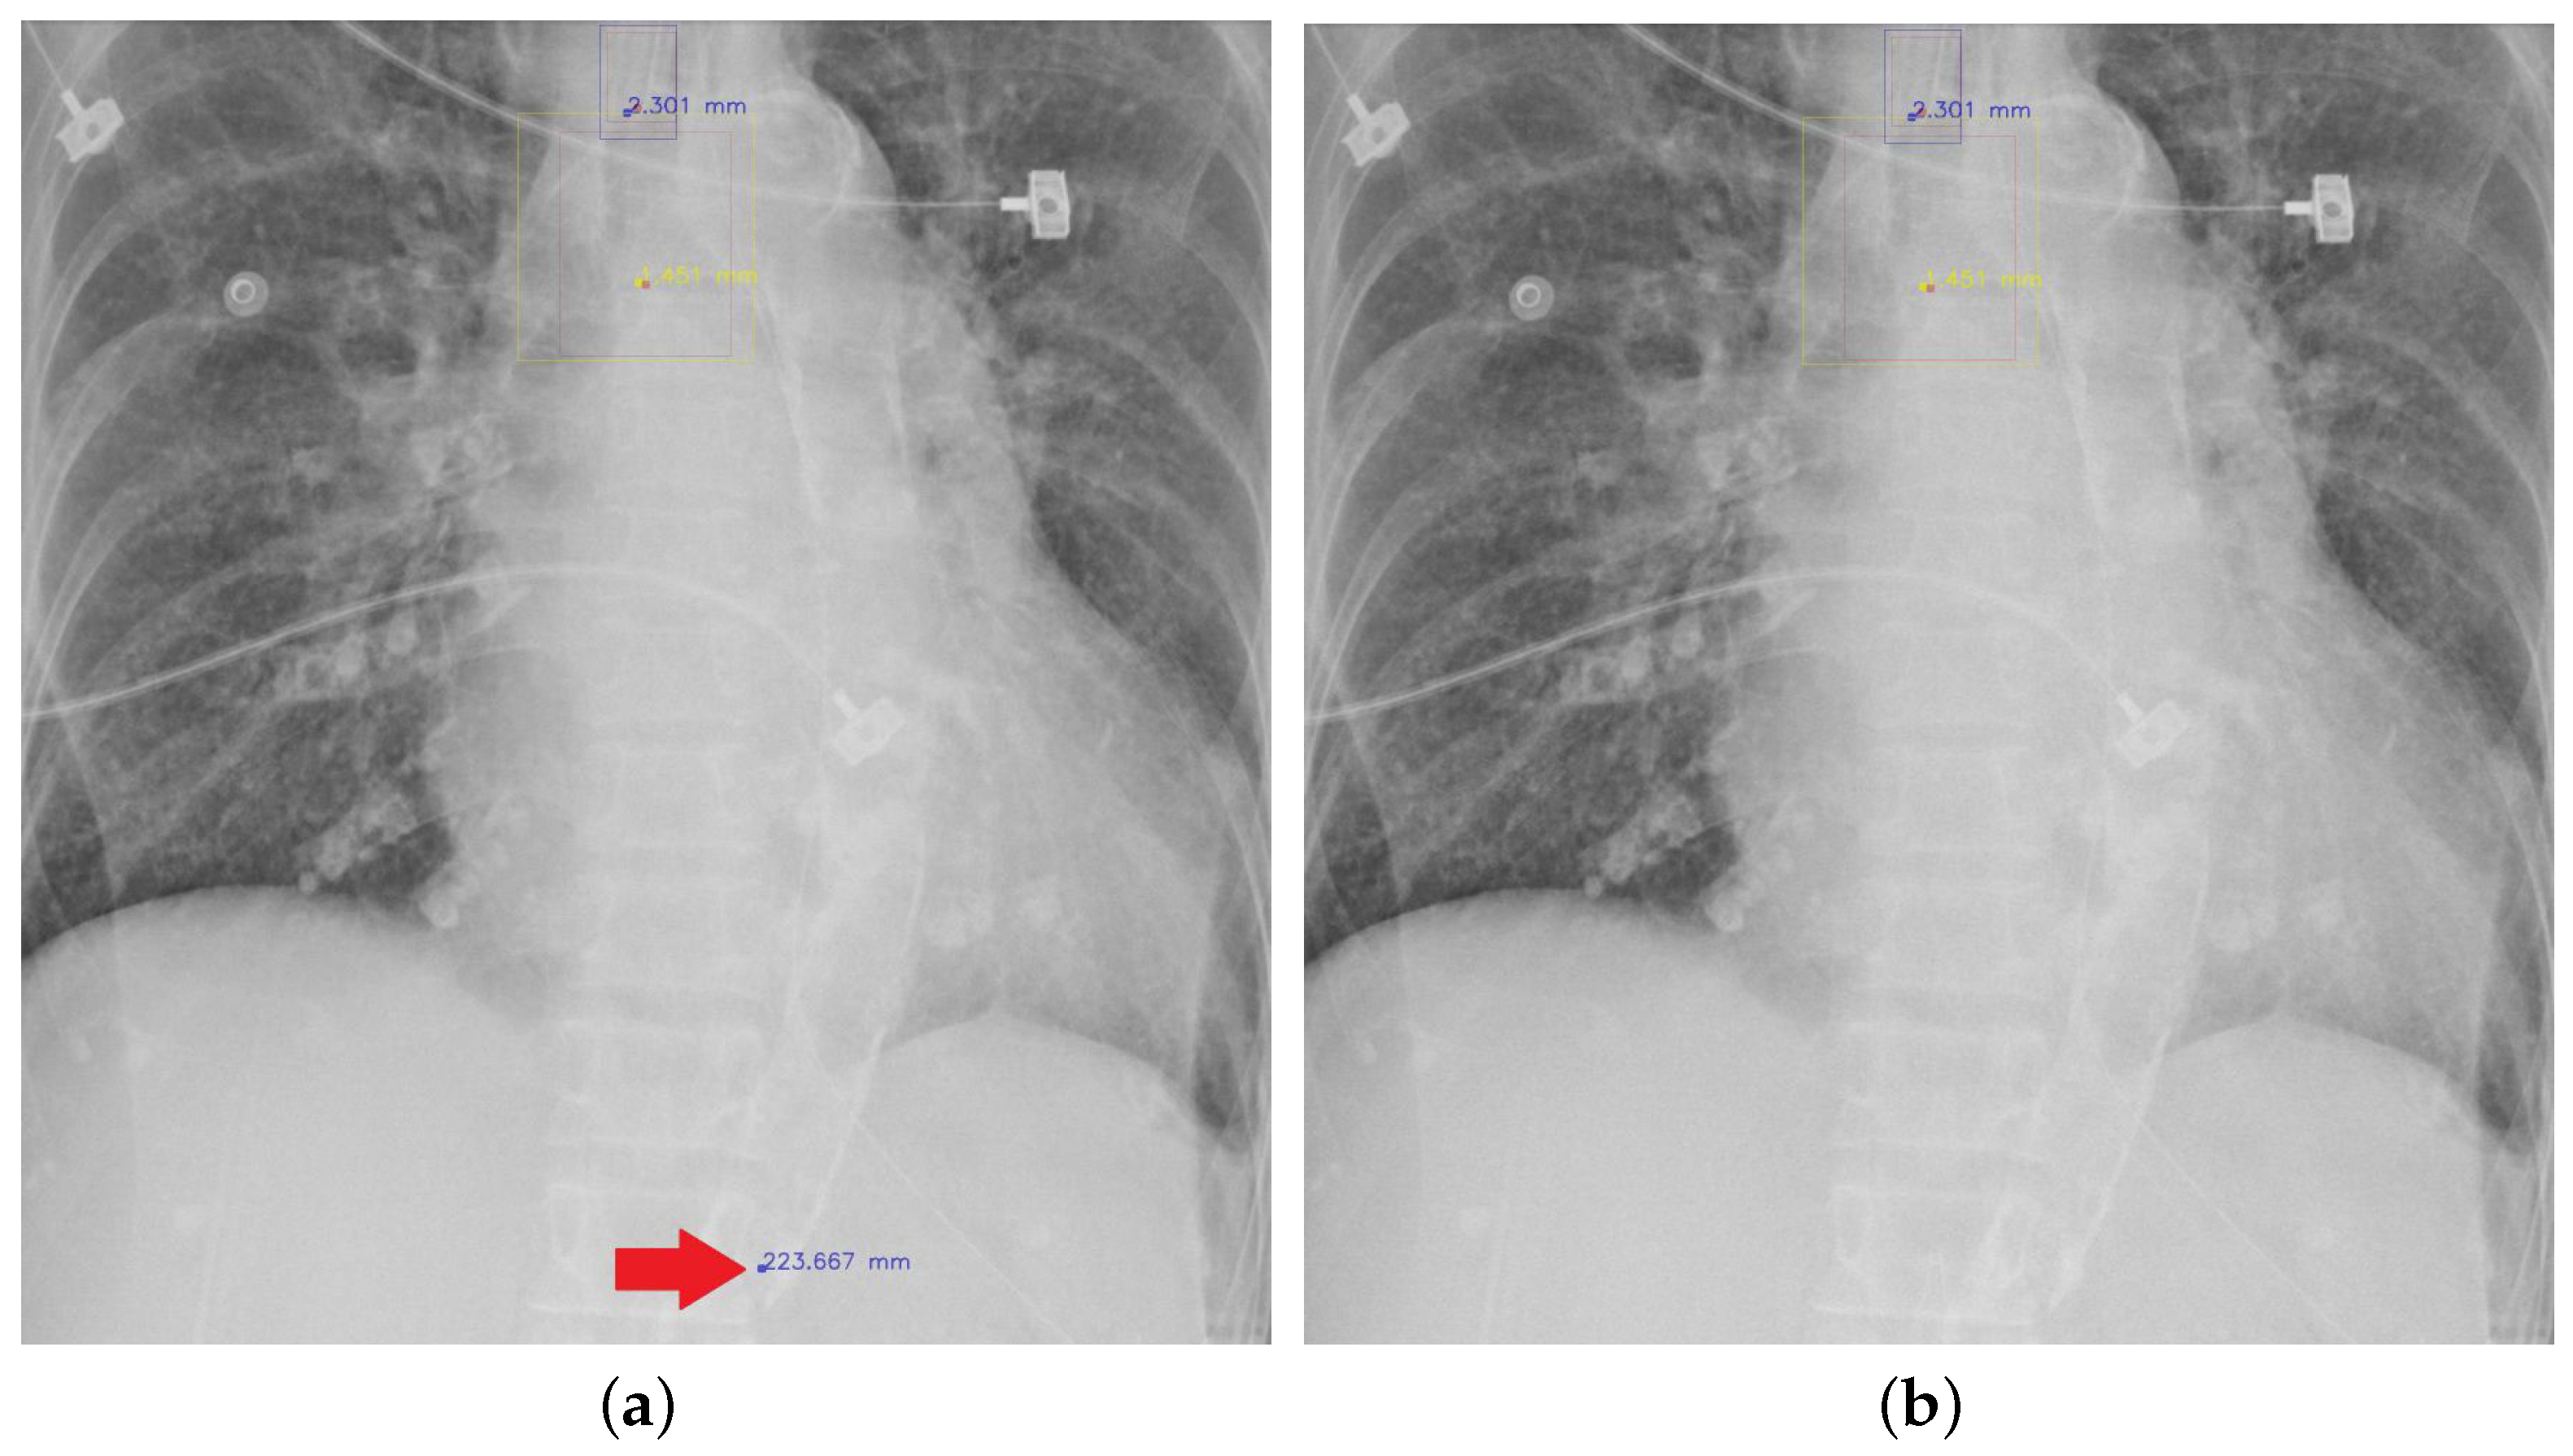
Figure 8.
Refining the feature point of ETT tip/Cairna by the bbox of ETT/Bifurcation. (a) Without post-process. (b) With post-process.
Figure 8.
Refining the feature point of ETT tip/Cairna by the bbox of ETT/Bifurcation. (a) Without post-process. (b) With post-process.
Table 1.
The performance in ETT–Carina distance error.
Table 1.
The performance in ETT–Carina distance error.
| Test Folder | Acc. (%) | Mean (mm) | Std. (mm) |
|---|
| Folder 1 | 90.37 | 5.130 | 5.609 |
| Folder 2 | 87.70 | 5.969 | 8.325 |
| Folder 3 | 88.24 | 5.256 | 5.491 |
| Folder 4 | 86.63 | 5.437 | 6.663 |
| Folder 5 | 91.18 | 4.874 | 5.111 |
| Average | 88.82 | 5.333 | 6.240 |
| External val. | 90.67 | 5.015 | 5.147 |
Table 2.
The distance error distribution in ETT–Carina.
Table 2.
The distance error distribution in ETT–Carina.
| Test Folder | ≤5 mm (%) | ≤10 mm (%) | ≤15 mm (%) | ≤20 mm |
|---|
| Folder 1 | 62.57 | 85.29 | 93.58 | 96.79 |
| Folder 2 | 63.10 | 84.22 | 92.25 | 95.72 |
| Folder 3 | 63.90 | 83.96 | 92.25 | 95.45 |
| Folder 4 | 63.90 | 87.17 | 92.78 | 97.06 |
| Folder 5 | 64.44 | 88.50 | 93.85 | 97.06 |
| Average | 63.58 | 85.83 | 92.94 | 96.42 |
| External val. | 66.00 | 84.00 | 92.67 | 97.33 |
Table 3.
The confusion matrix of diagnosis.
Table 3.
The confusion matrix of diagnosis.
| GT | Suitable | Unsuitable |
|---|
| Predict |
|---|
| Suitable | 1350 | 126 |
| Unsuitable | 66 | 311 |
| Undetection | 12 | 5 |
Table 4.
The confusion matrix of diagnosis (external val.).
Table 4.
The confusion matrix of diagnosis (external val.).
| GT | Suitable | Unsuitable |
|---|
| Predict |
|---|
| Suitable | 110 | 8 |
| Unsuitable | 5 | 26 |
| Undetection | 1 | 0 |
Table 5.
The performance in recall and precision.
Table 5.
The performance in recall and precision.
| Recall and Precision | ETT Tip | Carina |
|---|
| Test Folder | Recall (%) | Precision (%) | Recall (%) | Precision (%) |
| Folder 1 | 90.64 | 91.37 | 94.65 | 94.91 |
| Folder 2 | 89.30 | 89.54 | 93.58 | 93.58 |
| Folder 3 | 90.91 | 92.14 | 92.25 | 92.49 |
| Folder 4 | 91.18 | 91.42 | 94.92 | 95.17 |
| Folder 5 | 92.78 | 93.53 | 94.12 | 94.37 |
| Average | 90.96 | 91.60 | 93.90 | 94.10 |
| External val. | 92.67 | 93.29 | 88.00 | 88.59 |
Table 6.
The performance in object error.
Table 6.
The performance in object error.
| Object Error | ETT Tip | Carina |
|---|
| Test Folder | Mean (mm) | Std. (mm) | Mean (mm) | Std. (mm) |
| Folder 1 | 4.415 | 5.281 | 3.952 | 3.345 |
| Folder 2 | 4.858 | 7.869 | 4.236 | 3.663 |
| Folder 3 | 3.974 | 4.405 | 4.322 | 3.947 |
| Folder 4 | 4.584 | 6.273 | 3.895 | 3.527 |
| Folder 5 | 3.690 | 3.800 | 4.185 | 3.793 |
| Average | 4.304 | 5.526 | 4.118 | 3.655 |
| External val. | 3.733 | 4.613 | 4.688 | 4.043 |
Table 7.
The object error distribution in ETT tip.
Table 7.
The object error distribution in ETT tip.
| Test Folder | ≤5 mm (%) | ≤10 mm (%) | ≤15 mm (%) | ≤20 mm (%) |
|---|
| Folder 1 | 75.94 | 90.64 | 94.39 | 97.06 |
| Folder 2 | 75.40 | 89.30 | 94.65 | 96.79 |
| Folder 3 | 78.61 | 90.91 | 95.19 | 97.06 |
| Folder 4 | 73.26 | 91.18 | 94.92 | 97.86 |
| Folder 5 | 81.02 | 92.78 | 97.06 | 97.59 |
| Average | 76.85 | 90.96 | 95.24 | 97.27 |
| External val. | 83.33 | 92.67 | 94.67 | 96.67 |
Table 8.
The object error distribution in Carina.
Table 8.
The object error distribution in Carina.
| Test Folder | ≤5 mm (%) | ≤10 mm (%) | ≤15 mm (%) | ≤20 mm (%) |
|---|
| Folder 1 | 74.60 | 94.65 | 98.13 | 99.20 |
| Folder 2 | 74.06 | 93.58 | 97.59 | 99.20 |
| Folder 3 | 73.53 | 92.25 | 96.52 | 98.40 |
| Folder 4 | 78.34 | 94.92 | 97.86 | 98.93 |
| Folder 5 | 74.06 | 94.12 | 98.13 | 98.40 |
| Average | 74.92 | 93.90 | 97.65 | 98.83 |
| External val. | 68.67 | 88.00 | 96.67 | 98.00 |
Table 9.
The comparison results of accuracy and ETT–Carina distance error.
Table 9.
The comparison results of accuracy and ETT–Carina distance error.
| Method | Malposition Accuracy (%) | ETT-Carina Distance Error |
|---|
| Mean (mm) | Std. (mm) |
|---|
| SOTA average [11] | 88.11 | 5.543 | 6.310 |
| Ours average | 88.82 (+0.81%) | 5.333 (−3.79%) | 6.240 (−1.11%) |
| SOTA external val. [11] | 87.33 | 5.668 | 6.651 |
| Ours external val. | 90.67 (+3.82%) | 5.015 (−11.52%) | 5.147 (−22.61%) |
Table 10.
The comparison results of error distribution on the ETT–Carina distance.
Table 10.
The comparison results of error distribution on the ETT–Carina distance.
| Method | ETT-Carina Distance Error Distribution |
|---|
| ≤5 mm (%) | ≤10 mm (%) | ≤15 mm (%) | ≤20 mm (%) |
|---|
| SOTA average [11] | 60.37 | 84.20 | 92.78 | 95.39 |
| Ours average | 63.58 (+5.32%) | 85.83 (+1.94%) | 92.94 (+0.17%) | 96.42 (+1.08%) |
| SOTA external val. [11] | 64.00 | 82.00 | 90.67 | 94.67 |
| Ours external val. | 66.00 (+3.13%) | 84.00 (+2.44%) | 92.67 (+2.21%) | 97.33 (+2.81%) |
Table 11.
The comparison results of recall, precision, and object error on the ETT tip.
Table 11.
The comparison results of recall, precision, and object error on the ETT tip.
| Method | ETT Tip |
|---|
| Recall (%) | Precision (%) | Mean (mm) | Std. (mm) |
|---|
| SOTA average [11] | 93.31 | 93.49 | 4.122 | 4.402 |
| Ours average | 90.96 (−2.52%) | 91.60 (−2.02%) | 4.304 (+4.42%) | 5.526 (+25.53%) |
| SOTA external val. [11] | 90.27 | 90.27 | 4.286 | 5.943 |
| Ours external val. | 92.67 (+2.66%) | 93.29 (+3.35%) | 3.733 (−12.90%) | 4.613 (−22.38%) |
Table 12.
The comparison results of error distribution on the ETT tip.
Table 12.
The comparison results of error distribution on the ETT tip.
| Method | ETT Tip Object Error Distribution |
|---|
| ≤5 mm (%) | ≤10 mm (%) | ≤15 mm (%) | ≤20 mm (%) |
|---|
| SOTA average [11] | 75.08 | 93.31 | 96.36 | 98.21 |
| Ours average | 76.85 (+2.36%) | 90.96 (−2.52%) | 95.24 (−1.16%) | 97.29 (−0.94%) |
| SOTA external val. [11] | 79.33 | 90.27 | 95.33 | 96.97 |
| Ours external val. | 83.33 (+5.04%) | 92.67 (+2.66%) | 94.67 (−0.69%) | 96.67 (−0.31%) |
Table 13.
The comparison results of recall, precision, and object error on the Carina.
Table 13.
The comparison results of recall, precision, and object error on the Carina.
| Method | Carina |
|---|
| Recall (%) | Precision (%) | Mean (mm) | Std. (mm) |
|---|
| SOTA average [11] | 94.70 | 95.23 | 4.775 | 5.342 |
| Ours average | 93.90 (−0.84%) | 94.10 (−1.19%) | 4.118 (−13.76%) | 3.655 (−31.58%) |
| SOTA external val. [11] | 91.64 | 91.96 | 4.567 | 4.513 |
| Ours external val. | 88.00 (−3.97%) | 88.59 (−3.66%) | 4.688 (+2.65%) | 4.043 (−10.41%) |
Table 14.
The comparison results of error distribution on the Carina.
Table 14.
The comparison results of error distribution on the Carina.
| Method | Carina Object Error Distribution |
|---|
| ≤5 mm (%) | ≤10 mm (%) | ≤15 mm (%) | ≤20 mm (%) |
|---|
| SOTA average [11] | 68.84 | 94.70 | 95.55 | 97.12 |
| Ours average | 74.92 (+8.83%) | 93.90 (−0.84%) | 97.65 (+2.20%) | 98.83 (+1.76%) |
| SOTA external val. [11] | 73.33 | 91.64 | 95.33 | 96.54 |
| Ours external val. | 68.67 (−6.35%) | 88.00 (−3.97%) | 96.67 (+1.41%) | 98.00 (+1.51%) |
Table 15.
The effect of softmax in GA.
Table 15.
The effect of softmax in GA.
| Method | Malposition Accuracy (% | ETT-Carina | ETT Tip | Carina |
|---|
| Mean Err. (mm) | Err Std. (mm) | Mean Err. (mm) | Err Std. (mm) | Mean Err. (mm) | Err Std. (mm) |
|---|
| w/softmax | 90.11 | 5.209 | 6.628 | 3.968 | 5.800 | 4.203 | 4.097 |
| w/o softmax | 91.18 | 4.911 | 5.114 | 3.689 | 3.802 | 4.238 | 3.862 |
Table 16.
The effect of channel, kernel and SE block of SA.
Table 16.
The effect of channel, kernel and SE block of SA.
| Method | Malposition Accuracy (%) | ETT-Carina | ETT Tip | Carina |
|---|
| Mean Err. (mm) | Err Std. (mm) | Mean Err. (mm) | Err Std. (mm) | Mean Err. (mm) | Err Std. (mm) |
|---|
| SA (c1 + k7) | 83.69 | 4.904 | 4.813 | 3.998 | 3.625 | 4.386 | 3.750 |
| SA (c1 + k1) | 85.83 | 5.648 | 7.628 | 4.911 | 8.605 | 4.185 | 3.674 |
| SA (c4 + k1) | 85.83 | 5.182 | 6.245 | 4.188 | 4.067 | 4.611 | 5.759 |
| SA (c8 + k1) | 87.70 | 5.067 | 5.248 | 4.273 | 4.418 | 4.305 | 4.016 |
| SA (c8 + k7) | 83.69 | 4.644 | 4.401 | 4.007 | 3.615 | 4.028 | 3.372 |
| SA (c16 + k1) | 85.56 | 4.883 | 4.778 | 3.985 | 3.696 | 4.351 | 3.969 |
| SA (w/o SE) | 86.36 | 5.491 | 9.697 | 4.619 | 11.997 | 4.391 | 3.956 |
Table 17.
The comparison results of attention modules.
Table 17.
The comparison results of attention modules.
| Method | Malposition Accuracy (%) | ETT-Carina | ETT Tip | Carina |
|---|
| Mean Err. (mm) | Err Std. (mm) | Mean Err. (mm) | Err Std. (mm) | Mean Err. (mm) | Err Std. (mm) |
|---|
| FCOS [13] | 86.10 | 5.335 | 7.831 | 4.254 | 5.427 | 4.659 | 7.497 |
| FCOS + SE [36] | 85.03 | 5.424 | 5.854 | 4.284 | 4.156 | 4.543 | 4.943 |
| FCOS + CSPnonlocal [45] | 86.10 | 5.404 | 5.817 | 3.980 | 3.708 | 4.332 | 4.416 |
| FCOS + nonlocal [33] | 86.10 | 5.422 | 6.139 | 4.521 | 10.059 | 4.411 | 4.423 |
| FCOS + CBAM [15] | 86.10 | 5.303 | 5.654 | 4.381 | 4.870 | 4.380 | 4.260 |
| FCOS + CCAM [14] | 86.90 | 4.632 | 4.491 | 4.025 | 3.641 | 4.035 | 3.517 |
| FCOS + SA | 87.70 | 5.067 | 5.248 | 4.273 | 4.418 | 4.305 | 4.016 |
Table 18.
The comparison results of attention modules in parameters and GFLOPs.
Table 18.
The comparison results of attention modules in parameters and GFLOPs.
| Method | Parameters (M) | GFLOPs |
|---|
| FCOS [13] | 32.118 | 19.764 |
| FCOS + SE [36] | 32.126 (+0.02%) | 19.764 (+0%) |
| FCOS + CSPnonlocal [45] | 32.284 (+0.52%) | 19.782 (+0.09%) |
| FCOS + nonlocal [33] | 33.302 (+3.69%) | 19.882 (+0.60%) |
| FCOS + CBAM [15] | 32.127 (+0.03%) | 19.764 (+0%) |
| FCOS + CCAM [14] | 34.154 (+6.34%) | 19.964 (+1.01%) |
| FCOS + SA | 32.253 (+0.42%) | 19.778 (+0.07%) |
Table 19.
The results of GA and SA fusion method.
Table 19.
The results of GA and SA fusion method.
| Method | Malposition Accuracy (%) | ETT-Carina | ETT Tip | Carina |
|---|
| Mean Err. (mm) | Err Std. (mm) | Mean Err. (mm) | Err Std. (mm) | Mean Err. (mm) | Err Std. (mm) |
|---|
| FCOS | 86.10 | 5.335 | 7.831 | 4.254 | 5.427 | 4.659 | 7.497 |
| FCOS + SA + GA | 83.96 | 5.225 | 5.306 | 4.304 | 4.376 | 4.425 | 4.032 |
| FCOS + GA || SA | 87.17 | 5.492 | 6.583 | 4.956 | 9.549 | 4.164 | 4.158 |
| FCOS + GA + SA | 87.97 | 4.868 | 4.953 | 4.143 | 4.157 | 4.016 | 3.350 |
Table 20.
The effect of fusing global modelling attention and scale attention.
Table 20.
The effect of fusing global modelling attention and scale attention.
| Method | Malposition Accuracy (%) | ETT-Carina | ETT Tip | Carina |
|---|
| Mean Err. (mm) | Err Std. (mm) | Mean Err. (mm) | Err Std. (mm) | Mean Err. (mm) | Err Std. (mm) |
|---|
| FCOS | 86.10 | 5.335 | 7.831 | 4.254 | 5.427 | 4.659 | 7.497 |
| FCOS + nonlocal*2 | OOM | OOM | OOM | OOM | OOM | OOM | OOM |
| FCOS + CSPnonlocal*2 | 85.56 | 5.800 | 8.991 | 4.391 | 5.543 | 4.703 | 7.512 |
| FCOS + CCAM*2 | 86.10 | 4.855 | 4.988 | 4.020 | 4.037 | 4.301 | 3.835 |
| FCOS + SA*2 | 87.17 | 5.643 | 6.820 | 4.432 | 5.021 | 4.422 | 5.387 |
| FCOS + CSPnonlocal + SA | 86.90 | 5.727 | 6.518 | 4.646 | 5.267 | 4.685 | 4.732 |
| FCOS + CCAM + SA | 87.97 | 4.868 | 4.953 | 4.143 | 4.157 | 4.016 | 3.350 |
Table 21.
The results of employing mask branch into FCOS.
Table 21.
The results of employing mask branch into FCOS.
| Method | Malposition Accuracy (%) | ETT-Carina | ETT Tip | Carina |
|---|
| Mean Err. (mm) | Err Std. (mm) | Mean Err. (mm) | Err Std. (mm) | Mean Err. (mm) | Err Std. (mm) |
|---|
| FCOS [13] | 86.10 | 5.335 | 7.831 | 4.254 | 5.427 | 4.659 | 7.497 |
| CTFA | 87.97 | 4.868 | 4.953 | 4.143 | 4.157 | 4.016 | 3.350 |
| Seg (All) | 87.97 | 4.909 | 5.179 | 3.939 | 4.468 | 4.043 | 3.121 |
| Seg (ETT) | 89.04 | 5.486 | 7.682 | 4.398 | 6.754 | 4.521 | 4.244 |
| Seg (ETT + Carina) | 90.11 | 5.334 | 6.752 | 4.088 | 5.989 | 4.329 | 4.253 |
| Seg (ETT + Carina) + Fusion | 91.18 | 4.911 | 5.114 | 3.689 | 3.802 | 4.238 | 3.862 |
Table 22.
The results of adopting mask prediction or not in the post-process algorithm.
Table 22.
The results of adopting mask prediction or not in the post-process algorithm.
| Method | Malposition Accuracy (%) | ETT-Carina | ETT Tip | Carina |
|---|
| Mean Err. (mm) | Err Std. (mm) | Mean Err. (mm) | Err Std. (mm) | Mean Err. (mm) | Err Std. (mm) |
|---|
| w/mask | 85.56 | 7.438 | 10.552 | 6.389 | 10.672 | 4.329 | 4.253 |
| w/o mask | 90.11 | 5.334 | 6.752 | 4.088 | 5.989 | 4.329 | 4.253 |
Table 23.
The visualization results.
Table 23.
The visualization results.


