
Breast Cancer Detection in Mammography Images Using Deep Convolutional Neural Networks and Fuzzy Ensemble Modeling Techniques


 ,
,  ,
,  and
and 
Abstract
:1. Introduction
2. Motivation and Contributions
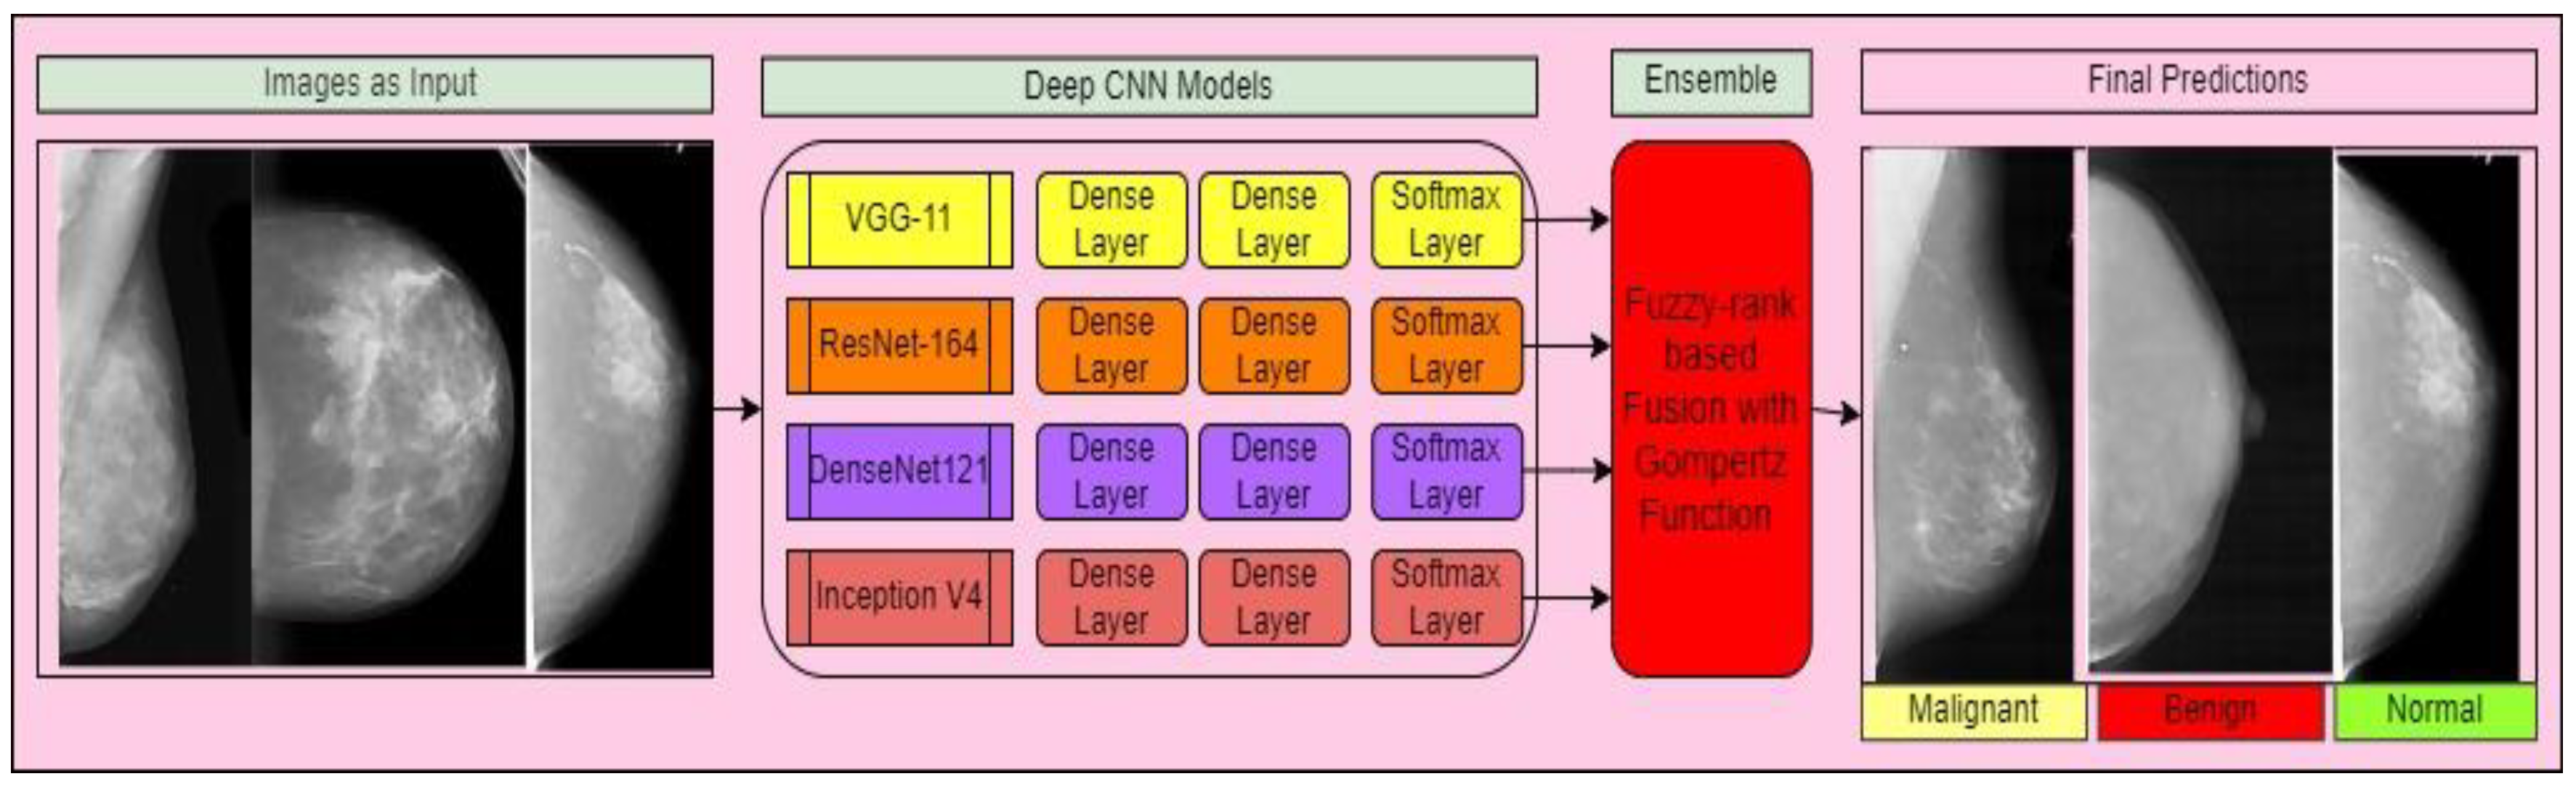
- The aim of our study is to build a fuzzy ensemble methodology that takes breast mammography images as input. Initially, we employed multiple pre-trained deep CNN models to diagnose cancer in mammography images, including VGG-11, ResNet-164, DenseNet121, and Inception V4.
- We used dense and softmax layers to extract characteristics and categorize mammography pictures utilizing pre-trained deep CNN models. An ensemble technique was utilized to combine the decision scores of the aforementioned models.
- Using a re-parameterized Gompertz function, the ensemble approach delivers fuzzy rankings to the component classifiers. Fuzzy fusion outperforms traditional ensemble algorithms because it uses adaptive priority depending on the classifiers’ confidence levels for each sample to be predicted.
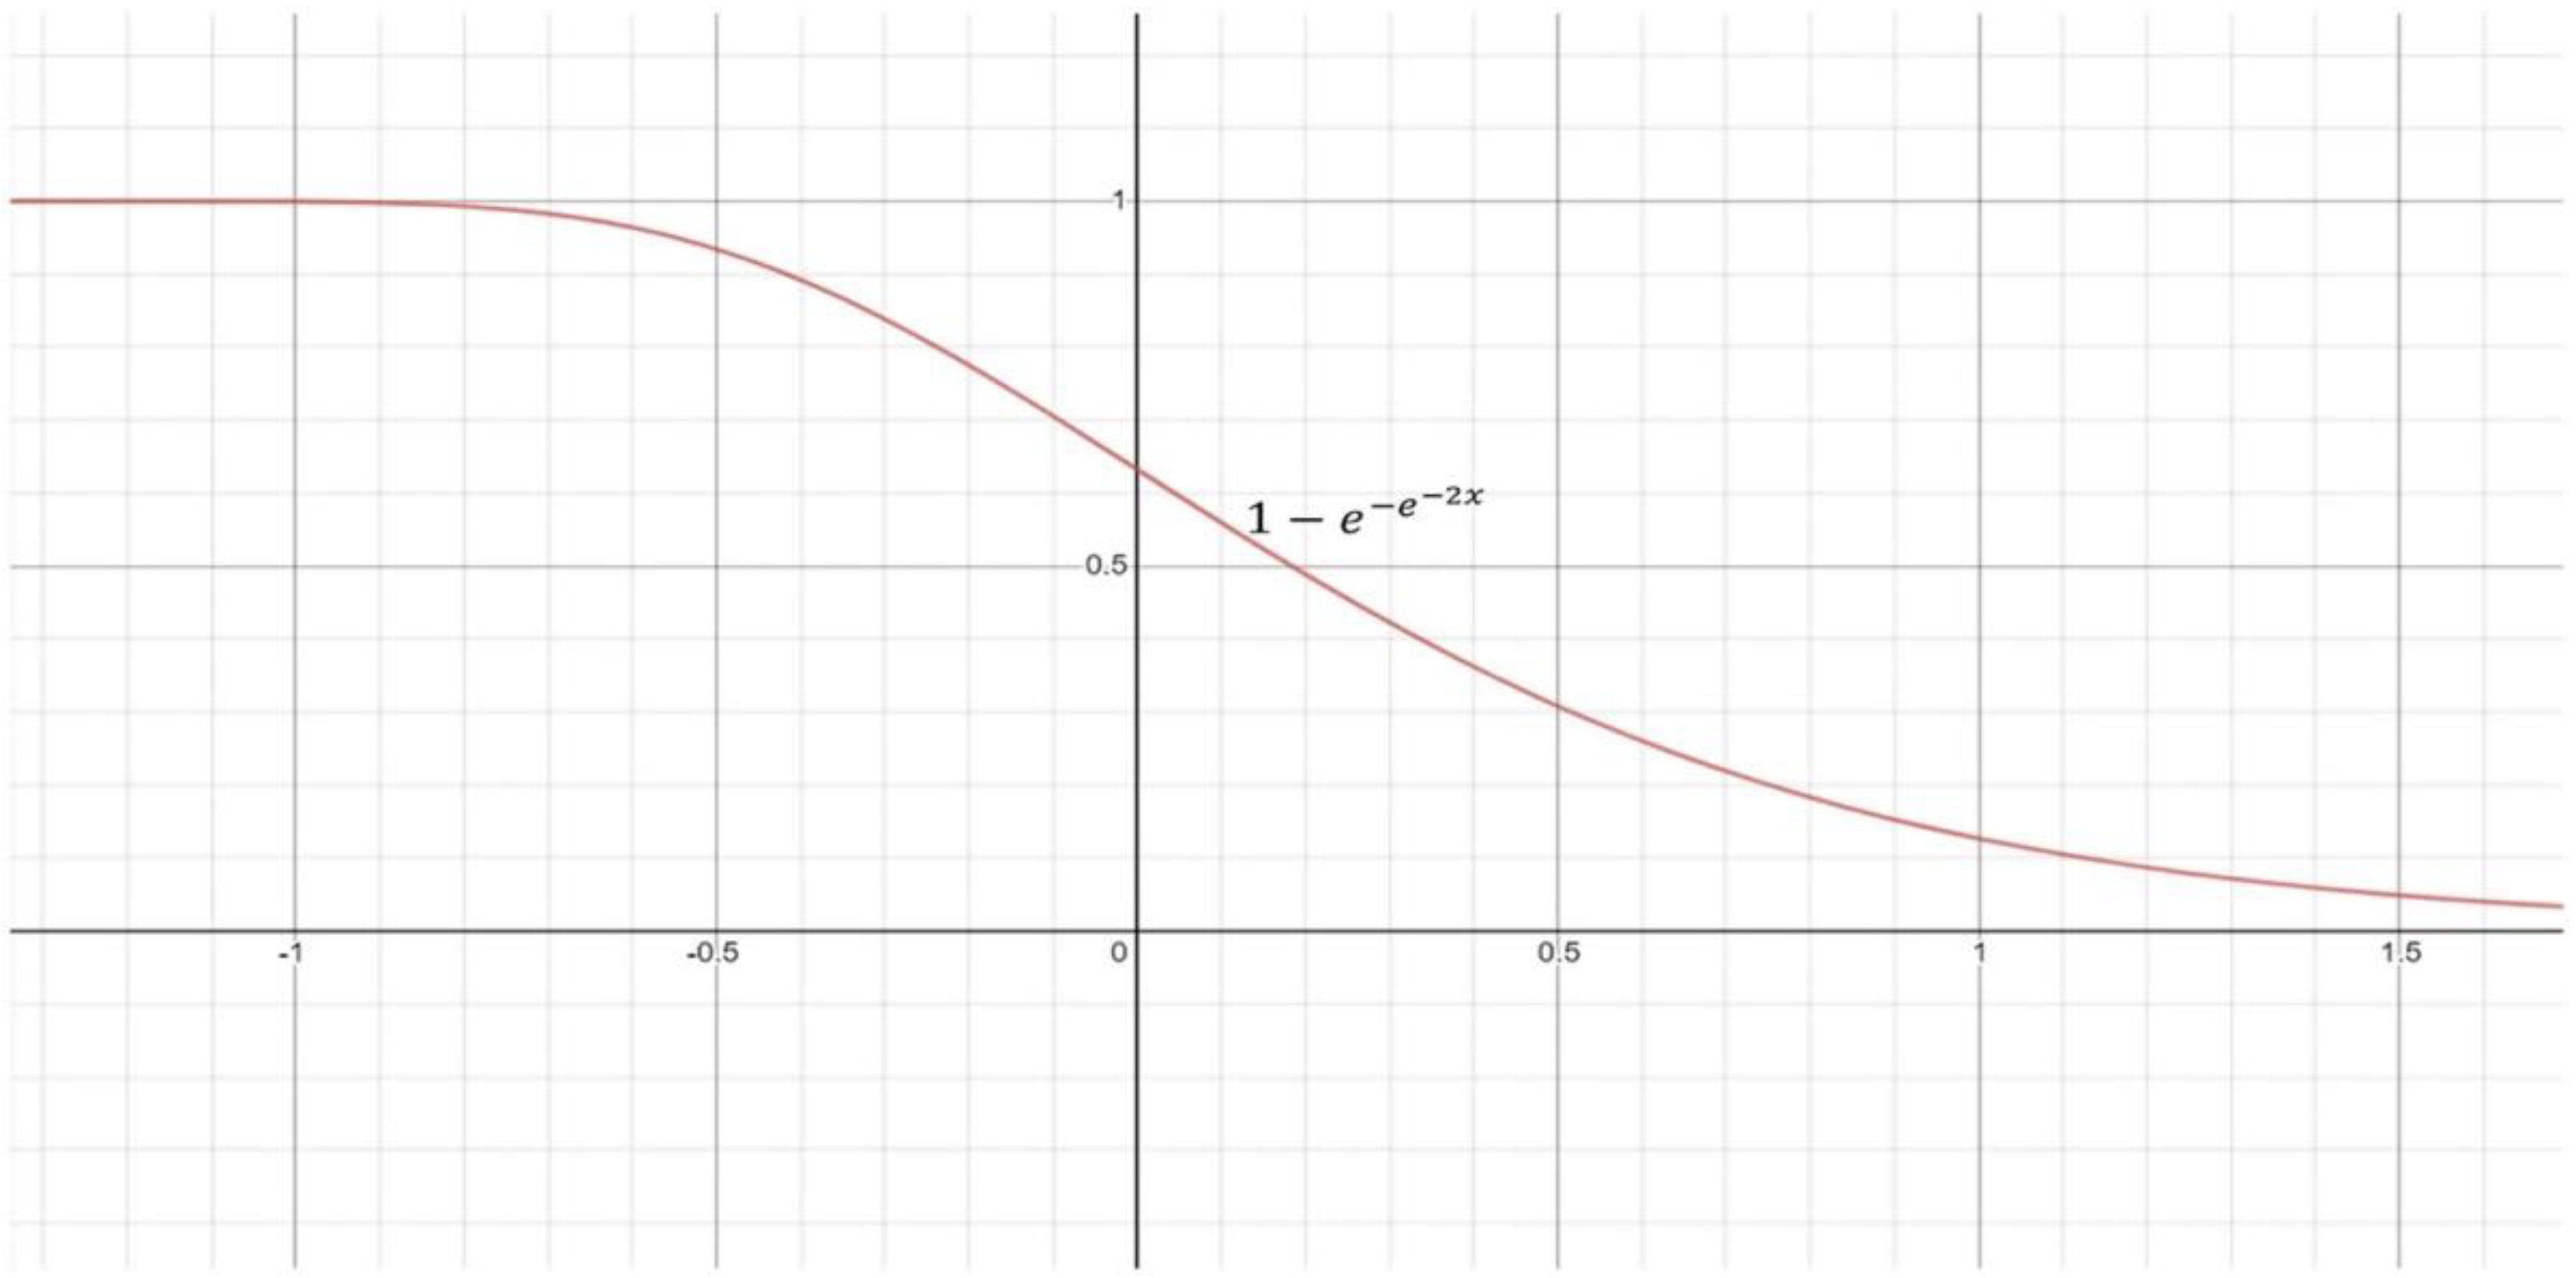
- The Gompertz function displays exponential growth before saturating to an asymptote, and that is beneficial for assembling the decision values of deep CNN methodologies, since the decision value of a class forecasted by a classifier typically reaches zero.
- The framework’s efficiency was assessed using recall, precision, F1-Score, specificity, and sensitivity. The gathered results beat the present methodologies by a significant amount.
3. Materials and Methods
3.1. Deep CNN Models
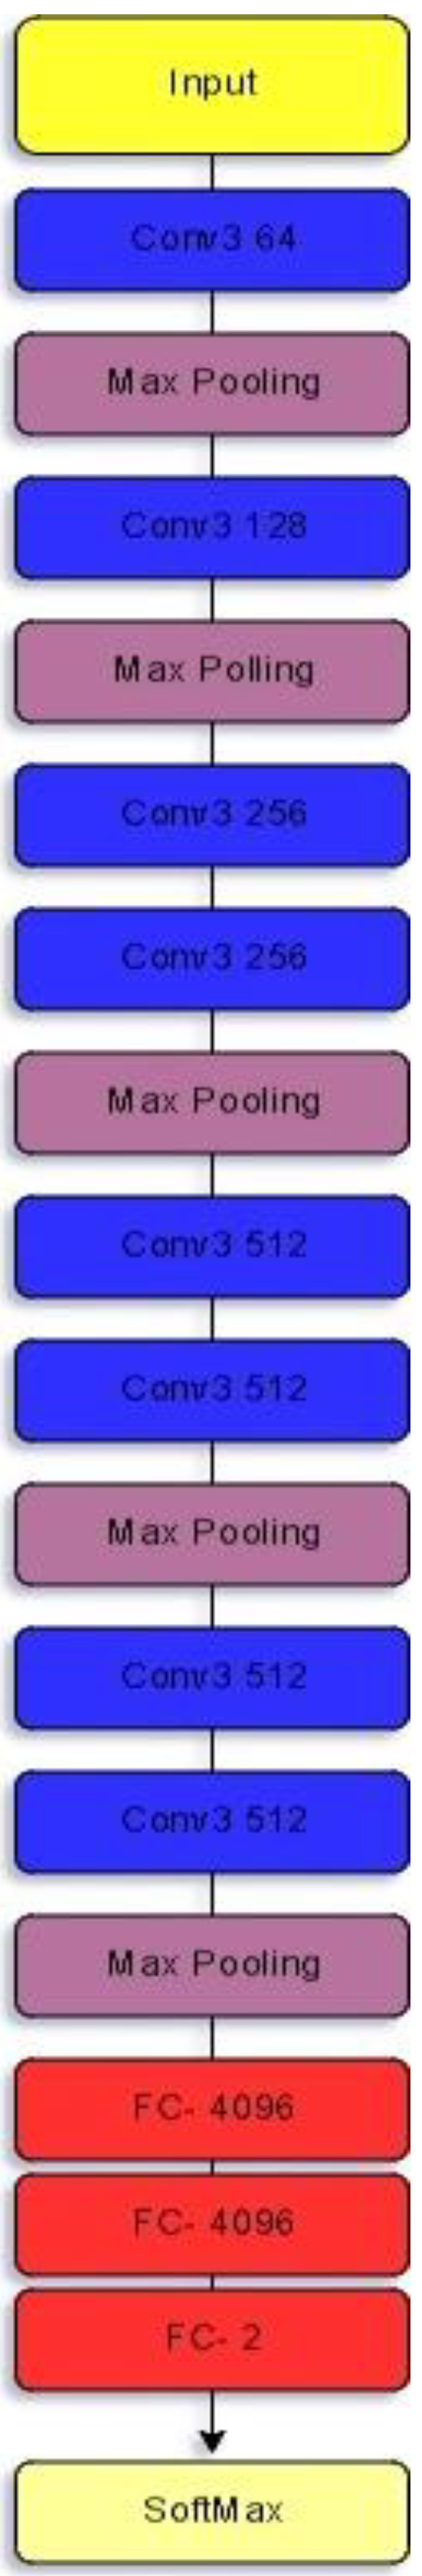
3.1.1. VGG-11
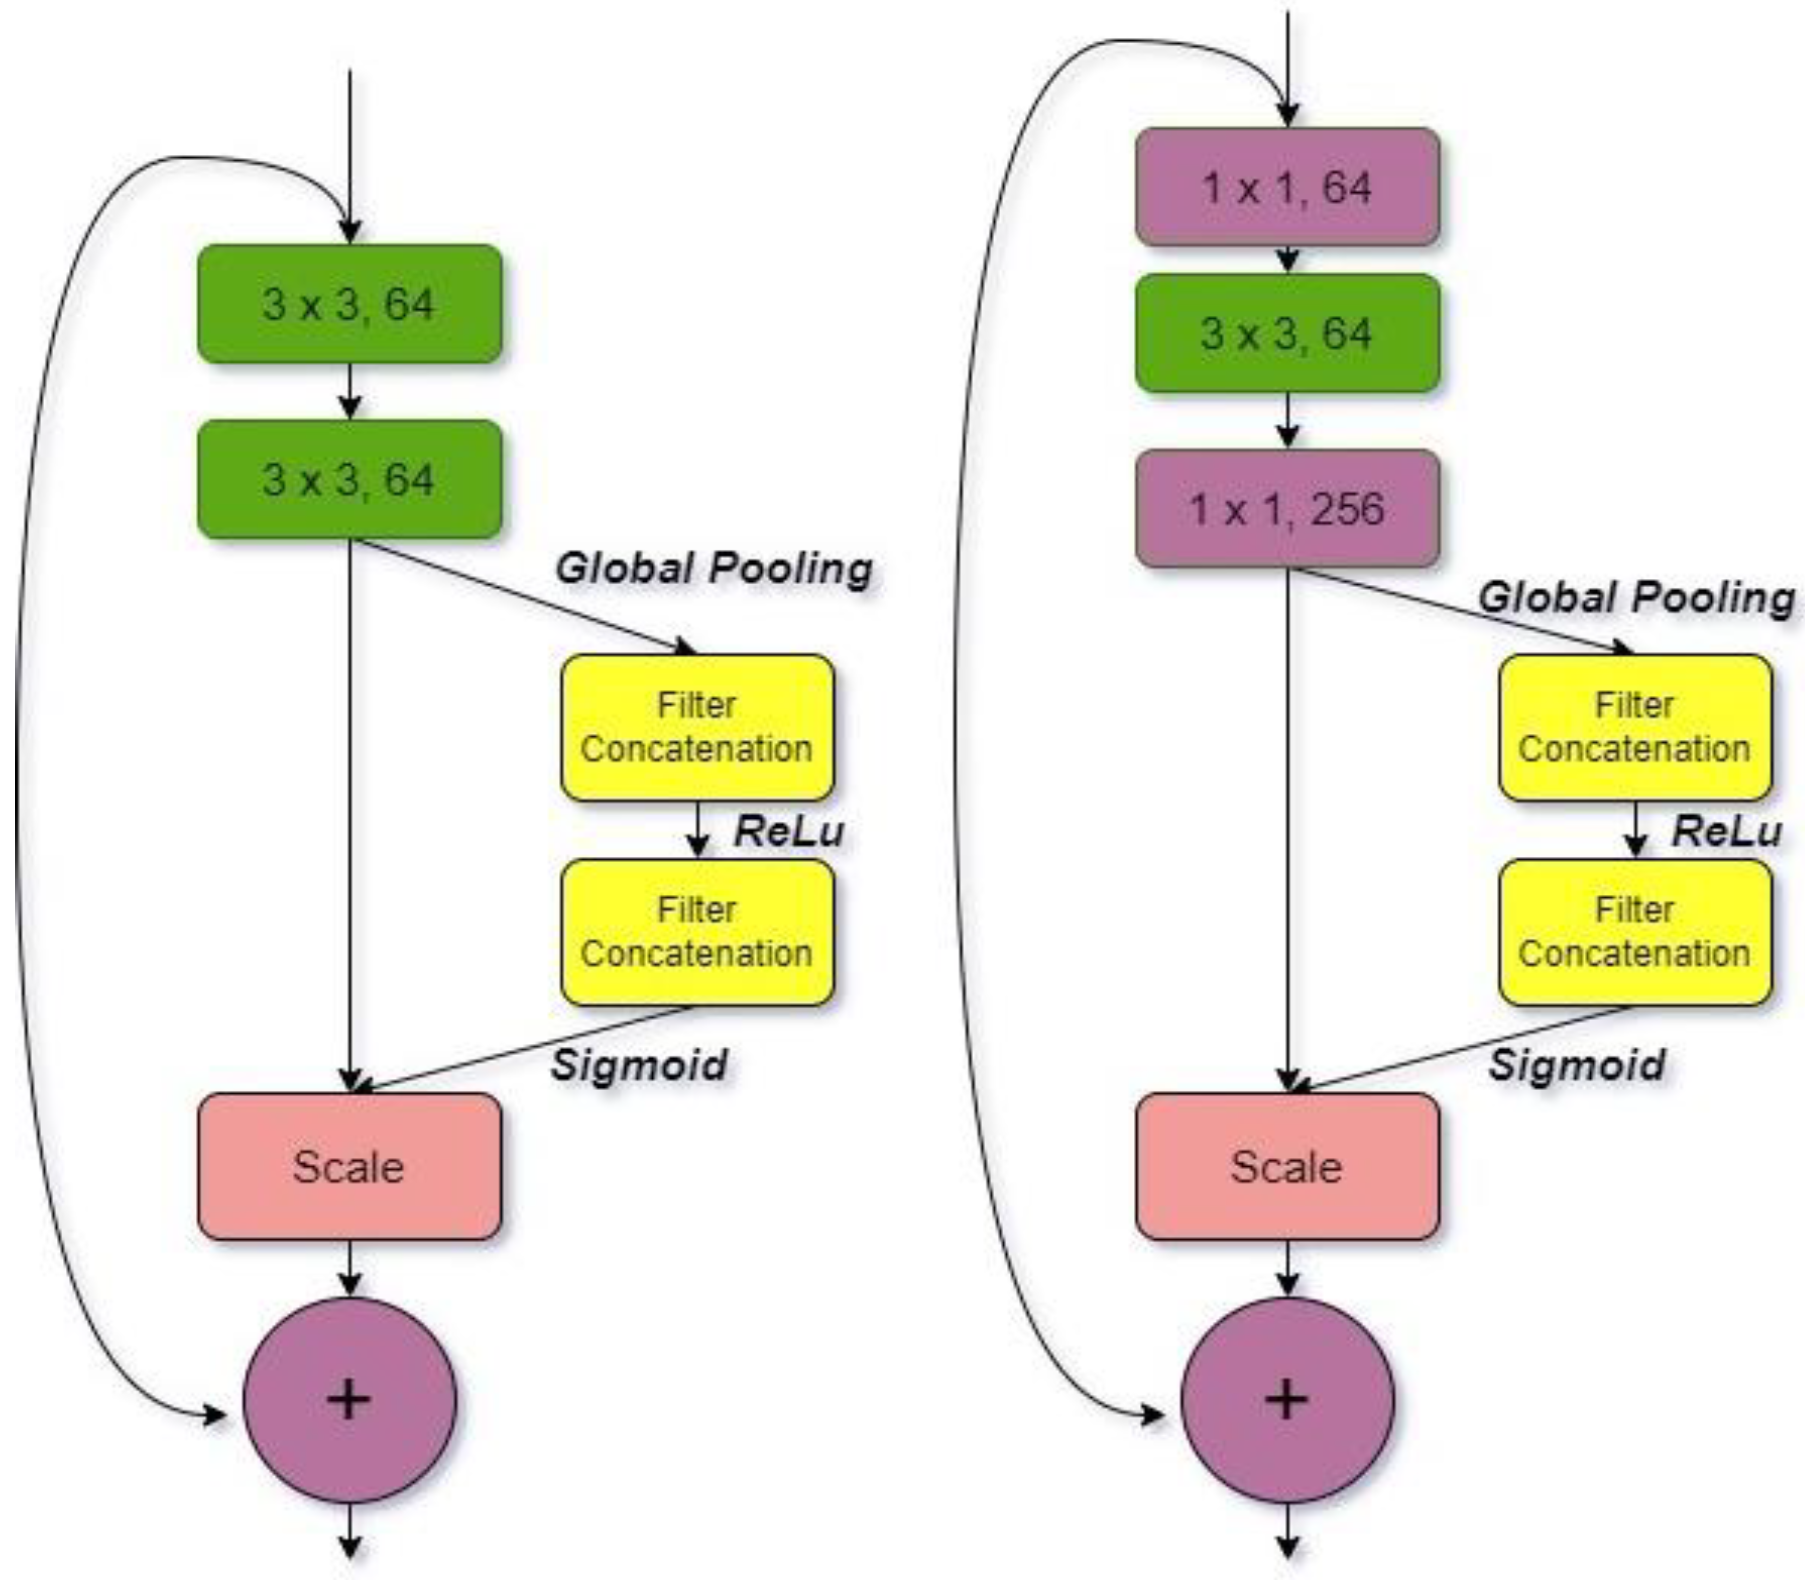
3.1.2. ResNet-164
3.1.3. DenseNet121
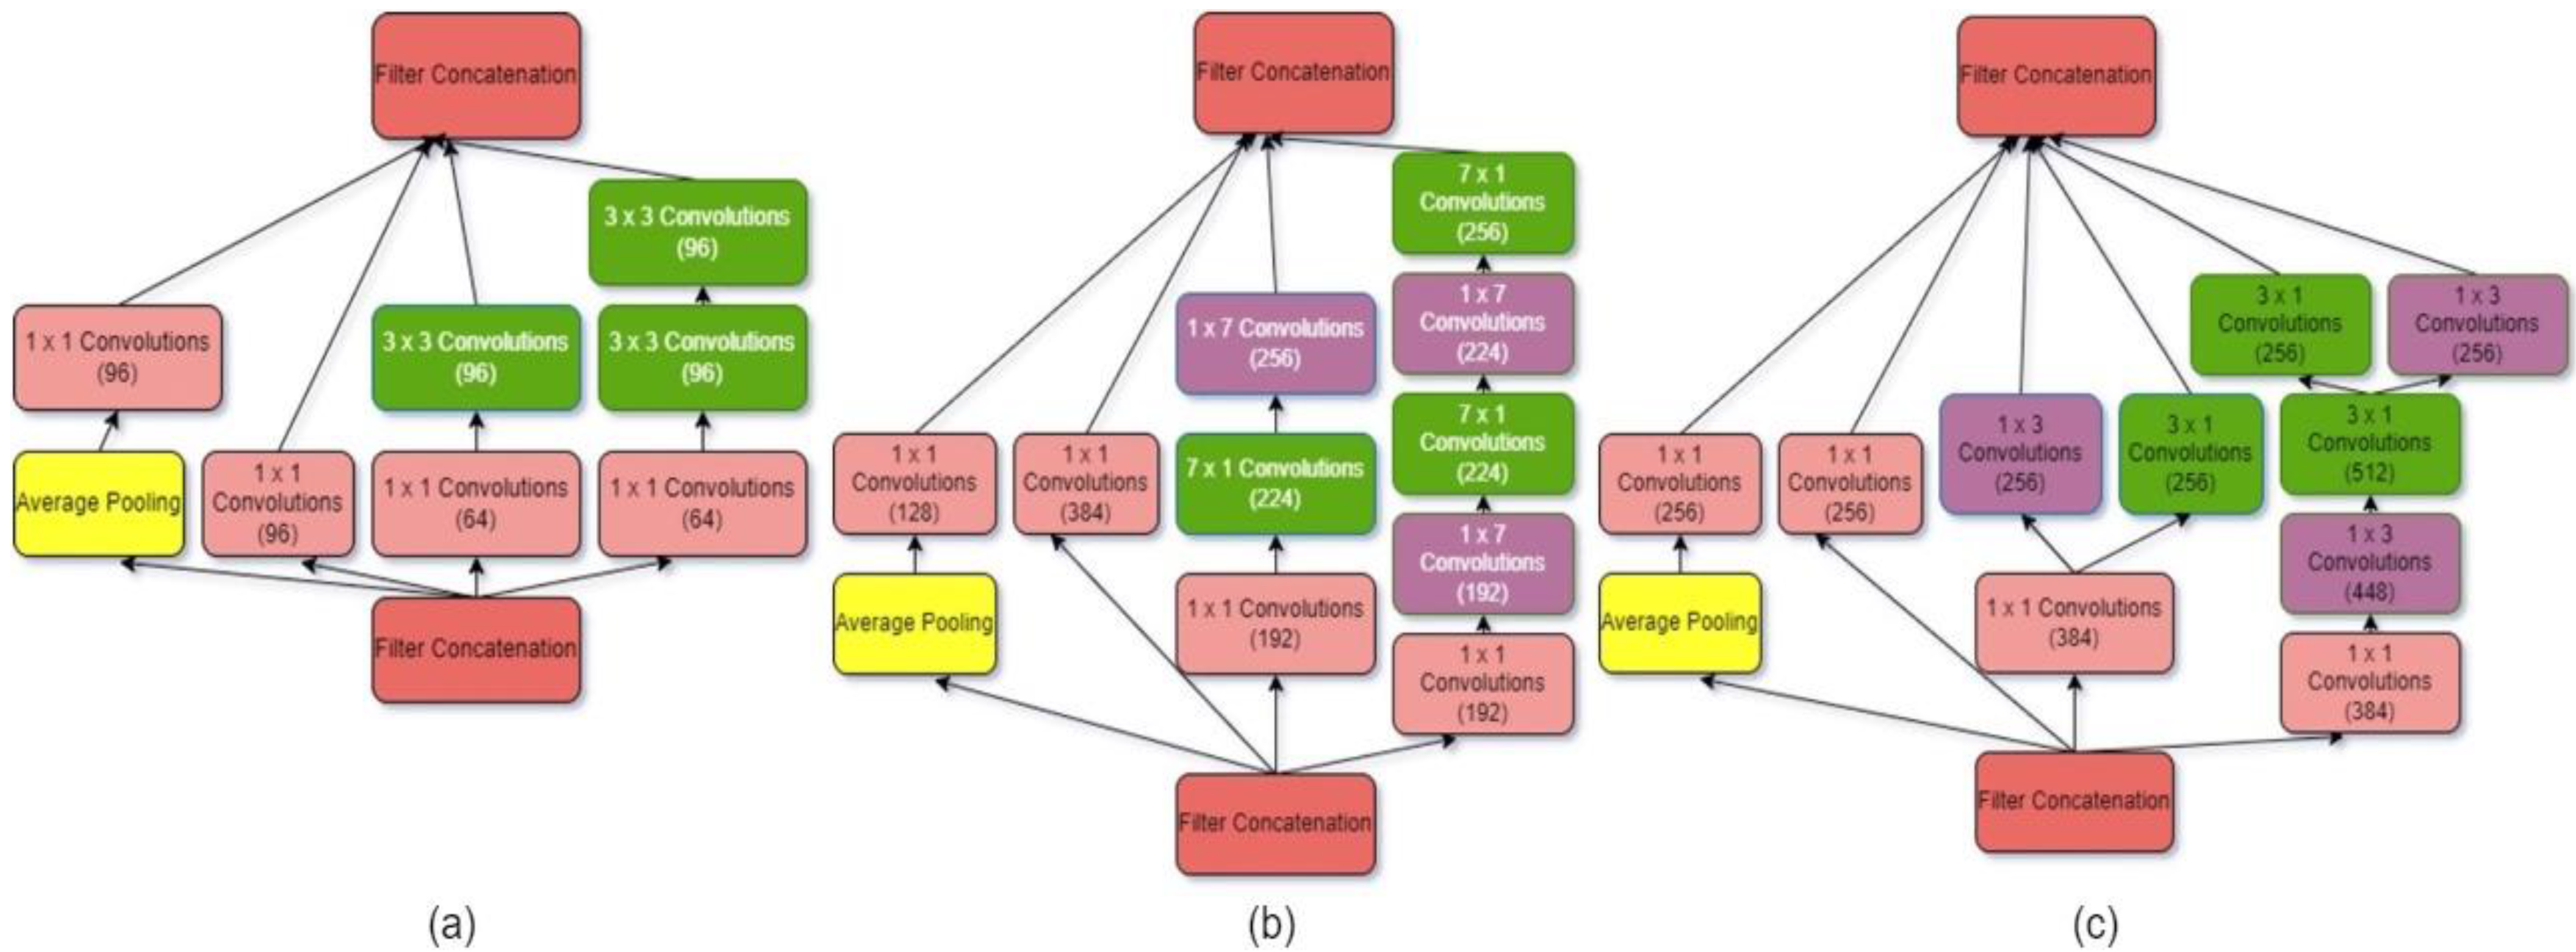
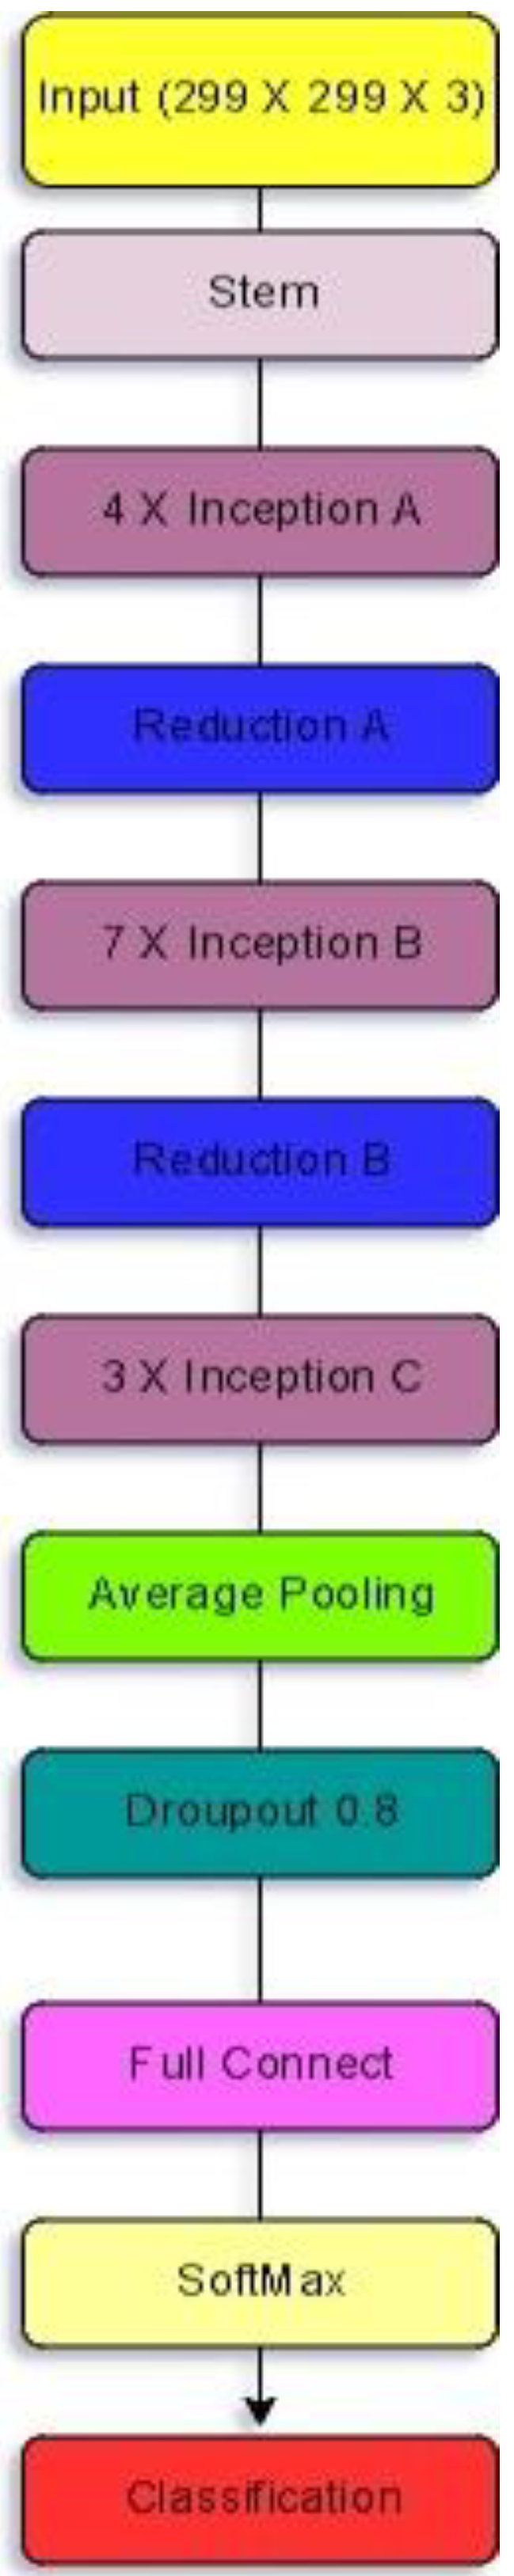
3.1.4. Inception V4
3.2. Data Set
3.3. Experimental Environment
3.4. Proposed Framework
3.5. Ensemble Technologies
3.5.1. Weighted Average (WA)
3.5.2. Sugeno Integral (SI)
3.5.3. Fuzzy-Rank-Based Fusion with Gompertz Function (FRGF)
4. Experimental Results and Evaluations
5. Discussion and Conclusions
Author Contributions
Funding
Institutional Review Board Statement
Informed Consent Statement
Data Availability Statement
Conflicts of Interest
References
- World Health Organization. Preventing Cancer. 2021. Available online: https://www.who.int/cancer/prevention/diagnosis-screening/breast-cancer/en/ (accessed on 1 February 2022).
- Breast Cancer Statistics: India versus The World. 2018. Available online: https://www.breastcancerindia.net/statistics/stat_global.html (accessed on 1 February 2022).
- Breast Cancer. 2021. Available online: https://www.who.int/news-room/fact-sheets/detail/breast-cancer (accessed on 1 February 2022).
- Bower, J.E. Behavioral symptoms in breast cancer patients and survivors: Fatigue, insomnia, depression, and cognitive disturbance. J. Clin. Oncol. Off. J. Am. Soc. Clin. Oncol. 2008, 26, 768. [Google Scholar] [CrossRef] [Green Version]
- Shen, L.; Margolies, L.R.; Rothstein, J.H.; Fluder, E.; McBride, R.; Sieh, W. Deep learning to improve breast cancer detection on screening mammography. Sci. Rep. 2019, 9, 12495. [Google Scholar] [CrossRef]
- Rodriguez-Ruiz, A.; Lång, K.; Gubern-Merida, A.; Broeders, M.; Gennaro, G.; Clauser, P.; Sechopoulos, I. Stand-alone artificial intelligence for breast cancer detection in mammography: Comparison with 101 radiologists. JNCI J. Natl. Cancer Inst. 2019, 111, 916–922. [Google Scholar] [CrossRef] [PubMed]
- Rodríguez-Ruiz, A.; Krupinski, E.; Mordang, J.J.; Schilling, K.; Heywang-Köbrunner, S.H.; Sechopoulos, I.; Mann, R.M. Detection of breast cancer with mammography: Effect of an artificial intelligence support system. Radiology 2019, 290, 305–314. [Google Scholar] [CrossRef]
- Naji, M.A.; El Filali, S.; Bouhlal, M.; Benlahmar, E.H.; Abdelouhahid, R.A.; Debauche, O. Breast Cancer Prediction and Diagnosis through a New Approach based on Majority Voting Ensemble Classifier. Procedia Comput. Sci. 2021, 191, 481–486. [Google Scholar] [CrossRef]
- Chakravarthy, S.S.; Rajaguru, H. Automatic Detection and Classification of Mammograms Using Improved Extreme Learning Machine with Deep Learning. IRBM 2022, 43, 49–61. [Google Scholar] [CrossRef]
- Faisal, M.I.; Bashir, S.; Khan, Z.S.; Khan, F.H. An evaluation of machine learning classifiers and ensembles for early stage prediction of lung cancer. In Proceedings of the 2018 3rd International Conference on Emerging Trends in Engineering, Sciences and Technology (ICEEST), Karachi, Pakistan, 21–22 December 2018; pp. 1–4. [Google Scholar] [CrossRef]
- Mughal, B. Early Detection and Classification of Breast Tumor from Mammography. Doctoral Dissertation, COMSATS Institute of Information Technology, Islamabad, Pakistan, 2019. [Google Scholar]
- Wei, B.; Han, Z.; He, X.; Yin, Y. Deep learning model based breast cancer histopathological image classification. In Proceedings of the 2017 IEEE 2nd International Conference on Cloud Computing and Big Data Analysis (ICCCBDA), Chengdu, China, 28–30 April 2017; pp. 348–353. [Google Scholar] [CrossRef]
- Khuriwal, N.; Mishra, N. Breast cancer diagnosis using adaptive voting ensemble machine learning algorithm. In Proceedings of the 2018 IEEMA Engineer Infinite Conference (eTechNxT), New Delhi, India, 13–14 March 2018; pp. 1–5. [Google Scholar] [CrossRef]
- Thuy, M.B.H.; Hoang, V.T. Fusing of deep learning, transfer learning and gan for breast cancer histopathological image classification. In Advances in Intelligent Systems and Computing, Proceedings of the 6th International Conference on Computer Science, Applied Mathematics and Applications, ICCSAMA 2019, Hanoi, Vietnam, 19–20 December 2019; Springer: Cham, Switzerland; pp. 255–266. [CrossRef]
- Bhowal, P.; Sen, S.; Velasquez, J.D.; Sarkar, R. Fuzzy ensemble of deep learning models using choquet fuzzy integral, coalition game and information theory for breast cancer histology classification. Expert Syst. Appl. 2022, 190, 116167. [Google Scholar] [CrossRef]
- Khan, S.; Islam, N.; Jan, Z.; Din, I.U.; Rodrigues, J.J.C. A novel deep learning based framework for the detection and classification of breast cancer using transfer learning. Pattern Recognit. Lett. 2019, 125, 1–6. [Google Scholar] [CrossRef]
- Muduli, D.; Dash, R.; Majhi, B. Automated diagnosis of breast cancer using multi-modal datasets: A deep convolution neural network based approach. Biomed. Signal Processing Control. 2022, 71, 102825. [Google Scholar] [CrossRef]
- Nguyen, Q.H.; Nguyen, B.P.; Dao, S.D.; Unnikrishnan, B.; Dhingra, R.; Ravichandran, S.R.; Chua, M.C. Deep learning models for tuberculosis detection from chest X-ray images. In Proceedings of the 2019 26th International Conference on Telecommunications (ICT), Hanoi, Vietnam, 8–10 April 2019; pp. 381–385. [Google Scholar] [CrossRef]
- Ezzat, D.; Hassanien, A.E.; Ella, H.A. An optimized deep learning architecture for the diagnosis of COVID-19 disease based on gravitational search optimization. Appl. Soft Comput. 2021, 98, 106742. [Google Scholar] [CrossRef]
- Rajaraman, S.; Antani, S.K. Modality-specific deep learning model ensembles toward improving TB detection in chest radiographs. IEEE Access 2020, 8, 27318–27326. [Google Scholar] [CrossRef] [PubMed]
- Lakhani, P.; Sundaram, B. Deep learning at chest radiography: Automated classification of pulmonary tuberculosis by using convolutional neural networks. Radiology 2017, 284, 574–582. [Google Scholar] [CrossRef] [PubMed]
- Hernández, A.; Panizo, Á.; Camacho, D. An ensemble algorithm based on deep learning for tuberculosis classification. In Intelligent Data Engineering and Automated Learning—IDEAL 2019, Proceedings of the International Conference on Intelligent Data Engineering and Automated Learning, Manchester, UK, 14–16 November 2019; Springer: Cham, Switzerland, 2019; pp. 145–154. [Google Scholar] [CrossRef]
- Wang, Z.; Li, M.; Wang, H.; Jiang, H.; Yao, Y.; Zhang, H.; Xin, J. Breast cancer detection using extreme learning machine based on feature fusion with CNN deep features. IEEE Access 2019, 7, 105146–105158. [Google Scholar] [CrossRef]
- Zheng, J.; Lin, D.; Gao, Z.; Wang, S.; He, M.; Fan, J. Deep learning assisted efficient AdaBoost algorithm for breast cancer detection and early diagnosis. IEEE Access 2020, 8, 96946–96954. [Google Scholar] [CrossRef]
- Tan, Y.J.; Sim, K.S.; Ting, F.F. Breast cancer detection using convolutional neural networks for mammogram imaging system. In Proceedings of the 2017 International Conference on Robotics, Automation and Sciences (ICORAS), Melaka, Malaysia, 27–29 November 2017; pp. 1–5. [Google Scholar] [CrossRef]
- Simonyan, K.; Zisserman, A. Very deep convolutional networks for large-scale image recognition. arXiv 2014, arXiv:1409.1556. [Google Scholar]
- Wang, F.; Jiang, M.; Qian, C.; Yang, S.; Li, C.; Zhang, H.; Tang, X. Residual attention network for image classification. In Proceedings of the IEEE Conference on Computer Vision and Pattern Recognition, Honolulu, HI, USA, 21–26 July 2017; pp. 3156–3164. [Google Scholar] [CrossRef] [Green Version]
- Cao, X.; Chen, H.; Li, Y.; Peng, Y.; Wang, S.; Cheng, L. Uncertainty aware temporal-ensembling model for semi-supervised abus mass segmentation. IEEE Trans. Med. Imaging 2020, 40, 431–443. [Google Scholar] [CrossRef]
- Huang, G.; Liu, Z.; Van Der Maaten, L.; Weinberger, K.Q. Densely connected convolutional networks. In Proceedings of the IEEE Conference on Computer Vision and Pattern Recognition, Honolulu, HI, USA, 21–26 July 2017; pp. 4700–4708. [Google Scholar] [CrossRef] [Green Version]
- Szegedy, C.; Ioffe, S.; Vanhoucke, V.; Alemi, A.A. Inception-v4, inception-resnet and the impact of residual connections on learning. In Proceedings of the Thirty-First AAAI Conference on Artificial Intelligence, Mountain View, CA, USA, 23 August 2016. [Google Scholar]
- Moura, D.C.; López, M.A.G.; Cunha, P.; de Posada, N.G.; Pollan, R.R.; Ramos, I.; Fernandes, T.C. Benchmarking datasets for breast cancer computer-aided diagnosis (CADx). In Progress in Pattern Recognition, Image Analysis, Computer Vision, and Applications, Proceedings of the Iberoamerican Congress on Pattern Recognition, Havana, Cuba, 20–13 November 2013; Springer: Berlin/Heidelberg, Germany, 2013; pp. 326–333. [Google Scholar] [CrossRef] [Green Version]
- Suckling, J.P. The mammographic image analysis society digital mammogram database. Digit. Mammo 1994, 1, 375–386. [Google Scholar]
- Moreira, I.C.; Amaral, I.; Domingues, I.; Cardoso, A.; Cardoso, M.J.; Cardoso, J.S. Inbreast: Toward a full-field digital mammographic database. Acad. Radiol. 2012, 19, 236–248. [Google Scholar] [CrossRef] [Green Version]
- Bowyer, K.; Kopans, D.; Kegelmeyer, W.P.; Moore, R.; Sallam, M.; Chang, K.; Woods, K. The digital database for screening mammography. In Proceedings of the Third International Workshop on Digital Mammography, Chicago, IL, USA, 9–12 June 1996; Volume 58, p. 27. [Google Scholar]
- Dong, W.M.; Wong, F.S. Fuzzy weighted averages and implementation of the extension principle. Fuzzy Sets Syst. 1987, 21, 183–199. [Google Scholar] [CrossRef]
- Sugeno, M. An introductory survey of fuzzy control. Inf. Sci. 1985, 36, 59–83. [Google Scholar] [CrossRef]
- Trappey, C.V.; Wu, H.Y. An evaluation of the time-varying extended logistic, simple logistic, and Gompertz models for forecasting short product lifecycles. Adv. Eng. Inform. 2008, 22, 421–430. [Google Scholar] [CrossRef]
- Tjørve, K.M.; Tjørve, E. The use of Gompertz models in growth analyses, and new Gompertz-model approach: An addition to the Unified-Richards family. PLoS ONE 2017, 12, e0178691. [Google Scholar] [CrossRef] [PubMed]


| Models | Class | Precision (%) | Recall (%) | Specificity (%) | F1-Score (%) | Accuracy (%) |
|---|---|---|---|---|---|---|
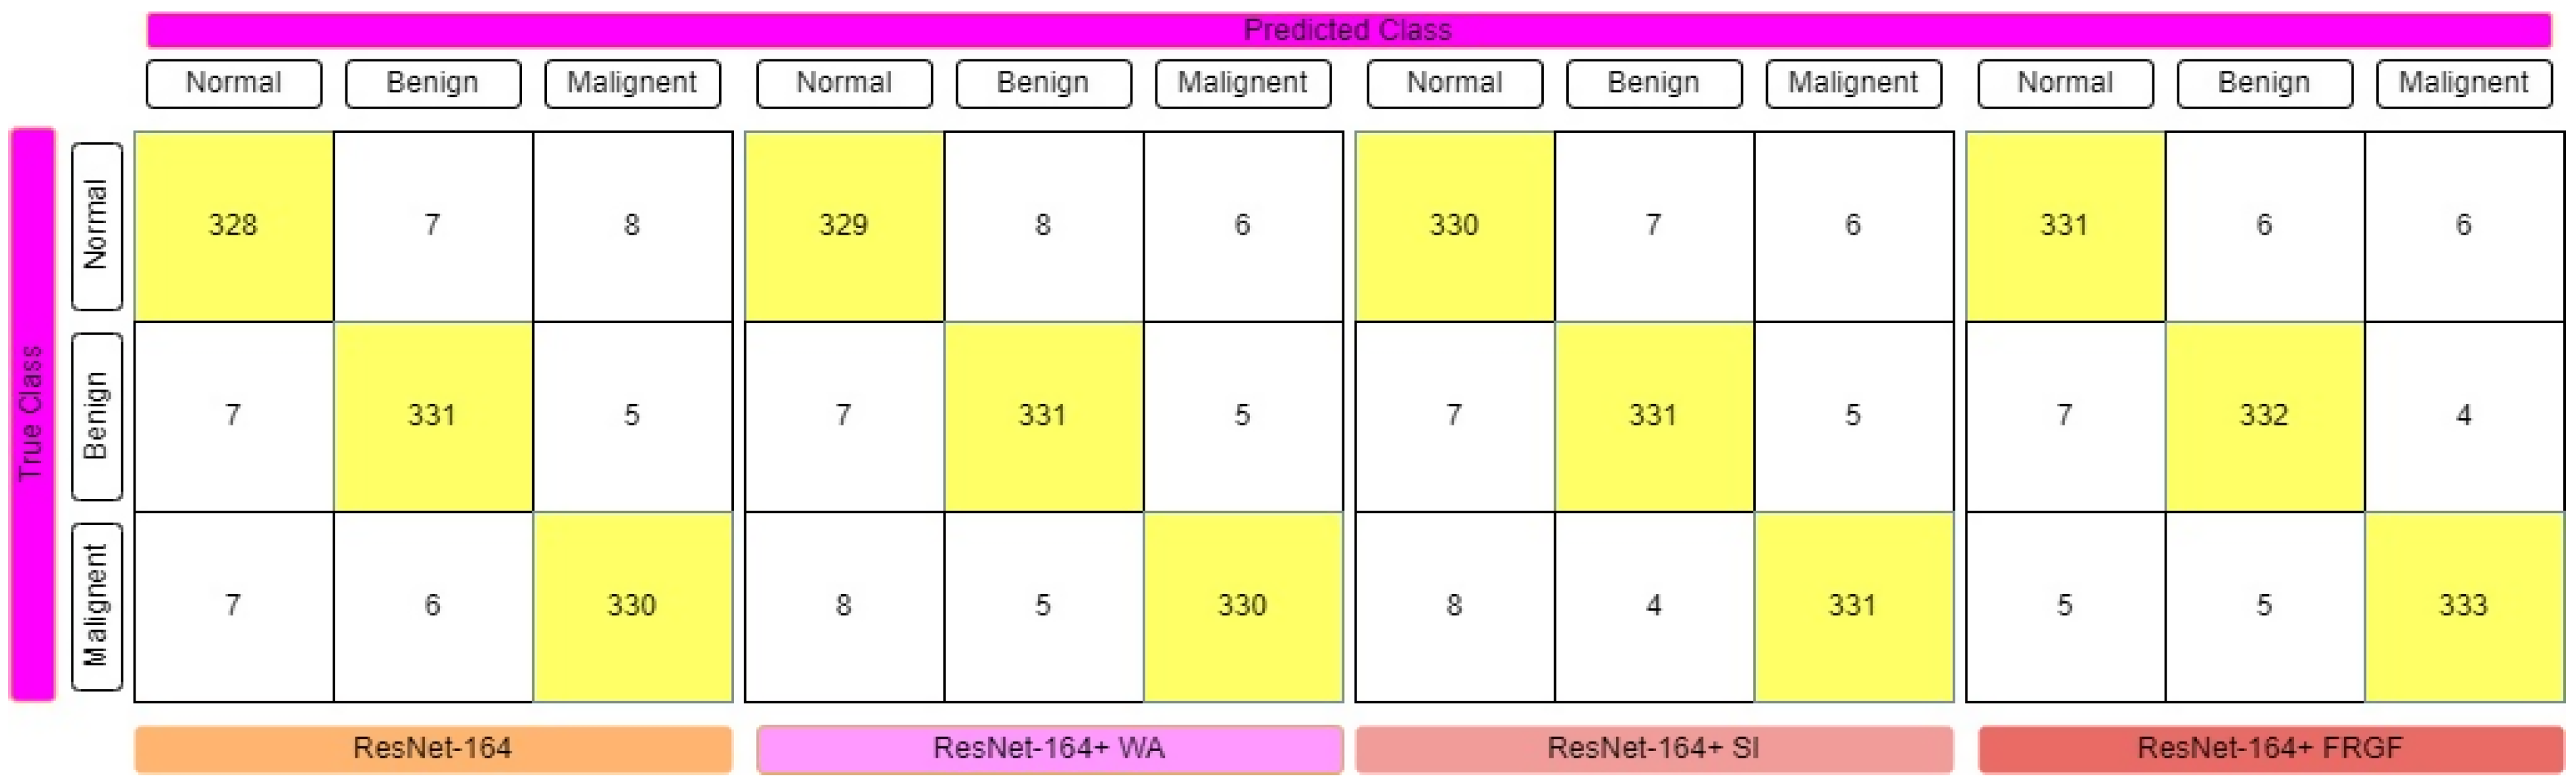
| ResNet-164 | Normal | 0.959 | 0.956 | 0.980 | 0.958 | 96.11 |
| Benign | 0.962 | 0.965 | 0.981 | 0.964 | ||
| Malignant | 0.962 | 0.962 | 0.981 | 0.962 | ||
| ResNet-164+ Weighted Average | Normal | 0.956 | 0.959 | 0.978 | 0.958 | 96.21 |
| Benign | 0.962 | 0.965 | 0.981 | 0.964 | ||
| Malignant | 0.968 | 0.962 | 0.984 | 0.965 | ||
| ResNet-164+ Sugeno Integral | Normal | 0.957 | 0.962 | 0.978 | 0.959 | 96.40 |
| Benign | 0.968 | 0.965 | 0.984 | 0.966 | ||
| Malignant | 0.968 | 0.965 | 0.984 | 0.966 | ||
| ResNet-164+ Fuzzy rank based Gompertz function | Normal | 0.965 | 0.965 | 0.983 | 0.965 | 96.79 |
| Benign | 0.968 | 0.968 | 0.984 | 0.968 | ||
| Malignant | 0.971 | 0.971 | 0.985 | 0.971 | ||
| VGG-11 | Normal | 0.956 | 0.959 | 0.978 | 0.958 | 96.21 |
| Benign | 0.962 | 0.968 | 0.981 | 0.965 | ||
| Malignant | 0.968 | 0.959 | 0.984 | 0.963 | ||
| VGG-11+ Weighted Average | Normal | 0.968 | 0.968 | 0.984 | 0.968 | 96.70 |
| Benign | 0.960 | 0.974 | 0.980 | 0.967 | ||
| Malignant | 0.973 | 0.959 | 0.987 | 0.966 | ||
| VGG-11+ Sugeno Integral | Normal | 0.974 | 0.968 | 0.987 | 0.971 | 97.08 |
| Benign | 0.971 | 0.965 | 0.985 | 0.968 | ||
| Malignant | 0.968 | 0.980 | 0.984 | 0.974 | ||
| VGG-11+ Fuzzy rank based Gompertz function | Normal | 0.977 | 0.980 | 0.988 | 0.978 | 97.67 |
| Benign | 0.977 | 0.977 | 0.988 | 0.977 | ||
| Malignant | 0.977 | 0.974 | 0.988 | 0.975 | ||
| DenseNet121 | Normal | 0.962 | 0.962 | 0.981 | 0.962 | 96.31 |
| Benign | 0.965 | 0.968 | 0.983 | 0.967 | ||
| Malignant | 0.962 | 0.959 | 0.981 | 0.961 | ||
| DenseNet121+ Weighted Average | Normal | 0.971 | 0.971 | 0.985 | 0.971 | 96.99 |
| Benign | 0.971 | 0.965 | 0.985 | 0.968 | ||
| Malignant | 0.968 | 0.974 | 0.984 | 0.971 | ||
| DenseNet121+ Sugeno Integral | Normal | 0.982 | 0.974 | 0.991 | 0.978 | 97.47 |
| Benign | 0.974 | 0.974 | 0.987 | 0.974 | ||
| Malignant | 0.968 | 0.977 | 0.984 | 0.972 | ||
| DenseNet121+ Fuzzy rank based Gompertz function | Normal | 0.988 | 0.983 | 0.994 | 0.985 | 98.35 |
| Benign | 0.985 | 0.980 | 0.993 | 0.982 | ||
| Malignant | 0.977 | 0.988 | 0.988 | 0.983 | ||
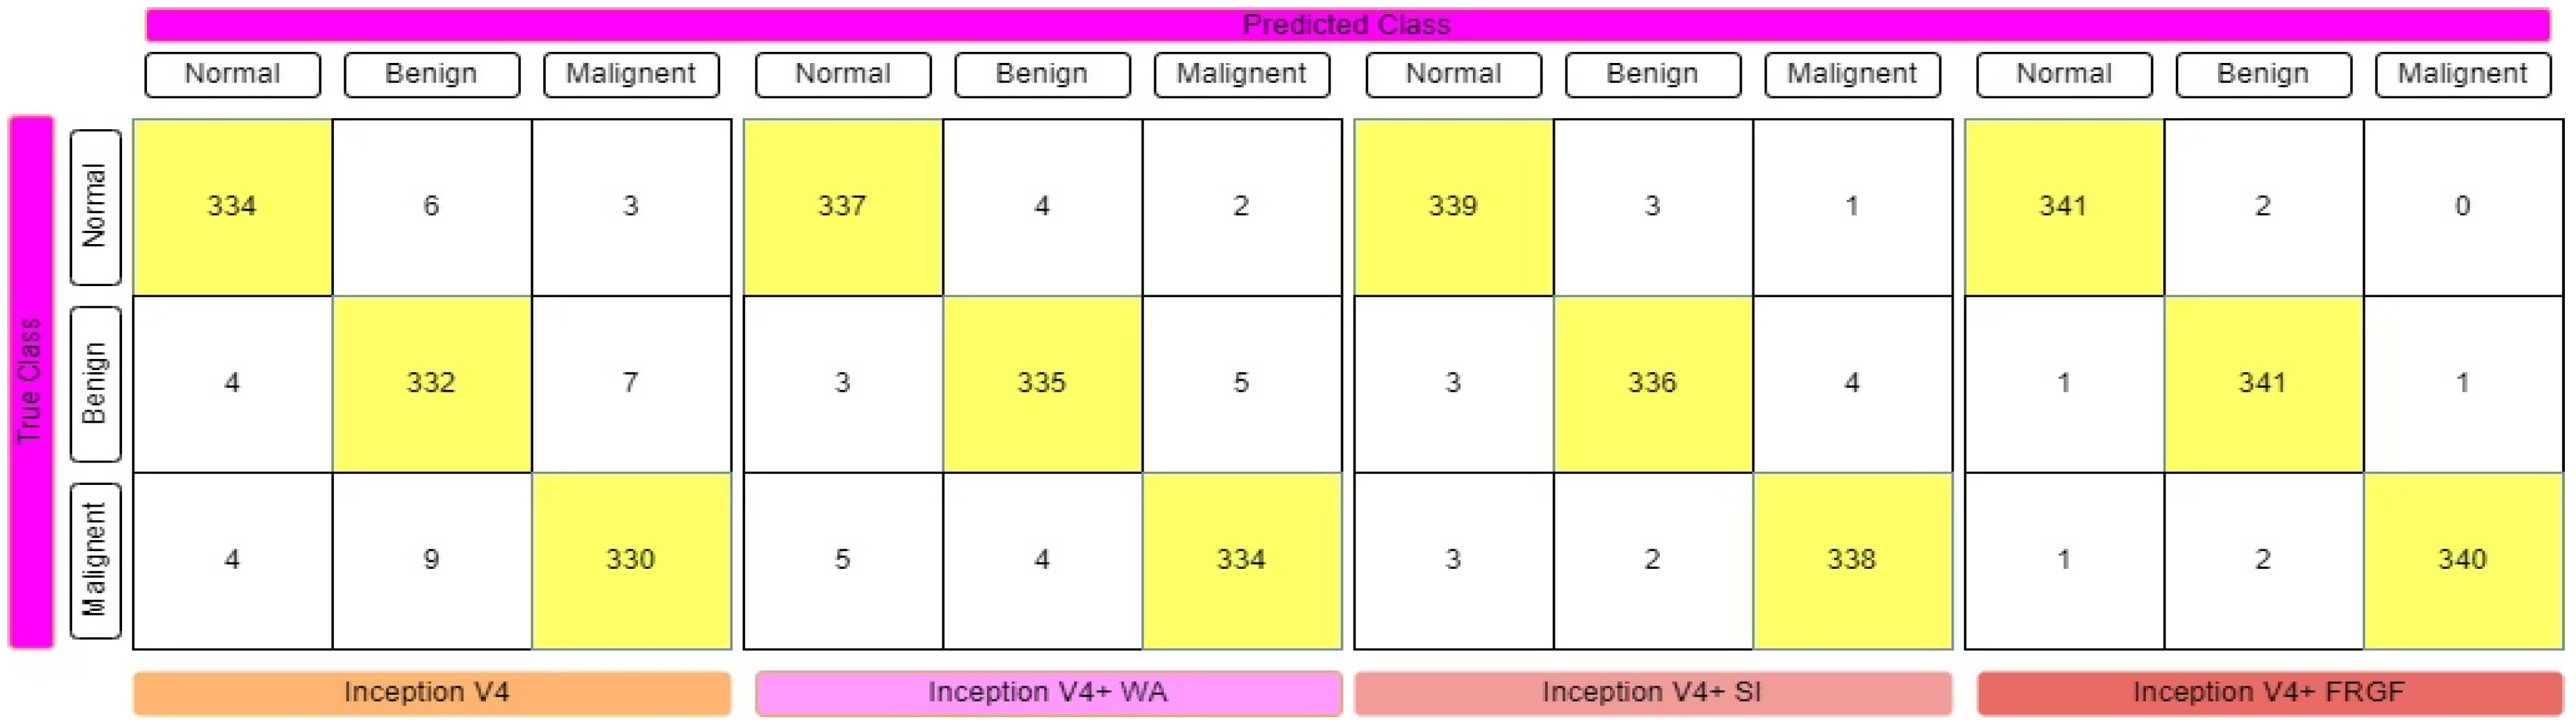
| Inception V4 | Normal | 0.977 | 0.974 | 0.988 | 0.975 | 96.79 |
| Benign | 0.957 | 0.968 | 0.978 | 0.962 | ||
| Malignant | 0.971 | 0.962 | 0.985 | 0.966 | ||
| Inception V4+ Weighted Average | Normal | 0.977 | 0.983 | 0.988 | 0.980 | 97.76 |
| Benign | 0.977 | 0.977 | 0.988 | 0.977 | ||
| Malignant | 0.979 | 0.974 | 0.990 | 0.977 | ||
| Inception V4+ Sugeno Integral | Normal | 0.983 | 0.988 | 0.991 | 0.985 | 98.45 |
| Benign | 0.985 | 0.980 | 0.993 | 0.982 | ||
| Malignant | 0.985 | 0.985 | 0.993 | 0.985 | ||
| Inception V4+ Fuzzy rank based Gompertz function | Normal | 0.994 | 0.994 | 0.997 | 0.994 | 99.32 |
| Benign | 0.988 | 0.994 | 0.994 | 0.991 | ||
| Malignant | 0.997 | 0.991 | 0.999 | 0.994 |
| Authors | Technology | Accuracy (%) |
|---|---|---|
| Naji et al. [8] | DT, NB, Simple Logistic with RF, and majority-voting-based ensembles | 98.1 |
| Faisal et al. [10] | GBT with Majority voting and RF-based ensembles | 90 |
| Wei et al. [12] | BiCNN model | 97.97 |
| Khuriwal et al. [13] | Voting algorithm ensemble with logistic regression and ANN | 98 |
| Bhowal et al. [15] | Choquet-Integral-based deep CNN models using Coalition Game and Information Theory | 95 |
| Rajaraman et al. [20] | Stacked ensemble | 98.07 |
| Lakhani et al. [21] | Weighted Average | 99.14 |
| Proposed Model | Inception V4 with Fuzzy-rank-based Gompertz function ensemble | 99.32 |
Publisher’s Note: MDPI stays neutral with regard to jurisdictional claims in published maps and institutional affiliations. |
© 2022 by the authors. Licensee MDPI, Basel, Switzerland. This article is an open access article distributed under the terms and conditions of the Creative Commons Attribution (CC BY) license (https://creativecommons.org/licenses/by/4.0/).
Share and Cite
Altameem, A.; Mahanty, C.; Poonia, R.C.; Saudagar, A.K.J.; Kumar, R. Breast Cancer Detection in Mammography Images Using Deep Convolutional Neural Networks and Fuzzy Ensemble Modeling Techniques. Diagnostics 2022, 12, 1812. https://doi.org/10.3390/diagnostics12081812
Altameem A, Mahanty C, Poonia RC, Saudagar AKJ, Kumar R. Breast Cancer Detection in Mammography Images Using Deep Convolutional Neural Networks and Fuzzy Ensemble Modeling Techniques. Diagnostics. 2022; 12(8):1812. https://doi.org/10.3390/diagnostics12081812
Chicago/Turabian StyleAltameem, Ayman, Chandrakanta Mahanty, Ramesh Chandra Poonia, Abdul Khader Jilani Saudagar, and Raghvendra Kumar. 2022. "Breast Cancer Detection in Mammography Images Using Deep Convolutional Neural Networks and Fuzzy Ensemble Modeling Techniques" Diagnostics 12, no. 8: 1812. https://doi.org/10.3390/diagnostics12081812
APA StyleAltameem, A., Mahanty, C., Poonia, R. C., Saudagar, A. K. J., & Kumar, R. (2022). Breast Cancer Detection in Mammography Images Using Deep Convolutional Neural Networks and Fuzzy Ensemble Modeling Techniques. Diagnostics, 12(8), 1812. https://doi.org/10.3390/diagnostics12081812