
Transformers Improve Breast Cancer Diagnosis from Unregistered Multi-View Mammograms

 , , ,
, , ,  and
and
Abstract
:1. Introduction
2. Materials and Methods
2.1. Materials
2.2. Methods
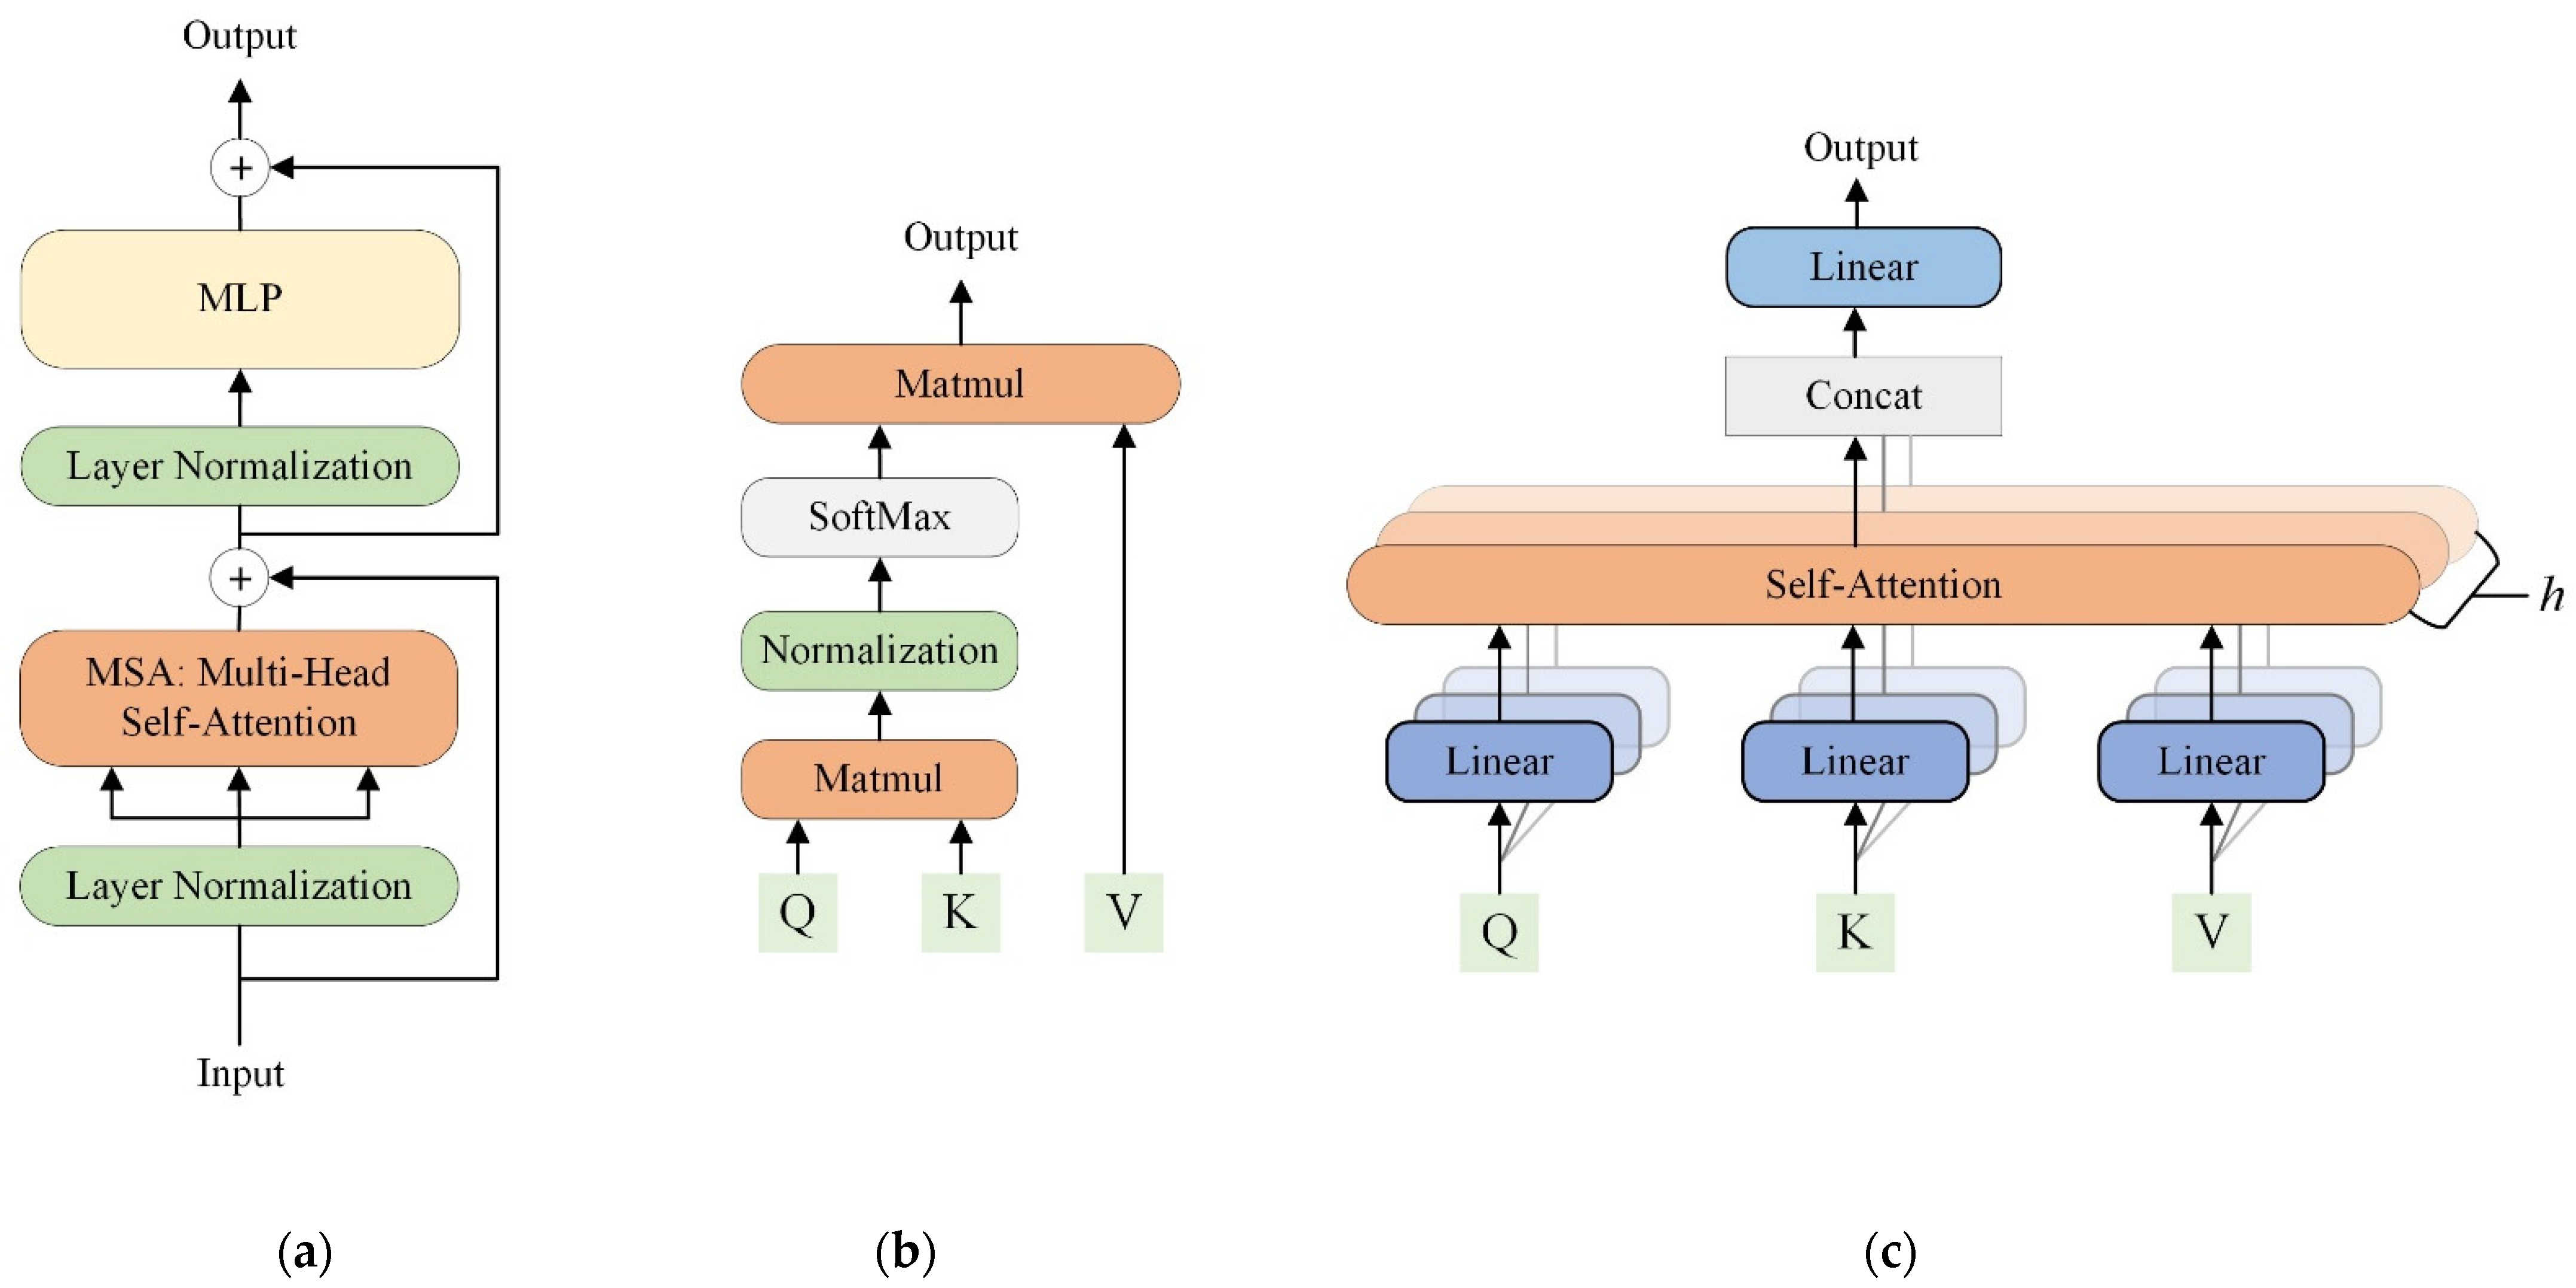
2.2.1. Transformers Background
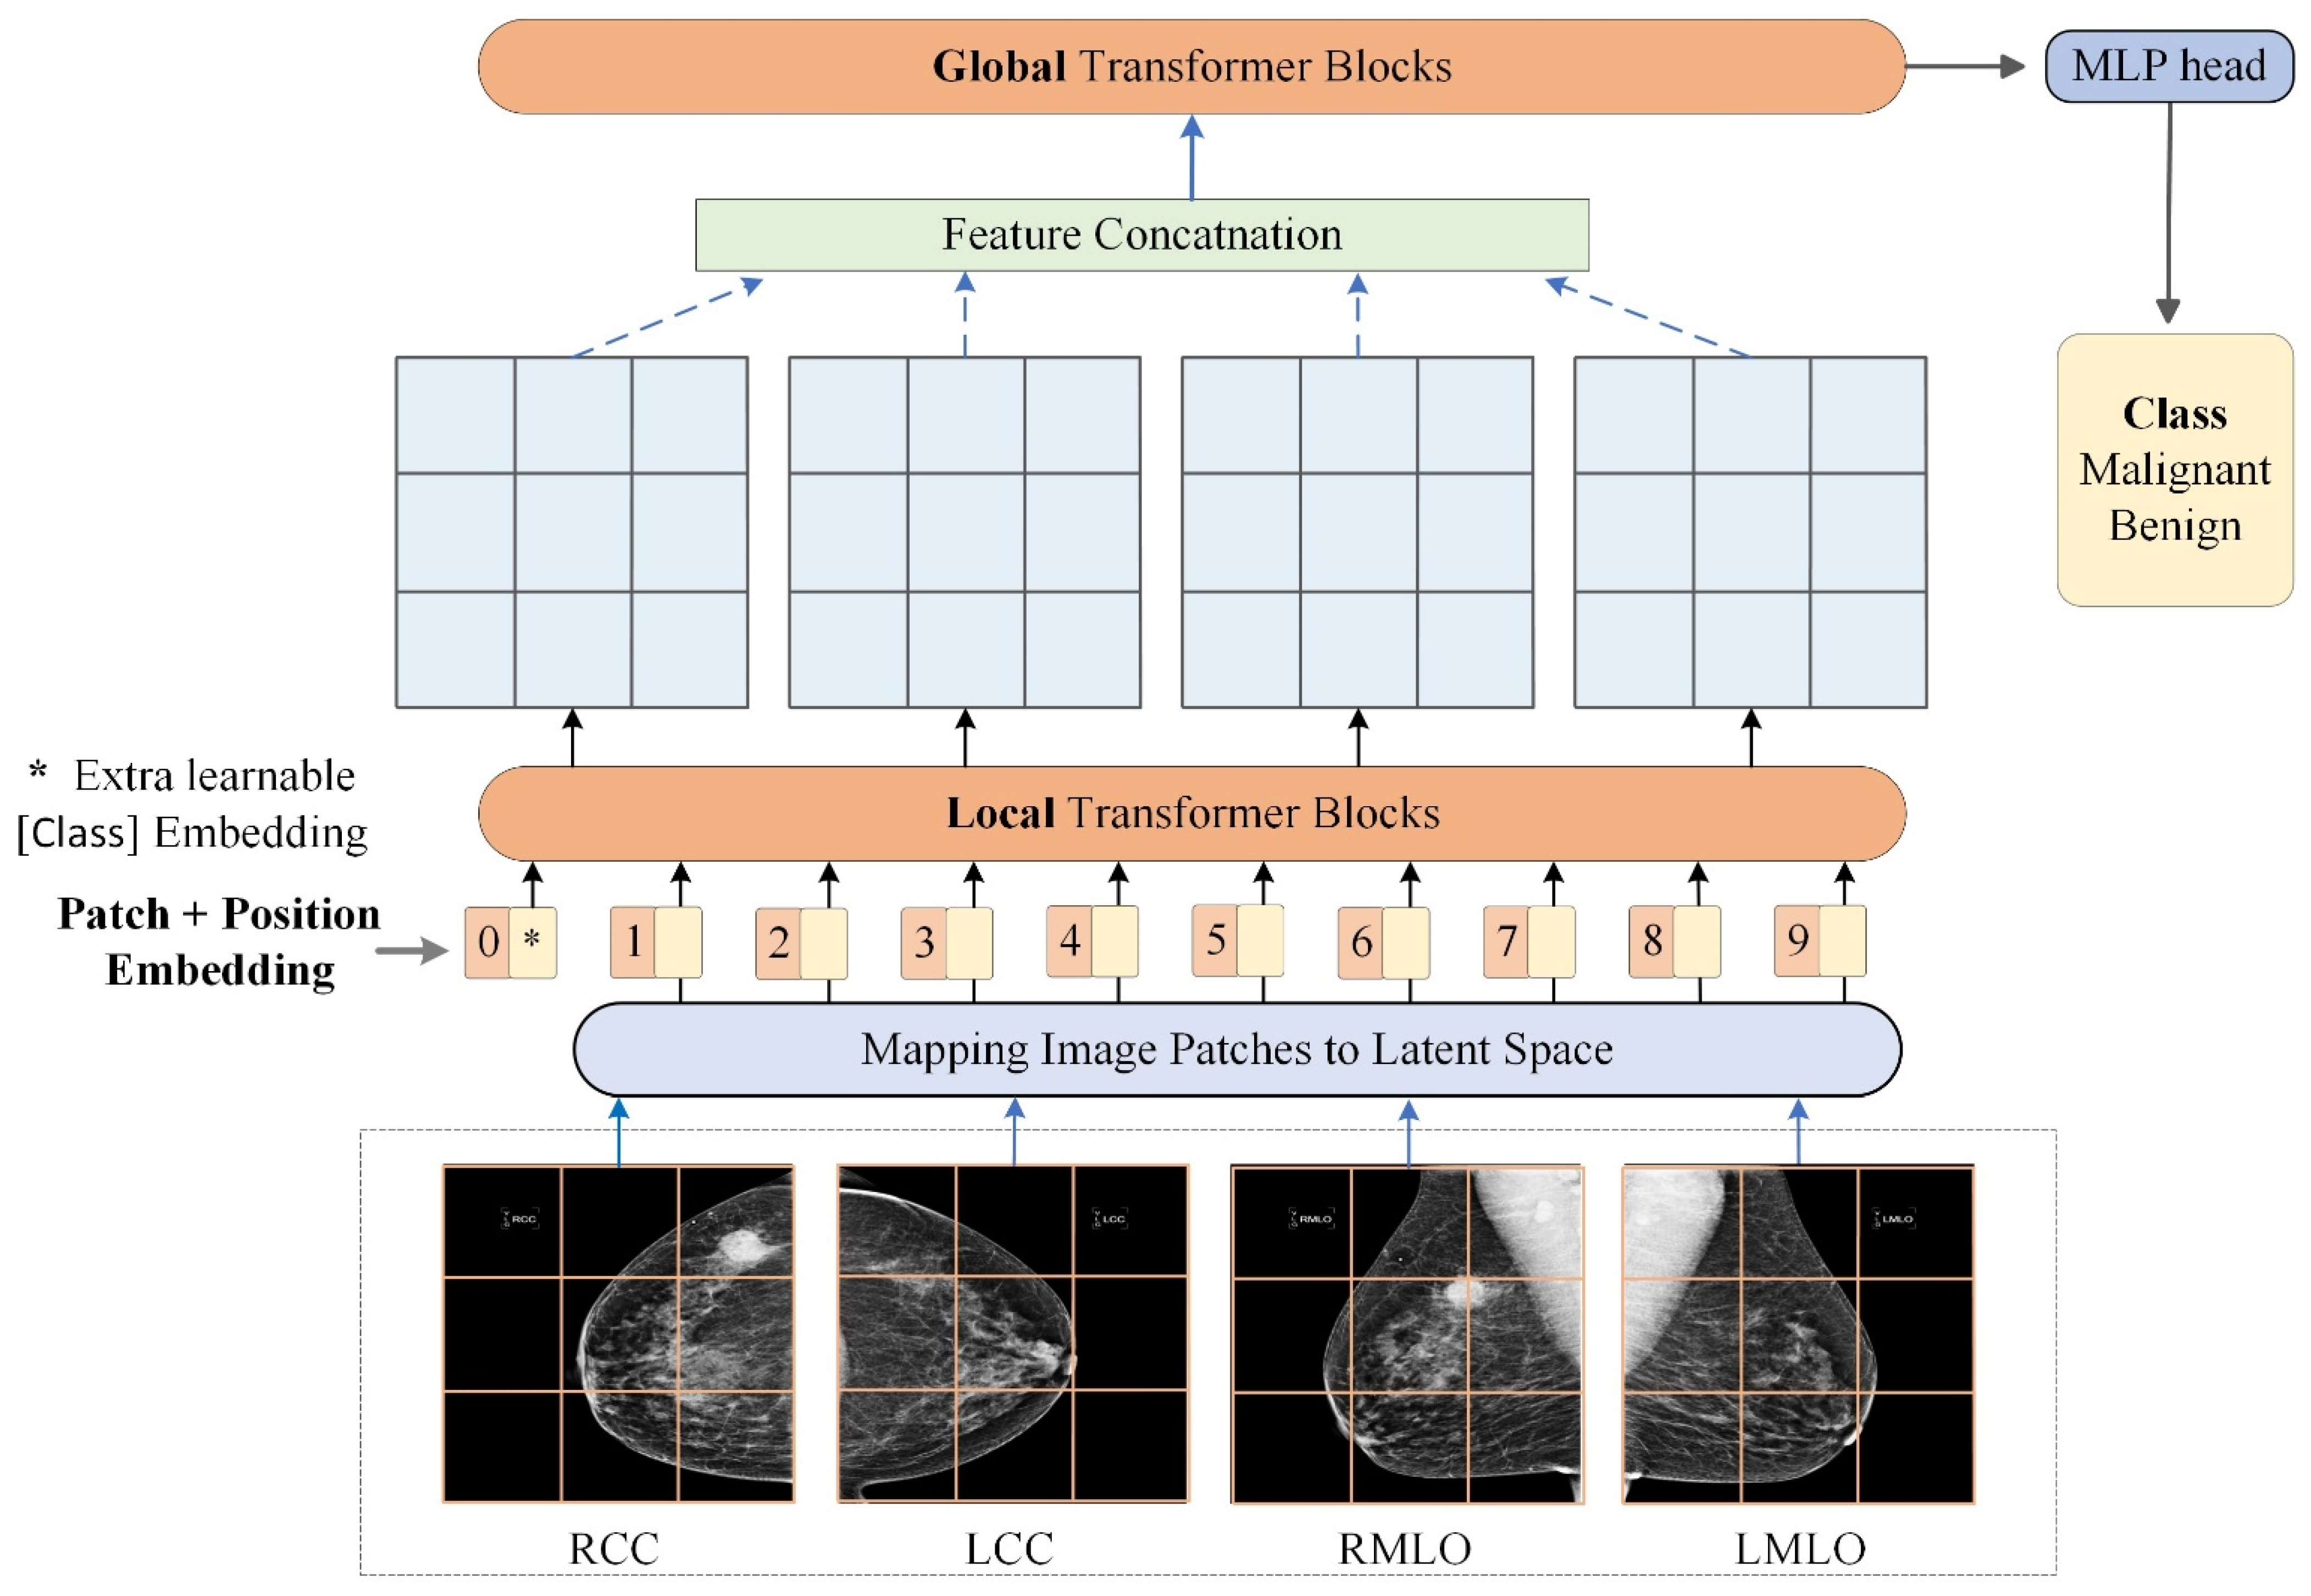
2.2.2. Transformers for Malignancy Identification from Multi-View Mammograms
2.2.3. Experiments
3. Results
4. Discussion
5. Conclusions
Author Contributions
Funding
Institutional Review Board Statement
Informed Consent Statement
Data Availability Statement
Conflicts of Interest
References
- Siegel, R.L.; Miller, K.D.; Fuchs, H.E.; Jemal, A. Cancer statistics. Cancer J. Clin. 2022, 72, 7–33. [Google Scholar] [CrossRef]
- Kelly, K.M.; Dean, J.; Comulada, W.S.; Lee, S.-J. Breast cancer detection using automated whole breast ultrasound and mammography in radiographically dense breasts. Eur. Radiol. 2010, 20, 734–742. [Google Scholar] [CrossRef] [Green Version]
- Nelson, H.D.; O’meara, E.S.; Kerlikowske, K.; Balch, S.; Miglioretti, D. Factors associated with rates of false-positive and false-negative results from digital mammography screening: An analysis of registry data. Ann. Intern. Med. 2016, 164, 226–235. [Google Scholar] [CrossRef]
- Ko, J.M.; Nicholas, M.J.; Mendel, J.B.; Slanetz, P.J. Prospective assessment of computer-aided detection in interpretation of screening mammography. Am. J. Roentgenol. 2006, 187, 1483–1491. [Google Scholar] [CrossRef]
- Doi, K. Computer-aided diagnosis in medical imaging: Historical review, current status and future potential. Comput. Med. Imaging Graph. 2007, 31, 198–211. [Google Scholar] [CrossRef] [Green Version]
- Gao, Y.; Geras, K.J.; Lewin, A.A.; Moy, L. New frontiers: An update on computer-aided diagnosis for breast imaging in the age of artificial intelligence. Am. J. Roentgenol. 2019, 212, 300–307. [Google Scholar] [CrossRef]
- Katzen, J.; Dodelzon, K. A review of computer aided detection in mammography. Clin. Imaging 2018, 52, 305–309. [Google Scholar] [CrossRef]
- Chen, X.; Zargari, A.; Hollingsworth, A.B.; Liu, H.; Zheng, B.; Qiu, Y. Applying a new quantitative image analysis scheme based on global mammographic features to assist diagnosis of breast cancer. Comput. Methods Programs Biomed. 2019, 179, 104995. [Google Scholar] [CrossRef]
- Zheng, B.; Mello-Thoms, C.; Wang, X.-H.; Abrams, G.S.; Sumkin, J.H.; Chough, D.M.; Ganott, M.A.; Lu, A.; Gur, D. Interactive computer-aided diagnosis of breast masses: Computerized selection of visually similar image sets from a reference library. Acad. Radiol. 2007, 14, 917–927. [Google Scholar] [CrossRef] [Green Version]
- Yala, A.; Lehman, C.; Schuster, T.; Portnoi, T.; Barzilay, R. A deep learning mammography-based model for improved breast cancer risk prediction. Radiology 2019, 292, 60–66. [Google Scholar] [CrossRef] [Green Version]
- Dhungel, N.; Carneiro, G.; Bradley, A.P. A deep learning approach for the analysis of masses in mammograms with minimal user intervention. Med. Image Anal. 2017, 37, 114–128. [Google Scholar] [CrossRef] [Green Version]
- Danala, G.; Maryada, S.K.; Islam, W.; Faiz, R.; Jones, M.; Qiu, Y.; Zheng, B. A comparison of computer-aided diagnosis schemes optimized using radiomics and deep transfer learning methods. Bioengineering 2022, 9, 256. [Google Scholar] [CrossRef]
- Sallam, M.Y.; Bowyer, K.W. Registration and difference analysis of corresponding mammogram images. Med. Image Anal. 1999, 3, 103–118. [Google Scholar] [CrossRef]
- Zheng, B.; Leader, J.K.; Abrams, G.S.; Lu, A.H.; Wallace, L.P.; Maitz, G.S.; Gur, D. Multiview-based computer-aided detection scheme for breast masses. Med. Phys. 2006, 33, 3135–3143. [Google Scholar] [CrossRef]
- Dhungel, N.; Carneiro, G.; Bradley, A.P. The automated learning of deep features for breast mass classification from mammograms. In Proceedings of the International Conference on Medical Image Computing and Computer-Assisted Intervention, Athens, Greece, 17–21 October 2016; Springer: Berlin/Heidelberg, Germany, 2016. [Google Scholar]
- Carneiro, G.; Nascimento, J.; Bradley, A.P. Automated analysis of unregistered multi-view mammograms with deep learning. IEEE Trans. Med. Imaging 2017, 36, 2355–2365. [Google Scholar] [CrossRef]
- Wu, N.; Phang, J.; Park, J.; Shen, Y.; Huang, Z.; Zorin, M.; Jastrzębski, S.; Févry, T.; Katsnelson, J.; Kim, E. Deep neural networks improve radiologists’ performance in breast cancer screening. IEEE Trans. Med. Imaging 2019, 39, 1184–1194. [Google Scholar] [CrossRef] [Green Version]
- Dosovitskiy, A.; Beyer, L.; Kolesnikov, A.; Weissenborn, D.; Zhai, X.; Unterthiner, T.; Dehghani, M.; Minderer, M.; Heigold, G.; Gelly, S. An image is worth 16x16 words: Transformers for image recognition at scale. arXiv 2020, arXiv:2010.11929. [Google Scholar]
- Dai, Y.; Gao, Y.; Liu, F. Transmed: Transformers advance multi-modal medical image classification. Diagnostics 2021, 11, 1384. [Google Scholar] [CrossRef]
- Matsoukas, C.; Haslum, J.F.; Söderberg, M.; Smith, K. Is it time to replace cnns with transformers for medical images? arXiv 2021, arXiv:2108.09038. [Google Scholar]
- Chen, J.; Lu, Y.; Yu, Q.; Luo, X.; Adeli, E.; Wang, Y.; Lu, L.; Yuille, A.L.; Zhou, Y. Transunet: Transformers make strong encoders for medical image segmentation. arXiv 2021, arXiv:2102.04306. [Google Scholar]
- Zhang, Y.; Liu, H.; Hu, Q. Transfuse: Fusing transformers and cnns for medical image segmentation. In Proceedings of the International Conference on Medical Image Computing and Computer-Assisted Intervention, Strasbourg, France, 27 September–1 October 2021; Springer: Berlin/Heidelberg, Germany, 2021. [Google Scholar]
- Vaswani, A.; Shazeer, N.; Parmar, N.; Uszkoreit, J.; Jones, L.; Gomez, A.N.; Kaiser, Ł.; Polosukhin, I. Attention is all you need. In Proceedings of the 31st International Conference on Neural Information Processing Systems, Long Beach, CA, USA, 4–9 December 2017; Curran Associates Inc.: Long Beach, CA, USA, 2017; pp. 6000–6010. [Google Scholar]
- Chen, X.; Wang, X.; Zhang, K.; Fung, K.-M.; Thai, T.C.; Moore, K.; Mannel, R.S.; Liu, H.; Zheng, B.; Qiu, Y. Recent advances and clinical applications of deep learning in medical image analysis. Med. Image Anal. 2022, 79, 102444. [Google Scholar] [CrossRef]
- Tan, M.; Zheng, B.; Leader, J.K.; Gur, D. Association between changes in mammographic image features and risk for near-term breast cancer development. IEEE Trans. Med. Imaging 2016, 35, 1719–1728. [Google Scholar] [CrossRef] [Green Version]
- Zheng, B.; Tan, M.; Ramalingam, P.; Gur, D. Association between computed tissue density asymmetry in bilateral mammograms and near-term breast cancer risk. Breast J. 2014, 20, 249–257. [Google Scholar] [CrossRef] [Green Version]
- Zheng, B.; Sumkin, J.H.; Zuley, M.L.; Wang, X.; Klym, A.H.; Gur, D. Bilateral mammographic density asymmetry and breast cancer risk: A preliminary assessment. Eur. J. Radiol. 2012, 81, 3222–3228. [Google Scholar] [CrossRef] [Green Version]
- Heidari, M.; Mirniaharikandehei, S.; Liu, W.; Hollingsworth, A.B.; Liu, H.; Zheng, B. Development and assessment of a new global mammographic image feature analysis scheme to predict likelihood of malignant cases. IEEE Trans. Med. Imaging 2019, 39, 1235–1244. [Google Scholar] [CrossRef]
- Tulder, G.V.; Tong, Y.; Marchiori, E. Multi-view analysis of unregistered medical images using cross-view transformers. In Proceedings of the International Conference on Medical Image Computing and Computer-Assisted Intervention, Strasbourg, France, 27 September–1 October 2021; Springer: Berlin/Heidelberg, Germany, 2021. [Google Scholar]
- Zheng, B.; Sumkin, J.H.; Zuley, M.L.; Lederman, D.; Wang, X.; Gur, D. Computer-aided detection of breast masses depicted on full-field digital mammograms: A performance assessment. Br. J. Radiol. 2012, 85, e153–e161. [Google Scholar] [CrossRef]
- Chen, S.; Yu, T.; Li, P. Mvt: Multi-view vision transformer for 3d object recognition. arXiv 2021, arXiv:2110.13083. [Google Scholar]
- Hendrycks, D.; Gimpel, K. Gaussian error linear units (gelus). arXiv 2016, arXiv:1606.08415. [Google Scholar]
- He, K.; Zhang, X.; Ren, S.; Sun, J. Deep Residual Learning for Image Recognition. In Proceedings of the 2016 IEEE Conference on Computer Vision and Pattern Recognition (CVPR), Las Vegas, NV, USA, 27–30 June 2016. [Google Scholar]
- Ba, J.L.; Kiros, J.R.; Hinton, G.E. Layer normalization. arXiv 2016, arXiv:1607.06450. [Google Scholar]
- Touvron, H.; Cord, M.; Douze, M.; Massa, F.; Sablayrolles, A.; Jégou, H. Training data-efficient image transformers & distillation through attention. In Proceedings of the International Conference on Machine Learning, PMLR, Online, 18–24 July 2021. [Google Scholar]
- Jones, M.A.; Faiz, R.; Qiu, Y.; Zheng, B. Improving mammography lesion classification by optimal fusion of handcrafted and deep transfer learning features. Phys. Med. Biol. 2022, 67, 054001. [Google Scholar] [CrossRef]


| Local blocks | 0 | 2 | 4 | 8 | 12 |
| Global blocks | 12 | 10 | 8 | 4 | 0 |
| Fold 1 | 79.5 | 78.9 | 78.9 | 73.7 | 73.2 |
| Fold 2 | 74.7 | 77.4 | 77.4 | 73.7 | 74.7 |
| Fold 3 | 74.7 | 76.3 | 76.3 | 72.6 | 68.4 |
| Fold 4 | 74.7 | 75.8 | 75.3 | 74.2 | 71.1 |
| Fold 5 | 73.5 | 76.7 | 73.5 | 73.2 | 74.6 |
| Mean ACC (%) ± STD | 75.4 ± 2.3 | 77.0 ± 1.2 | 76.3 ± 2.0 | 73.5 ± 0.6 | 72.4 ± 2.7 |
| Model | Params | CC | MLO | Accuracy (%) | Precision | Recall | Specificity | F1 Score | AUC | p-Value |
|---|---|---|---|---|---|---|---|---|---|---|
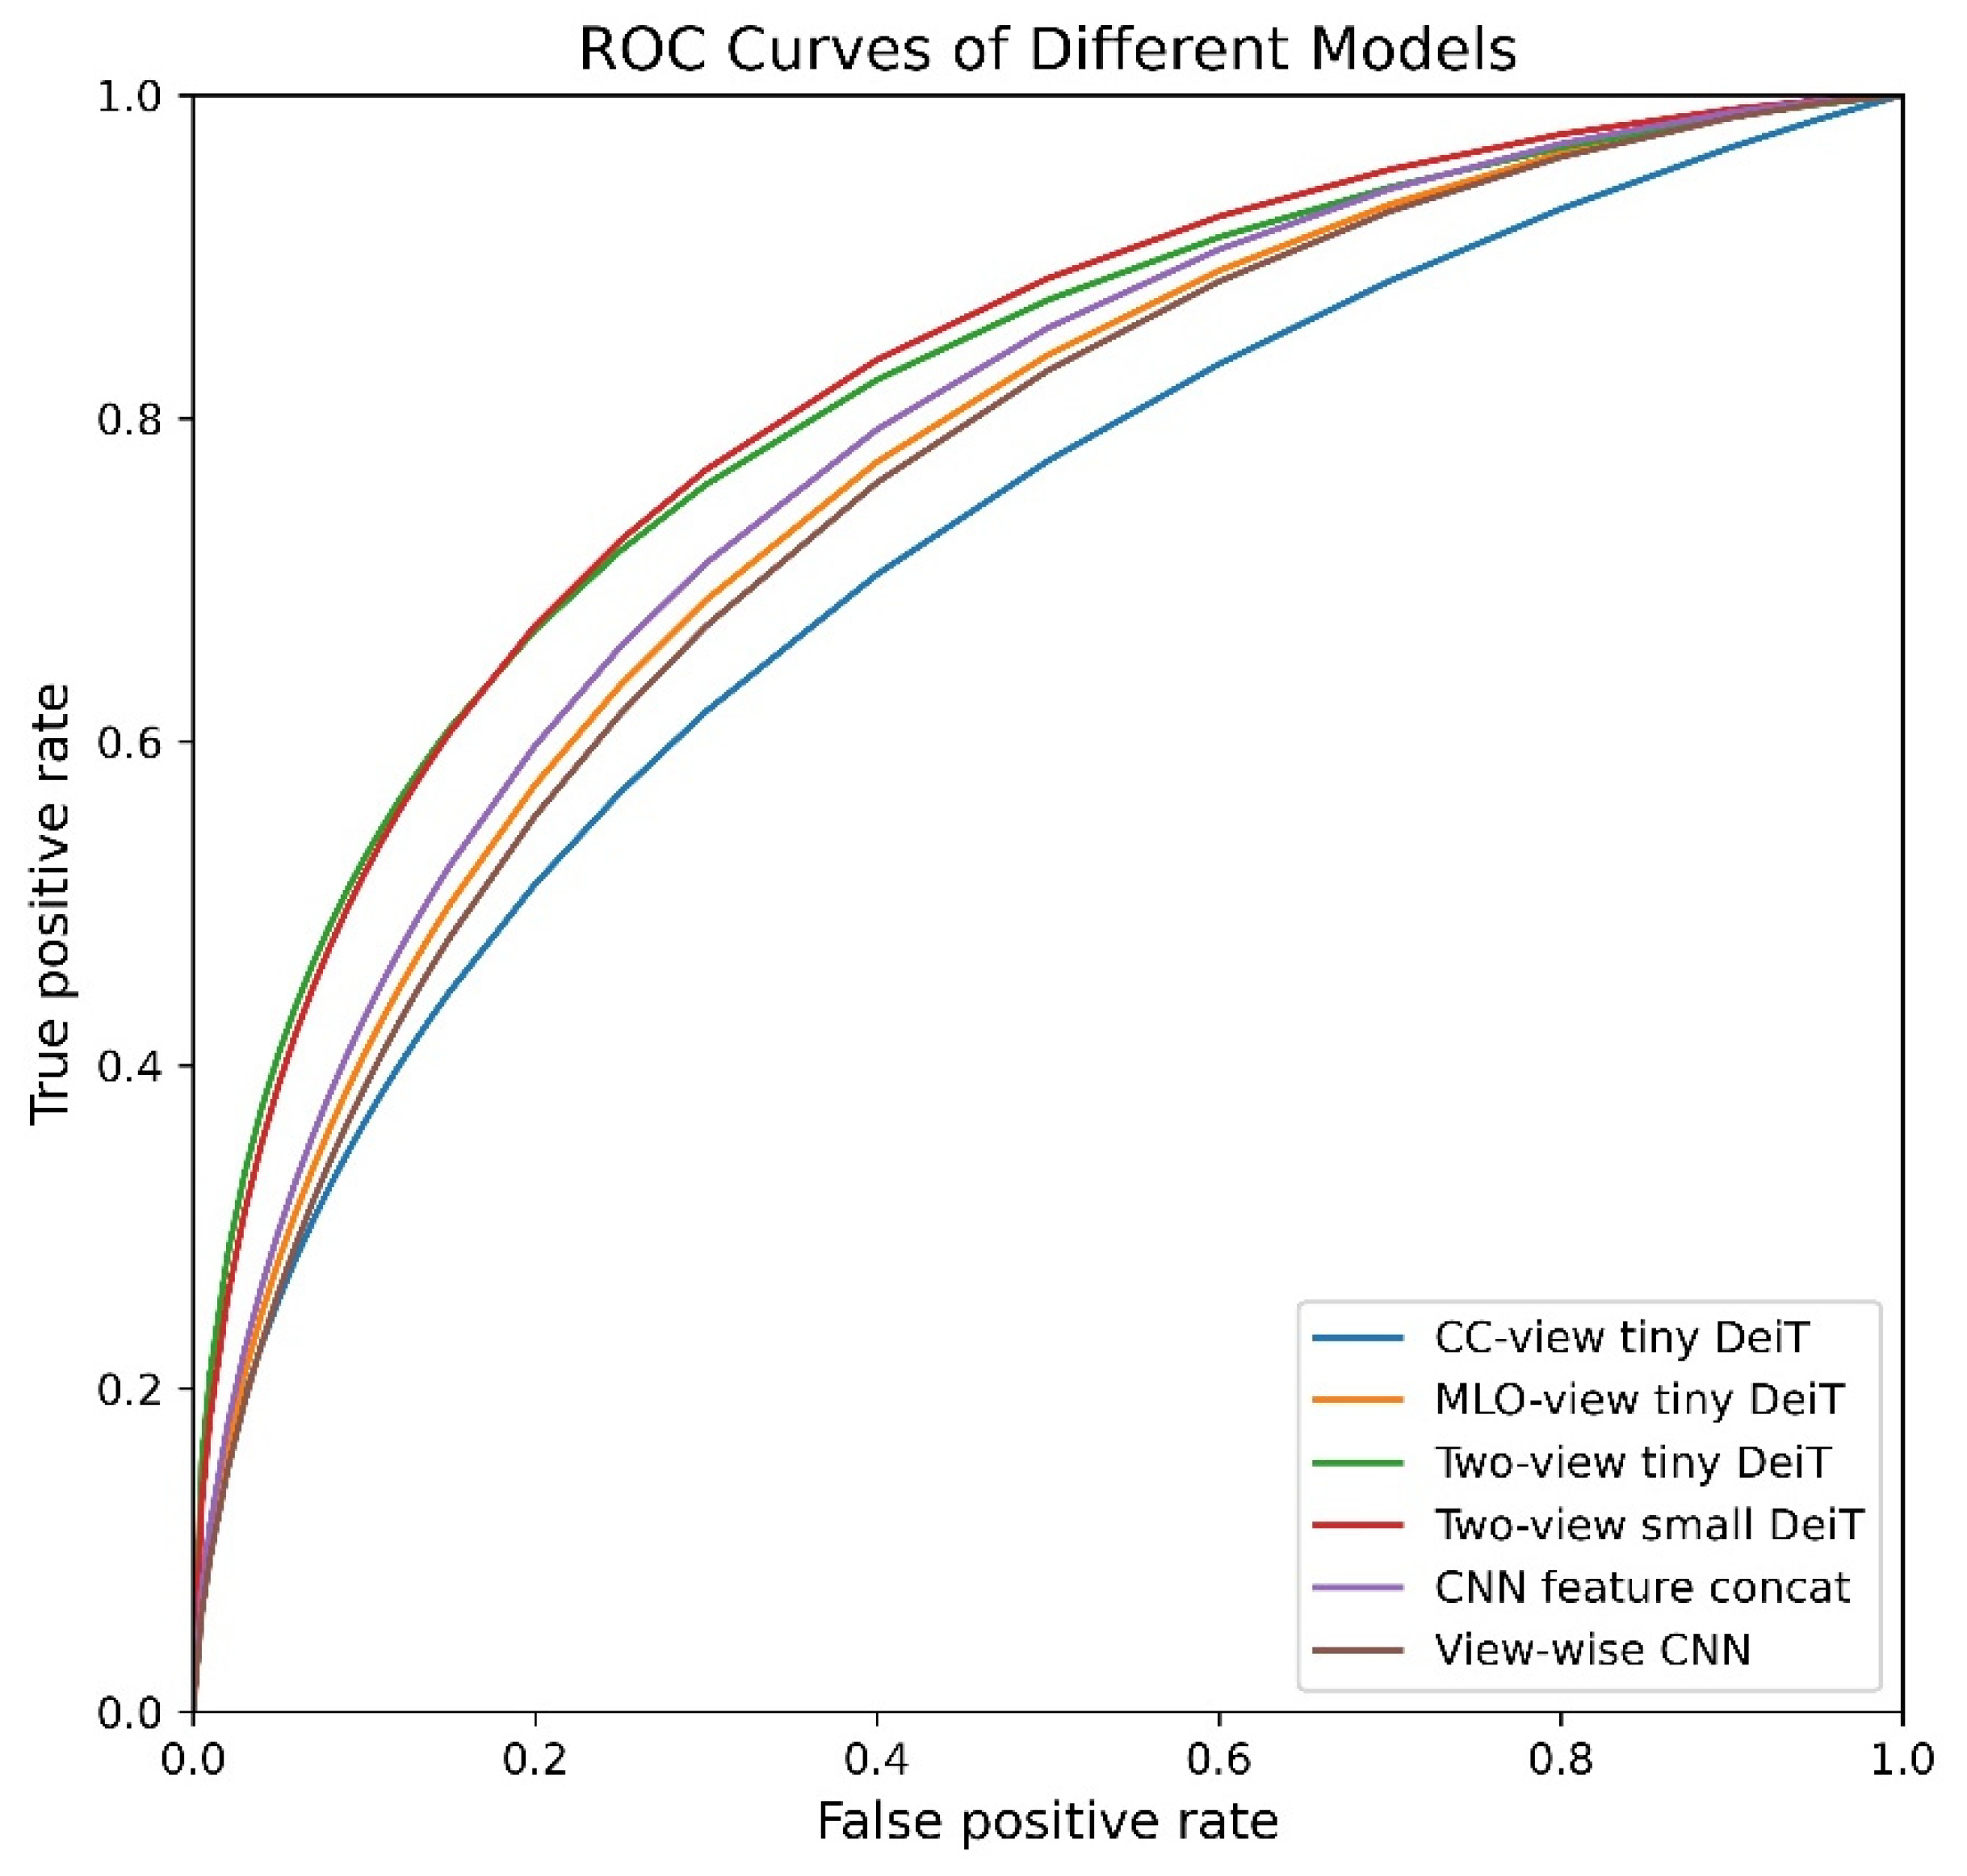
| Single-view DeiT-tiny | 5.5 M | ✓ | 69.6 ± 1.4 | 0.708 ± 0.035 | 0.662 ± 0.040 | 0.728 ± 0.058 | 0.683 ± 0.013 | 0.724 ± 0.013 | <0.001 | |
| Single-view DeiT-tiny | 5.5 M | ✓ | 72.5 ± 2.8 | 0.728 ± 0.037 | 0.713 ± 0.027 | 0.737 ± 0.045 | 0.720 ± 0.028 | 0.769 ± 0.036 | 0.376 | |
| Two-view DeiT-tiny (proposed) | 5.5 M | ✓ | ✓ | 77.0 ± 1.2 | 0.797 ± 0.039 | 0.726 ± 0.063 | 0.814 ± 0.057 | 0.757 ± 0.022 | 0.814 ± 0.026 | 0.031 |
| Two-view DeiT-small (proposed) | 21.7 M | ✓ | ✓ | 76.3 ± 2.8 | 0.799 ± 0.071 | 0.706 ± 0.033 | 0.818 ± 0.081 | 0.747 ± 0.018 | 0.818 ± 0.039 | 0.009 |
| CNN feature concatenation [16] | 44.7 M | ✓ | ✓ | 73.9 ± 2.4 | 0.761 ± 0.05 | 0.696 ± 0.041 | 0.781 ± 0.071 | 0.725 ± 0.019 | 0.784 ± 0.016 | - |
| View-wise CNN [17] | 22.4 M | ✓ | ✓ | 71.7 ± 2.1 | 0.735 ± 0.04 | 0.677 ± 0.051 | 0.756 ± 0.069 | 0.702 ± 0.021 | 0.759 ± 0.023 | N/A |
Publisher’s Note: MDPI stays neutral with regard to jurisdictional claims in published maps and institutional affiliations. |
© 2022 by the authors. Licensee MDPI, Basel, Switzerland. This article is an open access article distributed under the terms and conditions of the Creative Commons Attribution (CC BY) license (https://creativecommons.org/licenses/by/4.0/).
Share and Cite
Chen, X.; Zhang, K.; Abdoli, N.; Gilley, P.W.; Wang, X.; Liu, H.; Zheng, B.; Qiu, Y. Transformers Improve Breast Cancer Diagnosis from Unregistered Multi-View Mammograms. Diagnostics 2022, 12, 1549. https://doi.org/10.3390/diagnostics12071549
Chen X, Zhang K, Abdoli N, Gilley PW, Wang X, Liu H, Zheng B, Qiu Y. Transformers Improve Breast Cancer Diagnosis from Unregistered Multi-View Mammograms. Diagnostics. 2022; 12(7):1549. https://doi.org/10.3390/diagnostics12071549
Chicago/Turabian StyleChen, Xuxin, Ke Zhang, Neman Abdoli, Patrik W. Gilley, Ximin Wang, Hong Liu, Bin Zheng, and Yuchen Qiu. 2022. "Transformers Improve Breast Cancer Diagnosis from Unregistered Multi-View Mammograms" Diagnostics 12, no. 7: 1549. https://doi.org/10.3390/diagnostics12071549
APA StyleChen, X., Zhang, K., Abdoli, N., Gilley, P. W., Wang, X., Liu, H., Zheng, B., & Qiu, Y. (2022). Transformers Improve Breast Cancer Diagnosis from Unregistered Multi-View Mammograms. Diagnostics, 12(7), 1549. https://doi.org/10.3390/diagnostics12071549