
Combination Antiretroviral Therapy (cART) in Diabetes Exacerbates Diabetogenic Effects on Hippocampal Microstructure, Neurogenesis and Cytokine Perturbation in Male Sprague Dawley Rats


Abstract
:1. Introduction
2. Materials and Methods
2.1. Chemical and Reagents
2.2. Ethical Clearance
2.3. Animal Husbandry
2.4. Experimental Design
2.5. Enzyme Linked Immunoassay of Proinflammatory Cytokines and Malondialdehyde (MDA)
2.6. Brian Tissue Preparation for Histology
2.7. Histology and Histomorphometry
2.8. Immunohistochemistry for Neurogenesis
2.9. Statistical Analysis
3. Results
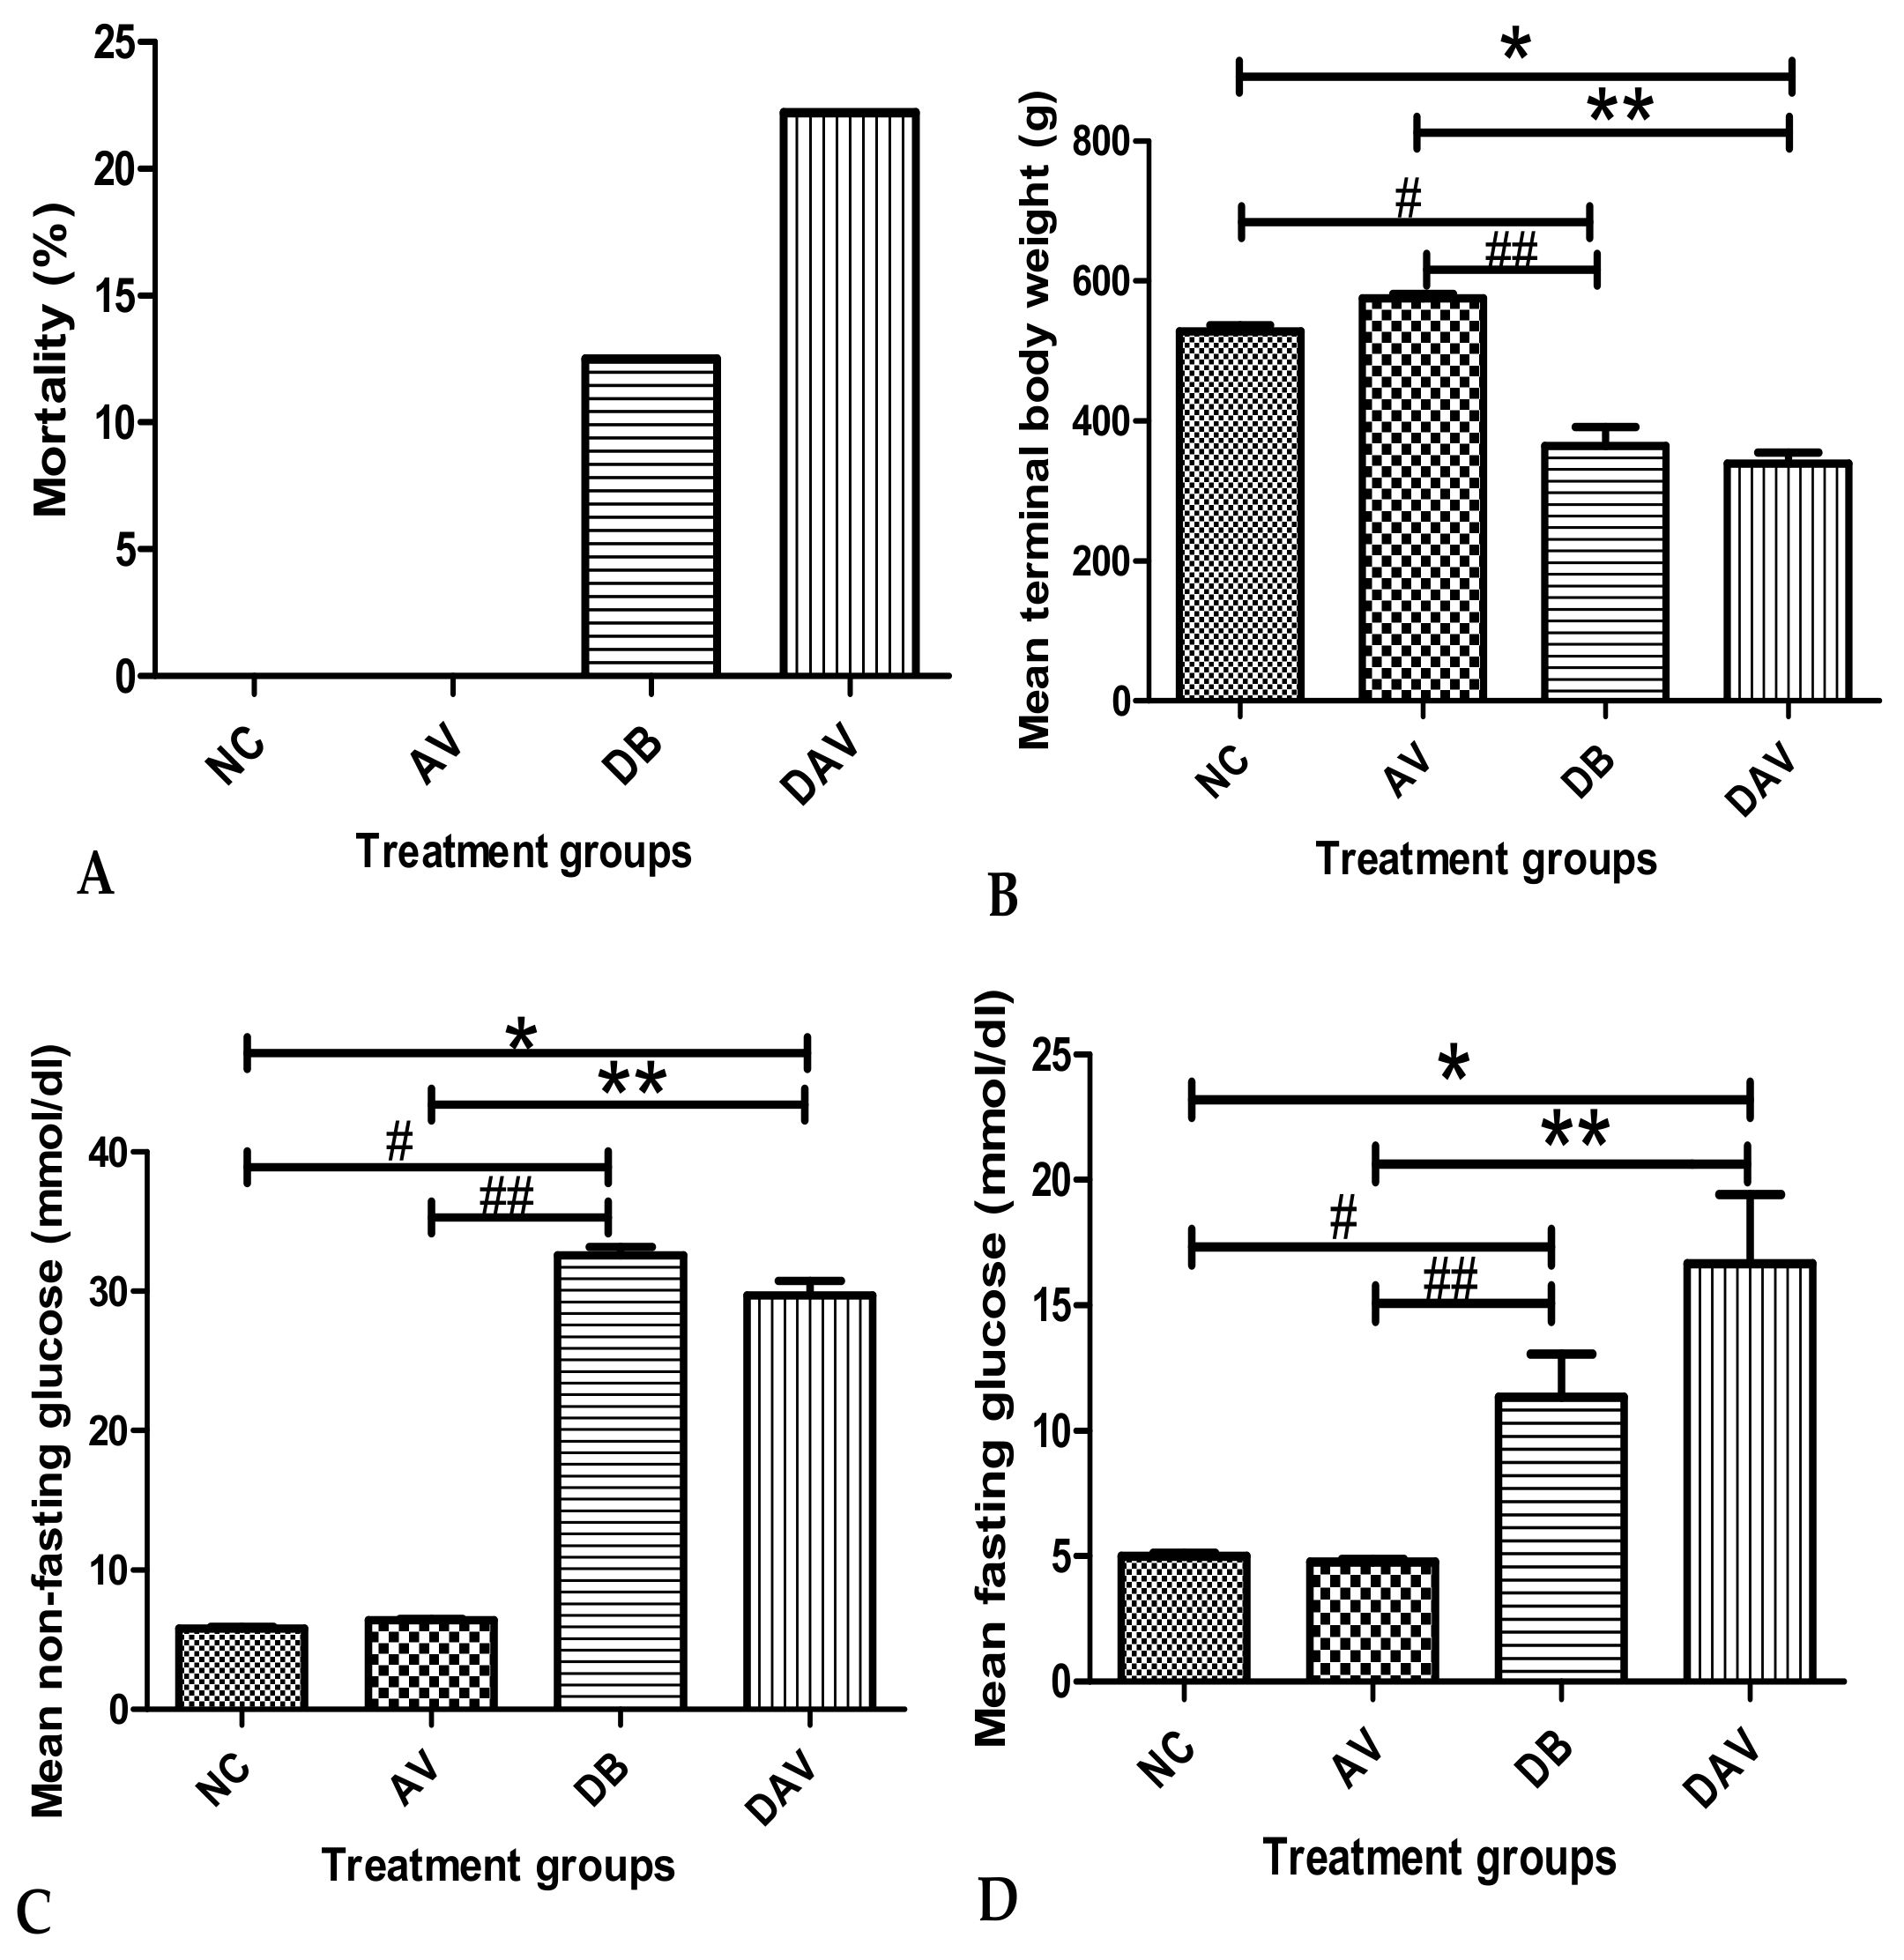
3.1. Mortality
3.2. Body Weight
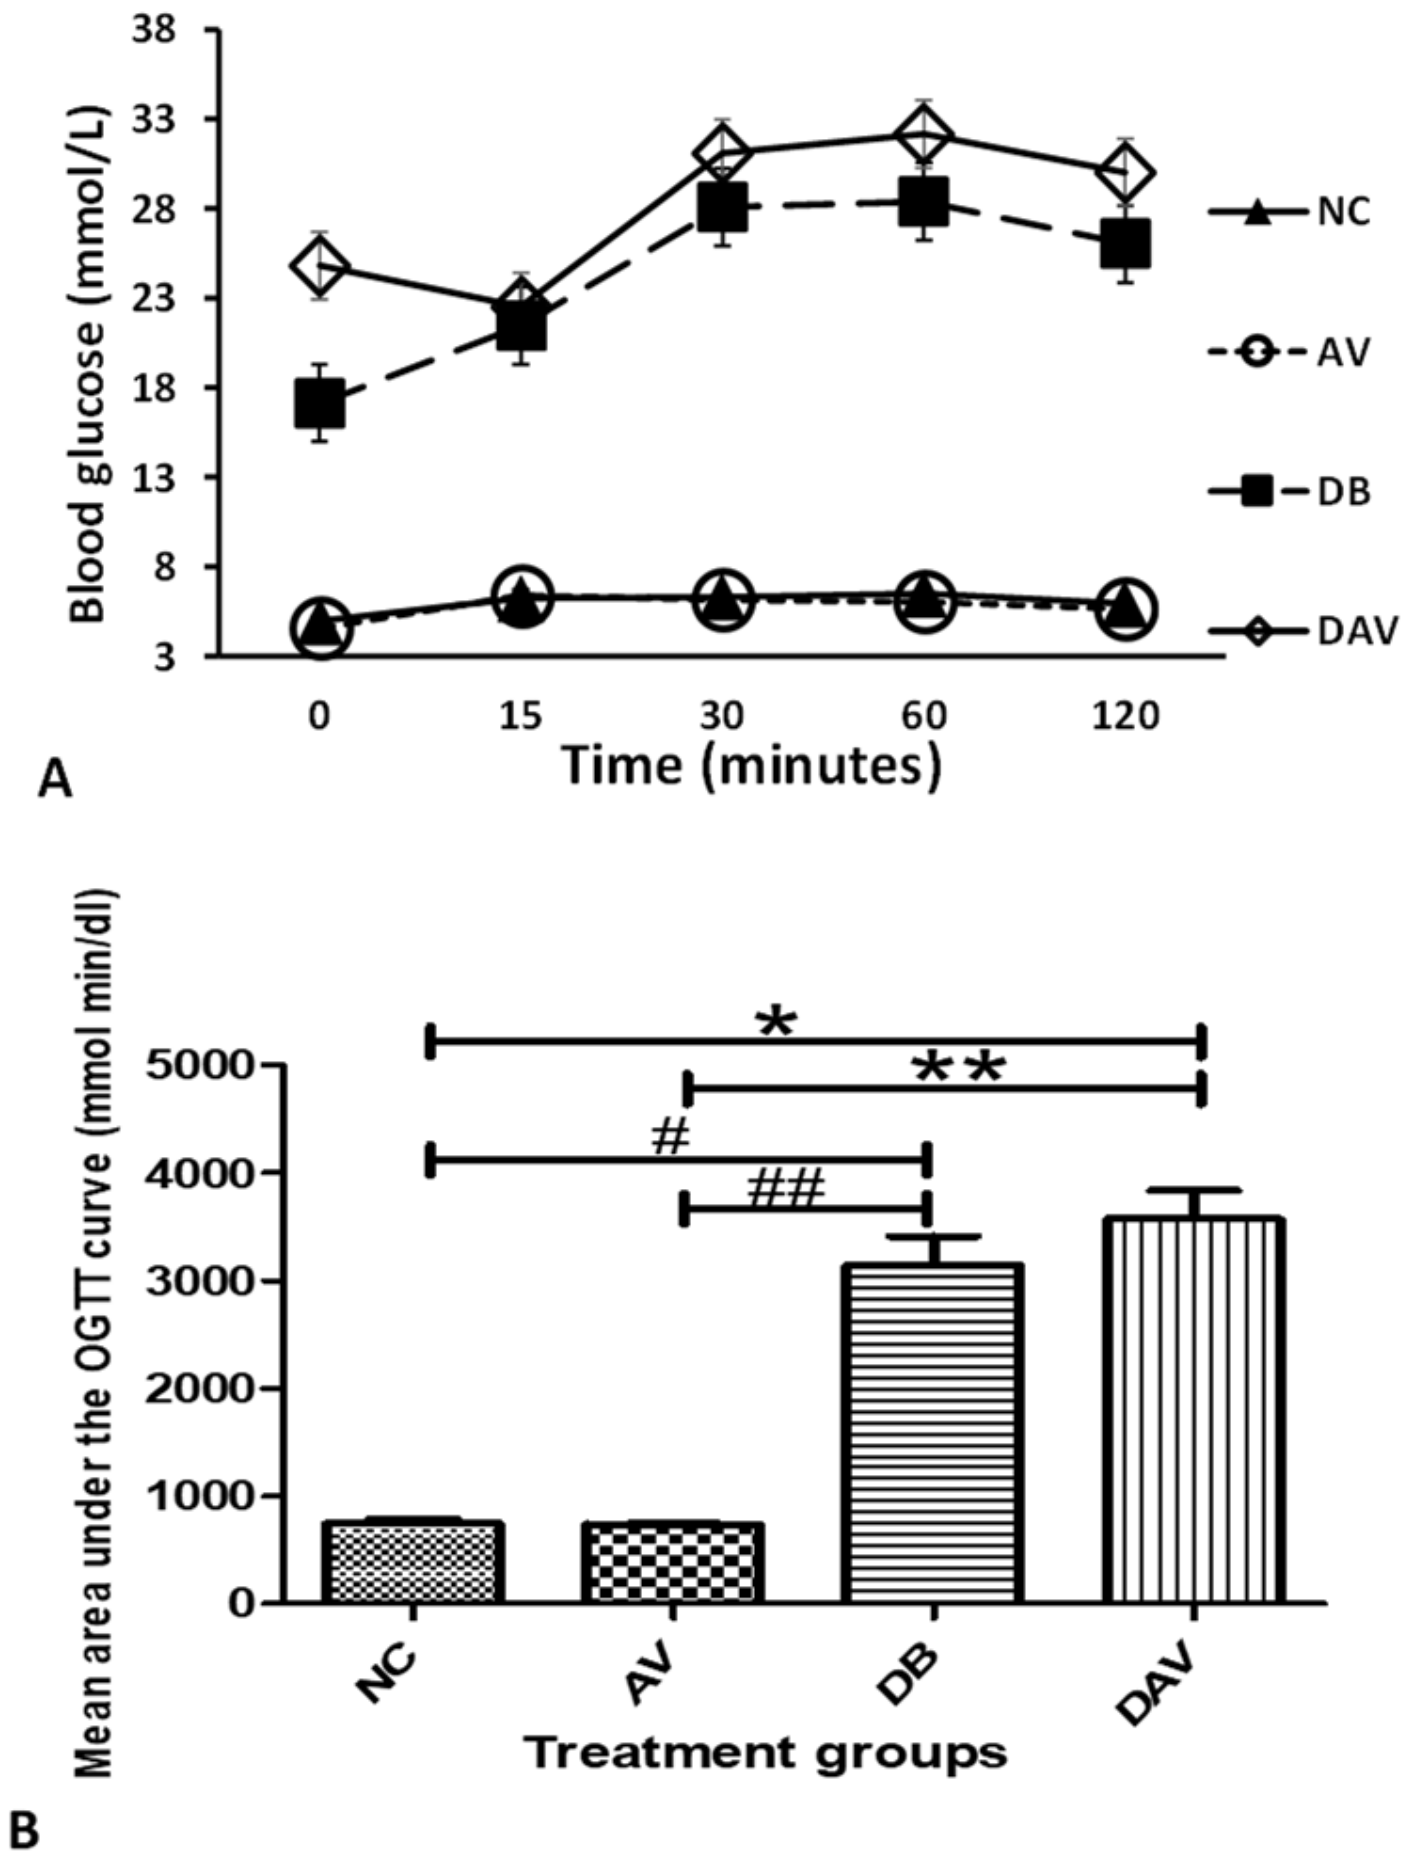
3.3. Blood Glucose Levels
3.4. Oral Glucose Tolerance Test
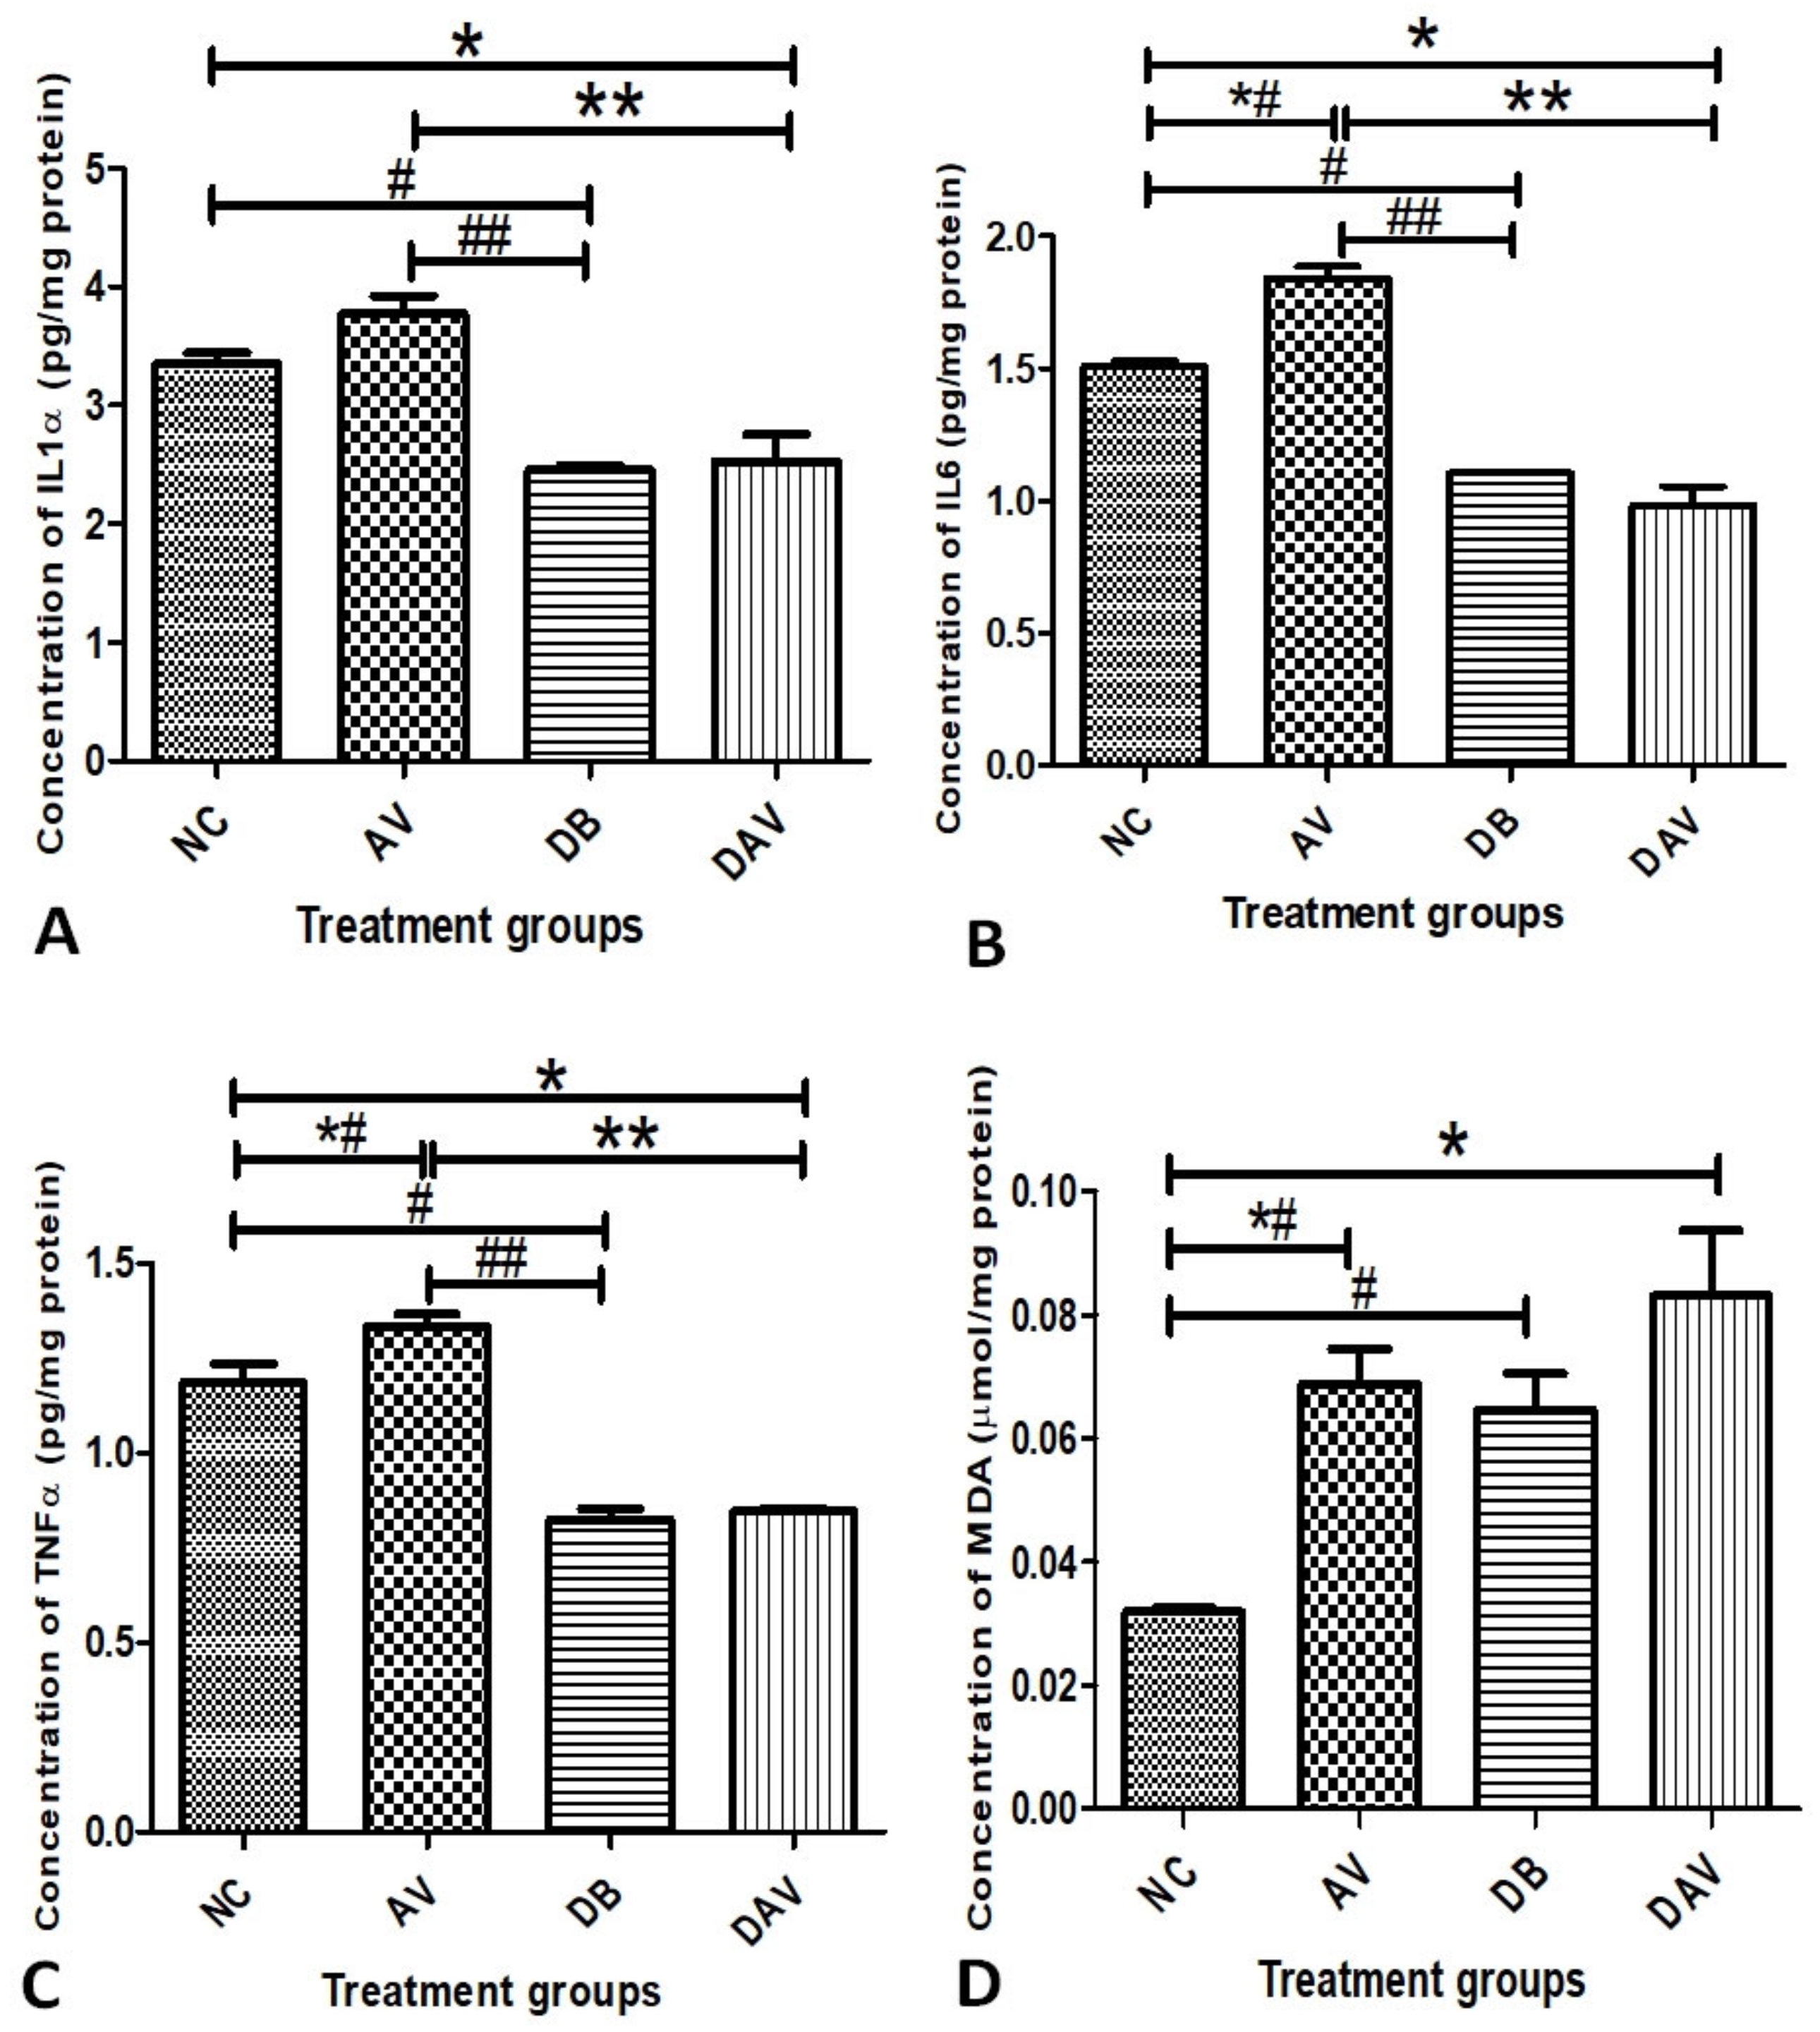
3.5. Inflammatory Cytokines and MDA
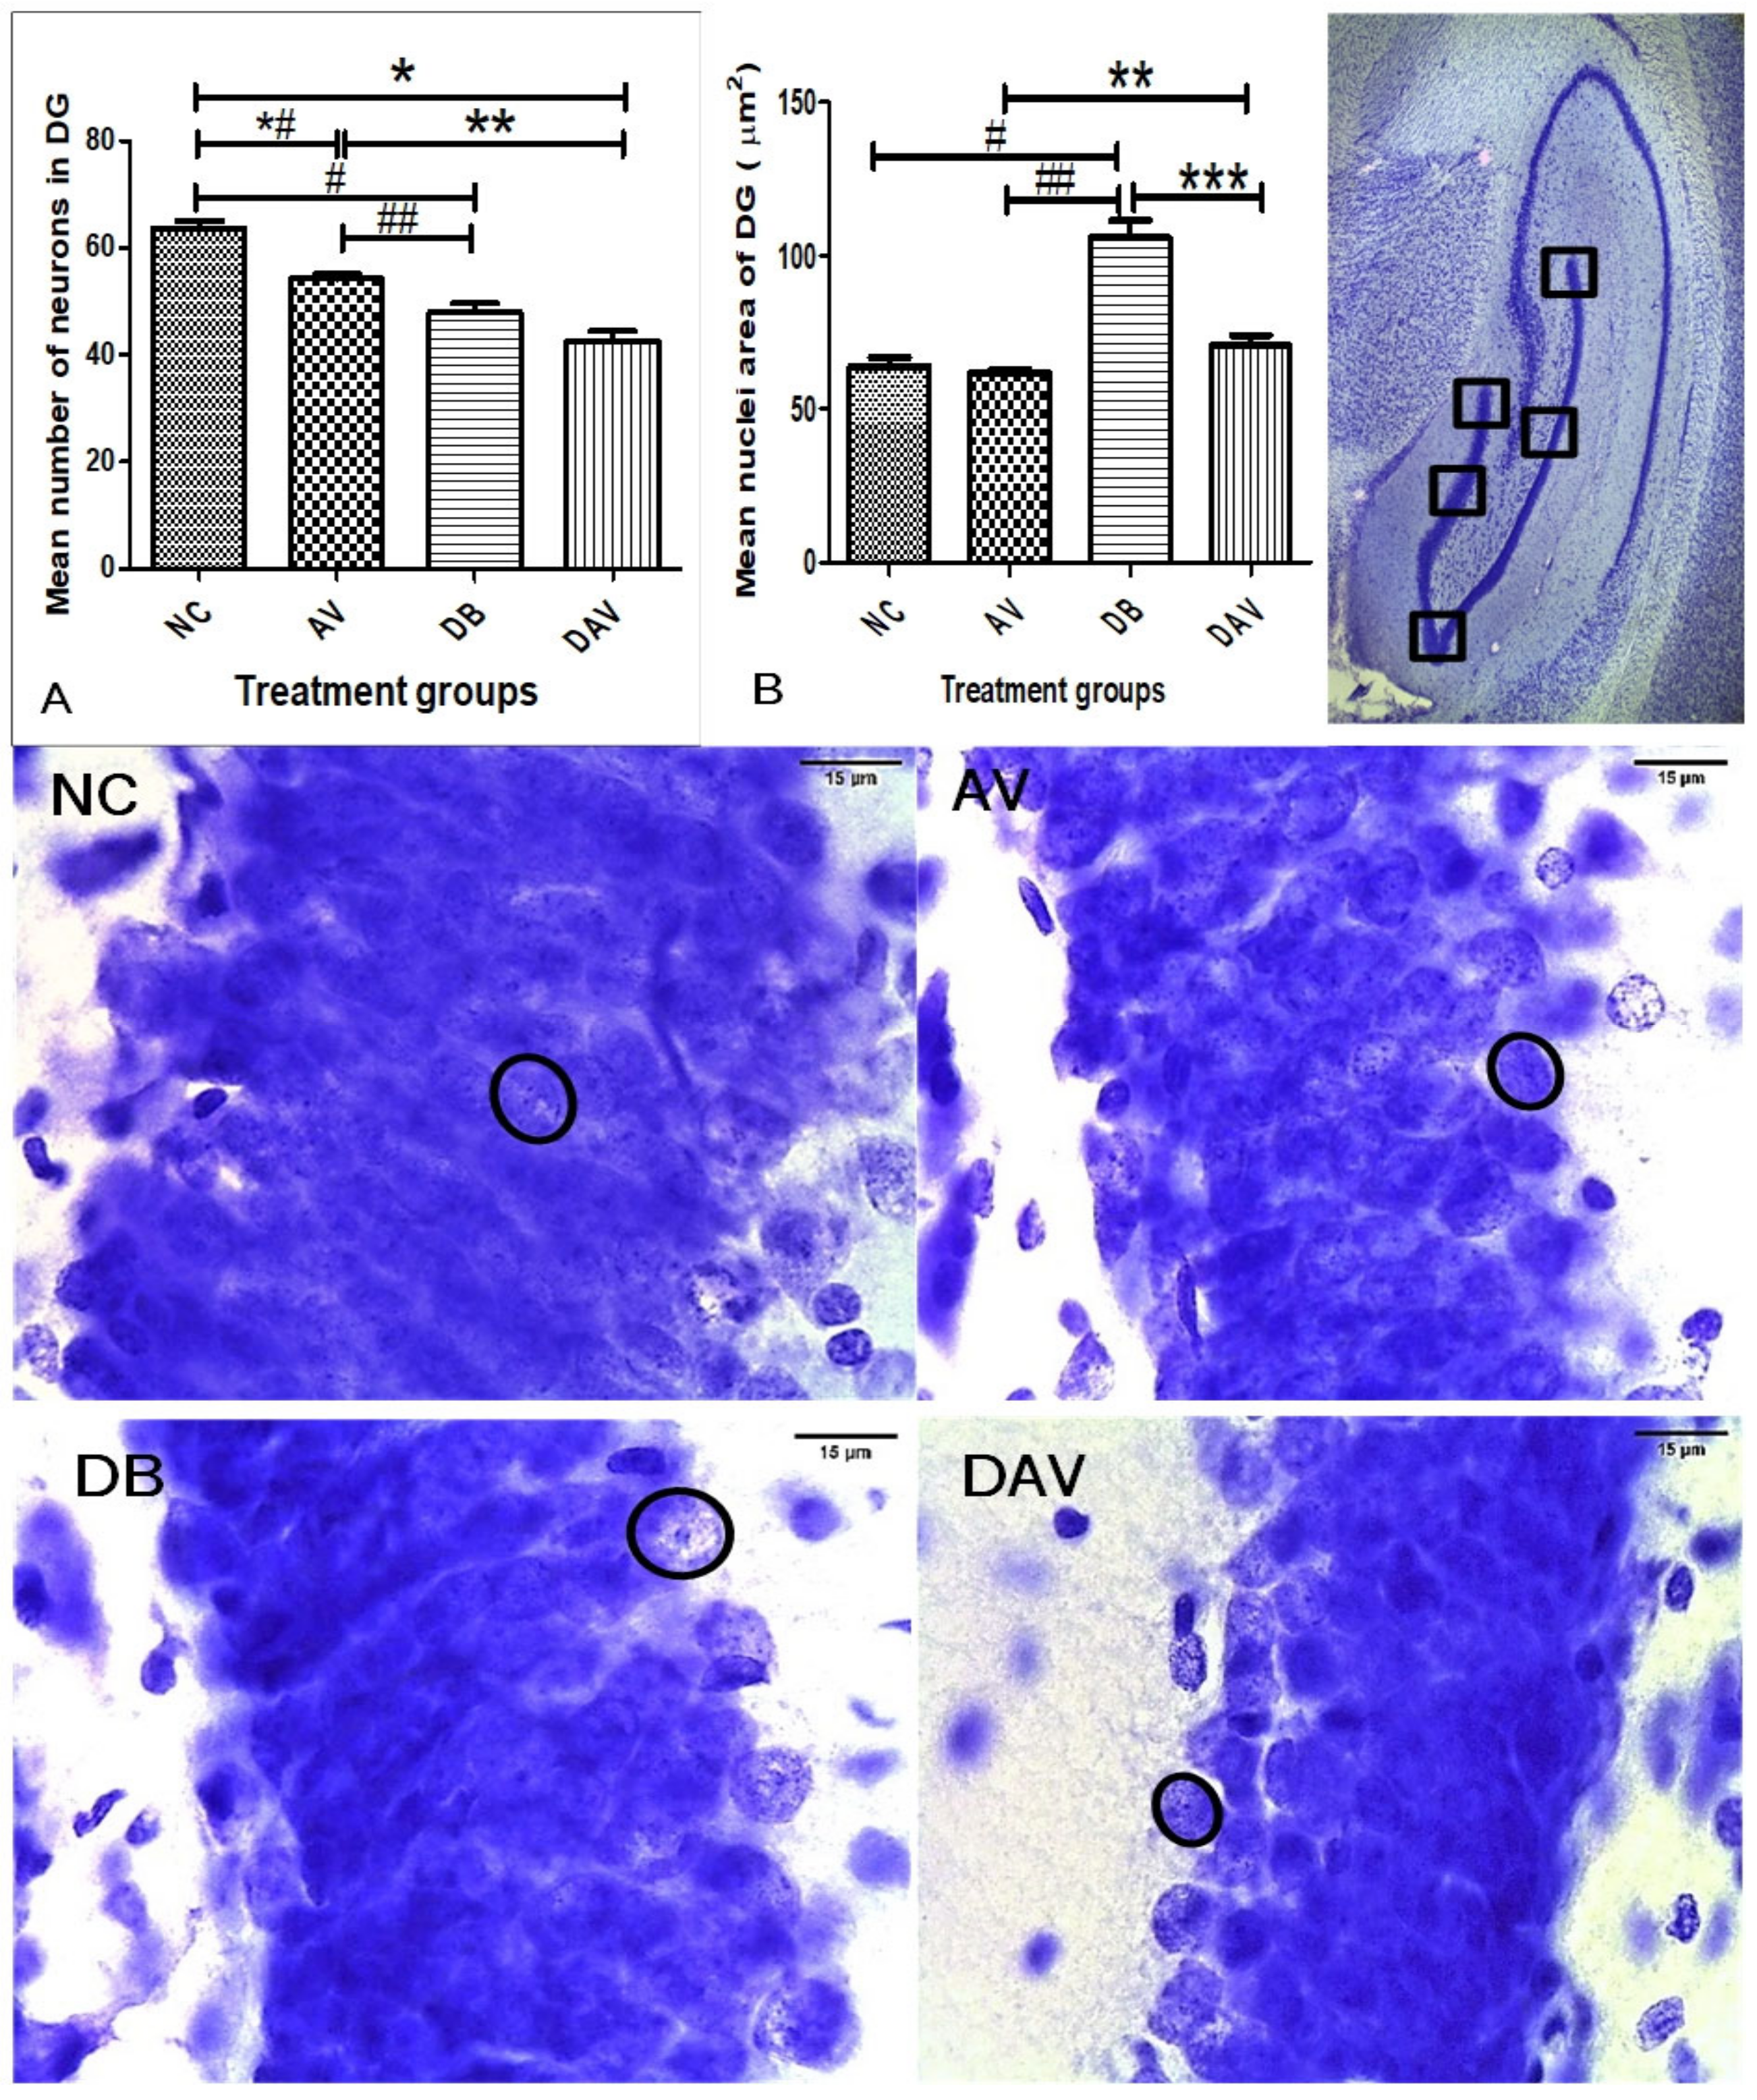
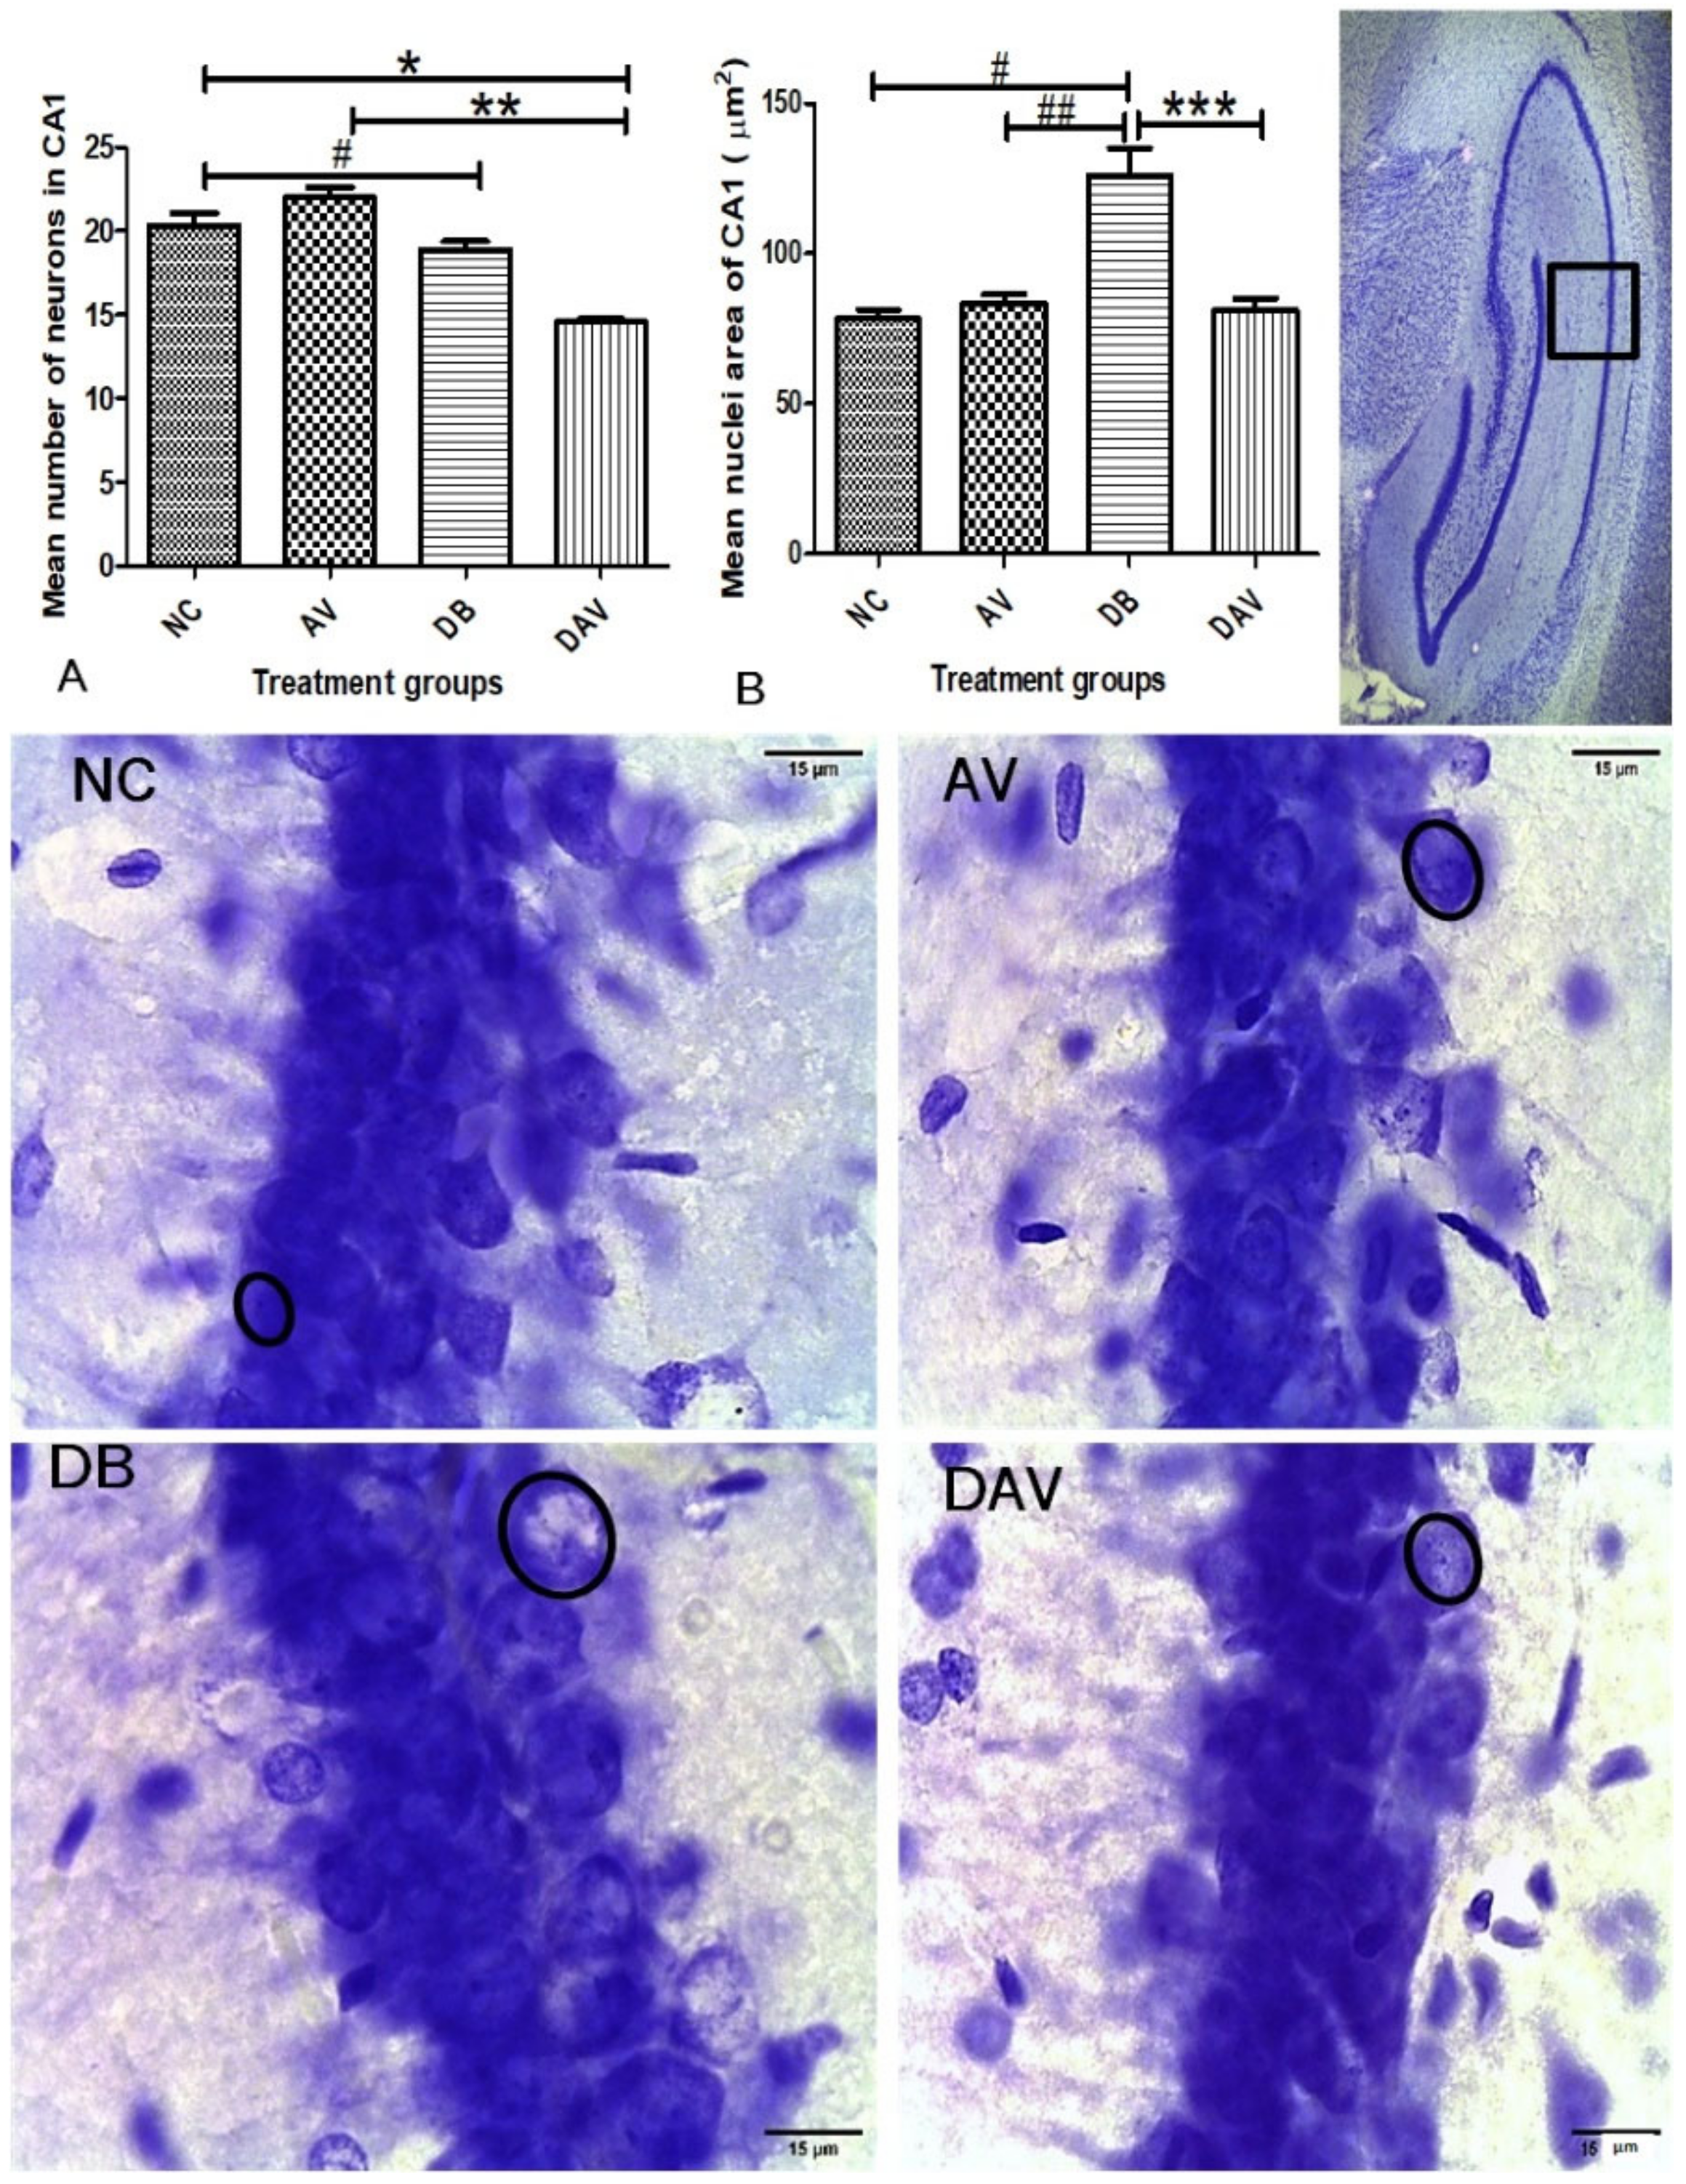
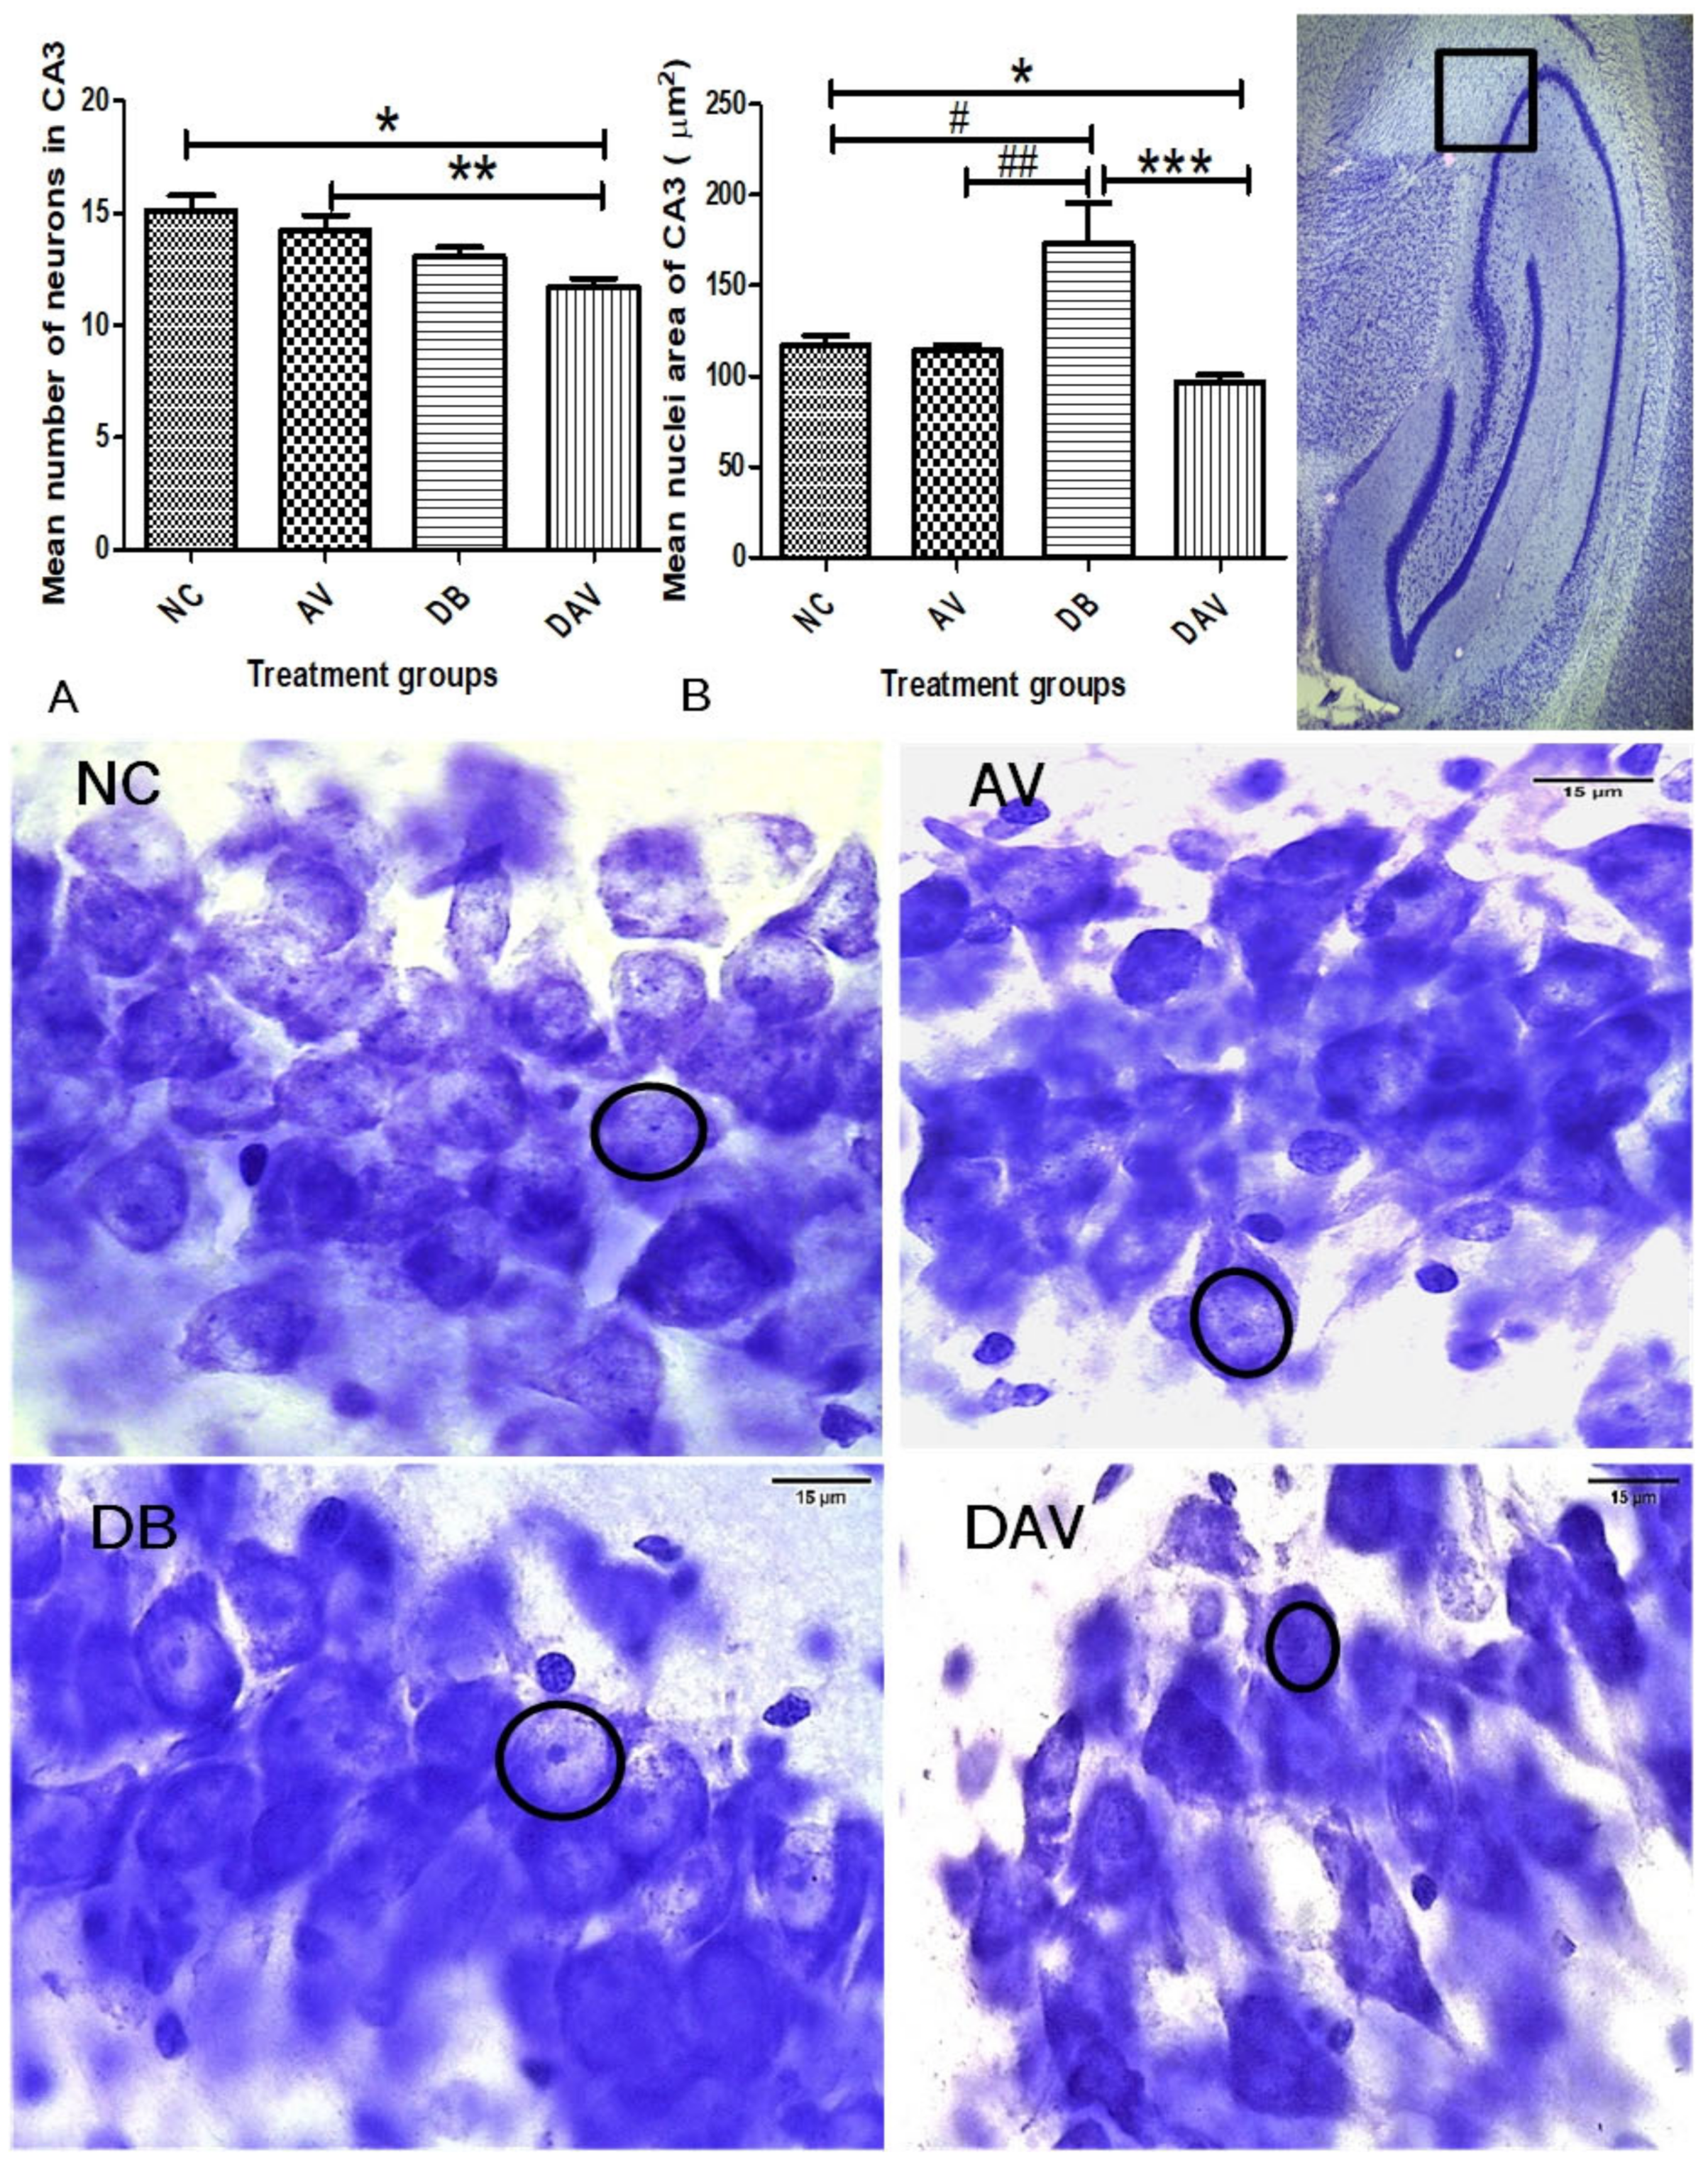
3.6. Histopathology of the Hippocampus
3.6.1. Number of Neurons in Hippocampal Regions
3.6.2. Neuronal Nuclei Area in Hippocampal Regions
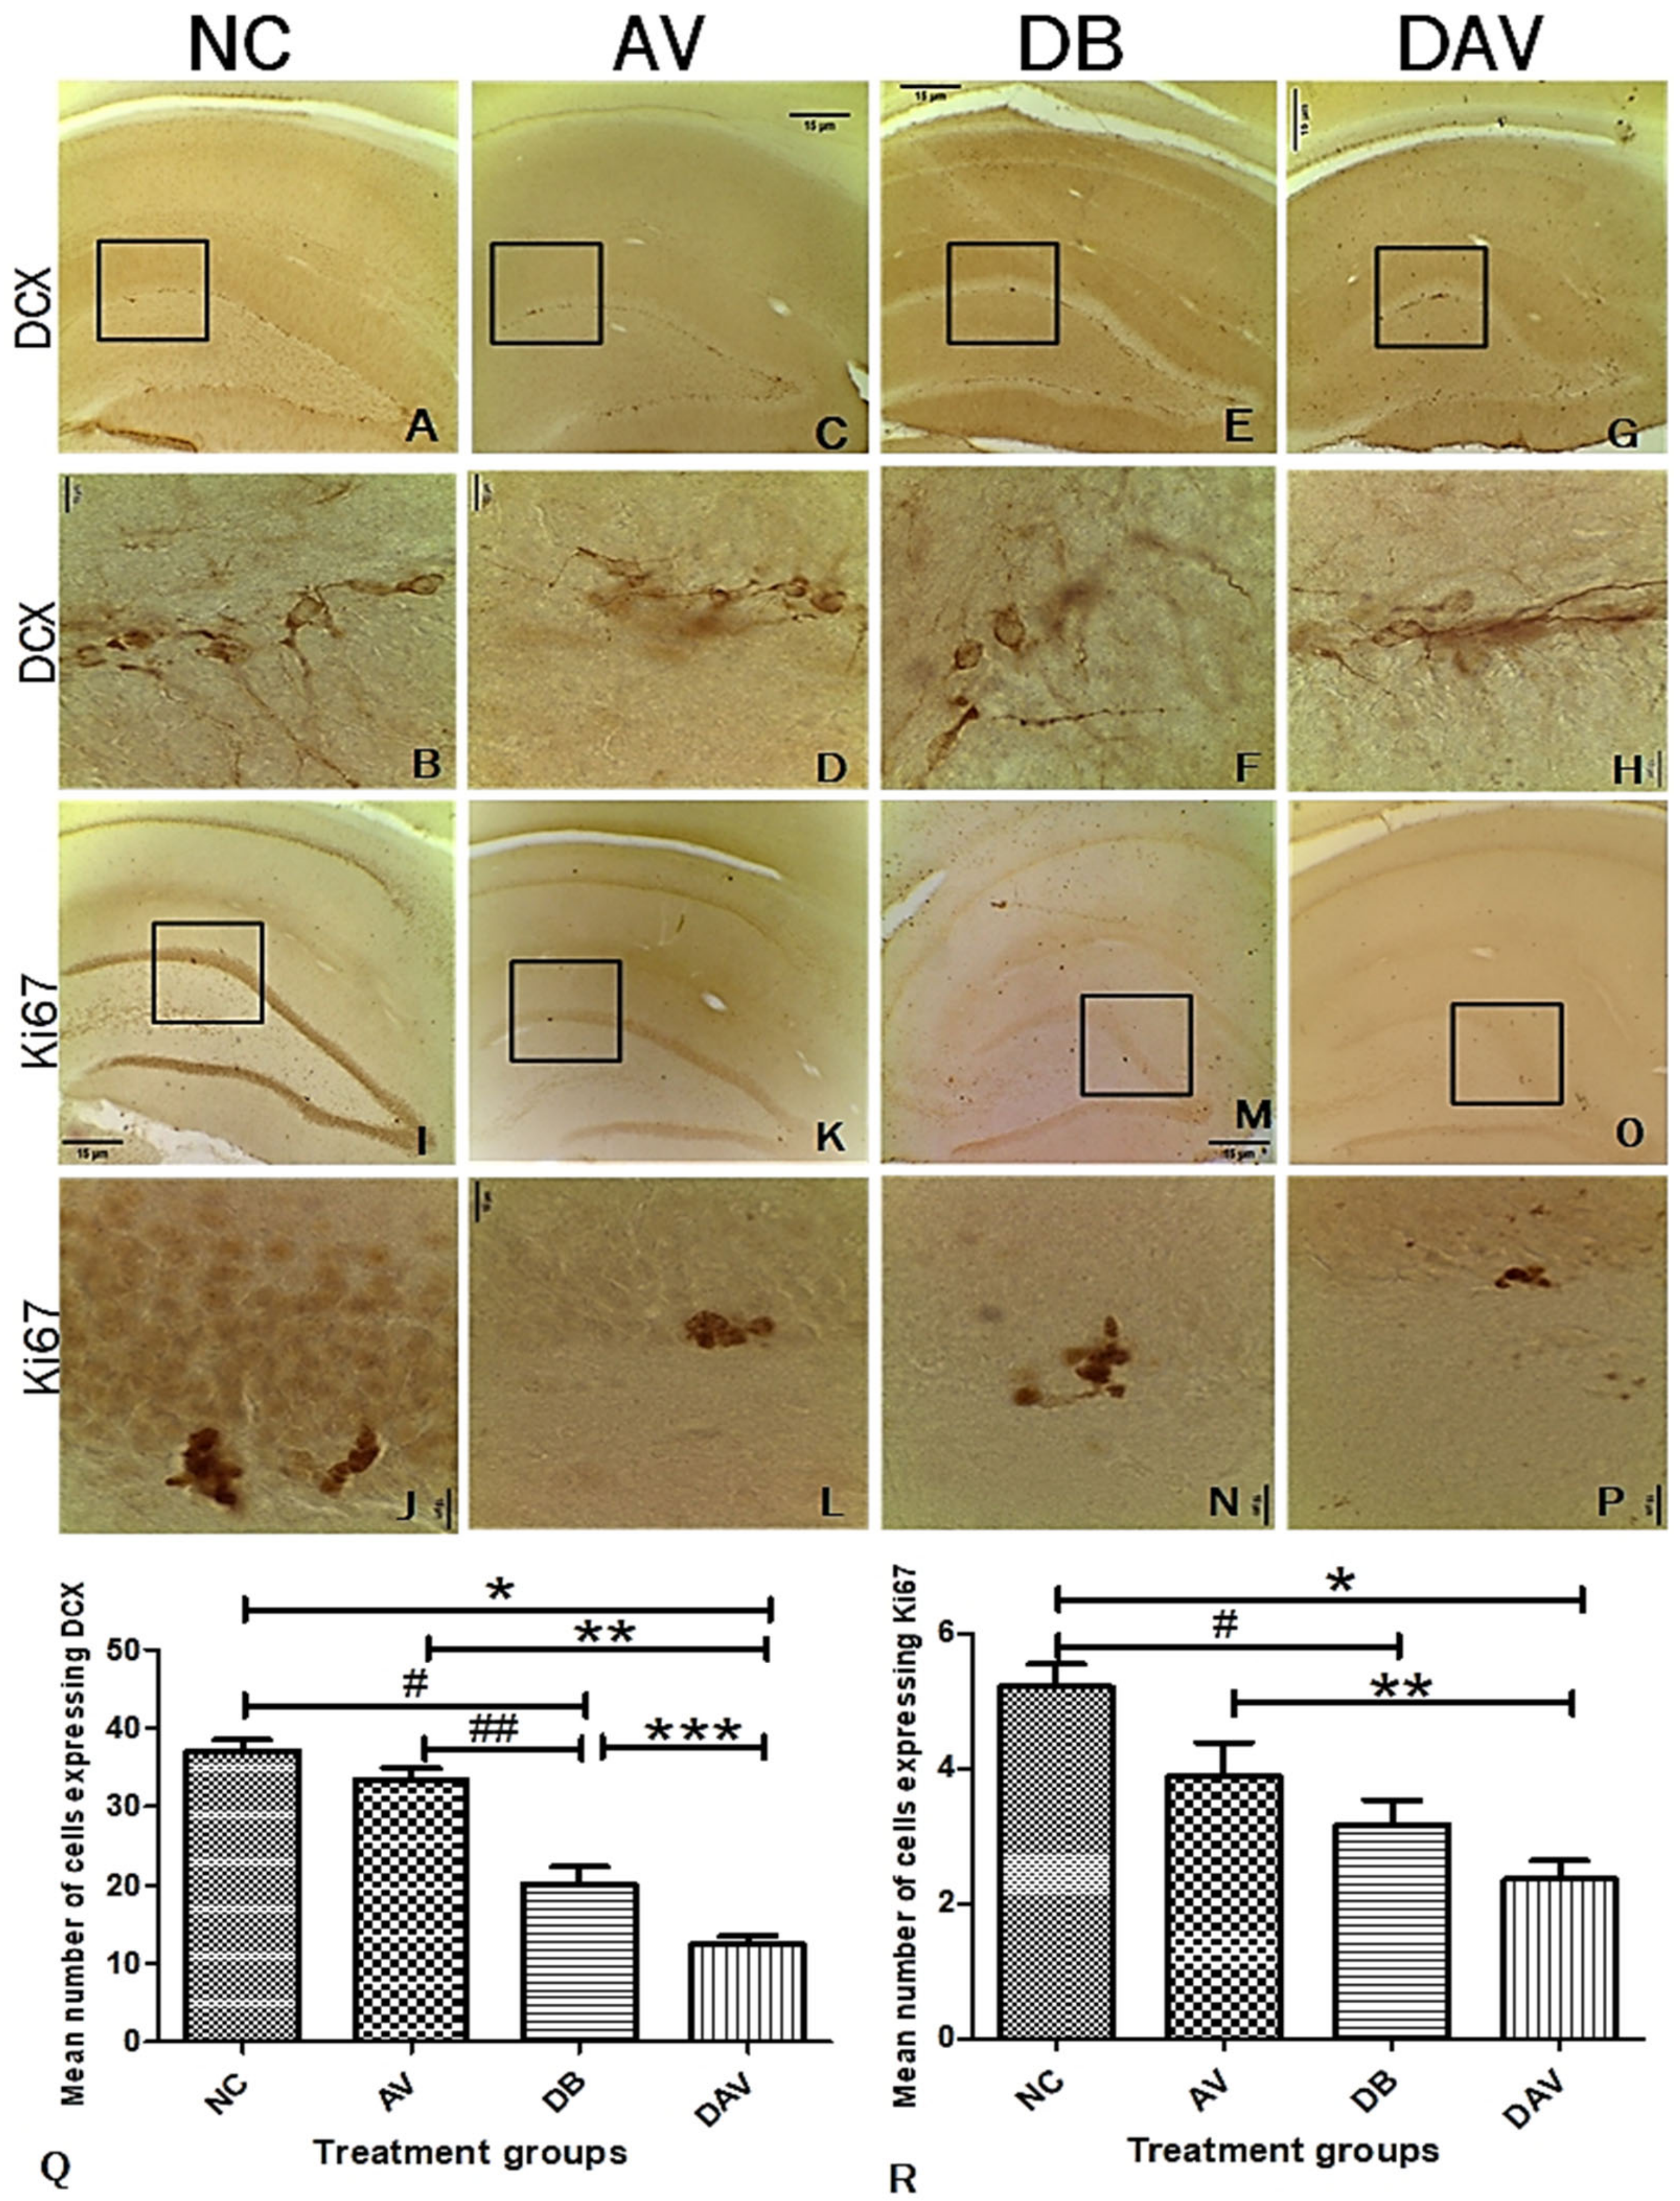
3.7. Immunohistochemistry for Neurogenesis in the Hippocampus Double Cortin and Ki67
3.8. Correlation of Histomorphology and Neurogenic Parameters
4. Discussion
Author Contributions
Funding
Institutional Review Board Statement
Data Availability Statement
Acknowledgments
Conflicts of Interest
References
- Pheiffer, C.; Pillay-van Wyk, V.; Joubert, J.D.; Levitt, N.; Nglazi, M.D.; Bradshaw, D. The prevalence of type 2 diabetes in South Af-rica: A systematic review protocol. BMJ Open 2018, 8, e021029. [Google Scholar] [CrossRef] [PubMed] [Green Version]
- Al-Maskari, F. Lifestyle Diseases: An Economic Burden on the Health Services. UN Chronicle Magazine UN. 2010. Available online: https://www.un.org/en/chronicle/article/lifestyle-diseases-economic-burden-health-services (accessed on 5 November 2021).
- Feng, R.; Du, S.; Chen, Y.; Zheng, S.; Zhang, W.; Na, G.; Li, Y.; Sun, C. High carbohydrate intake from starchy foods is positively associated with metabolic disorders: A Cohort Study from a Chinese population. Sci. Rep. 2015, 5, 16919. [Google Scholar] [CrossRef] [PubMed] [Green Version]
- Meintjes, G.; Moorhouse, M.A.; Carmona, S.; Davies, N.; Dlamini, S.; Van Vuuren, C.; Manzini, T.; Mathe, M.; Moosa, Y.; Nash, J.; et al. Adult antiretroviral therapy guidelines 2017. South. Afr. J. HIV Med. 2017, 18, 1–24. [Google Scholar] [CrossRef]
- Fokunang, C.N.; Hitchcock, J.; Spence, F.; Tembe-Fokunang, E.A.; Burkhardt, J.; Levy, L.; George, C. An Overview of Mitochondrial Toxicity of Nucleoside Reverse Transcriptase Inhibitors Associated with HIV Therapy. Int. J. Pharmacol. 2005, 2, 152–162. [Google Scholar] [CrossRef] [Green Version]
- Osuji, F.N.; Onyenekwe, C.C.; Ahaneku, J.E.; Ukibe, N.R. The effects of highly active antiretroviral therapy on the serum levels of pro-inflammatory and anti-inflammatory cytokines in HIV infected subjects. J. Biomed. Sci. 2018, 25, 88. [Google Scholar] [CrossRef] [PubMed]
- Zhou, H.; Jarujaron, S.; Gurley, E.C.; Chen, L.; Ding, H.; Studer, E.; Pandak, W.M.; Hu, W.; Zou, T.; Wang, J.-Y.; et al. HIV protease inhibitors increase TNF-α and IL-6 expression in macrophages: Involvement of the RNA-binding protein HuR. Atherosclerosis 2007, 195, e134–e143. [Google Scholar] [CrossRef] [PubMed]
- Honnapurmath, V.K.; Patil, V.W. Antiretroviral therapy-induced insulin resistance and oxidative deoxy nucleic acid damage in human immunodeficiency virus-1 patients. Indian J. Endocrinol. Metab. 2017, 21, 316–321. [Google Scholar] [CrossRef] [PubMed]
- Noor, M.A. The role of protease inhibitors in the pathogenesis of HIV-associated insulin resistance: Cellular mechanisms and clinical implications. Curr. HIV/AIDS Rep. 2007, 4, 126–134. [Google Scholar] [CrossRef] [PubMed]
- Rehman, K.; Akash, M.S.H. Mechanisms of inflammatory responses and development of insulin resistance: How are they interlinked? J. Biomed. Sci. 2016, 23, 87. [Google Scholar] [CrossRef] [PubMed] [Green Version]
- Calle, M.; Fernandez, M. Inflammation and type 2 diabetes. Diabetes Metab. 2012, 38, 183–191. [Google Scholar] [CrossRef]
- Tsalamandris, S.; Antonopoulos, A.S.; Oikonomou, E.; Papamikroulis, G.-A.; Vogiatzi, G.; Papaioannou, S.; Deftereos, S.; Tousoulis, D. The Role of Inflammation in Diabetes: Current Concepts and Future Perspectives. Eur. Cardiol. Rev. 2019, 14, 50–59. [Google Scholar] [CrossRef] [PubMed] [Green Version]
- Brown, T.T.; Cole, S.R.; Li, X.; Kingsley, L.A.; Palella, F.J.; Riddler, S.A.; Visscher, B.R.; Margolick, J.B.; Dobs, A.S. Antiretroviral therapy and the prevalence and incidence of diabetes mellitus in the multicenter AIDS cohort study. Arch. Intern. Med. 2005, 165, 1179–1184. [Google Scholar] [CrossRef] [PubMed] [Green Version]
- Berbudi, A.; Rahmadika, N.; Tjahjadi, A.; Ruslami, R. Type 2 Diabetes and its Impact on the Immune System. Curr. Diabetes Rev. 2020, 16, 442–449. [Google Scholar] [CrossRef]
- Muriach, M.; Flores-Bellver, M.; Romero, F.J.; Barcia, J.M. Diabetes and the Brain: Oxidative Stress, Inflammation, and Autophagy. Oxidative Med. Cell. Longev. 2014, 2014, 102158. [Google Scholar] [CrossRef] [Green Version]
- Alves, C.; Casqueiro, J.; Casqueiro, J. Infections in patients with diabetes mellitus: A review of pathogenesis. Indian J. Endocrinol. Metab. 2012, 16 (Suppl. 1), S27–S36. [Google Scholar] [CrossRef] [PubMed]
- Gonzalez, C.; Lee, M.-S.; Marchetti, P.; Pietropaolo, M.; Towns, R.; Vaccaro, M.; Watada, H.; Wiley, J.W. The emerging role of autophagy in the pathophysiology of diabetes mellitus. Autophagy 2011, 7, 2–11. [Google Scholar] [CrossRef] [PubMed]
- Razavi, S.; Sadeghi, A.; Hami, J.; Esfandiary, E.; Hejazi, Z. The effect of diabetes mellitus on apoptosis in hippocampus: Cellular and molecular aspects. Int. J. Prev. Med. 2016, 7, 57. [Google Scholar] [CrossRef] [PubMed]
- McNay, E.C.; Ong, C.; McCrimmon, R.; Cresswell, J.; Bogan, J.; Sherwin, R.S. Hippocampal memory processes are modulated by insulin and high-fat-induced insulin resistance. Neurobiol. Learn. Mem. 2010, 93, 546–553. [Google Scholar] [CrossRef] [PubMed] [Green Version]
- McNay, E.C.; Recknagel, A.K. Reprint of: ‘Brain insulin signaling: A key component of cognitive processes and a potential basis for cognitive impairment in type 2 diabetes’. Neurobiol. Learn. Mem. 2011, 96, 517–528. [Google Scholar] [CrossRef] [PubMed]
- Jin, J.; Grimmig, B.; Izzo, J.; Brown, L.A.M.; Hudson, C.; Smith, A.J.; Tan, J.; Bickford, P.; Giunta, B. HIV Non-Nucleoside Reverse Transcriptase Inhibitor Efavirenz Reduces Neural Stem Cell Proliferation in Vitro and in Vivo. Cell Transplant. 2016, 25, 1967–1977. [Google Scholar] [CrossRef] [Green Version]
- Ramos-Rodriguez, J.J.; Molina-Gil, S.; Ortiz-Barajas, O.; Jimenez-Palomares, M.; Perdomo, G.; Cozar-Castellano, I.; Lechuga-Sancho, A.; Garcia-Alloza, M. Central Proliferation and Neurogenesis Is Impaired in Type 2 Diabetes and Prediabetes Animal Models. PLoS ONE 2014, 9, e89229. [Google Scholar] [CrossRef]
- Stranahan, A.M.; Arumugam, T.; Cutler, R.G.; Lee, K.; Egan, J.M.; Mattson, M.P. Diabetes impairs hippocampal function through glucocorticoid-mediated effects on new and mature neurons. Nat. Neurosci. 2008, 11, 309–317. [Google Scholar] [CrossRef] [PubMed] [Green Version]
- Kodl, C.T.; Seaquist, E.R. Cognitive Dysfunction and Diabetes Mellitus. Endocr. Rev. 2008, 29, 494–511. [Google Scholar] [CrossRef] [PubMed]
- Opii, W.O.; Sultana, R.; Abdul, H.M.; Ansari, M.A.; Nath, A.; Butterfield, D.A. Oxidative stress and toxicity induced by the nucleoside reverse transcriptase inhibitor (NRTI)—2′,3′-dideoxycytidine (ddC): Relevance to HIV-dementia. Exp. Neurol. 2007, 204, 29–38. [Google Scholar] [CrossRef] [PubMed] [Green Version]
- Robertson, K.; Liner, J.; Meeker, R.B. Antiretroviral neurotoxicity. J. NeuroVirology 2012, 18, 388–399. [Google Scholar] [CrossRef] [PubMed]
- Kousignian, I.; Sautereau, A.; Vigouroux, C.; Cros, A.; Kretz, S.; Viard, J.P.; Slama, L. Diagnosis, risk factors and management of diabetes mellitus in HIV-infected persons in France: A real-life setting study. PLoS ONE 2021, 16, e0250676. [Google Scholar] [CrossRef]
- Wilson, R.D.; Islam, M.S. Fructose-fed streptozotocin-injected rat: An alternative model for type 2 diabetes. Pharmacol. Rep. 2012, 64, 129–139. [Google Scholar] [CrossRef]
- Frampton, J.E.; Croom, K.F. Efavirenz/Emtricitabine/Tenofovir Disoproxil Fumarate. Drugs 2006, 66, 1501–1512. [Google Scholar] [CrossRef]
- Paxinos, G.; Watson, C. The Rat Brain in Stereotaxic Coordinates: Hard Cover Edition; Elsevier: Amsterdam, The Netherlands, 2006. [Google Scholar]
- American Diabetes Association Diagnosis and Classification of Diabetes Mellitus. Diabetes Care 2007, 30, S42–S47. [CrossRef] [Green Version]
- Manohar, S.M.; Vaikasuvu, S.R.; Deepthi, K.; Sachan, A.; Narasimha, S.R.P.V.L. An association of hyperglycemia with plasma malondialdehyde and atherogenic lipid risk factors in newly diagnosed Type 2 diabetic patients. J. Res. Med. Sci. Off. J. Isfahan Univ. Med. Sci. 2013, 18, 89–93. [Google Scholar]
- AlZamil, H. Elevated Serum TNF-α Is Related to Obesity in Type 2 Diabetes Mellitus and Is Associated with Glycemic Control and Insulin Resistance. J. Obes. 2020, 2020, 5076858. [Google Scholar] [CrossRef] [PubMed] [Green Version]
- American Diabetes Association 2. Classification and Diagnosis of Diabetes. Diabetes Care 2015, 38, S8–S16. [Google Scholar] [CrossRef] [PubMed] [Green Version]
- Benedé-Ubieto, R.; Estévez-Vázquez, O.; Ramadori, P.; Cubero, F.J.; Nevzorova, Y.A. Guidelines and Considerations for Metabolic Tolerance Tests in Mice. Diabetes Metab. Syndr. Obes. Targets Ther. 2020, 13, 439–450. [Google Scholar] [CrossRef] [PubMed] [Green Version]
- Pournaghi, P.; Sadrkhanlou, R.-A.; Hasanzadeh, S.; Foroughi, A. An investigation on body weights, blood glucose levels and pituitary-gonadal axis hormones in diabetic and metformin-treated diabetic female rats. Vet. Res. Forum 2012, 3, 79–84. [Google Scholar]
- Muhammad, M. Tumor Necrosis Factor Alpha: A Major Cytokine of Brain Neuroinflammation. In Cytokines; IntechOpen: London, UK, 2020. [Google Scholar] [CrossRef] [Green Version]
- Salmeron, K.E.; Maniskas, M.E.; Edwards, D.N.; Wong, R.; Rajkovic, I.; Trout, A.; Rahman, A.A.; Hamilton, S.; Fraser, J.F.; Pinteaux, E.; et al. Interleukin 1 alpha administration is neuroprotective and neuro-restorative following experimental ischemic stroke. J. Neuroinflamm. 2019, 16, 222. [Google Scholar] [CrossRef] [Green Version]
- Donath, M.Y.; Shoelson, S.E. Type 2 diabetes as an inflammatory disease. Nat. Rev. Immunol. 2011, 11, 98–107. [Google Scholar] [CrossRef]
- Herrero, L.; Shapiro, H.; Nayer, A.; Lee, J.; Shoelson, S.E. Inflammation and adipose tissue macrophages in lipodystrophic mice. Proc. Natl. Acad. Sci. USA 2010, 107, 240–245. [Google Scholar] [CrossRef] [Green Version]
- Daryabor, G.; Atashzar, M.R.; Kabelitz, D.; Meri, S.; Kalantar, K. The Effects of Type 2 Diabetes Mellitus on Organ Metabolism and the Immune System. Front. Immunol. 2020, 11, 1582. [Google Scholar] [CrossRef]
- Martinez, N.; Ketheesan, N.; Martens, G.W.; West, K.; Lien, E.; Kornfeld, H. Defects in early cell recruitment contribute to the increased susceptibility to respiratory Klebsiella pneumoniae infection in diabetic mice. Microbes Infect. 2016, 18, 649–655. [Google Scholar] [CrossRef]
- Richard, C.; Wadowski, M.; Goruk, S.; Cameron, L.; Sharma, A.M.; Field, C. Individuals with obesity and type 2 diabetes have additional immune dysfunction compared with obese individuals who are metabolically healthy. BMJ Open Diabetes Res. Care 2017, 5, e000379. [Google Scholar] [CrossRef] [PubMed]
- Bourgognon, J.-M.; Cavanagh, J. The role of cytokines in modulating learning and memory and brain plasticity. Brain Neurosci. Adv. 2020, 4, 1–13. [Google Scholar] [CrossRef]
- Akang, E.N.; Dosumu, O.O.; Afolayan, O.O.; Fagoroye, A.M.; Osiagwu, D.D.; Usman, I.T.; Oremosu, A.A.; Akanmu, A.S. Combination antiretroviral therapy (cART)-induced hippocampal disorders: Highlights on therapeutic potential of Naringenin and Quercetin. IBRO Rep. 2019, 6, 137–146. [Google Scholar] [CrossRef] [PubMed]
- Madhusudhanan, J.; Suresh, G.; Devanathan, V. Neurodegeneration in type 2 diabetes: Alzheimer’s as a case study. Brain Behav. 2020, 10, e01577. [Google Scholar] [CrossRef] [PubMed] [Green Version]
- Scharfman, H.E.; Myers, C.E. Corruption of the dentate gyrus by “dominant” granule cells: Implications for dentate gyrus function in health and disease. Neurobiol. Learn. Mem. 2016, 129, 69–82. [Google Scholar] [CrossRef] [Green Version]
- Cherubini, E.; Miles, R.M. The CA3 region of the hippocampus: How is it? What is it for? How does it do it? Front. Cell. Neurosci. 2015, 9, 19. [Google Scholar] [CrossRef] [Green Version]
- Le Duigou, C.; Simonnet, J.; Teleñczuk, M.T.; Fricker, D.; Miles, R.M. Recurrent synapses and circuits in the CA3 region of the hippocampus: An associative network. Front. Cell. Neurosci. 2014, 7, 262. [Google Scholar] [CrossRef]
- Broadwater, M.A.; Liu, W.; Crews, F.T.; Spear, L.P. Persistent Loss of Hippocampal Neurogenesis and Increased Cell Death following Adolescent, but Not Adult, Chronic Ethanol Exposure. Dev. Neurosci. 2014, 36, 297–305. [Google Scholar] [CrossRef] [Green Version]
- Elmore, S. Apoptosis: A review of programmed cell death. Toxicol. Pathol. 2007, 35, 495–516. [Google Scholar] [CrossRef]
- Kwon, H.-K.; Lee, J.-H.; Shin, H.-J.; Kim, J.-H.; Choi, S. Structural and functional analysis of cell adhesion and nuclear envelope nano-topography in cell death. Sci. Rep. 2015, 5, 15623. [Google Scholar] [CrossRef] [Green Version]


| Diabetes Parameters | Neuronal Number | Neurogenic Markers | ||||||
|---|---|---|---|---|---|---|---|---|
| BW | FBG | NFBG | AUC | CA1N | CA3N | DGN | Ki67 | |
| FBG | ||||||||
| p value | 0.0001 * | |||||||
| R value | −0.613 | |||||||
| NFBG | ||||||||
| p value | 0.0001 * | 0.0001 * | ||||||
| R value | −0.648 | 0.761 | ||||||
| AUC | ||||||||
| p value | 0.0001 * | 0.0001 * | 0.0001 * | |||||
| R value | −0.723 | 0.729 | 0.691 | |||||
| CA1N | ||||||||
| p value | 0.0001 * | 0.0001 * | 0.0001 * | 0.0001 * | ||||
| R value | 0.716 | −0.808 | −0.706 | −0.762 | ||||
| CA3N | ||||||||
| p value | 0.011 * | 0.0001 * | 0.002 * | 0.004 * | 0.0001 * | |||
| R value | 0.508 | −0.821 | −0.593 | −0.563 | 0.794 | |||
| DGN | ||||||||
| p value | 0.001 * | 0.0001 * | 0.0001 * | 0.0001 * | 0.0001 * | 0.0001 * | ||
| R value | 0.629 | −0.900 | −0.800 | −0.692 | 0.824 | 0.794 | ||
| KI67 | ||||||||
| p value | 0.038 * | 0.0001 * | 0.001 * | 0.006 * | 0.0001 * | 0.001 * | 0.0001 * | |
| R value | 0.426 | −0.735 | −0.637 | −0.546 | 0.715 | 0.639 | 0.758 | |
| DCX | ||||||||
| p value | 0.0001 * | 0.0001 * | 0.0001 * | 0.0001 * | 0.0001 * | 0.0001 * | 0.0001 * | 0.0001 * |
| R value | 0.667 | −0.882 | −0.714 | −0.777 | 0.796 | 0.745 | 0.838 | 0.748 |
| Diabetes Parameters | Neuronal Nuclei Area | Neurogenic Markers | ||||||
|---|---|---|---|---|---|---|---|---|
| BW | FBG | NFBG | AUC | CA1A | CA3A | DGA | Ki67 | |
| CA1A | ||||||||
| p value | 0.101 | 0.08 | 0.014 * | 0.245 | ||||
| R value | −0.343 | 0.364 | 0.497 | 0.247 | ||||
| CA3A | ||||||||
| p value | 0.68 | 0.493 | 0.277 | 0.698 | 0.0001 * | |||
| R value | −0.89 | −0.147 | 0.231 | −0.083 | 0.719 | |||
| DGA | ||||||||
| p value | 0.0001 * | 0.006 * | 0.0001 * | 0.012 * | 0.0001 * | 0.009 * | ||
| R value | −0.717 | 0.546 | 0.706 | 0.505 | 0.696 | 0.52 | ||
| KI67 | ||||||||
| p value | 0.038 * | 0.0001 * | 0.001 * | 0.006 * | 0.296 | 0.526 | 0.047 * | |
| R value | 0.426 | −0.735 | −0.637 | −0.546 | −0.222 | 0.136 | −0.409 | |
| DCX | ||||||||
| p value | 0.0001 * | 0.0001 * | 0.0001 * | 0.0001 * | 0.19 | 0.208 | 0.035 * | 0.0001 * |
| R value | 0.667 | −0.882 | −0.714 | −0.777 | −0.277 | 0.266 | −0.433 | 0.748 |
Publisher’s Note: MDPI stays neutral with regard to jurisdictional claims in published maps and institutional affiliations. |
© 2022 by the authors. Licensee MDPI, Basel, Switzerland. This article is an open access article distributed under the terms and conditions of the Creative Commons Attribution (CC BY) license (https://creativecommons.org/licenses/by/4.0/).
Share and Cite
Asouzu Johnson, J.; Ndou, R.; Mbajiorgu, E.F. Combination Antiretroviral Therapy (cART) in Diabetes Exacerbates Diabetogenic Effects on Hippocampal Microstructure, Neurogenesis and Cytokine Perturbation in Male Sprague Dawley Rats. Diagnostics 2022, 12, 905. https://doi.org/10.3390/diagnostics12040905
Asouzu Johnson J, Ndou R, Mbajiorgu EF. Combination Antiretroviral Therapy (cART) in Diabetes Exacerbates Diabetogenic Effects on Hippocampal Microstructure, Neurogenesis and Cytokine Perturbation in Male Sprague Dawley Rats. Diagnostics. 2022; 12(4):905. https://doi.org/10.3390/diagnostics12040905
Chicago/Turabian StyleAsouzu Johnson, Jaclyn, Robert Ndou, and Ejikeme Felix Mbajiorgu. 2022. "Combination Antiretroviral Therapy (cART) in Diabetes Exacerbates Diabetogenic Effects on Hippocampal Microstructure, Neurogenesis and Cytokine Perturbation in Male Sprague Dawley Rats" Diagnostics 12, no. 4: 905. https://doi.org/10.3390/diagnostics12040905
APA StyleAsouzu Johnson, J., Ndou, R., & Mbajiorgu, E. F. (2022). Combination Antiretroviral Therapy (cART) in Diabetes Exacerbates Diabetogenic Effects on Hippocampal Microstructure, Neurogenesis and Cytokine Perturbation in Male Sprague Dawley Rats. Diagnostics, 12(4), 905. https://doi.org/10.3390/diagnostics12040905