
An Improved Endoscopic Automatic Classification Model for Gastroesophageal Reflux Disease Using Deep Learning Integrated Machine Learning

 ,
,  ,
,
Abstract
1. Introduction
2. Methods
2.1. GERD Dataset
2.2. Feature Extraction
- (1)
- EfficientNetB7: The deep network architecture proposed by Tan et al. in 2019 [30]. Seven layers were used as the backbone, including the input layer, rescaling, normalization, zero padding, convolution layer, batch normalization, and activation, and then the seven blocks were connected. Each block was connected to a different sub-block. There were 813 layers in total. Our study uses this deep learning model to automatically extract 2560 image features from a global maximum pooling (GMP) layer.
- (2)
- ResNet50: Residual learning framework proposed by He et al. in 2016 [31] to simplify the training of deeper networks than previously used. On the ImageNet dataset, residual networks with a depth of up to 152 layers were evaluated, which was eight times deeper than the VGG network, but still had lower complexity. This study uses this deep learning model to automatically extract 2048 image features from a GMP layer.
- (3)
- InceptionResNetV2: Proposed by Szegedy et al. in 2017 [32], InceptionResNetV2 combined the Inception Module and the residual network. Better model accuracy was obtained by deepening the network and using asymmetric convolutional layers and 1 × 1 convolutional layers to implement the model. This study uses this deep learning model to automatically extract 1536 image features from a GMP layer.
- (4)
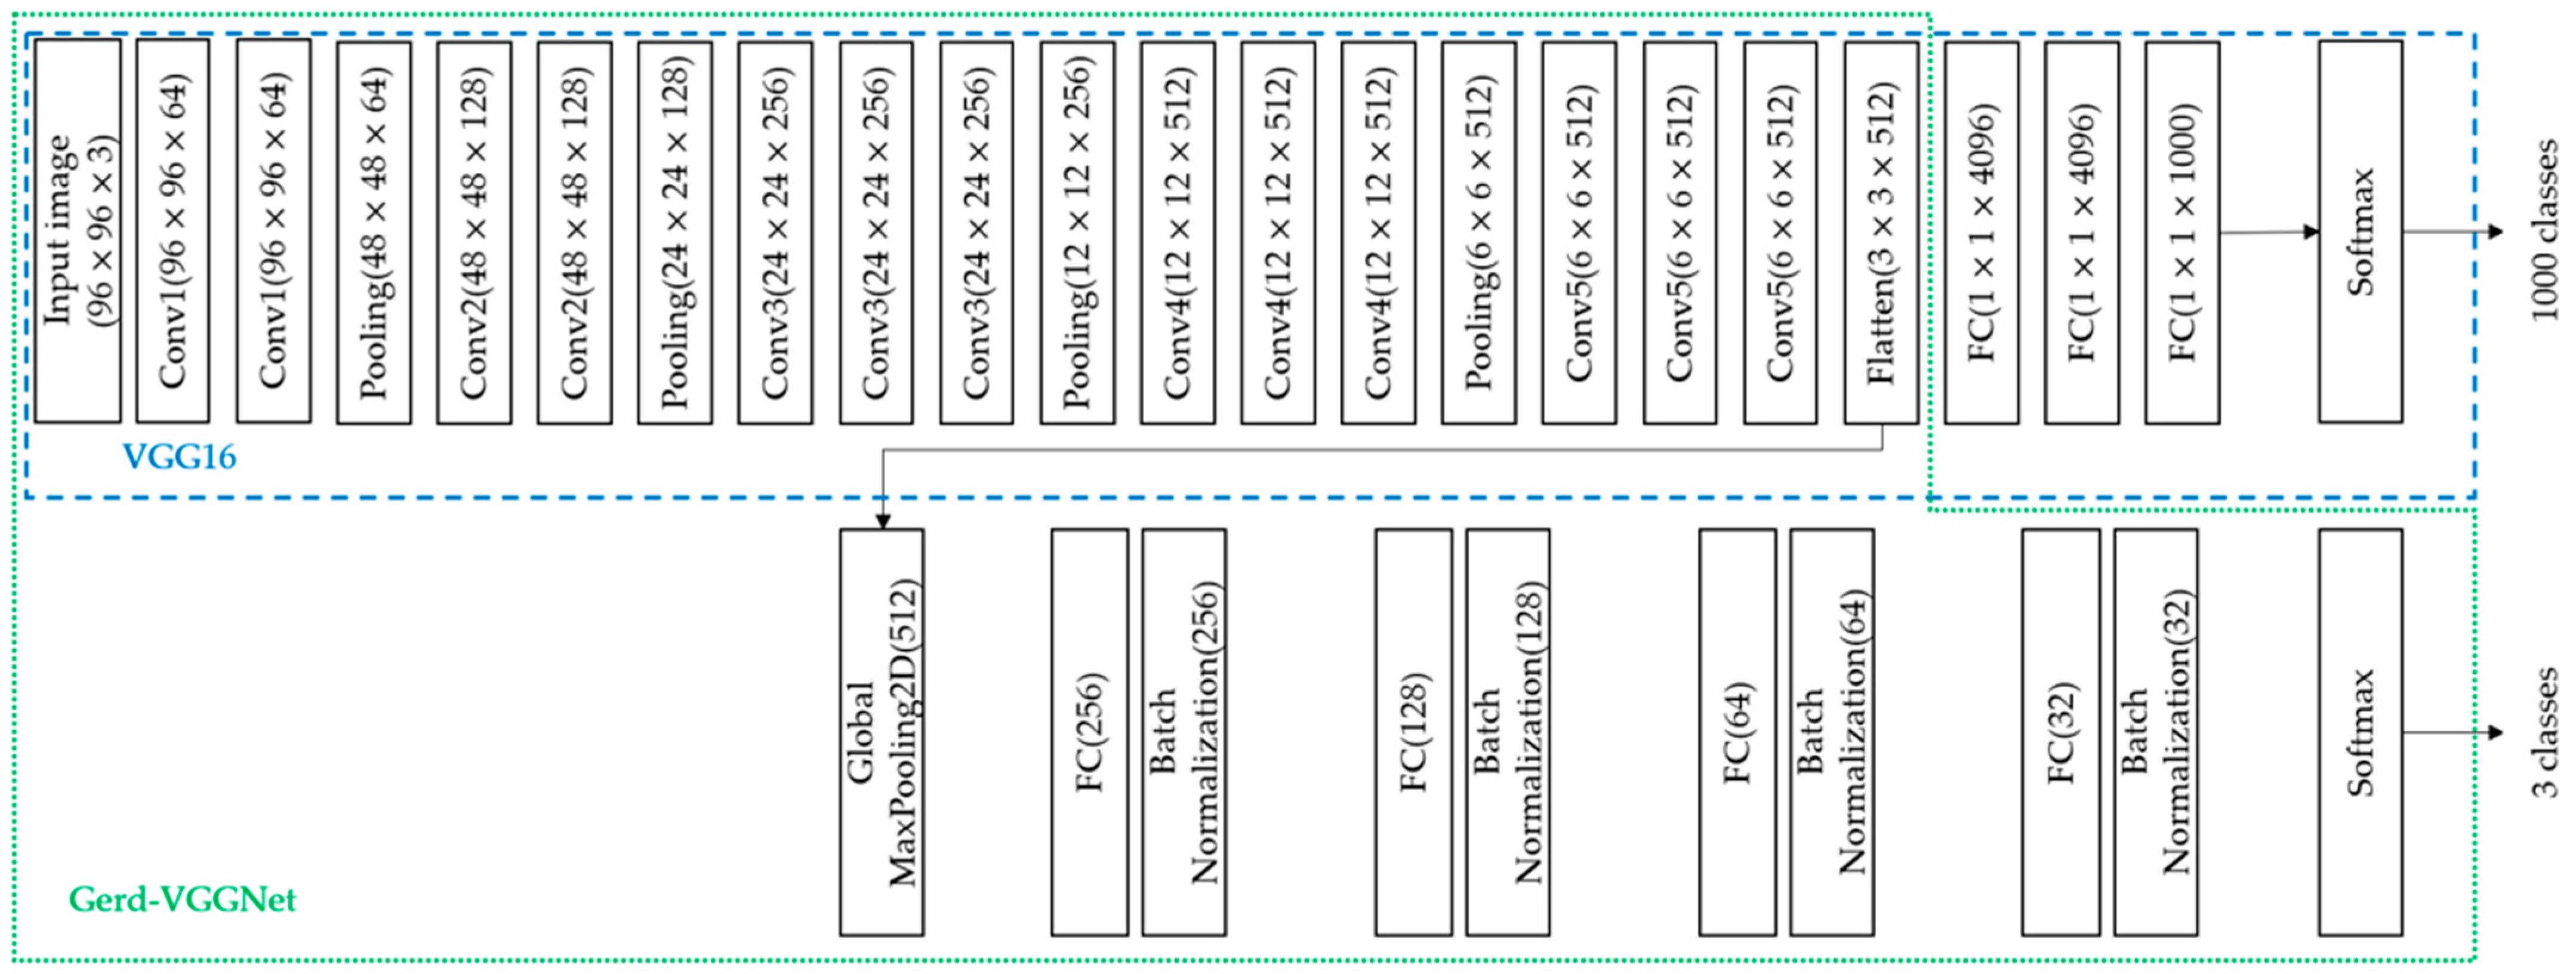
- VGG16: VGG16 is a convolutional neural network model proposed by Simonyan et al. at ILSVRC-2014 [33], which includes 13 convolutional layers, five pooling layers, three fully connected (FC) layers, and finally the softmax layer. This model was used in the classification of the ImageNet dataset. There are a total of 1000 classes, as shown in Figure 1. This study uses this deep learning model to automatically extract 512 image features from a GMP layer automatically.
- (5)
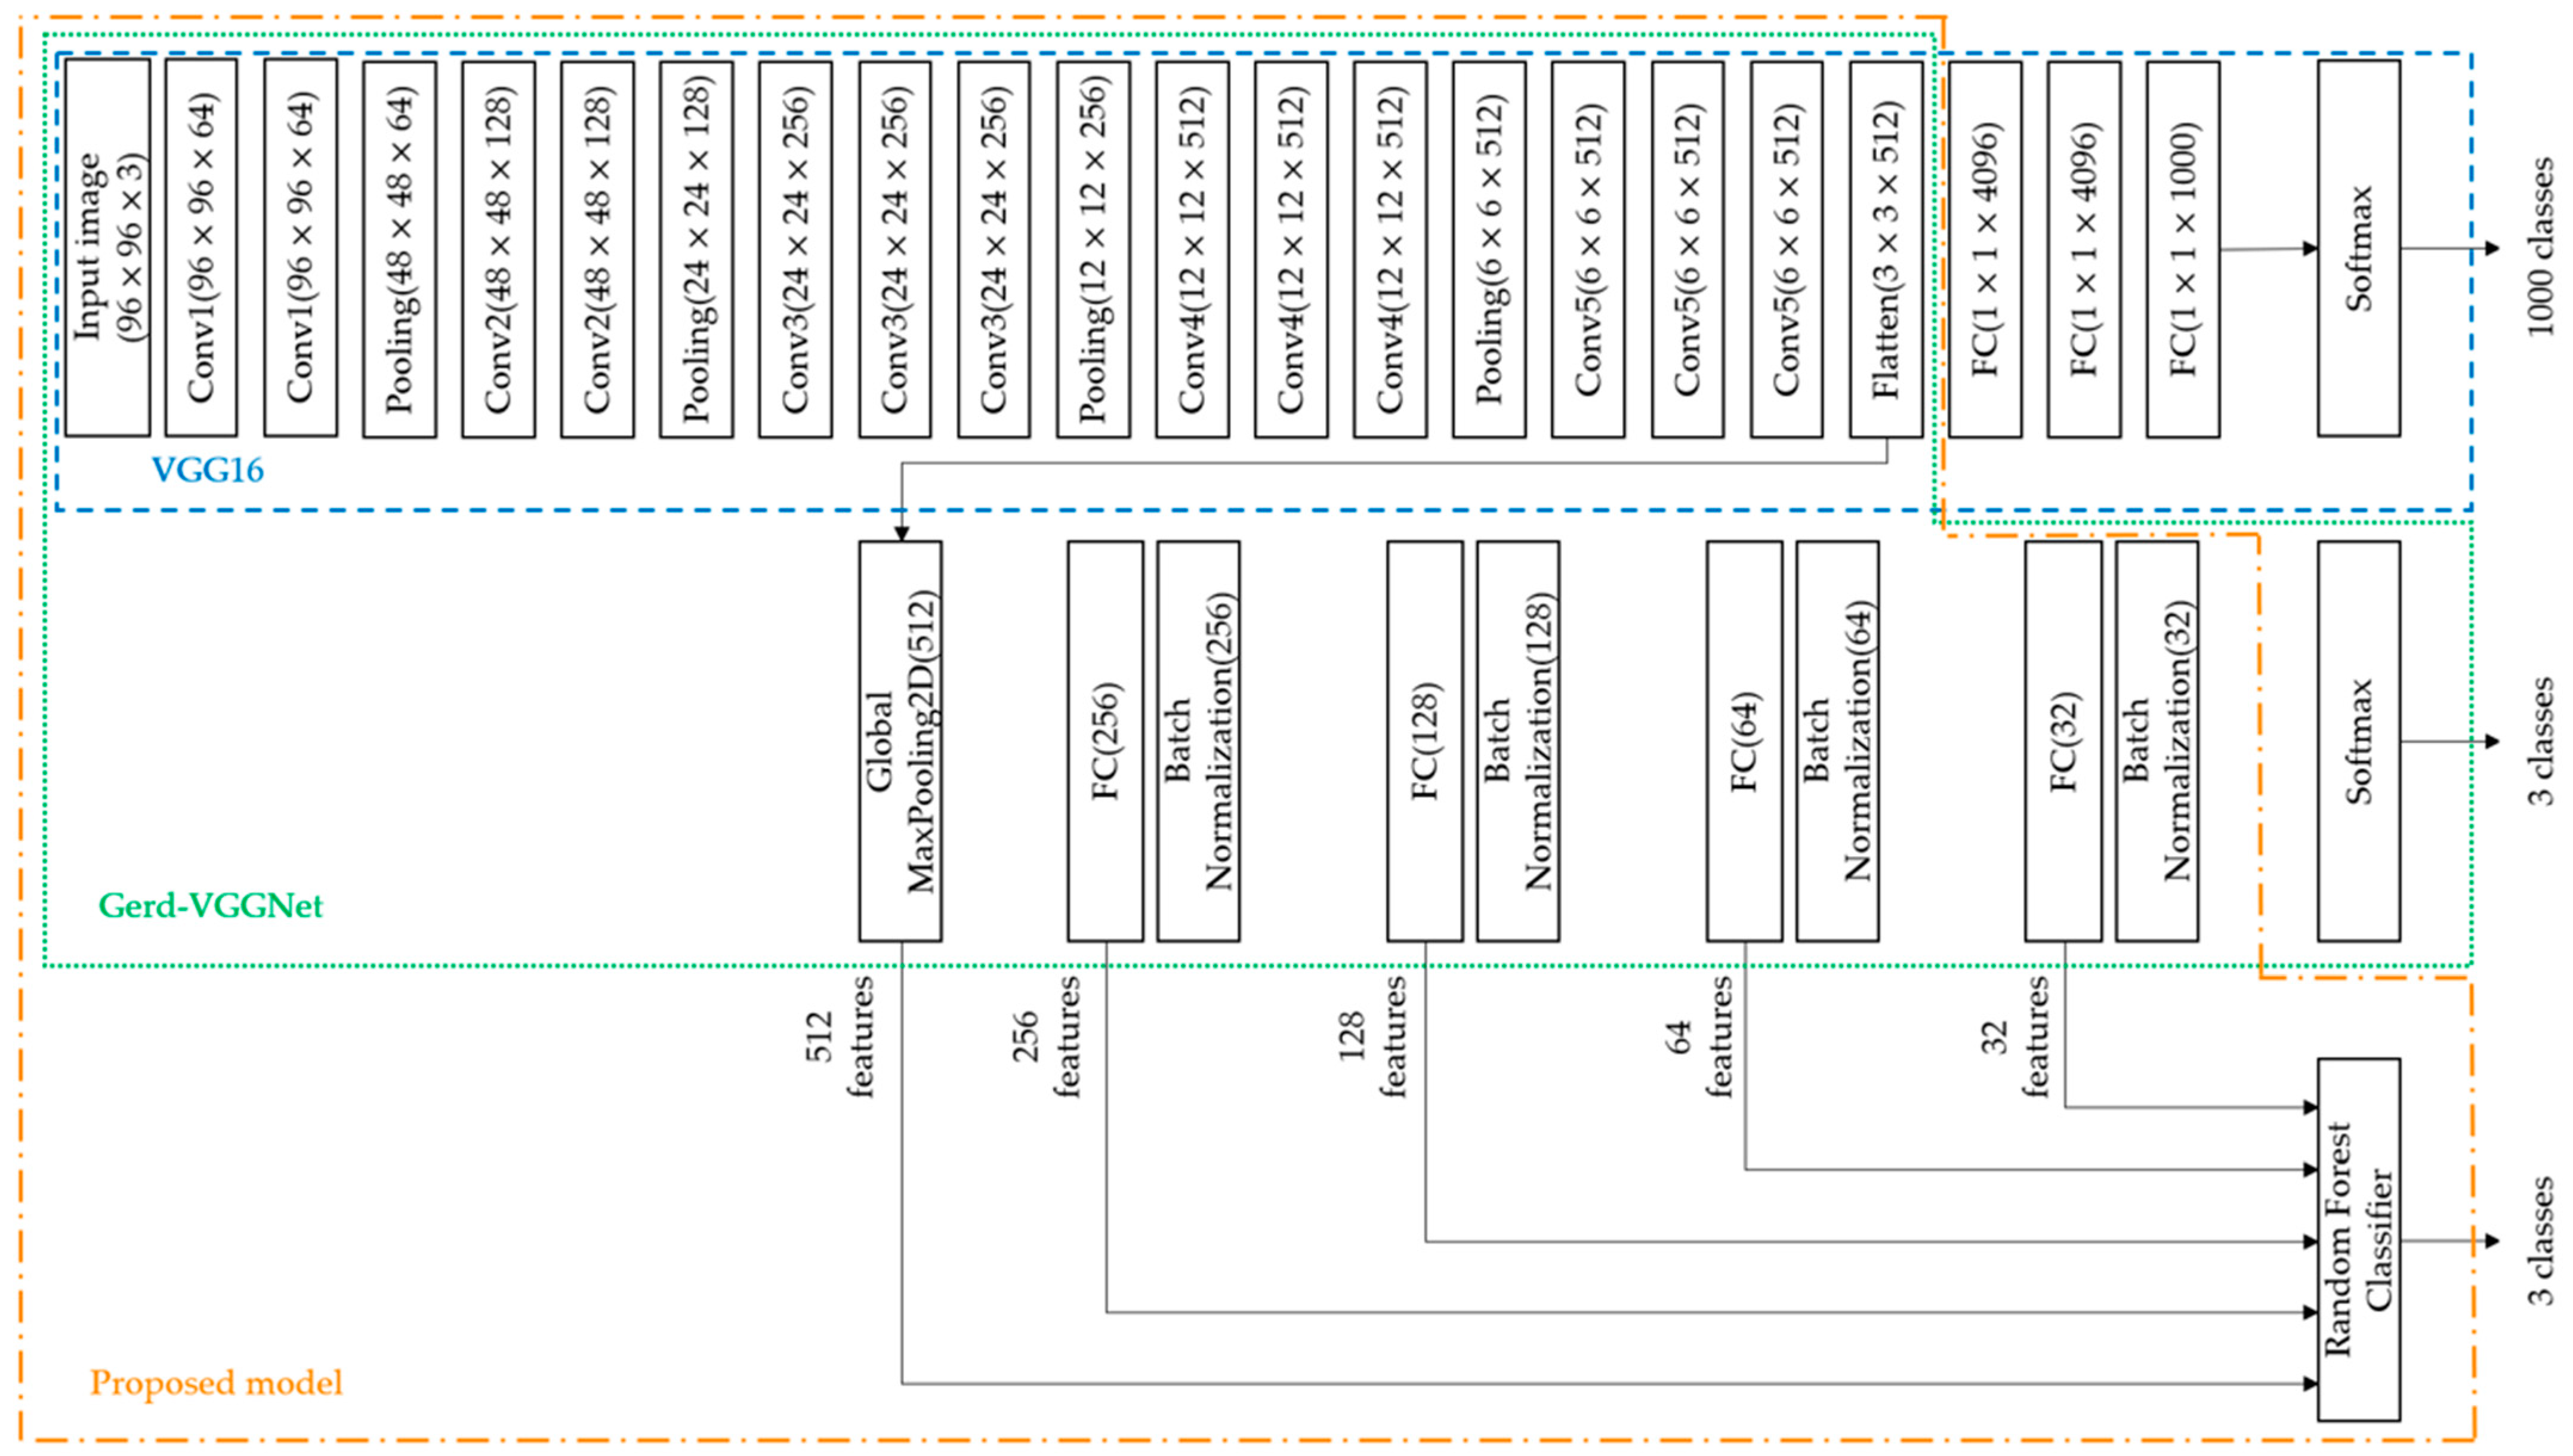
- Gerd-VGGNet: Taking VGG16 as the feature extractor, the classification architecture was designed and fine-tuned for the classification of GERD [20]. In the classification head composed with a GMP layer, a fully connected layer of 256, 128, 64, and 32 nodes and 4 batch normalization layers were added in sequence. Finally, a softmax layer was introduced. The detailed architecture is shown in Figure 1. This study uses this deep learning model to automatically extract 512, 256, 128, 64, and 32 features from the GMP layer and 4 different FC layers, respectively, as shown in Figure 1.

2.3. Random Forest Classifier
2.4. Performance Evaluation
2.5. Cross Validation
2.6. Proposed Framework
3. Experimental Result
3.1. Performance Comparison of Image Feature Extraction Techniques
3.2. Performance Comparison of Machine Learning Algorithms
3.3. Performance Differences in Parameter Optimization of Random Forest Classifier
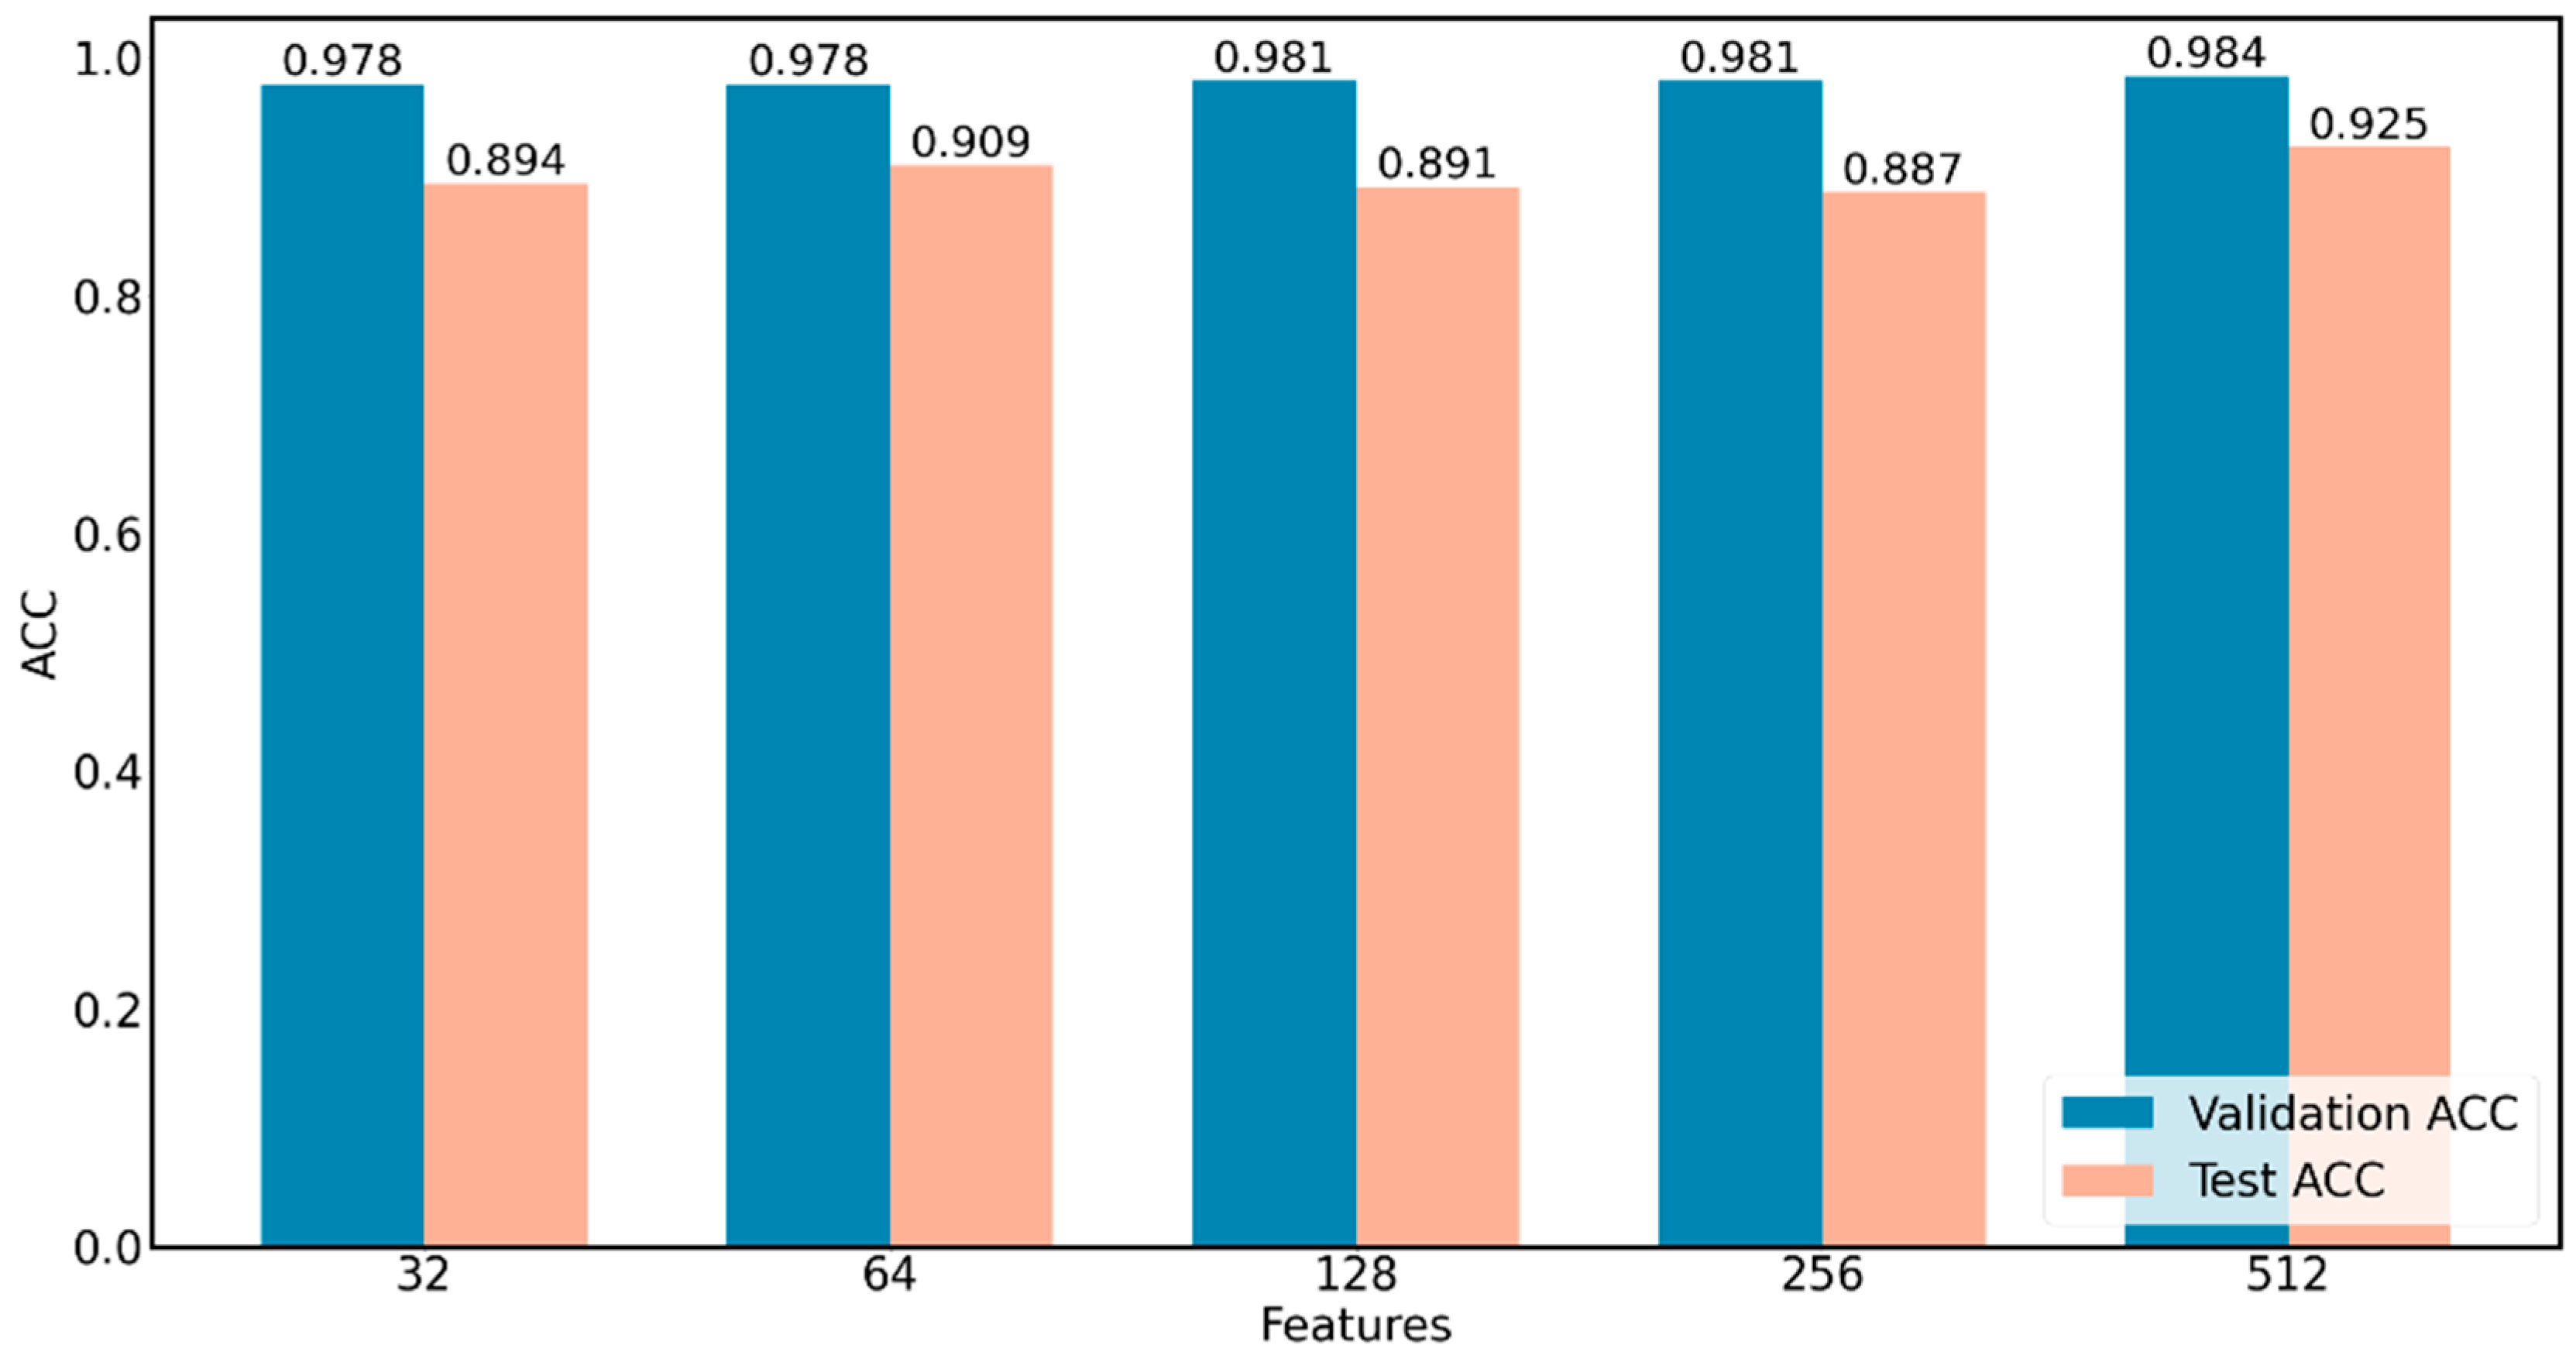
3.4. Performance Comparison of Image Feature Extraction Layers
4. Discussion
4.1. Performance Comparison of Related Literature
4.2. Image Automatic Classification and Interpretation
5. Conclusions
Author Contributions
Funding
Institutional Review Board Statement
Informed Consent Statement
Data Availability Statement
Conflicts of Interest
Abbreviations
| Abbreviation | Name |
| GERD | gastroesophageal reflux disease |
| LA | Los Angeles |
| AI | artificial intelligence |
| QUID | QUEstionario Italiano Diagnostico |
| ANN | artificial neural network |
| RF | Random Forest |
| HHDF-SVM | hierarchical heterogeneous descriptor fusion support vector machine |
| NBI | Narrow Band Imaging |
| FC | Fully Connected |
| GMP | Global Maxinum Pooling |
| Sklearn | Scikit-learn |
| ACC | Accuracy |
| HistGB | Histogram-based Gradient Boosting |
| XGB | eXtreme Gradient Boosting |
| KNN | K-nearest Neighbors |
| Linear SVM | Linear Support Vector Machine |
| RBF SVM | Support Vector Machine with Radial Basis Function kernel |
| MLP | Multi-layer Perceptron |
References
- Yadlapati, R.; Gyawali, C.P.; Pandolfino, J.E.; Chang, K.; Kahrilas, P.J.; Katz, P.O.; Katzka, D.; Komaduri, S.; Lipham, J.; Menard-Katcher, P.; et al. AGA Clinical Practice Update on the Personalized Approach to the Evaluation and Management of GERD: Expert Review. Clin. Gastroenterol. Hepatol. 2022, 20, 984–994.e1. [Google Scholar] [CrossRef] [PubMed]
- Vakil, N.; van Zanten, S.V.; Kahrilas, P.; Dent, J.; Jones, R.; Global Consensus, G. The Montreal definition and classification of gastroesophageal reflux disease: A global evidence-based consensus. Am. J. Gastroenterol. 2006, 101, 1900–1920; quiz 1943. [Google Scholar] [CrossRef] [PubMed]
- Eusebi, L.H.; Ratnakumaran, R.; Yuan, Y.; Solaymani-Dodaran, M.; Bazzoli, F.; Ford, A.C. Global prevalence of, and risk factors for, gastro-oesophageal reflux symptoms: A meta-analysis. Gut 2018, 67, 430–440. [Google Scholar] [CrossRef] [PubMed]
- Balla, A.; Leone, G.; Ribichini, E.; Sacchi, M.C.; Genco, A.; Pronio, A.; Paganini, A.M.; Badiali, D. Gastroesophageal Reflux Disease—Health-Related Quality of Life Questionnaire: Prospective development and validation in Italian. Eur. J. Gastroenterol. Hepatol. 2021, 33, 339–345. [Google Scholar] [CrossRef]
- Katz, P.O.; Dunbar, K.B.; Schnoll-Sussman, F.H.; Greer, K.B.; Yadlapati, R.; Spechler, S.J. ACG Clinical Guideline for the Diagnosis and Management of Gastroesophageal Reflux Disease. Am. J. Gastroenterol. 2022, 117, 27–56. [Google Scholar] [CrossRef]
- Yen, H.H.; Wu, P.Y.; Chen, M.F.; Lin, W.C.; Tsai, C.L.; Lin, K.P. Current Status and Future Perspective of Artificial Intelligence in the Management of Peptic Ulcer Bleeding: A Review of Recent Literature. J. Clin. Med. 2021, 10, 3527. [Google Scholar] [CrossRef]
- Hosny, A.; Parmar, C.; Quackenbush, J.; Schwartz, L.H.; Aerts, H. Artificial intelligence in radiology. Nat. Rev. Cancer 2018, 18, 500–510. [Google Scholar] [CrossRef]
- Zhou, L.Q.; Wang, J.Y.; Yu, S.Y.; Wu, G.G.; Wei, Q.; Deng, Y.B.; Wu, X.L.; Cui, X.W.; Dietrich, C.F. Artificial intelligence in medical imaging of the liver. World J. Gastroenterol. 2019, 25, 672–682. [Google Scholar] [CrossRef]
- Das, N.; Topalovic, M.; Janssens, W. Artificial intelligence in diagnosis of obstructive lung disease: Current status and future potential. Curr. Opin. Pulm. Med. 2018, 24, 117–123. [Google Scholar] [CrossRef]
- Wong, T.Y.; Bressler, N.M. Artificial Intelligence With Deep Learning Technology Looks Into Diabetic Retinopathy Screening. JAMA 2016, 316, 2366–2367. [Google Scholar] [CrossRef]
- Kanagasingam, Y.; Xiao, D.; Vignarajan, J.; Preetham, A.; Tay-Kearney, M.L.; Mehrotra, A. Evaluation of Artificial Intelligence-Based Grading of Diabetic Retinopathy in Primary Care. JAMA Netw. Open 2018, 1, e182665. [Google Scholar] [CrossRef]
- Keel, S.; Lee, P.Y.; Scheetz, J.; Li, Z.; Kotowicz, M.A.; MacIsaac, R.J.; He, M. Feasibility and patient acceptability of a novel artificial intelligence-based screening model for diabetic retinopathy at endocrinology outpatient services: A pilot study. Sci. Rep. 2018, 8, 4330. [Google Scholar] [CrossRef] [PubMed]
- Kumagai, Y.; Takubo, K.; Kawada, K.; Aoyama, K.; Endo, Y.; Ozawa, T.; Hirasawa, T.; Yoshio, T.; Ishihara, S.; Fujishiro, M.; et al. Diagnosis using deep-learning artificial intelligence based on the endocytoscopic observation of the esophagus. Esophagus 2019, 16, 180–187. [Google Scholar] [CrossRef] [PubMed]
- Mori, Y.; Kudo, S.E.; Mohmed, H.E.N.; Misawa, M.; Ogata, N.; Itoh, H.; Oda, M.; Mori, K. Artificial intelligence and upper gastrointestinal endoscopy: Current status and future perspective. Dig. Endosc. 2019, 31, 378–388. [Google Scholar] [CrossRef]
- Chang, Y.Y.; Li, P.C.; Chang, R.F.; Chang, Y.Y.; Huang, S.P.; Chen, Y.Y.; Chang, W.Y.; Yen, H.H. Development and validation of a deep learning-based algorithm for colonoscopy quality assessment. Surg. Endosc. 2022, 36, 6446–6455. [Google Scholar] [CrossRef] [PubMed]
- Chang, Y.Y.; Yen, H.H.; Li, P.C.; Chang, R.F.; Yang, C.W.; Chen, Y.Y.; Chang, W.Y. Upper endoscopy photodocumentation quality evaluation with novel deep learning system. Dig. Endosc. 2022, 34, 994–1001. [Google Scholar] [CrossRef]
- Yen, H.-H.; Wu, P.-Y.; Su, P.-Y.; Yang, C.-W.; Chen, Y.-Y.; Chen, M.-F.; Lin, W.-C.; Tsai, C.-L.; Lin, K.-P. Performance Comparison of the Deep Learning and the Human Endoscopist for Bleeding Peptic Ulcer Disease. J. Med. Biol. Eng. 2021, 41, 504–513. [Google Scholar] [CrossRef]
- Pace, F.; Riegler, G.; de Leone, A.; Pace, M.; Cestari, R.; Dominici, P.; Grossi, E. Is it possible to clinically differentiate erosive from nonerosive reflux disease patients? A study using an artificial neural networks-assisted algorithm. Eur. J. Gastroenterol. Hepatol. 2010, 22, 1163–1168. [Google Scholar] [CrossRef] [PubMed]
- Huang, C.R.; Chen, Y.T.; Chen, W.Y.; Cheng, H.C.; Sheu, B.S. Gastroesophageal Reflux Disease Diagnosis Using Hierarchical Heterogeneous Descriptor Fusion Support Vector Machine. IEEE Trans. Biomed. Eng. 2016, 63, 588–599. [Google Scholar] [CrossRef]
- Wang, C.-C.; Chiu, Y.-C.; Chen, W.-L.; Yang, T.-W.; Tsai, M.-C.; Tseng, M.-H. A deep learning model for classification of endoscopic gastroesophageal reflux disease. Int. J. Environ. Public Health Res. 2021, 18, 2428. [Google Scholar] [CrossRef]
- Pan, S.J.; Yang, Q. A survey on transfer learning. IEEE Trans. Knowl. Data Eng. 2010, 22, 1345–1359. [Google Scholar] [CrossRef]
- Deng, J.; Dong, W.; Socher, R.; Li, L.-J.; Li, K.; Fei-Fei, L. Imagenet: A large-scale hierarchical image database. In Proceedings of the 2009 IEEE Conference on Computer Vision and Pattern Recognition, Miami, FL, USA, 20–25 June 2009; pp. 248–255. [Google Scholar]
- Fan, J.; Lee, J.; Lee, Y. A transfer learning architecture based on a support vector machine for histopathology image classification. Appl. Sci. 2021, 11, 6380. [Google Scholar] [CrossRef]
- Chang, C.-C.; Li, Y.-Z.; Wu, H.-C.; Tseng, M.-H. Melanoma Detection Using XGB Classifier Combined with Feature Extraction and K-Means SMOTE Techniques. Diagnostics 2022, 12, 1747. [Google Scholar] [CrossRef] [PubMed]
- Yadav, N.; Alfayeed, S.M.; Khamparia, A.; Pandey, B.; Thanh, D.N.; Pande, S. HSV model-based segmentation driven facial acne detection using deep learning. Expert Syst. 2022, 39, e12760. [Google Scholar] [CrossRef]
- Sharma, P.; Wani, S.; Bansal, A.; Hall, S.; Puli, S.; Mathur, S.; Rastogi, A. A feasibility trial of narrow band imaging endoscopy in patients with gastroesophageal reflux disease. Gastroenterology 2007, 133, 454–464; quiz 674. [Google Scholar] [CrossRef]
- Gawron, A.J.; Hirano, I. Advances in diagnostic testing for gastroesophageal reflux disease. World J. Gastroenterol. 2010, 16, 3750–3756. [Google Scholar] [CrossRef]
- Fock, K.M.; Teo, E.K.; Ang, T.L.; Tan, J.Y.; Law, N.M. The utility of narrow band imaging in improving the endoscopic diagnosis of gastroesophageal reflux disease. Clin. Gastroenterol. Hepatol. 2009, 7, 54–59. [Google Scholar] [CrossRef]
- Dent, J. Microscopic esophageal mucosal injury in nonerosive reflux disease. Clin. Gastroenterol. Hepatol. 2007, 5, 4–16. [Google Scholar] [CrossRef]
- Tan, M.; Le, Q. Efficientnet: Rethinking model scaling for convolutional neural networks. In Proceedings of the International Conference on Machine Learning, Long Beach, CA, USA, 9–15 June 2019; pp. 6105–6114. [Google Scholar]
- He, K.; Zhang, X.; Ren, S.; Sun, J. Deep residual learning for image recognition. In Proceedings of the IEEE Conference on Computer Vision and Pattern Recognition, Las Vegas, NV, USA, 27–30 June 2016; pp. 770–778. [Google Scholar]
- Szegedy, C.; Ioffe, S.; Vanhoucke, V.; Alemi, A.A. Inception-v4, inception-resnet and the impact of residual connections on learning. In Proceedings of the Thirty-First AAAI Conference on Artificial Intelligence, San Francisco, CA, USA, 4–9 February 2017. [Google Scholar]
- Simonyan, K.; Zisserman, A. Very deep convolutional networks for large-scale image recognition. arXiv 2014. [Google Scholar] [CrossRef]
- Breiman, L. Random forests. Mach. Learn. 2001, 45, 5–32. [Google Scholar] [CrossRef]
- Pedregosa, F.; Varoquaux, G.; Gramfort, A.; Michel, V.; Thirion, B.; Grisel, O.; Blondel, M.; Prettenhofer, P.; Weiss, R.; Dubourg, V. Scikit-learn: Machine learning in Python. J. Mach. Learn. Res. 2011, 12, 2825–2830. [Google Scholar]


| Model | Features | Training | Validation | Test | |||
|---|---|---|---|---|---|---|---|
| Accuracy | Kappa | Accuracy | Kappa | Accuracy | Kappa | ||
| EfficientNetB7 | - | 0.348 ± 0.027 | 0.000 ± 0.000 | 0.349 ± 0.026 | 0.000 ± 0.000 | 0.347 ± 0.082 | −0.016 ± 0.123 |
| ResNet50 | - | 0.480 ± 0.015 | 0.208 ± 0.024 | 0.478 ± 0.070 | 0.206 ± 0.108 | 0.369 ± 0.027 | 0.016 ± 0.041 |
| InceptionResNetV2 | - | 0.789 ± 0.016 | 0.682 ± 0.024 | 0.687 ± 0.036 | 0.530 ± 0.054 | 0.556 ± 0.056 | 0.329 ± 0.083 |
| VGG16 | - | 0.681 ± 0.013 | 0.520 ± 0.019 | 0.653 ± 0.042 | 0.479 ± 0.064 | 0.503 ± 0.053 | 0.254 ± 0.080 |
| Gerd- InceptionResNetV2 | - | 0.999 ± 0.001 | 0.999 ± 0.001 | 0.879 ± 0.022 | 0.818 ± 0.033 | 0.684 ± 0.051 | 0.520 ± 0.078 |
| Gerd-VGGNet | - | 0.999 ± 0.001 | 0.999 ± 0.001 | 0.903 ± 0.022 | 0.854 ± 0.034 | 0.737 ± 0.037 | 0.603 ± 0.057 |
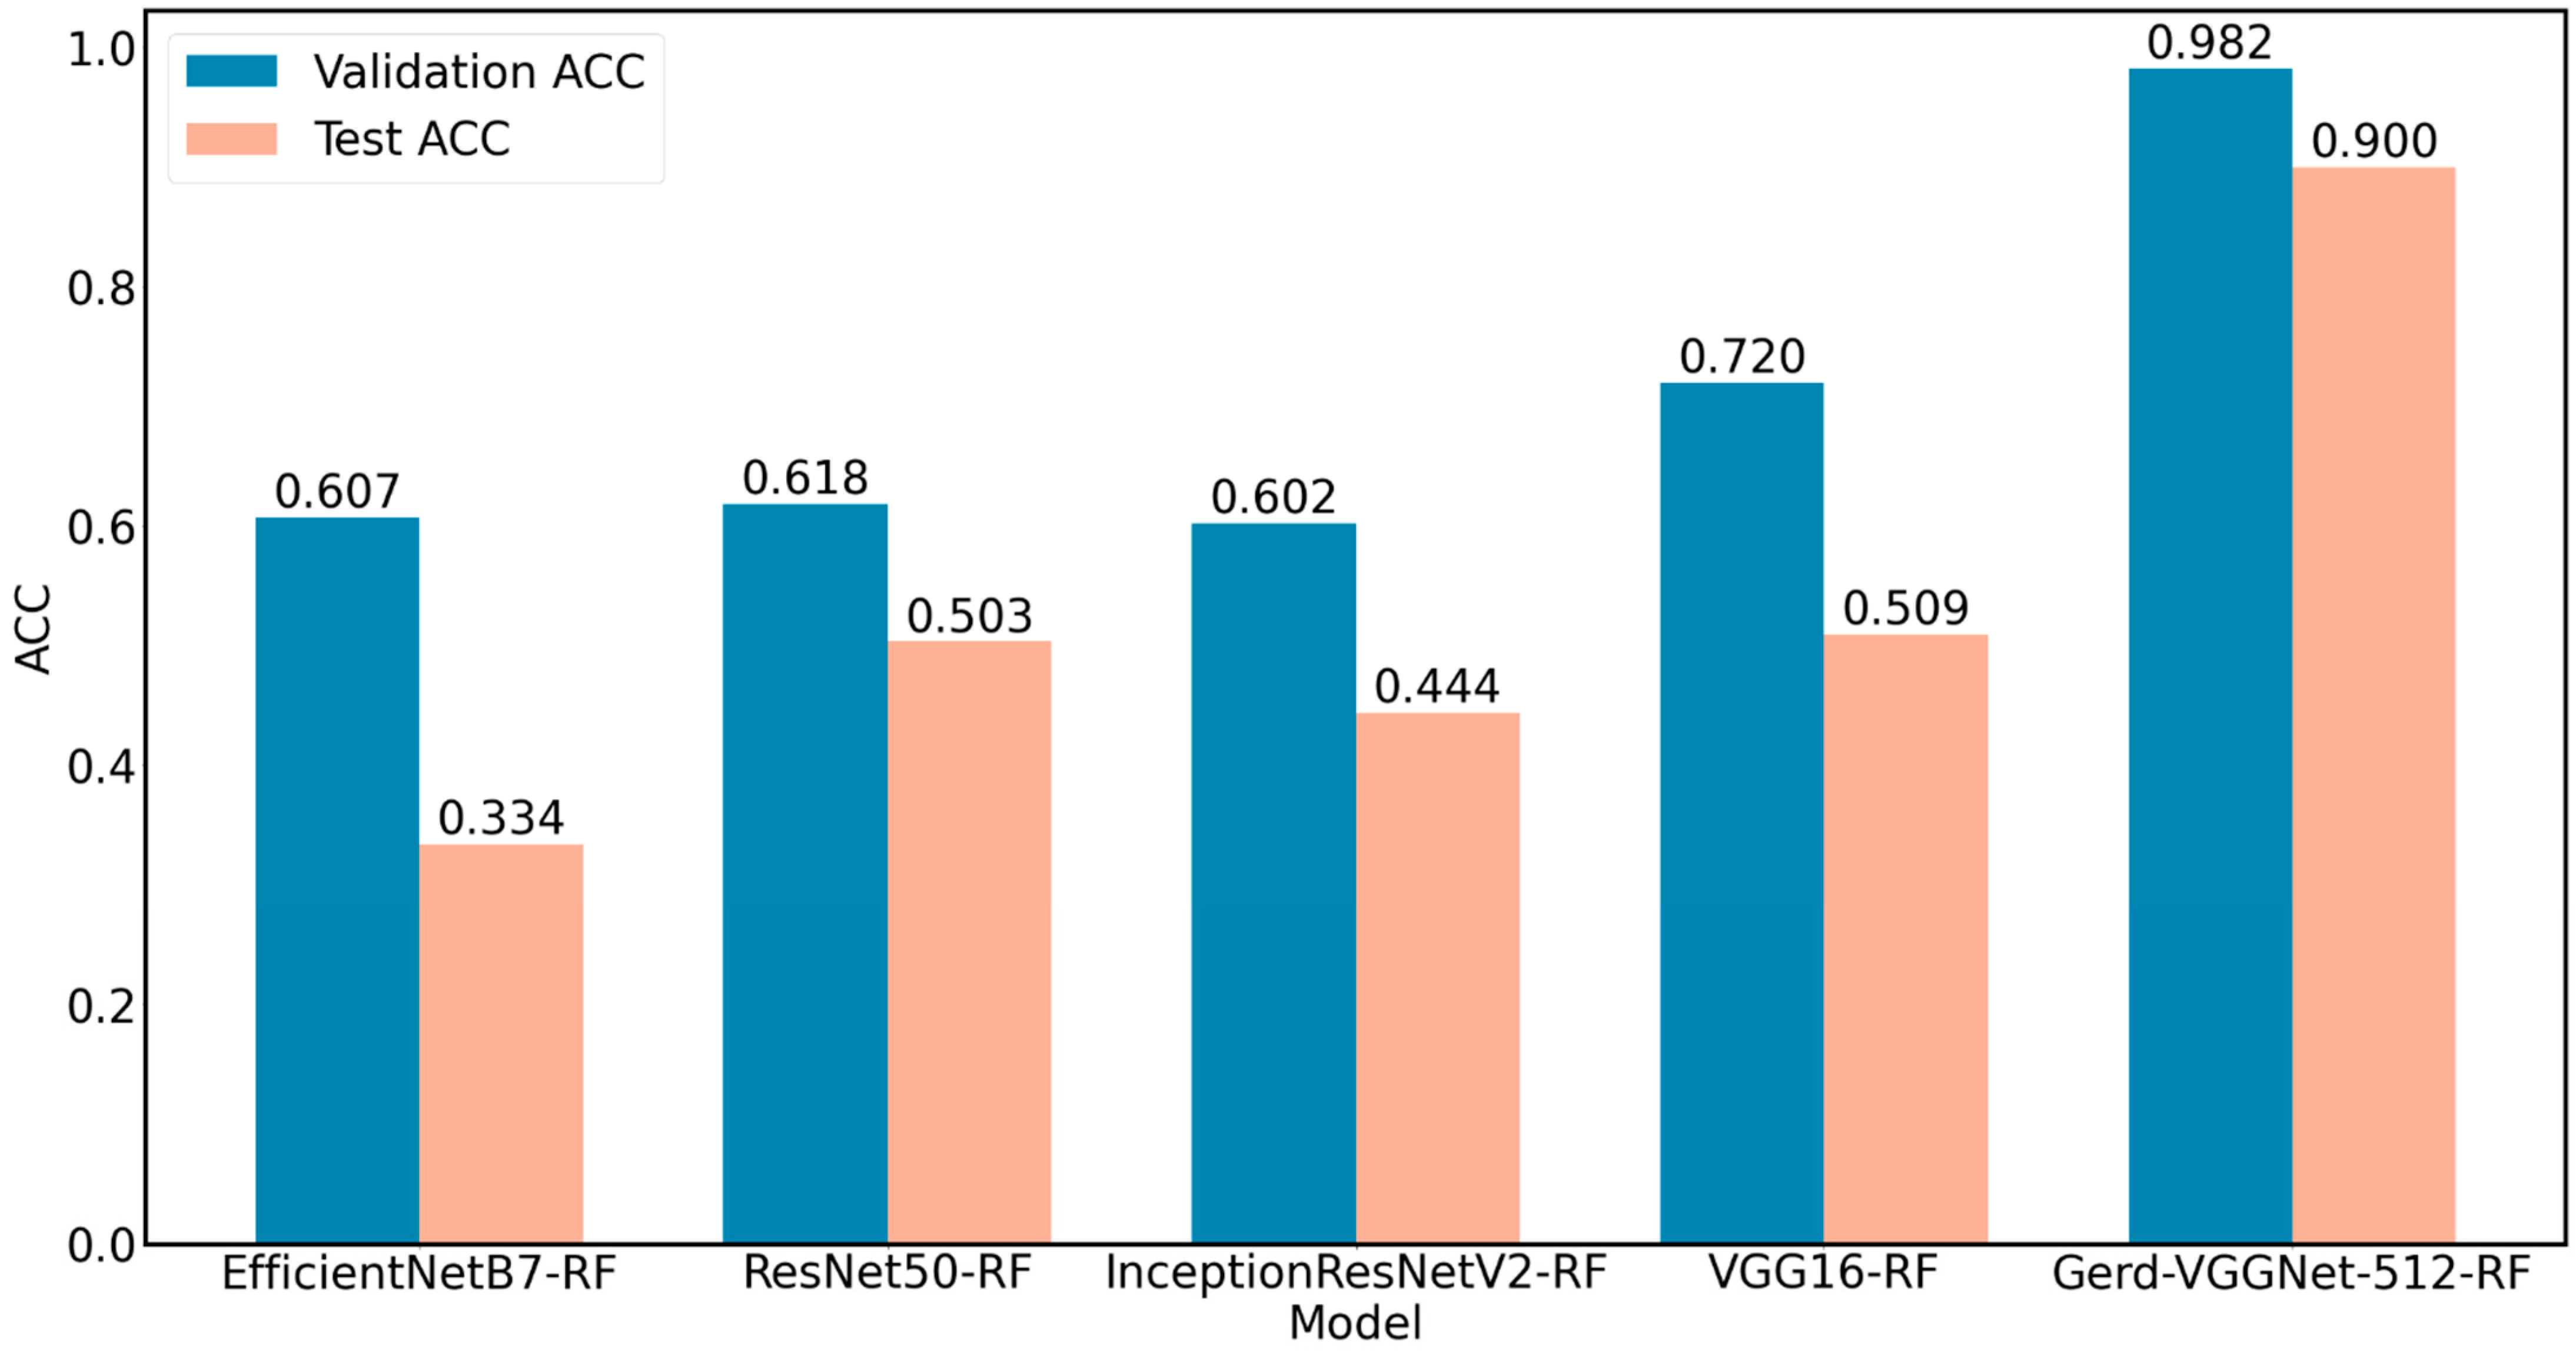
| EfficientNetB7-RF | 2560 | 1.000 ± 0.000 | 1.000 ± 0.000 | 0.607 ± 0.045 | 0.407 ± 0.068 | 0.334 ± 0.037 | −0.026 ± 0.057 |
| ResNet50-RF | 2048 | 1.000 ± 0.000 | 1.000 ± 0.000 | 0.618 ± 0.076 | 0.422 ± 0.114 | 0.503 ± 0.033 | 0.235 ± 0.052 |
| InceptionResNetV2-RF | 1536 | 1.000 ± 0.000 | 1.000 ± 0.000 | 0.602 ± 0.019 | 0.397 ± 0.028 | 0.444 ± 0.057 | 0.164 ± 0.085 |
| VGG16-RF | 512 | 1.000 ± 0.000 | 1.000 ± 0.000 | 0.720 ± 0.049 | 0.577 ± 0.074 | 0.509 ± 0.061 | 0.255 ± 0.093 |
| GerdNet-RF | 512 | 1.000 ± 0.000 | 1.000 ± 0.000 | 0.982 ± 0.017 | 0.973 ± 0.026 | 0.900 ± 0.013 | 0.851 ± 0.019 |
| Classifier | Training | Validation | Test | |||
|---|---|---|---|---|---|---|
| Accuracy | Kappa | Accuracy | Kappa | Accuracy | Kappa | |
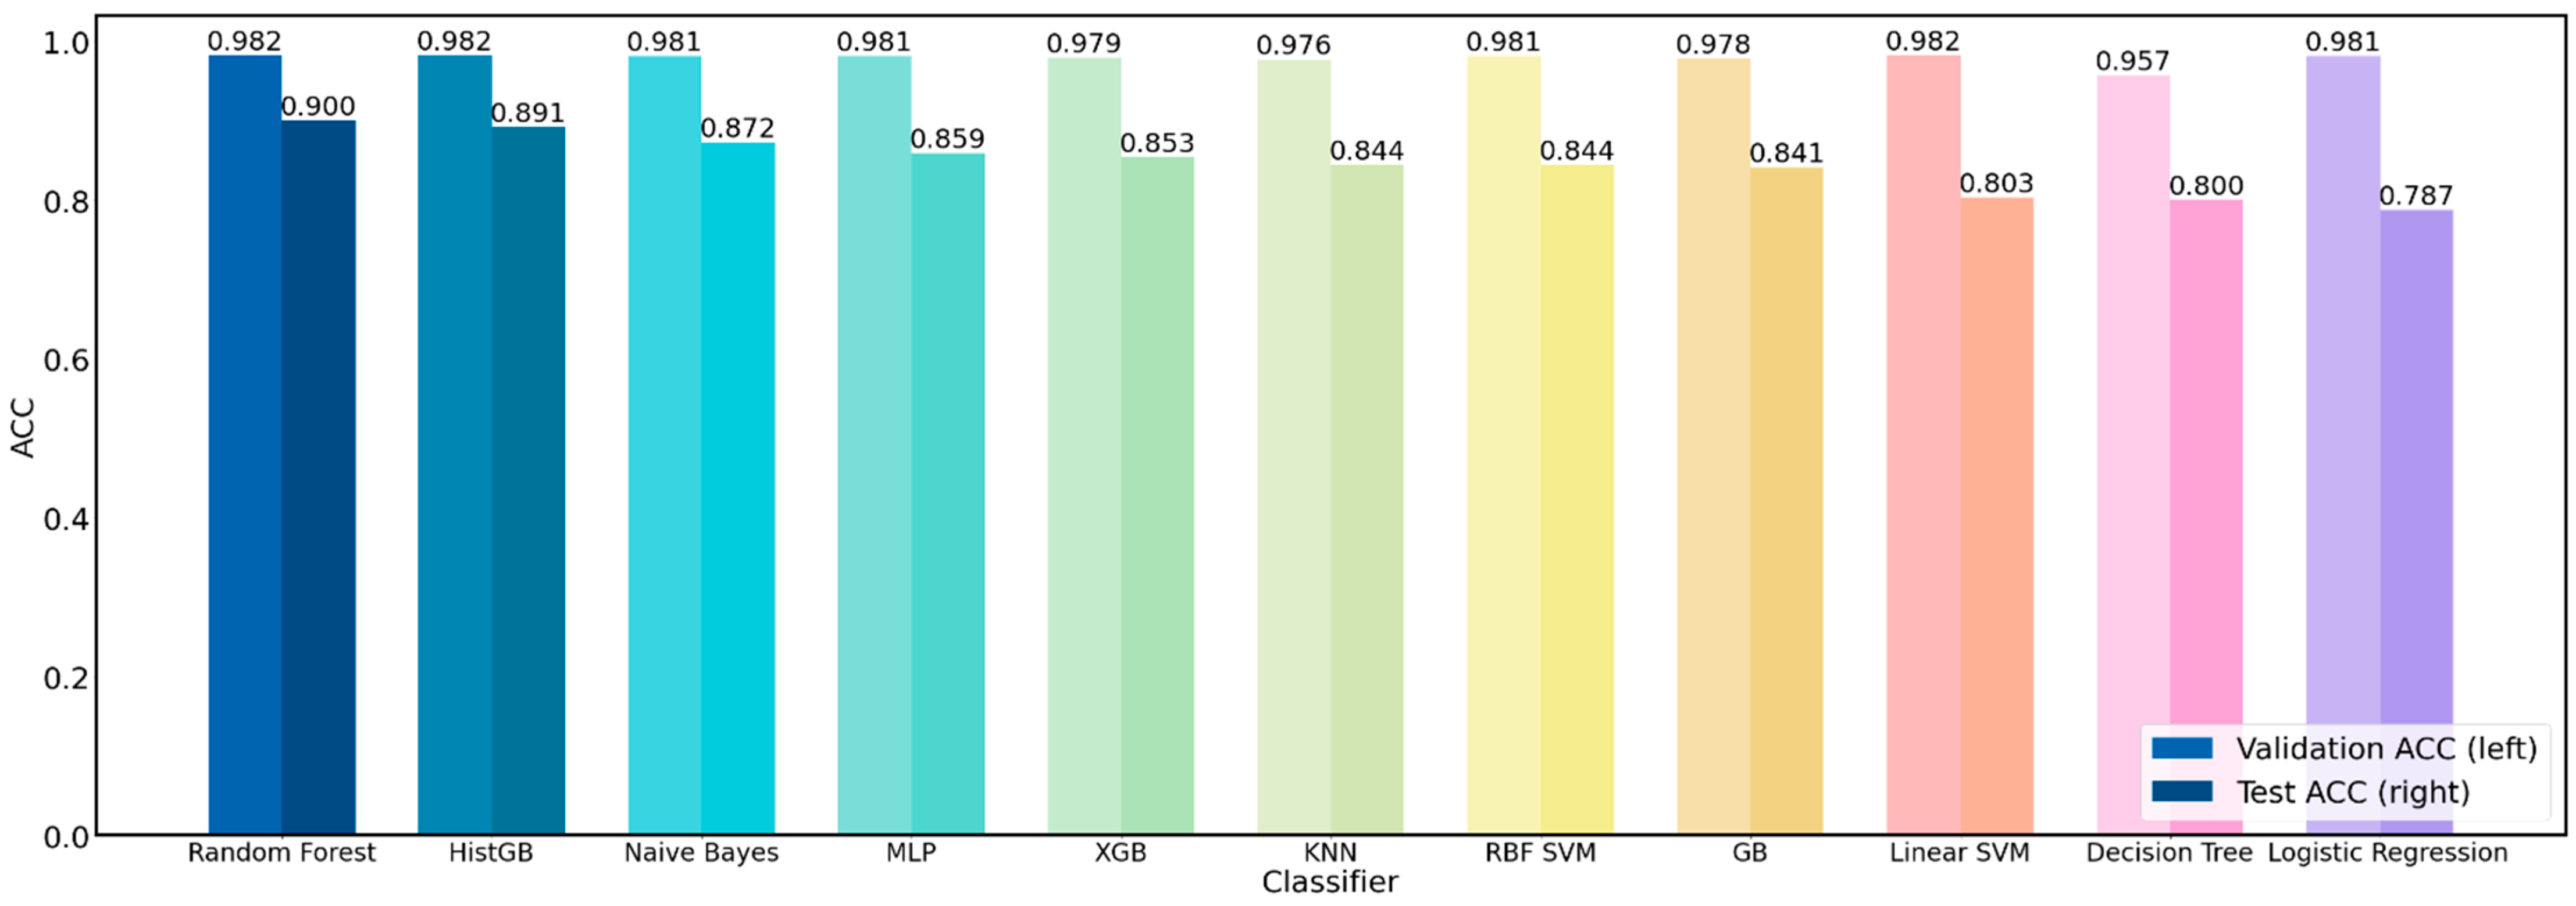
| Random Forest | 1.000 ± 0.000 | 1.000 ± 0.000 | 0.982 ± 0.017 | 0.973 ± 0.026 | 0.900 ± 0.013 | 0.851 ± 0.019 |
| HistGB | 1.000 ± 0.000 | 1.000 ± 0.000 | 0.982 ± 0.013 | 0.973 ± 0.020 | 0.891 ± 0.021 | 0.836 ± 0.031 |
| Naive Bayes | 0.984 ± 0.002 | 0.976 ± 0.003 | 0.981 ± 0.013 | 0.971 ± 0.020 | 0.872 ± 0.009 | 0.809 ± 0.014 |
| MLP | 0.982 ± 0.003 | 0.973 ± 0.004 | 0.981 ± 0.018 | 0.971 ± 0.027 | 0.859 ± 0.047 | 0.790 ± 0.070 |
| XGB | 1.000 ± 0.000 | 1.000 ± 0.000 | 0.979 ± 0.017 | 0.969 ± 0.025 | 0.853 ± 0.034 | 0.781 ± 0.051 |
| KNN | 0.982 ± 0.003 | 0.973 ± 0.004 | 0.976 ± 0.015 | 0.964 ± 0.023 | 0.844 ± 0.000 | 0.765 ± 0.001 |
| RBF SVM | 0.982 ± 0.002 | 0.974 ± 0.003 | 0.981 ± 0.018 | 0.971 ± 0.027 | 0.844 ± 0.014 | 0.766 ± 0.021 |
| GB | 1.000 ± 0.000 | 1.000 ± 0.000 | 0.978 ± 0.017 | 0.966 ± 0.025 | 0.841 ± 0.033 | 0.762 ± 0.048 |
| Linear SVM | 0.997 ± 0.001 | 0.995 ± 0.002 | 0.982 ± 0.017 | 0.973 ± 0.026 | 0.803 ± 0.014 | 0.705 ± 0.021 |
| Decision Tree | 1.000 ± 0.000 | 1.000 ± 0.000 | 0.957 ± 0.028 | 0.935 ± 0.042 | 0.800 ± 0.051 | 0.701 ± 0.075 |
| Logistic Regression | 0.994 ± 0.001 | 0.991 ± 0.002 | 0.981 ± 0.022 | 0.971 ± 0.033 | 0.787 ± 0.019 | 0.682 ± 0.028 |
| Name of Experiment | Number of Estimators | Max Depth | Random State | Max Features | Training | Validation | Test | |||
|---|---|---|---|---|---|---|---|---|---|---|
| Accuracy | Kappa | Accuracy | Kappa | Accuracy | Kappa | |||||
| Default | 100 | None | 1 | sqrt | 1.000 ± 0.000 | 1.000 ± 0.000 | 0.982 ± 0.017 | 0.973 ± 0.026 | 0.900 ± 0.013 | 0.851 ± 0.019 |
| Tuning 1 | 200 | None | 1 | sqrt | 1.000 ± 0.000 | 1.000 ± 0.000 | 0.982 ± 0.017 | 0.973 ± 0.026 | 0.909 ± 0.009 | 0.865 ± 0.014 |
| Tuning 2 | 300 | None | 1 | sqrt | 1.000 ± 0.000 | 1.000 ± 0.000 | 0.982 ± 0.017 | 0.973 ± 0.026 | 0.909 ± 0.009 | 0.865 ± 0.014 |
| Tuning 3 | 400 | None | 1 | sqrt | 1.000 ± 0.000 | 1.000 ± 0.000 | 0.982 ± 0.017 | 0.973 ± 0.026 | 0.909 ± 0.009 | 0.865 ± 0.014 |
| Tuning 4 | 200 | 16 | 1 | sqrt | 1.000 ± 0.000 | 1.000 ± 0.000 | 0.982 ± 0.017 | 0.973 ± 0.026 | 0.909 ± 0.009 | 0.865 ± 0.014 |
| Tuning 5 | 200 | 8 | 1 | sqrt | 1.000 ± 0.000 | 1.000 ± 0.000 | 0.982 ± 0.017 | 0.973 ± 0.026 | 0.909 ± 0.009 | 0.865 ± 0.014 |
| Tuning 6 | 200 | 4 | 1 | sqrt | 0.992 ± 0.002 | 0.988 ± 0.003 | 0.982 ± 0.017 | 0.973 ± 0.026 | 0.912 ± 0.012 | 0.869 ± 0.019 |
| Tuning 7 | 200 | 4 | 1 | log2 | 0.990 ± 0.002 | 0.985 ± 0.003 | 0.984 ± 0.018 | 0.975 ± 0.027 | 0.906 ± 0.020 | 0.860 ± 0.030 |
| Tuning 8 | 200 | 4 | 81 | sqrt | 0.992 ± 0.002 | 0.988 ± 0.003 | 0.982 ± 0.017 | 0.973 ± 0.026 | 0.912 ± 0.012 | 0.869 ± 0.019 |
| Tuning 9 | 200 | 4 | 81 | log2 | 0.991 ± 0.001 | 0.986 ± 0.002 | 0.984 ± 0.014 | 0.975 ± 0.021 | 0.925 ± 0.021 | 0.888 ± 0.031 |
| Features | Training | Validation | Test | |||
|---|---|---|---|---|---|---|
| Accuracy | Kappa | Accuracy | Kappa | Accuracy | Kappa | |
| 32 | 0.994 ± 0.002 | 0.990 ± 0.002 | 0.978 ± 0.012 | 0.966 ± 0.018 | 0.894 ± 0.021 | 0.841 ± 0.031 |
| 64 | 0.993 ± 0.001 | 0.989 ± 0.001 | 0.978 ± 0.012 | 0.966 ± 0.018 | 0.909 ± 0.026 | 0.864 ± 0.039 |
| 128 | 0.993 ± 0.001 | 0.990 ± 0.002 | 0.981 ± 0.012 | 0.971 ± 0.018 | 0.891 ± 0.029 | 0.835 ± 0.044 |
| 256 | 0.993 ± 0.001 | 0.989 ± 0.002 | 0.981 ± 0.012 | 0.971 ± 0.018 | 0.887 ± 0.032 | 0.831 ± 0.048 |
| 512 | 0.991 ± 0.001 | 0.986 ± 0.002 | 0.984 ± 0.014 | 0.975 ± 0.021 | 0.925 ± 0.021 | 0.888 ± 0.031 |
| Task | Algorithm | Data Used | Evaluation Method | Overall Accuracy | Test Accuracy |
|---|---|---|---|---|---|
| Binary classification | Machine learning (ANN) [18] | QUID 1 questionnaire (577 GERD 2 patients, 94 normal cases) | hold-out | 99.2% | NA |
| Binary classification | Machine learning (HHDF-SVM) [19] | 147 RGB images (39 GERD patients, 108 normal cases) | 10-fold cross-validation | 93.2% | NA |
| 3-class classification | Deep learning (Gerd-VGGNet) [20] | 671 NBI 3 images (GERD A–B: GERD C–D: normal EC-J = 244:229:198) | 10-fold cross-validation | 98.9% ± 0.5% | 78.8% ± 8.5% |
| 3-class classification | Deep learning + Machine learning (proposed GerdNet-RF) | 671 NBI 3 images (GERD A–B: GERD C–D: normal EC-J = 244:229:198) | 10-fold cross-validation | 99.0% ± 0.1% | 92.5% ± 2.1% |
| Image | GERD Endoscopy Grading | Gerd-VGGNet | GerdNet-RF |
|---|---|---|---|
 | LA grade A–B | LA grade A–B | LA grade A–B |
 | LA grade C–D | LA grade C–D | LA grade C–D |
 | LA grade normal | LA grade normal | LA grade normal |
| Image | GERD Endoscopy Grading | Gerd-VGGNet | GerdNet-RF |
|---|---|---|---|
 | LA grade A–B | LA grade C–D | LA grade C–D |
 | LA grade A–B | LA grade C–D | LA grade A–B |
 | LA grade normal | LA grade C–D | LA grade normal |
Publisher’s Note: MDPI stays neutral with regard to jurisdictional claims in published maps and institutional affiliations. |
© 2022 by the authors. Licensee MDPI, Basel, Switzerland. This article is an open access article distributed under the terms and conditions of the Creative Commons Attribution (CC BY) license (https://creativecommons.org/licenses/by/4.0/).
Share and Cite
Yen, H.-H.; Tsai, H.-Y.; Wang, C.-C.; Tsai, M.-C.; Tseng, M.-H. An Improved Endoscopic Automatic Classification Model for Gastroesophageal Reflux Disease Using Deep Learning Integrated Machine Learning. Diagnostics 2022, 12, 2827. https://doi.org/10.3390/diagnostics12112827
Yen H-H, Tsai H-Y, Wang C-C, Tsai M-C, Tseng M-H. An Improved Endoscopic Automatic Classification Model for Gastroesophageal Reflux Disease Using Deep Learning Integrated Machine Learning. Diagnostics. 2022; 12(11):2827. https://doi.org/10.3390/diagnostics12112827
Chicago/Turabian StyleYen, Hsu-Heng, Hui-Yu Tsai, Chi-Chih Wang, Ming-Chang Tsai, and Ming-Hseng Tseng. 2022. "An Improved Endoscopic Automatic Classification Model for Gastroesophageal Reflux Disease Using Deep Learning Integrated Machine Learning" Diagnostics 12, no. 11: 2827. https://doi.org/10.3390/diagnostics12112827
APA StyleYen, H.-H., Tsai, H.-Y., Wang, C.-C., Tsai, M.-C., & Tseng, M.-H. (2022). An Improved Endoscopic Automatic Classification Model for Gastroesophageal Reflux Disease Using Deep Learning Integrated Machine Learning. Diagnostics, 12(11), 2827. https://doi.org/10.3390/diagnostics12112827