
Can Peri-Implant Marginal Bone Loss Progression and a-MMP-8 Be Considered Indicators of the Subsequent Onset of Peri-Implantitis? A 5-Year Study

 ,
,  ,
,  ,
,  and
and 
Abstract
1. Introduction
2. Materials and Methods
Statistical Analysis
3. Results
4. Discussion
5. Conclusions
Author Contributions
Funding
Institutional Review Board Statement
Informed Consent Statement
Data Availability Statement
Conflicts of Interest
References
- Buser, D.; Sennerby, L.; De Bruyn, H. Modern implant dentistry based on osseointegration: 50 years of progress, current trends and open questions. Periodontology 2000 2017, 73, 7–21. [Google Scholar] [CrossRef]
- Schwarz, F.; Derks, J.; Monje, A.; Wang, H.-L. Peri-implantitis. J. Periodontol. 2018, 89 (Suppl. 1), S267–S290. [Google Scholar] [CrossRef] [PubMed]
- Heitz-Mayfield, L.J.A.; Salvi, G.E. Peri-implant mucositis. J. Clin. Periodontol. 2018, 45 (Suppl. 20), S237–S245. [Google Scholar] [CrossRef]
- Rosen, P.; Clem, D.; Cochran, D.; Froum, S.; McAllister, B.; Renvert, S.; Wang, H.L. Peri-implant mucositis and peri-implantitis: A current understanding of their diagnoses and clinical implications. J. Periodontol. 2013, 84, 436–443. [Google Scholar]
- Caton, J.G.; Armitage, G.; Berglundh, T.; Chapple, I.L.; Jepsen, S.; Kornman, K.S.; Mealey, B.L.; Papapanou, P.N.; Sanz, M.; Tonetti, M.S.; et al. A new classification scheme for periodontal and peri-implant diseases and conditions—Introduction and key changes from the 1999 classification. J. Periodontol. 2018, 89 (Suppl. 1), S1–S8. [Google Scholar] [CrossRef] [PubMed]
- Schmid, E.; Eick, S.; Sculean, A.; Salvi, G.E. Peri-Implant Diseases: Characteristics of the Microbiota and of the Host Response in Humans—A Narrative Review. Monogr. Oral Sci. 2020, 29, 98–104. [Google Scholar] [CrossRef] [PubMed]
- Wada, M.; Mameno, T.; Otsuki, M.; Kani, M.; Tsujioka, Y.; Ikebe, K. Prevalence and risk indicators for peri-implant diseases: A literature review. Jpn. Dent. Sci. Rev. 2021, 57, 78–84. [Google Scholar] [CrossRef]
- Galindo-Moreno, P.; León-Cano, A.; Ortega-Oller, I.; Monje, A.; O′valle, F.; Catena, A. Marginal bone loss as success criterion in implant dentistry: Beyond 2 mm. Clin. Oral Implant. Res. 2014, 26, e28–e34. [Google Scholar] [CrossRef]
- Acharya, A.; Leung, M.C.T.; Ng, K.T.; Fan, M.H.M.; Fokas, G.; Mattheos, N. Peri-implant marginal bone loss rate pre- and post-loading: An exploratory analysis of associated factors. Clin. Oral Implant. Res. 2019, 30, 410–419. [Google Scholar] [CrossRef]
- Rodriguez, M.V.; Ravidà, A.; Saleh, M.H.A.; Basma, H.S.; Dukka, H.; Khurshid, H.; Wang, H.L.; Moreno, P.G. Is the degree of physiological bone remodeling a predictive factor for peri-implantitis? J. Periodontol. 2022, 93, 1273–1282. [Google Scholar] [CrossRef]
- Guarnieri, R.; Zanza, A.; D’Angelo, M.; Di Nardo, D.; Del Giudice, A.; Mazzoni, A.; Reda, R.; Testarelli, L. Correlation between Peri-Implant Marginal Bone Loss Progression and Peri-Implant Sulcular Fluid Levels of Metalloproteinase-8. J. Pers. Med. 2022, 12, 58. [Google Scholar] [CrossRef] [PubMed]
- Monje, A.; Insua, A.; Wang, H.-L. Understanding Peri-Implantitis as a Plaque-Associated and Site-Specific Entity: On the Local Predisposing Factors. J. Clin. Med. 2019, 8, 279. [Google Scholar] [CrossRef] [PubMed]
- Albrektsson, T.; Zarb, G.; Worthington, P.; Eriksson, A.R. The long-term efficacy of currently used dental implants: A review and proposed criteria of success. Int. J. Oral Maxillofac. Implant. 1986, 1, 11–25. [Google Scholar]
- Misch, C.E.; Perel, M.L.; Wang, H.-L.; Sammartino, G.; Galindo-Moreno, P.; Trisi, P.; Steigmann, M.; Rebaudi, A.; Palti, A.; Pikos, M.A.; et al. Implant Success, Survival, and Failure: The International Congress of Oral Implantologists (ICOI) Pisa Consensus Conference. Implant. Dent. 2008, 17, 5–15. [Google Scholar] [CrossRef] [PubMed]
- Berglundh, T.; Persson, L.; Klinge, B. A systematic review of the incidence of biological and technical complications in implant dentistry reported in prospective longitudinal studies of at least 5 years. J. Clin. Periodontol. 2002, 29 (Suppl. 3), 197–212. [Google Scholar] [CrossRef]
- Derks, J.; Tomasi, C. Peri-implant health and disease. A systematic review of current epidemiology. J. Clin. Periodontol. 2015, 42 (Suppl. S16), S158–S171. [Google Scholar] [CrossRef] [PubMed]
- Koldsland, O.C.; Scheie, A.A.; Aass, A.M. Prevalence of Peri-Implantitis Related to Severity of the Disease with Different Degrees of Bone Loss. J. Periodontol. 2010, 81, 231–238. [Google Scholar] [CrossRef]
- Alassiri, S.; Parnanen, P.; Rathnayake, N.; Johannsen, G.; Heikkinen, A.-M.; Lazzara, R.; Van Der Schoor, P.; Van Der Schoor, J.G.; Tervahartiala, T.; Gieselmann, D.; et al. The Ability of Quantitative, Specific, and Sensitive Point-of-Care/Chair-Side Oral Fluid Immunotests for aMMP-8 to Detect Periodontal and Peri-Implant Diseases. Dis. Markers 2018, 2018, 1306396. [Google Scholar] [CrossRef]
- Räisänen, I.T.; Heikkinen, A.M.; Nwhator, S.O.; Umeizudike, K.A.; Tervahartiala, T.; Sorsa, T. On the diagnostic discrimination ability of mouthrinse and salivary aMMP-8 point-of-care testing regarding periodontal health and disease. Diagn. Microbiol. Infect. Dis. 2019, 95, 114871. [Google Scholar] [CrossRef]
- Sorsa, T.; Gieselmann, D.; Arweiler, N.B.; Hernández, M. A quantitative point-of-care test for periodontal and dental peri-implant diseases. Nat. Rev. Dis. Prim. 2017, 3, 17069. [Google Scholar] [CrossRef]
- Golub, L.M.; Räisänen, I.T.; Sorsa, T.; Preshaw, P.M. An Unexplored Pharmacologic/Diagnostic Strategy for Peri-Implantitis: A Protocol Proposal. Diagnostics 2020, 10, 1050. [Google Scholar] [CrossRef] [PubMed]
- Lähteenmäki, H.; Umeizudike, K.A.; Heikkinen, A.M.; Räisänen, I.T.; Rathnayake, N.; Johannsen, G.; Tervahartiala, T.; Nwhator, S.O.; Sorsa, T. aMMP-8 Point-of-Care/Chairside Oral Fluid Technology as a Rapid, Non-Invasive Tool for Periodontitis and Peri-Implantitis Screening in a Medical Care Setting. Diagnostics 2020, 10, 562. [Google Scholar] [CrossRef] [PubMed]
- Ma, J.; Kitti, U.; Teronen, O.; Sorsa, T.; Husa, V.; Laine, P.; Rönkä, H.; Salo, T.; Lindqvist, C.; Konttinen, Y. Collagenases in different categories of peri-implant vertical bone loss. J. Dent. Res. 2000, 79, 1870–1873. [Google Scholar] [CrossRef] [PubMed]
- Nomura, T.; Ishii, A.; Shimizu, H.; Taguchi, N.; Yoshie, H.; Kusakari, H.; Hara, K. Tissue inhibitor of metalloproteinases-1, matrix metalloproteinases-1 and -8, and collagenase activity levels in peri-implant crevicular fluid after implantation. Clin. Oral Implant. Res. 2000, 11, 430–440. [Google Scholar] [CrossRef] [PubMed]
- Basegmez, C.; Yalcin, S.; Yalcin, F.; Ersanli, S.; Mijiritsky, E. Evaluation of periimplant crevicular fluid prostaglandin E2 and matrix metalloproteinase-8 levels from health to periimplant disease status: A prospective study. Implant. Dent. 2012, 21, 306–310. [Google Scholar] [CrossRef] [PubMed]
- Ramseier, C.A.; Eick, S.; Brönnimann, C.; Buser, D.; Brägger, U.; Salvi, G.E. Host-derived biomarkers at teeth and implants in partially edentulous patients. A 10-year retrospective study. Clin. Oral Implant. Res. 2016, 27, 211–217. [Google Scholar] [CrossRef]
- Oh, T.J.; Yoon, J.; Misch, C.E.; Wang, H.L. The causes of early implant bone loss: Myth or science? J. Periodontol. 2002, 73, 322–333. [Google Scholar] [CrossRef]
- Dukka, H.; Saleh, M.H.A.; Ravida, A.; Greenwell, H.; Wang, H.L. Is bleeding on probing a reliable clinical indicator of peri-implant diseases? J. Periodontol. 2021, 92, 1669–1674. [Google Scholar] [CrossRef] [PubMed]
- Ravidà, A.; Galli, M.; Siqueira, R.; Saleh, M.H.A.; Galindo-Moreno, P.; Wang, H. Diagnosis of peri-implant status after peri-implantitis surgical treatment: Proposal of a new classification. J. Periodontol. 2020, 91, 1553–1561. [Google Scholar] [CrossRef] [PubMed]
- Qian, J.; Wennerberg, A.; Albrektsson, T. Reasons for Marginal Bone Loss around Oral Implants. Clin. Implant. Dent. Relat. Res. 2012, 14, 792–807. [Google Scholar] [CrossRef]
- Albrektsson, T.; Canullo, L.; Cochran, D.; De Bruyn, H. “Peri-Implantitis”: A Complication of a Foreign Body or a Man-Made “Disease”. Facts and Fiction. Clin. Implant. Dent. Relat. Res. 2016, 18, 840–849. [Google Scholar] [CrossRef]
- Albrektsson, T.; Chrcanovic, B.; Östman, P.-O.; Sennerby, L. Initial and long-term crestal bone responses to modern dental implants. Periodontology 2000 2016, 73, 41–50. [Google Scholar] [CrossRef]
- Trindade, R.; Albrektsson, T.; Tengvall, P.; Wennerberg, A. Foreign Body Reaction to Biomaterials: On Mechanisms for Buildup and Breakdown of Osseointegration. Clin. Implant. Dent. Relat. Res. 2014, 18, 192–203. [Google Scholar] [CrossRef]
- Albrektsson, T.; Dahlin, C.; Jemt, T.; Sennerby, L.; Turri, A.; Wennerberg, A. Is Marginal Bone Loss around Oral Implants the Result of a Provoked Foreign Body Reaction? Clin. Implant. Dent. Relat. Res. 2013, 16, 155–165. [Google Scholar] [CrossRef] [PubMed]
- Lasserre, J.F.; Brecx, M.C.; Toma, S. Oral Microbes, Biofilms and Their Role in Periodontal and Peri-Implant Diseases. Materials 2018, 11, 1802. [Google Scholar]
- Hajishengallis, G. Immunomicrobial pathogenesis of periodontitis: Keystones, pathobionts, and host response. Trends Immunol. 2013, 35, 3–11. [Google Scholar] [CrossRef]
- Faot, F.; Nascimento, G.; Bielemann, A.; Campão, T.D.; Leite, F.R.M.; Quirynen, M. Can Peri-Implant Crevicular Fluid Assist in the Diagnosis of Peri-Implantitis? A Systematic Review and Meta-Analysis. J. Periodontol. 2015, 86, 631–645. [Google Scholar] [CrossRef] [PubMed]
- Luchian, I.; Goriuc, A.; Sandu, D.; Covasa, M. The Role of Matrix Metalloproteinases (MMP-8, MMP-9, MMP-13) in Periodontal and Peri-Implant Pathological Processes. Int. J. Mol. Sci. 2022, 23, 1806. [Google Scholar] [CrossRef] [PubMed]
- Cosgarea, R.; Sculean, A.; Shibli, J.A.; Salvi, G.E. Prevalence of peri-implant diseases—A critical review on the current evidence. Braz. Oral Res. 2019, 33, e063. [Google Scholar] [CrossRef]
- Derks, J.; Schaller, D.; Håkansson, J.; Wennström, J.L.; Tomasi, C.; Berglundh, T. Peri-implantitis—Onset and pattern of progression. J. Clin. Periodontol. 2016, 43, 383–388. [Google Scholar] [CrossRef]
- Staubli, N.; Walter, C.; Schmidt, J.C.; Weiger, R.; Zitzmann, N.U. Excess cement and the risk of peri-implant disease—A systematic review. Clin. Oral Implant. Res. 2016, 28, 1278–1290. [Google Scholar] [CrossRef] [PubMed]
- Kasat, V.; Ladda, R. Smoking and dental implants. J. Int. Soc. Prev. Community Dent. 2012, 2, 38–41. [Google Scholar] [CrossRef] [PubMed]
- Chen, Z.; Zhang, Y.; Li, J.; Wang, H.-L.; Yu, H. Influence of Laser-Microtextured Surface Collar on Marginal Bone Loss and Peri-Implant Soft Tissue Response: A Systematic Review and Meta-Analysis. J. Periodontol. 2017, 88, 651–662. [Google Scholar] [CrossRef] [PubMed]
- Katafuchi, M.; Weinstein, B.F.; Leroux, B.G.; Chen, Y.-W.; Daubert, D.M. Restoration contour is a risk indicator for peri-implantitis: A cross-sectional radiographic analysis. J. Clin. Periodontol. 2017, 45, 225–232. [Google Scholar] [CrossRef]


| N. patients | 80 |
| N. implants | 80 |
| Age (years) | 54.6 (9.6) |
| Gender: | |
| Male | 38 (35) |
| Female | 52 (65) |
| Smoking: | |
| No | 60 (75) |
| Yes | 20 (25) |
| Collar surface: | |
| LMS | 41 (51.2) |
| MS | 39 (48.8) |
| Location: | |
| Right mandible | 16 (20) |
| Left mandible | 22 (27.5) |
| Right maxilla 24 30 | 24 (30) |
| Left maxilla 18 22.5 | 18 (22.5) |
| Tooth Type: | |
| Molar | 54 (67.5) |
| Premolar | 26 (32.5) |
| Retention: | |
| Screwed | 48 (60) |
| Cemented | 32 (40) |
| Length (mm): | |
| <9 | 14 (17.5) |
| 9–12 | 44 (55) |
| >12 | 22 (27.5) |
| Diameter (mm): | |
| <3.8 | 6 (7.5) |
| 3.8–4.6 | 68 (85) |
| >4.6 mm | 6 (7.5) |
| Follow-up (years): | |
| T1-T0 | 0.62 ± 0.2 |
| T2-T1 | 1.92 ± 3.0 |
| T5-T2 | 5.89 ± 3.8 |
| T5-T0 | 9.64 ± 2.2. |
| N. Sites with Plaque | N. Sites with BOP | PD mm (SD) | FMPS (SD) | FMBS | |
|---|---|---|---|---|---|
| P+ | 13 | 6 | 1.6 (08) | 20.4 (2.1) | 18.1 (1.3) |
| P− | 18 | 24 | 5.8 (2.7) | 19.8 (2.8) | 19.5 (2.1) |
| Significance | >0.05 | <0.05 | <0.05 | >0.05 | >0.05 |
| Parameter | P+ Group | P− Group | OR | 95% CI | p-Value |
|---|---|---|---|---|---|
| N. implants | 24 (30) | 56 (70) | |||
| Age | 53.4 (7.2) | 55.8 (9.4) | 0.91 | 0.85–1.02 | 0.609 |
| Gender: | |||||
| Male | 10 (41.7) | 26 (46.4) | 1 | ||
| Female | 14 (58.3) | 30 (53.6) | 1.04 | 0.31–1.06 | 0.546 |
| Smoking: | |||||
| No | 8 (33.3) | 27 (48.2) | 1 | ||
| Yes | 16 (66.7) | 29 (51.8) | 1.80 | 0.24–2.68 | 0.072 * |
| Collar surface: | |||||
| LMS | 6 (25) | 35 (62.5) | 1 | ||
| MS | 18 (75) | 21 (37.5) | 1.18 | 1.02–1.19 | 0.031 * |
| Location: | |||||
| Right mandible | 4 (16.6) | 12 (21.4) | 1 | ||
| Left mandible | 6 (25) | 16 (28.6) | 1.06 | 0.33–7.95 | 0.769 |
| Right maxilla | 7 (29.2) | 17 (30.3) | 1.03 | 0.46–8.01 | 0.932 |
| Left maxilla | 7 (29.2) | 11 (19.7) | 1.11 | 0.34–9.01 | 0.789 |
| Tooth Type: | |||||
| Molar | 14 (58.3) | 40 (71.4) | 1 | ||
| Premolar | 10 (41.7) | 16 (28.6) | 1.12 | 0.45–4.81 | 0.642 |
| Retention: | |||||
| Screwed | 6 (25) | 32 (57.1) | 1 | ||
| Cemented | 18 (75) | 14 (42.9) | 1.72 | 0.81–3.44 | 0.037 * |
| Length (mm): | |||||
| <9 | 7 (29.1) | 7 (12.5) | 1 | ||
| 9–12 | 12 (50) | 32 (57.1) | 1.10 | 0.36–2.36 | 0.451 |
| >12 | 5 (20.1) | 17 (30.4) | 1.72 | 0.52–6.41 | 0.789 |
| Diameter (mm): | |||||
| <3.8 | 1 (4.1) | 5 (8.9) | 1 | ||
| 3.8–4.6 | 20 (62,5) | 48 (85.7) | 1.41 | 0.61–7.32 | 0.896 |
| >4.6 mm | 3 (33.4) | 3 (5.4) | 1.38 | 0.44–8.28 | 0.445 |
| Follow-up (years): | |||||
| T1-T0 | 0.59 ± 0.8 | 0.65± 1.1 | 1 | ||
| T2-T1 | 1.90 ± 2.0 | 1.94 ± 1.2 | 1.22 | 0.81–1.56 | 0.464 |
| T5-T2 | 4.92 ± 1.6 | 6.86 ± 1.7 | 1.64 | 1.45–2.45 | 0.034 * |
| T5-T0 | 8.72 ±2.4 | 10.56 ± 2.1 | 1.89 | 1.89–2.83 | 0.039 * |
| Parameter | P+ Group | P− Group | Significance |
|---|---|---|---|
| MBL at T1 | 0.89 ±0.53 | 0.75 ± 0.76 | 0.834 |
| MBLr at T1 | 0.143 ± 0.12 | 0.125 ± 0.32 | 0.451 |
| MBL at T2 | 1.52± 0.87 | 1.36 ± 0.65 | 0.212 |
| MBLr at T2 | 0.063 ± 0.11 | 0.05± 0.06 | 0.322 |
| MBL at T5 | 6.71 ± 1.8 | 2.23 ± 0.9 | 0.011 * |
| MBLr at T5 | 0.111 ± 0.31 | 0.039 ± 0.15 | 0.017 * |
| a-MMP-8 at T1 | 16.9 ± 9.4 | 7.6 ± 2.4 | 0.023 * |
| a-MMP-8r at T1 | 2.81 ± 1.9 | 1.2 ± 0.4 | 0.027 * |
| a-MMP-8 at T2 | 19.8 ± 7.3 | 11.4 ± 3.8 | 0.027 * |
| a-MMP-8r at T2 | 0.85 ± 0.9 | 0.21 ± 0.5 | 0.098 * |
| a-MMP-8 at T5 | 27.3 ± 9.1 | 12.3 ± 2.9 | 0.078 * |
| a-MMP-8r at T5 | 0.20 ± 0.8 | 0.02 ± 0.4 | 0.081 * |
| Min | 5% | 25% | Median | 75% | 95% | Max | Mean | S. D. | Count | |
|---|---|---|---|---|---|---|---|---|---|---|
| P+ | 6.4 | 15.4 | 17.2 | 18.3 | 19.5 | 20.4 | 20.7 | 17.8 | 2.87 | 24 |
| P− | 1.6 | 3.12 | 5.43 | 8.35 | 10.4 | 11.3 | 11.6 | 7.86 | 2.9 | 56 |
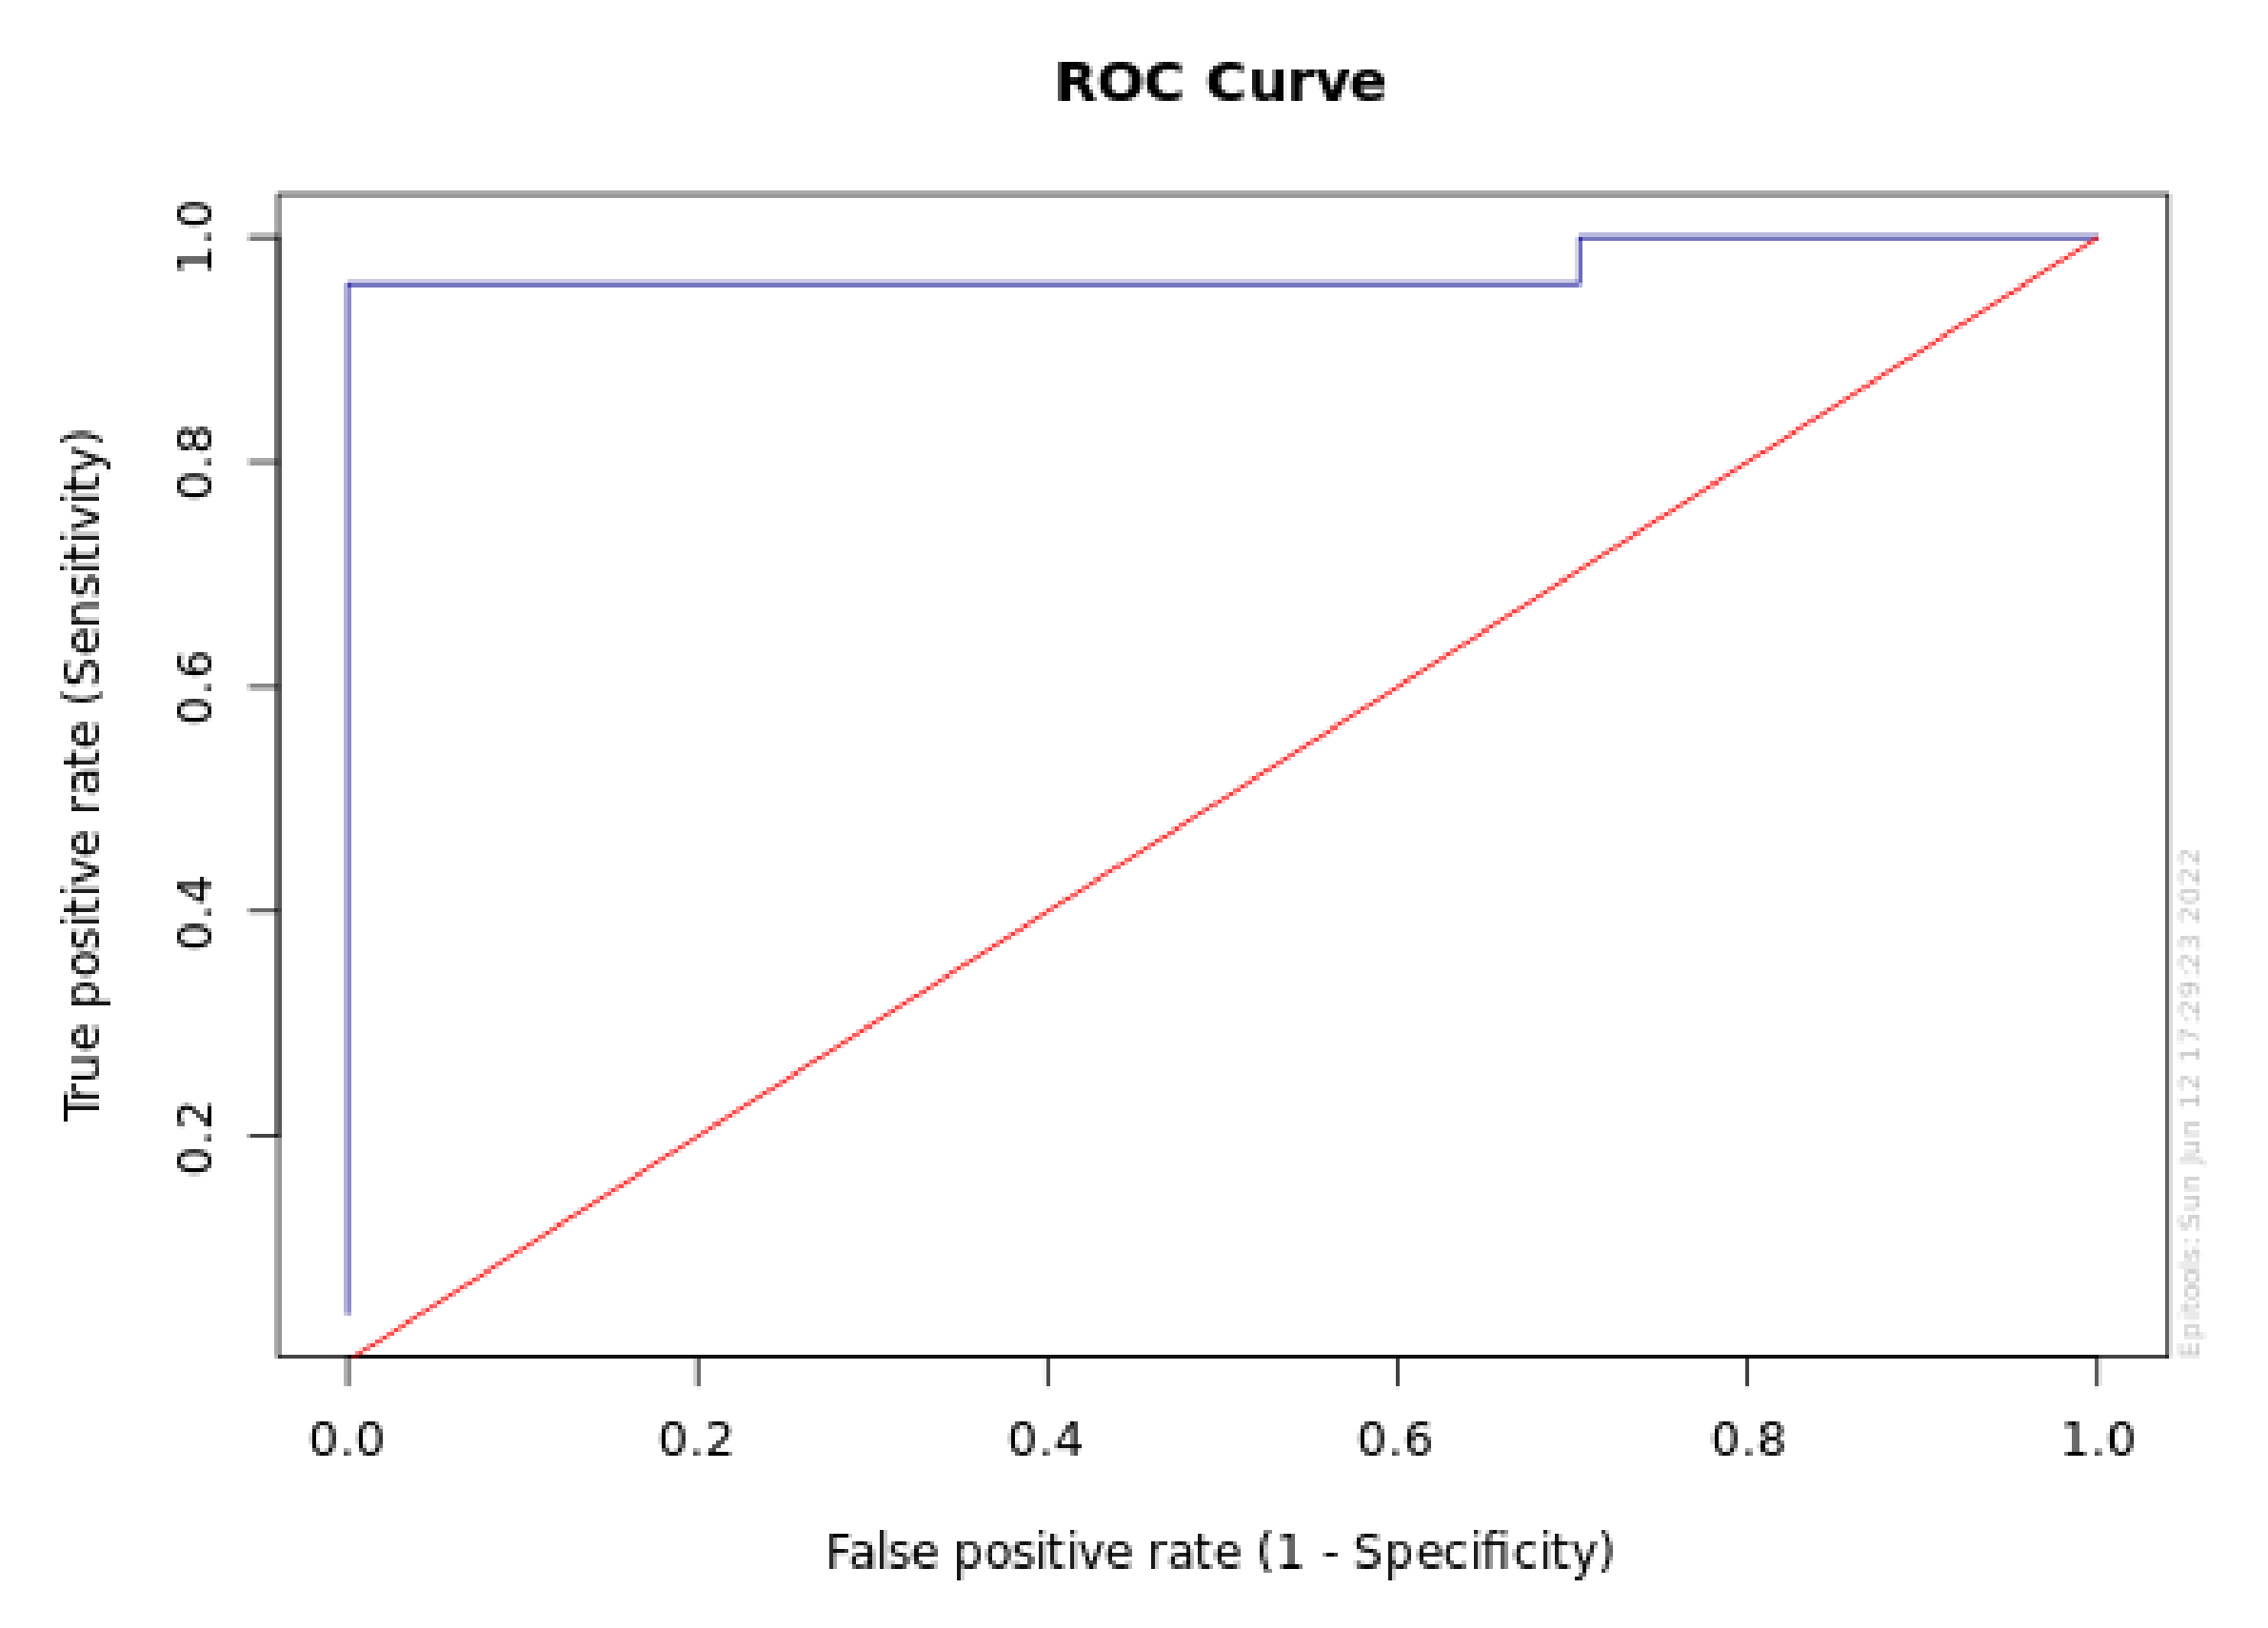
| Target Se | Cutoff point | Sensitivity | Se Lower 95% CL | Se Upper 95% CL | Specificity | Sp Lower 95% CL | Sp Upper 95% CL |
|---|---|---|---|---|---|---|---|
| 0.999 | 6.4 | 1 | 0.862 | 1 | 0.296 | 0.191 | 0.428 |
| 0.995 | 6.4 | 1 | 0.862 | 1 | 0.296 | 0.191 | 0.428 |
| 0.99 | 6.4 | 1 | 0.862 | 1 | 0.296 | 0.191 | 0.428 |
| 0.98 | 6.4 | 1 | 0.862 | 1 | 0.296 | 0.191 | 0.428 |
| 0.95 | 15.3 | 0.958 | 0.798 | 0.993 | 1 | 0.934 | 1 |
| 0.9 | 15.7 | 0.917 | 0.742 | 0.977 | 1 | 0.934 | 1 |
| 0.8 | 17.1 | 0.833 | 0.641 | 0.933 | 1 | 0.934 | 1 |
| Target Sp | Cutoff point | Specificity | Sp Lower 95% CL | Sp Upper 95% CL | Sensitivity | Se Lower 95% CL | Se Upper 95% CL |
|---|---|---|---|---|---|---|---|
| 0.999 | 15.3 | 1 | 0.934 | 1 | 0.958 | 0.798 | 0.993 |
| 0.995 | 15.3 | 1 | 0.934 | 1 | 0.958 | 0.798 | 0.993 |
| 0.99 | 15.3 | 1 | 0.934 | 1 | 0.958 | 0.798 | 0.993 |
| 0.98 | 11.6 | 0.981 | 0.902 | 0.997 | 0.958 | 0.798 | 0.993 |
| 0.95 | 11.6 | 0.981 | 0.902 | 0.997 | 0.958 | 0.798 | 0.993 |
| 0.9 | 11.3 | 0.907 | 0.801 | 0.96 | 0.958 | 0.798 | 0.993 |
| 0.8 | 11.1 | 0.815 | 0.692 | 0.896 | 0.958 | 0.798 | 0.993 |
Publisher’s Note: MDPI stays neutral with regard to jurisdictional claims in published maps and institutional affiliations. |
© 2022 by the authors. Licensee MDPI, Basel, Switzerland. This article is an open access article distributed under the terms and conditions of the Creative Commons Attribution (CC BY) license (https://creativecommons.org/licenses/by/4.0/).
Share and Cite
Guarnieri, R.; Reda, R.; Zanza, A.; Miccoli, G.; Nardo, D.D.; Testarelli, L. Can Peri-Implant Marginal Bone Loss Progression and a-MMP-8 Be Considered Indicators of the Subsequent Onset of Peri-Implantitis? A 5-Year Study. Diagnostics 2022, 12, 2599. https://doi.org/10.3390/diagnostics12112599
Guarnieri R, Reda R, Zanza A, Miccoli G, Nardo DD, Testarelli L. Can Peri-Implant Marginal Bone Loss Progression and a-MMP-8 Be Considered Indicators of the Subsequent Onset of Peri-Implantitis? A 5-Year Study. Diagnostics. 2022; 12(11):2599. https://doi.org/10.3390/diagnostics12112599
Chicago/Turabian StyleGuarnieri, Renzo, Rodolfo Reda, Alessio Zanza, Gabriele Miccoli, Dario Di Nardo, and Luca Testarelli. 2022. "Can Peri-Implant Marginal Bone Loss Progression and a-MMP-8 Be Considered Indicators of the Subsequent Onset of Peri-Implantitis? A 5-Year Study" Diagnostics 12, no. 11: 2599. https://doi.org/10.3390/diagnostics12112599
APA StyleGuarnieri, R., Reda, R., Zanza, A., Miccoli, G., Nardo, D. D., & Testarelli, L. (2022). Can Peri-Implant Marginal Bone Loss Progression and a-MMP-8 Be Considered Indicators of the Subsequent Onset of Peri-Implantitis? A 5-Year Study. Diagnostics, 12(11), 2599. https://doi.org/10.3390/diagnostics12112599