A Deep Learning Algorithm for Radiographic Measurements of the Hip in Adults—A Reliability and Agreement Study
Abstract
1. Introduction
2. Materials and Methods
2.1. Study Design
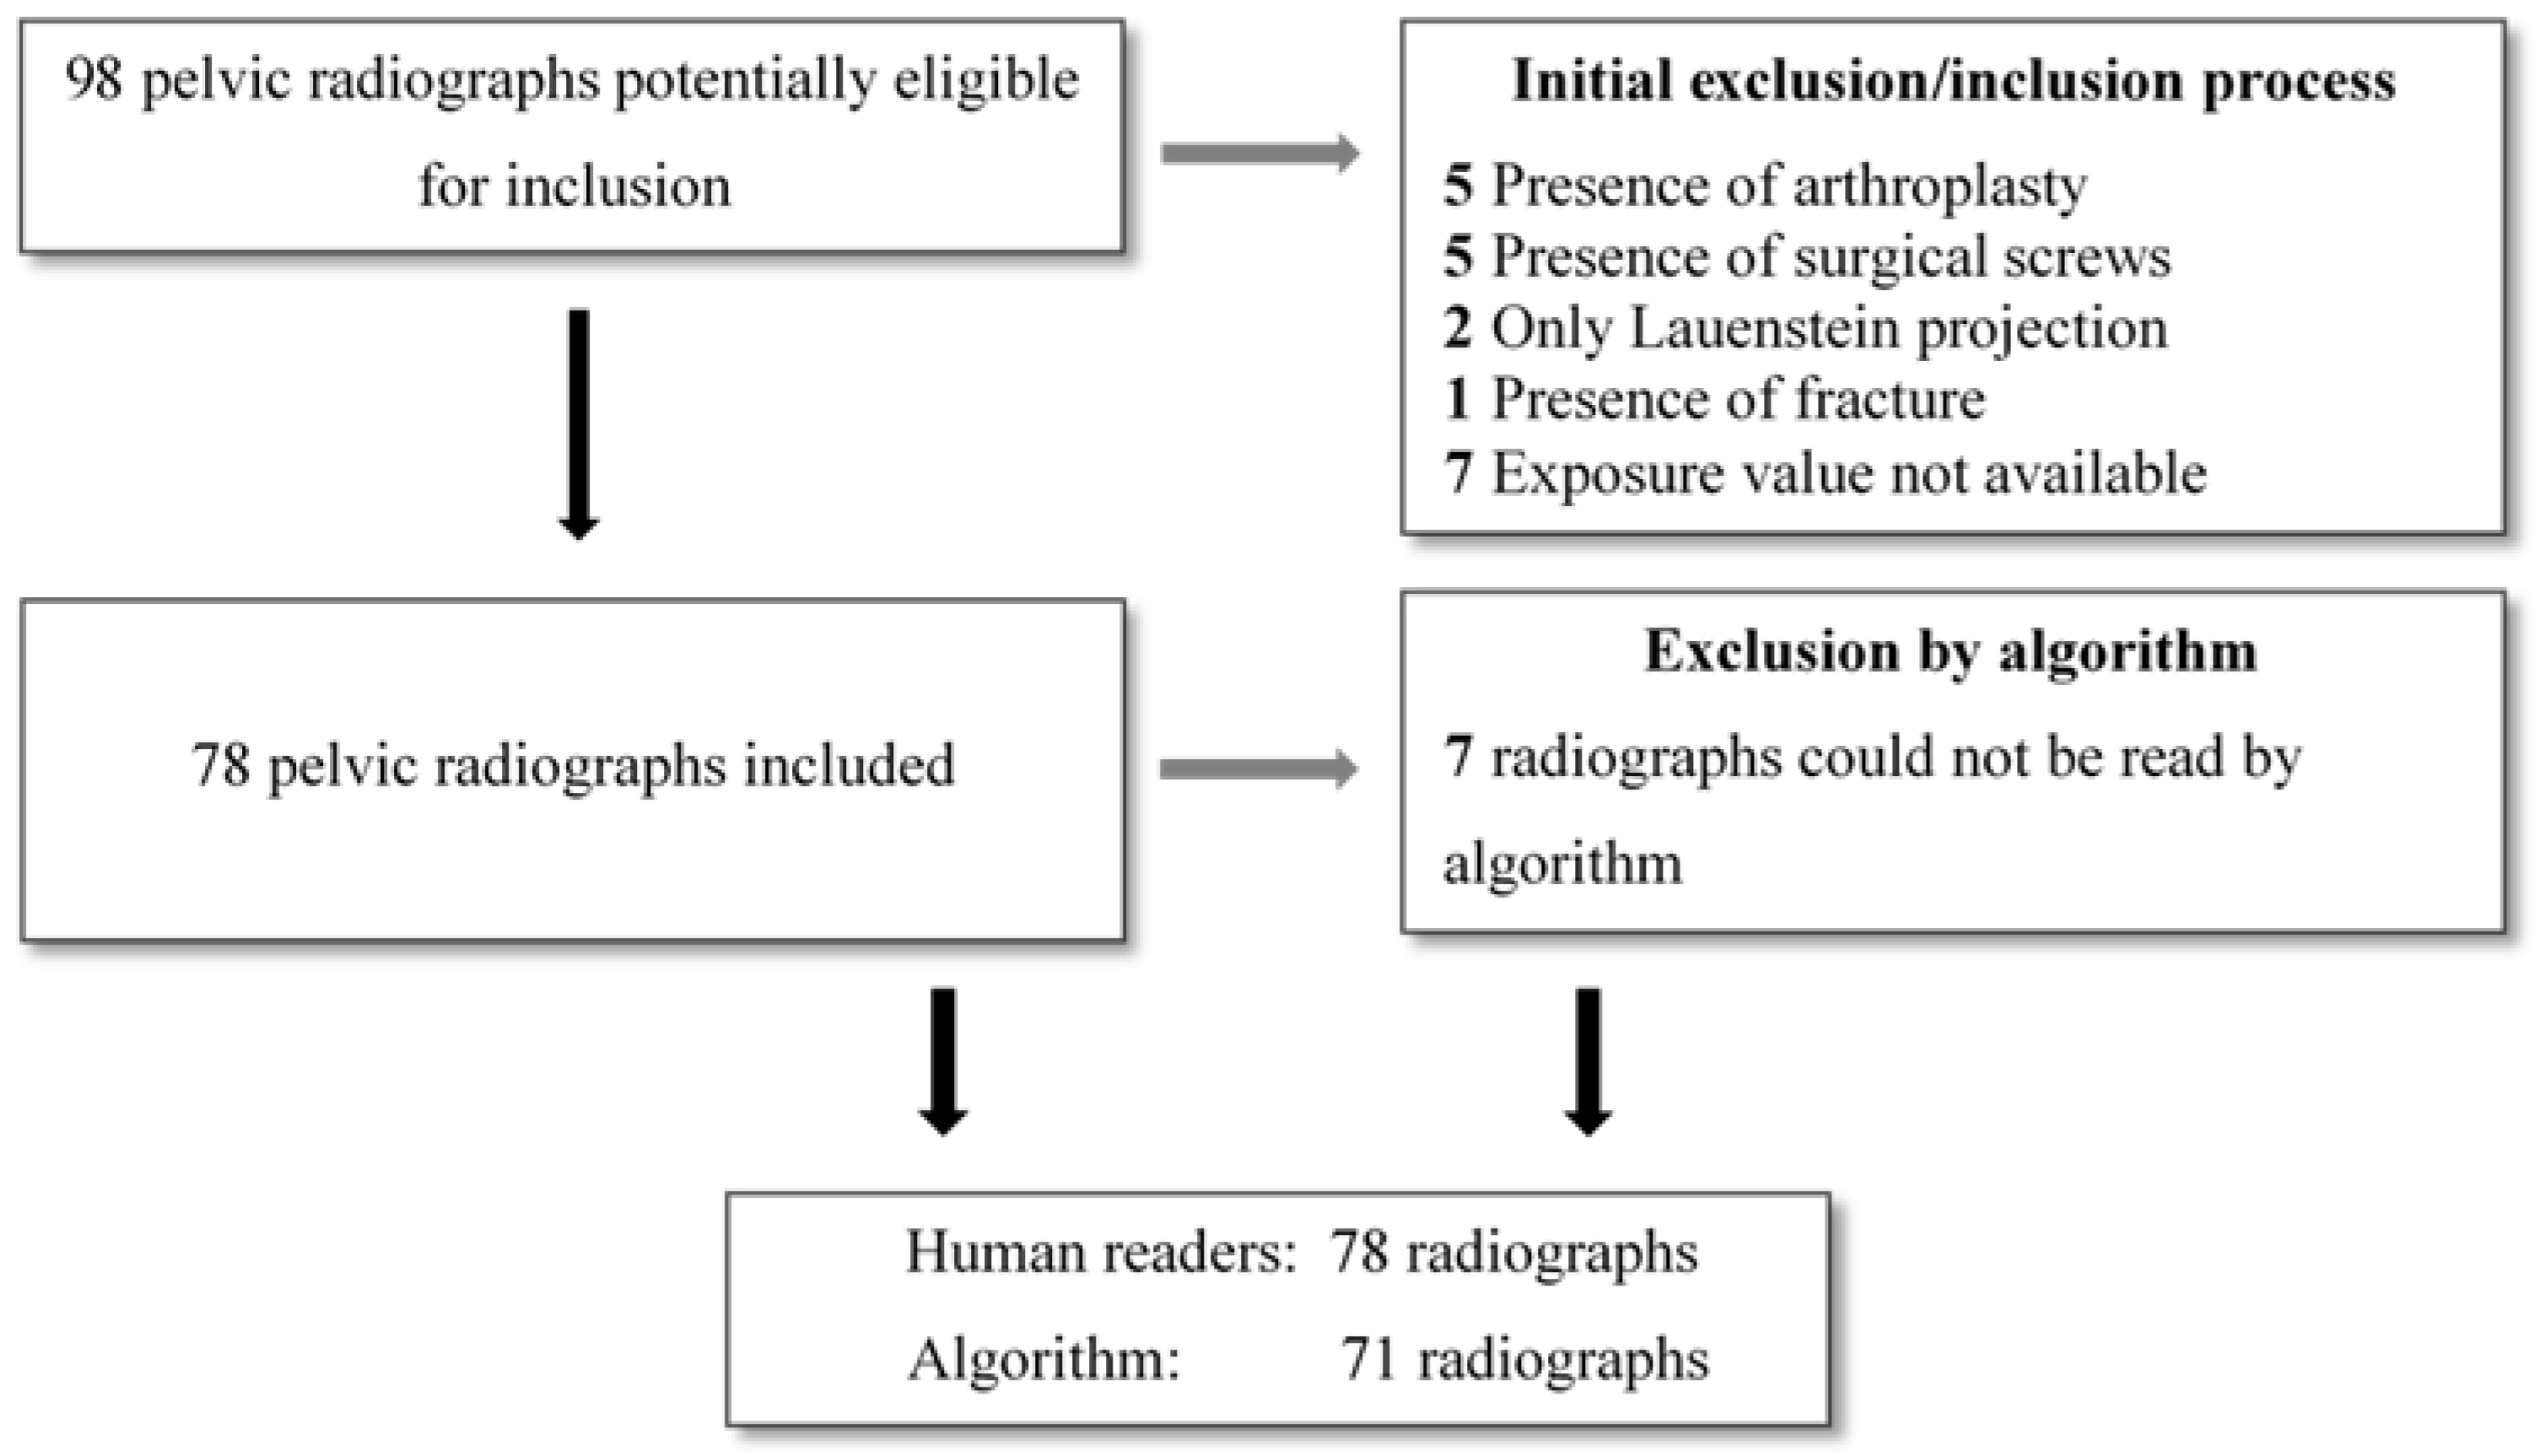
2.2. Study Population
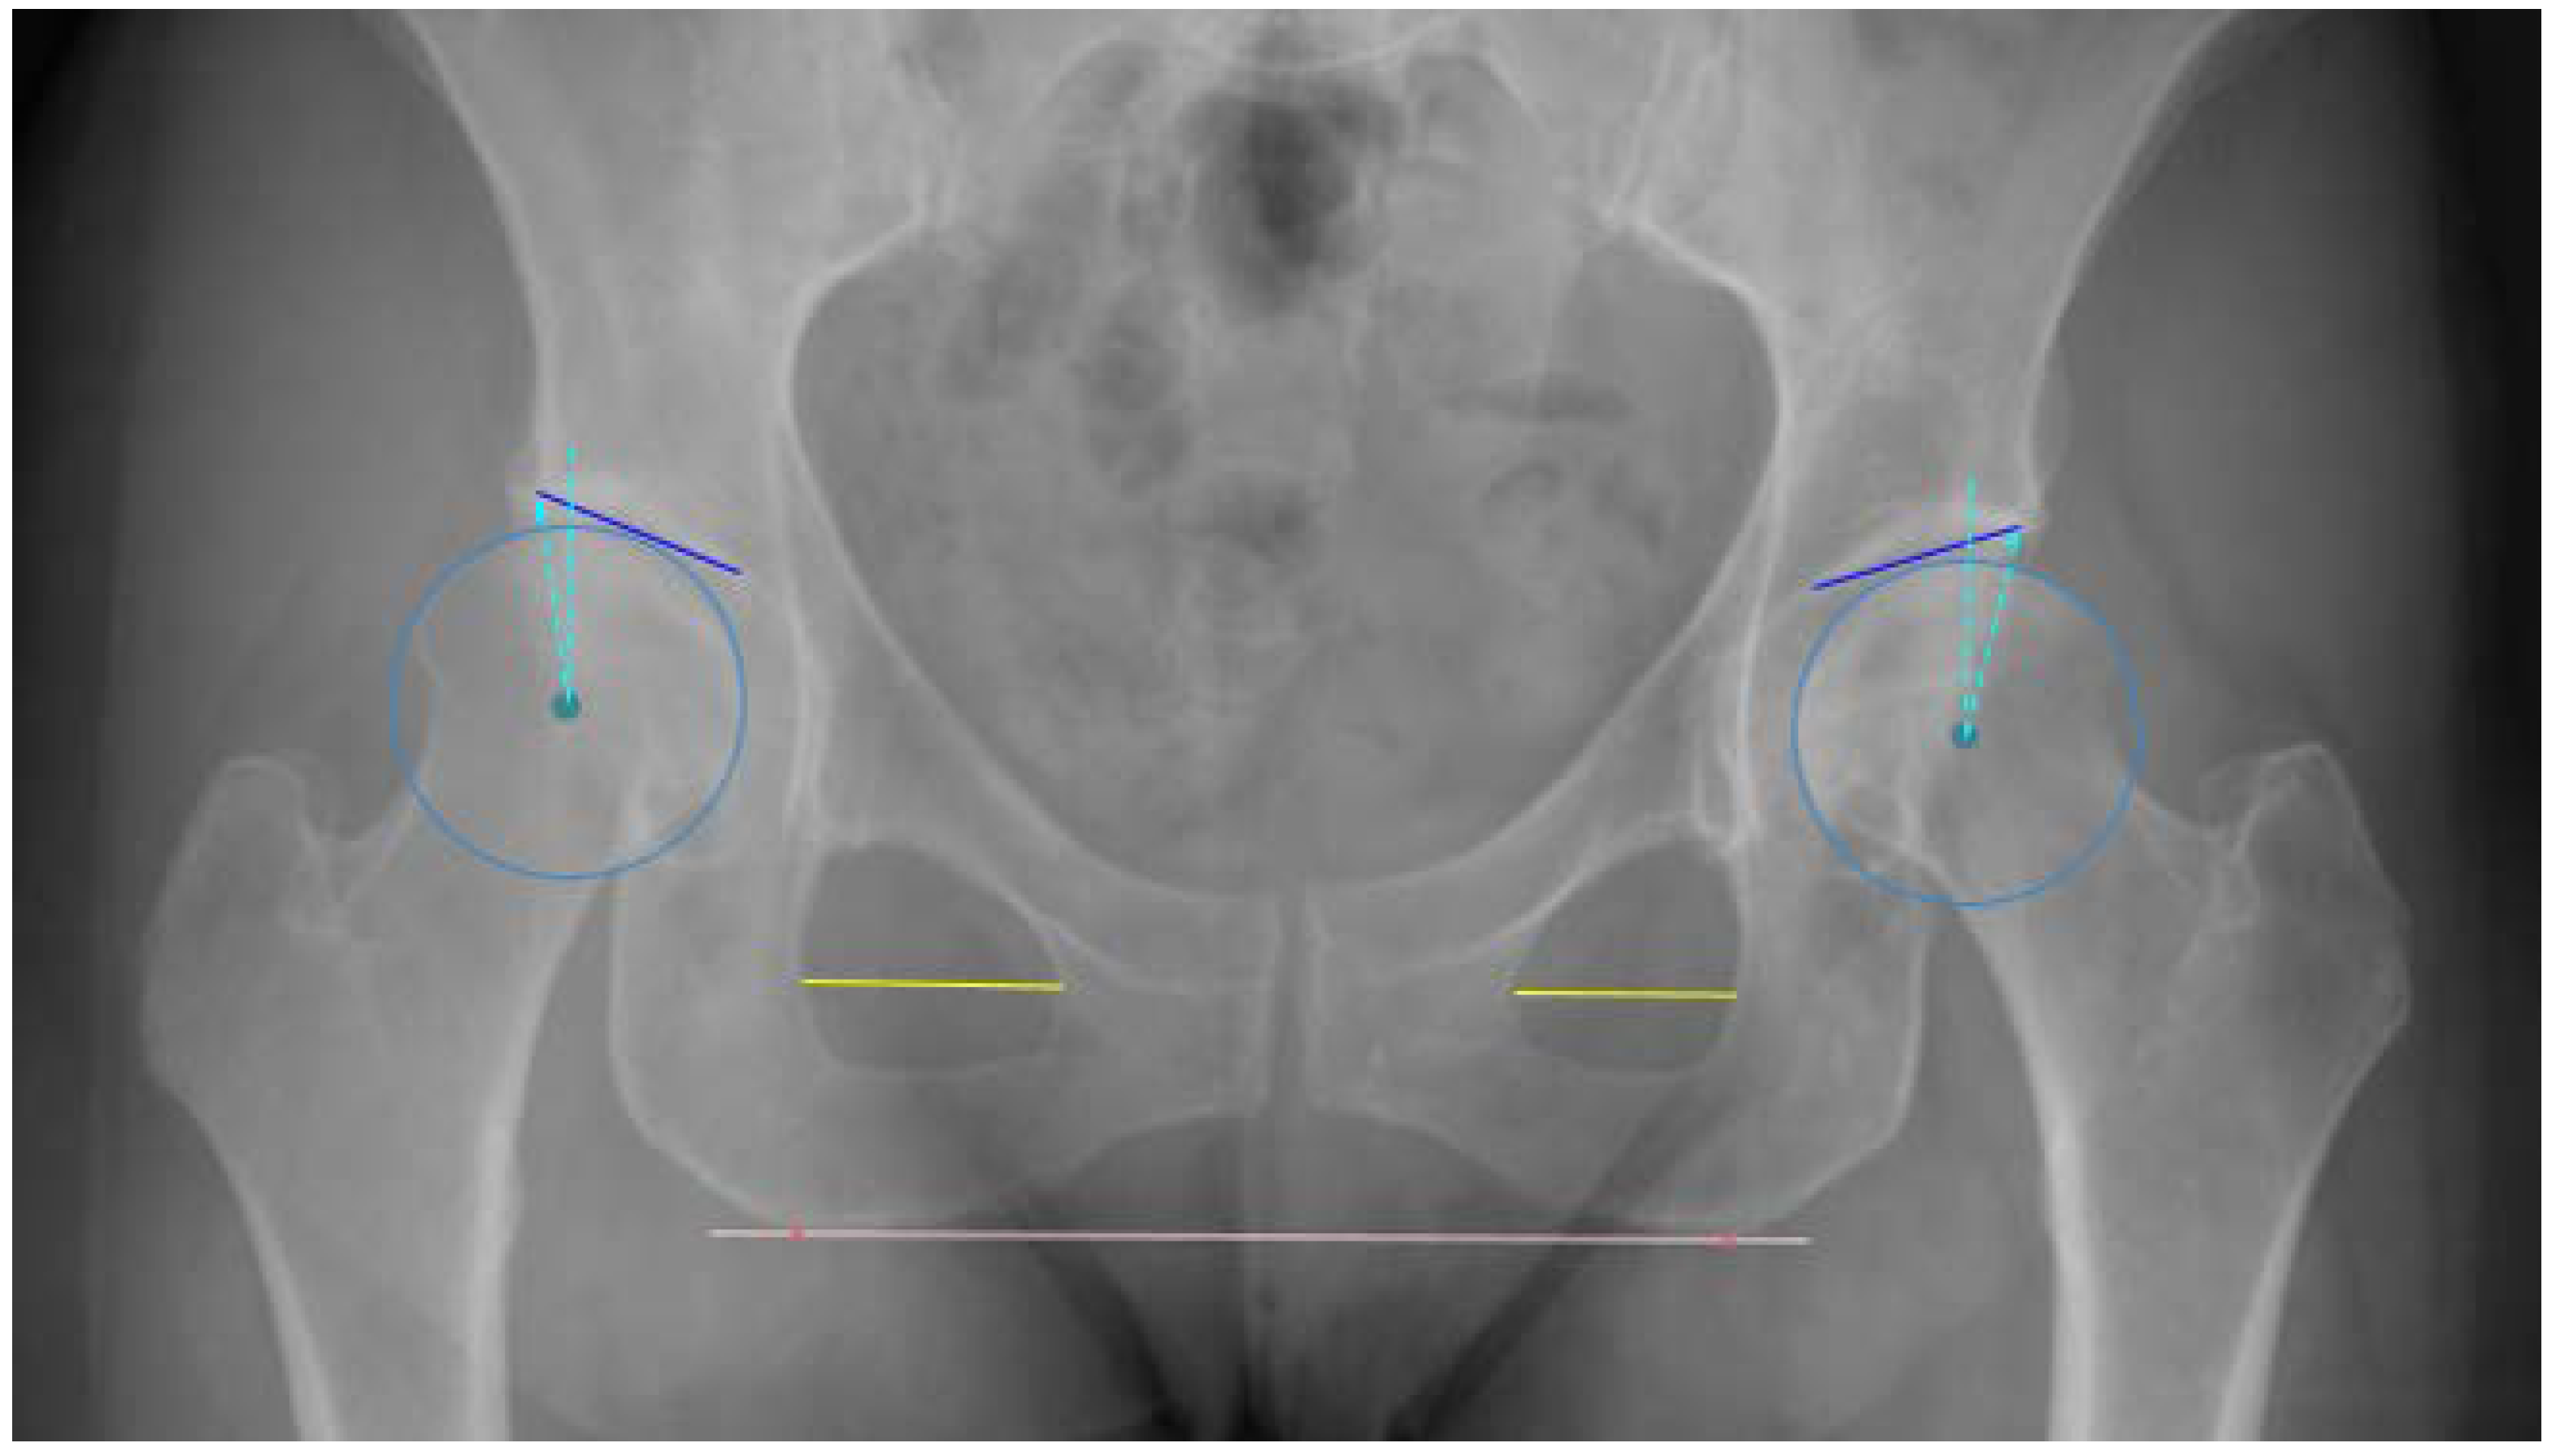
2.3. Anatomic Definitions
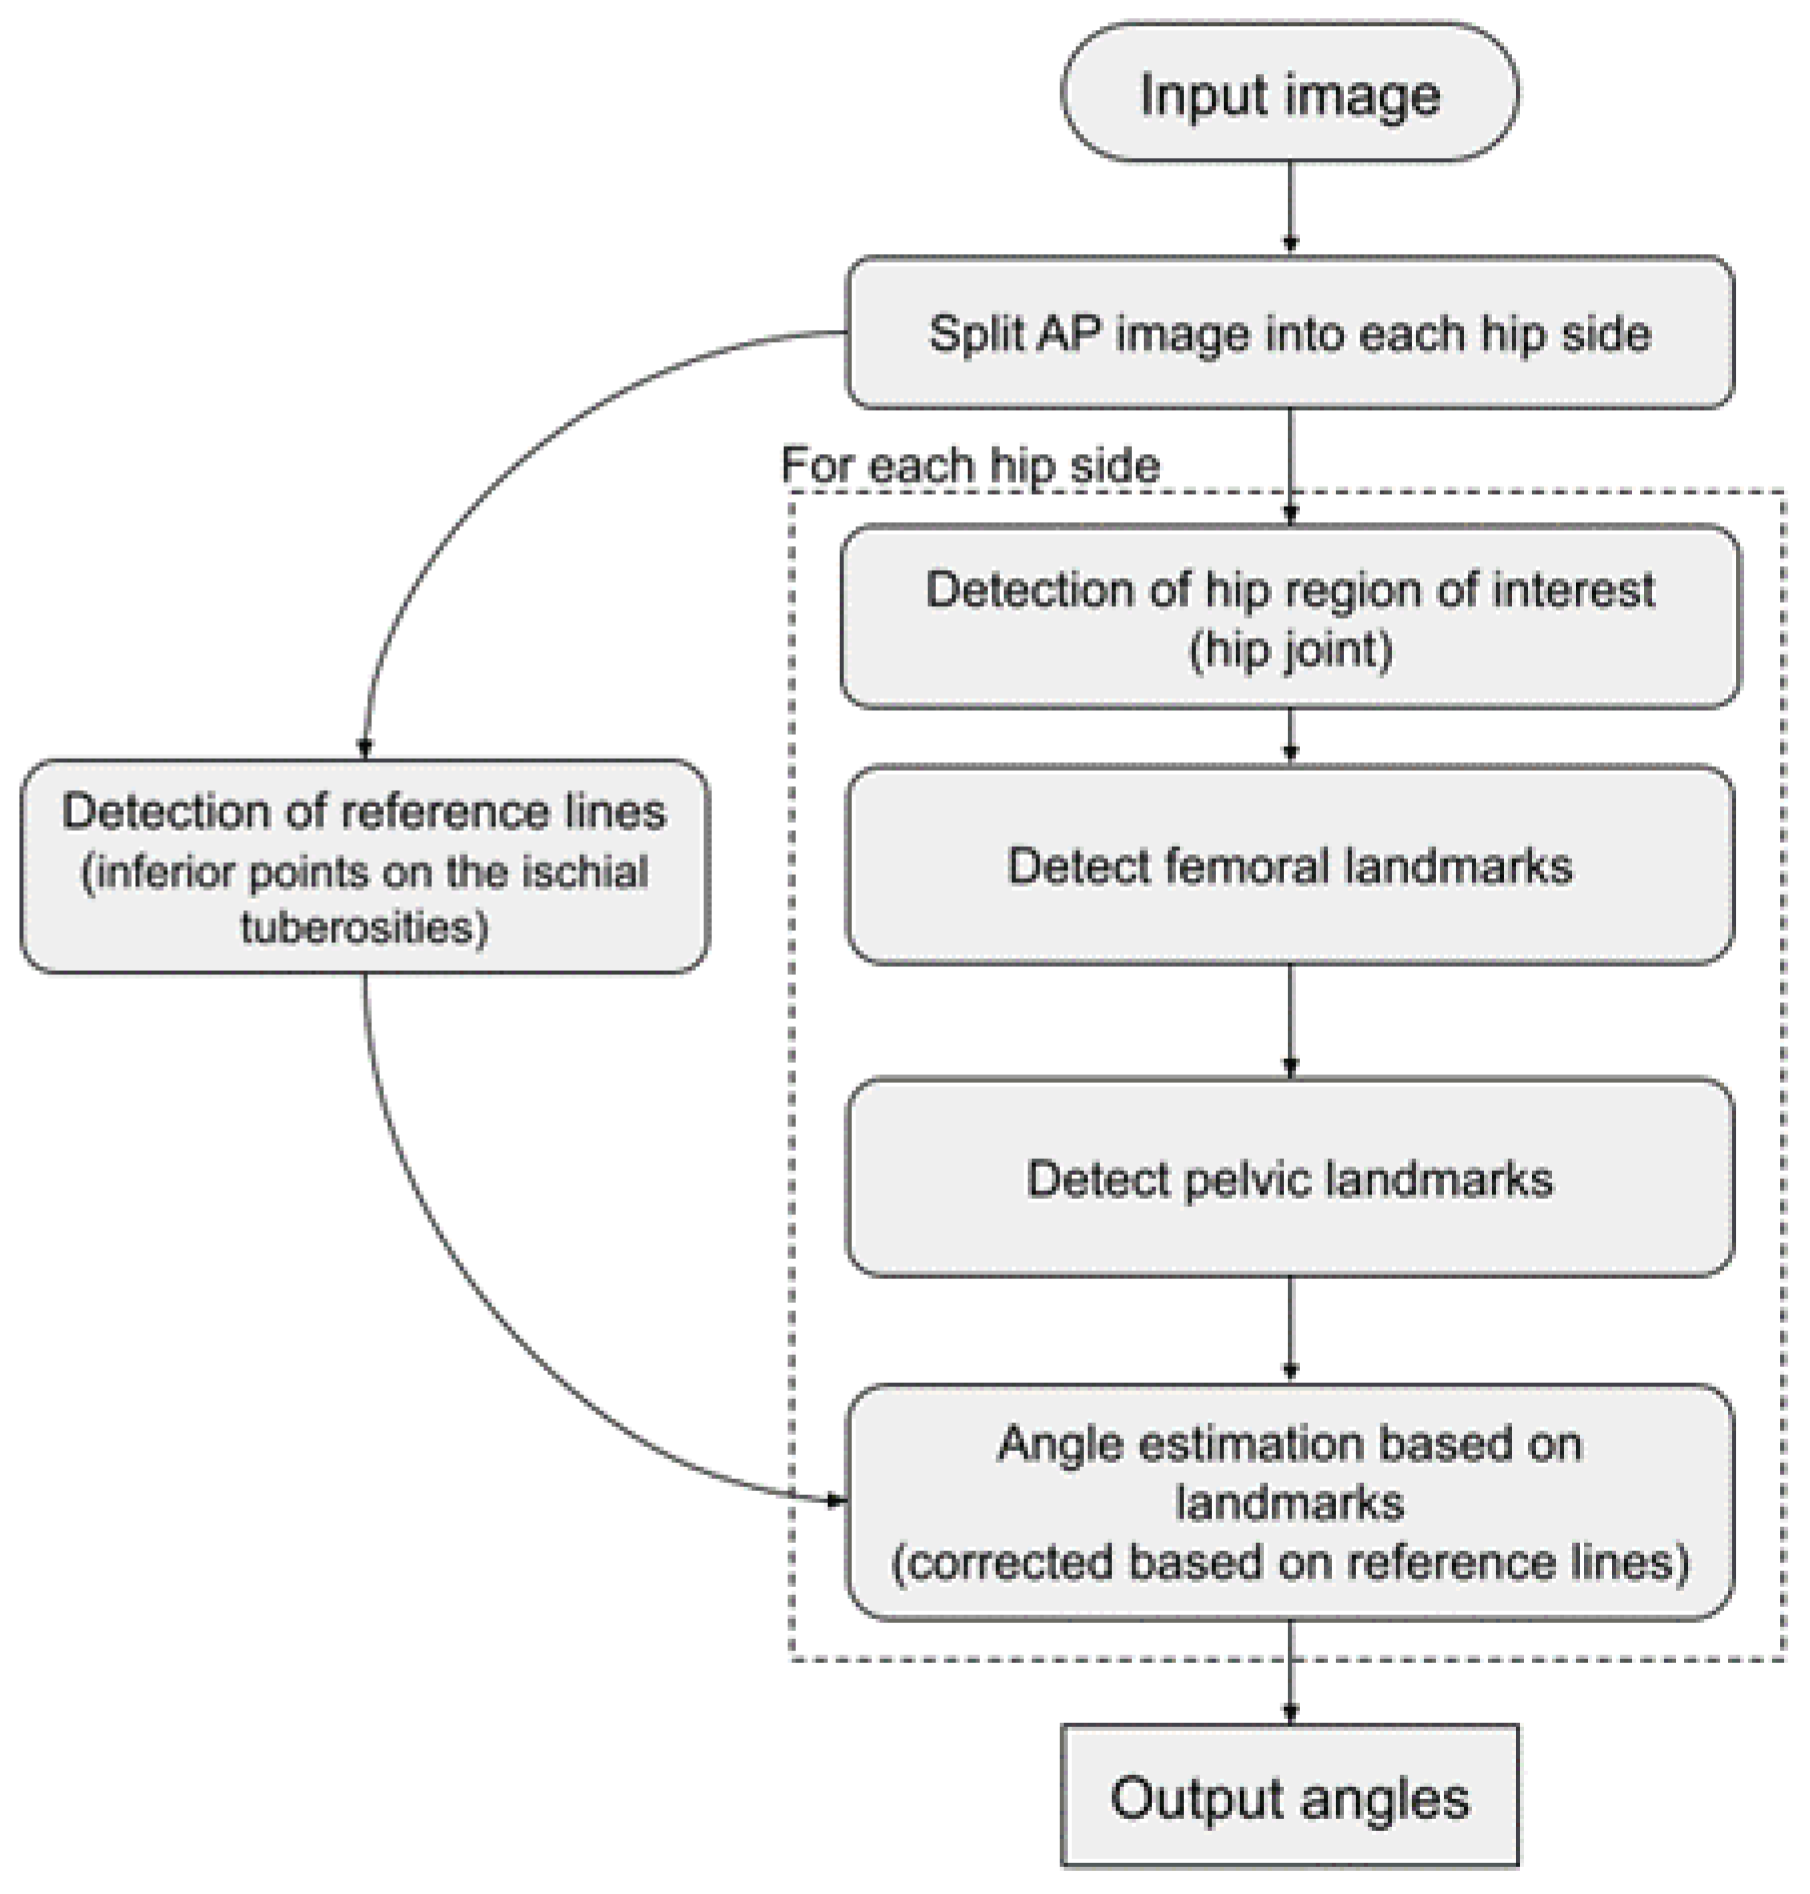
2.4. Algorithm Development and Training
2.5. Data Collection
2.5.1. Human Readers
2.5.2. Algorithm
2.6. Statistical Analyses
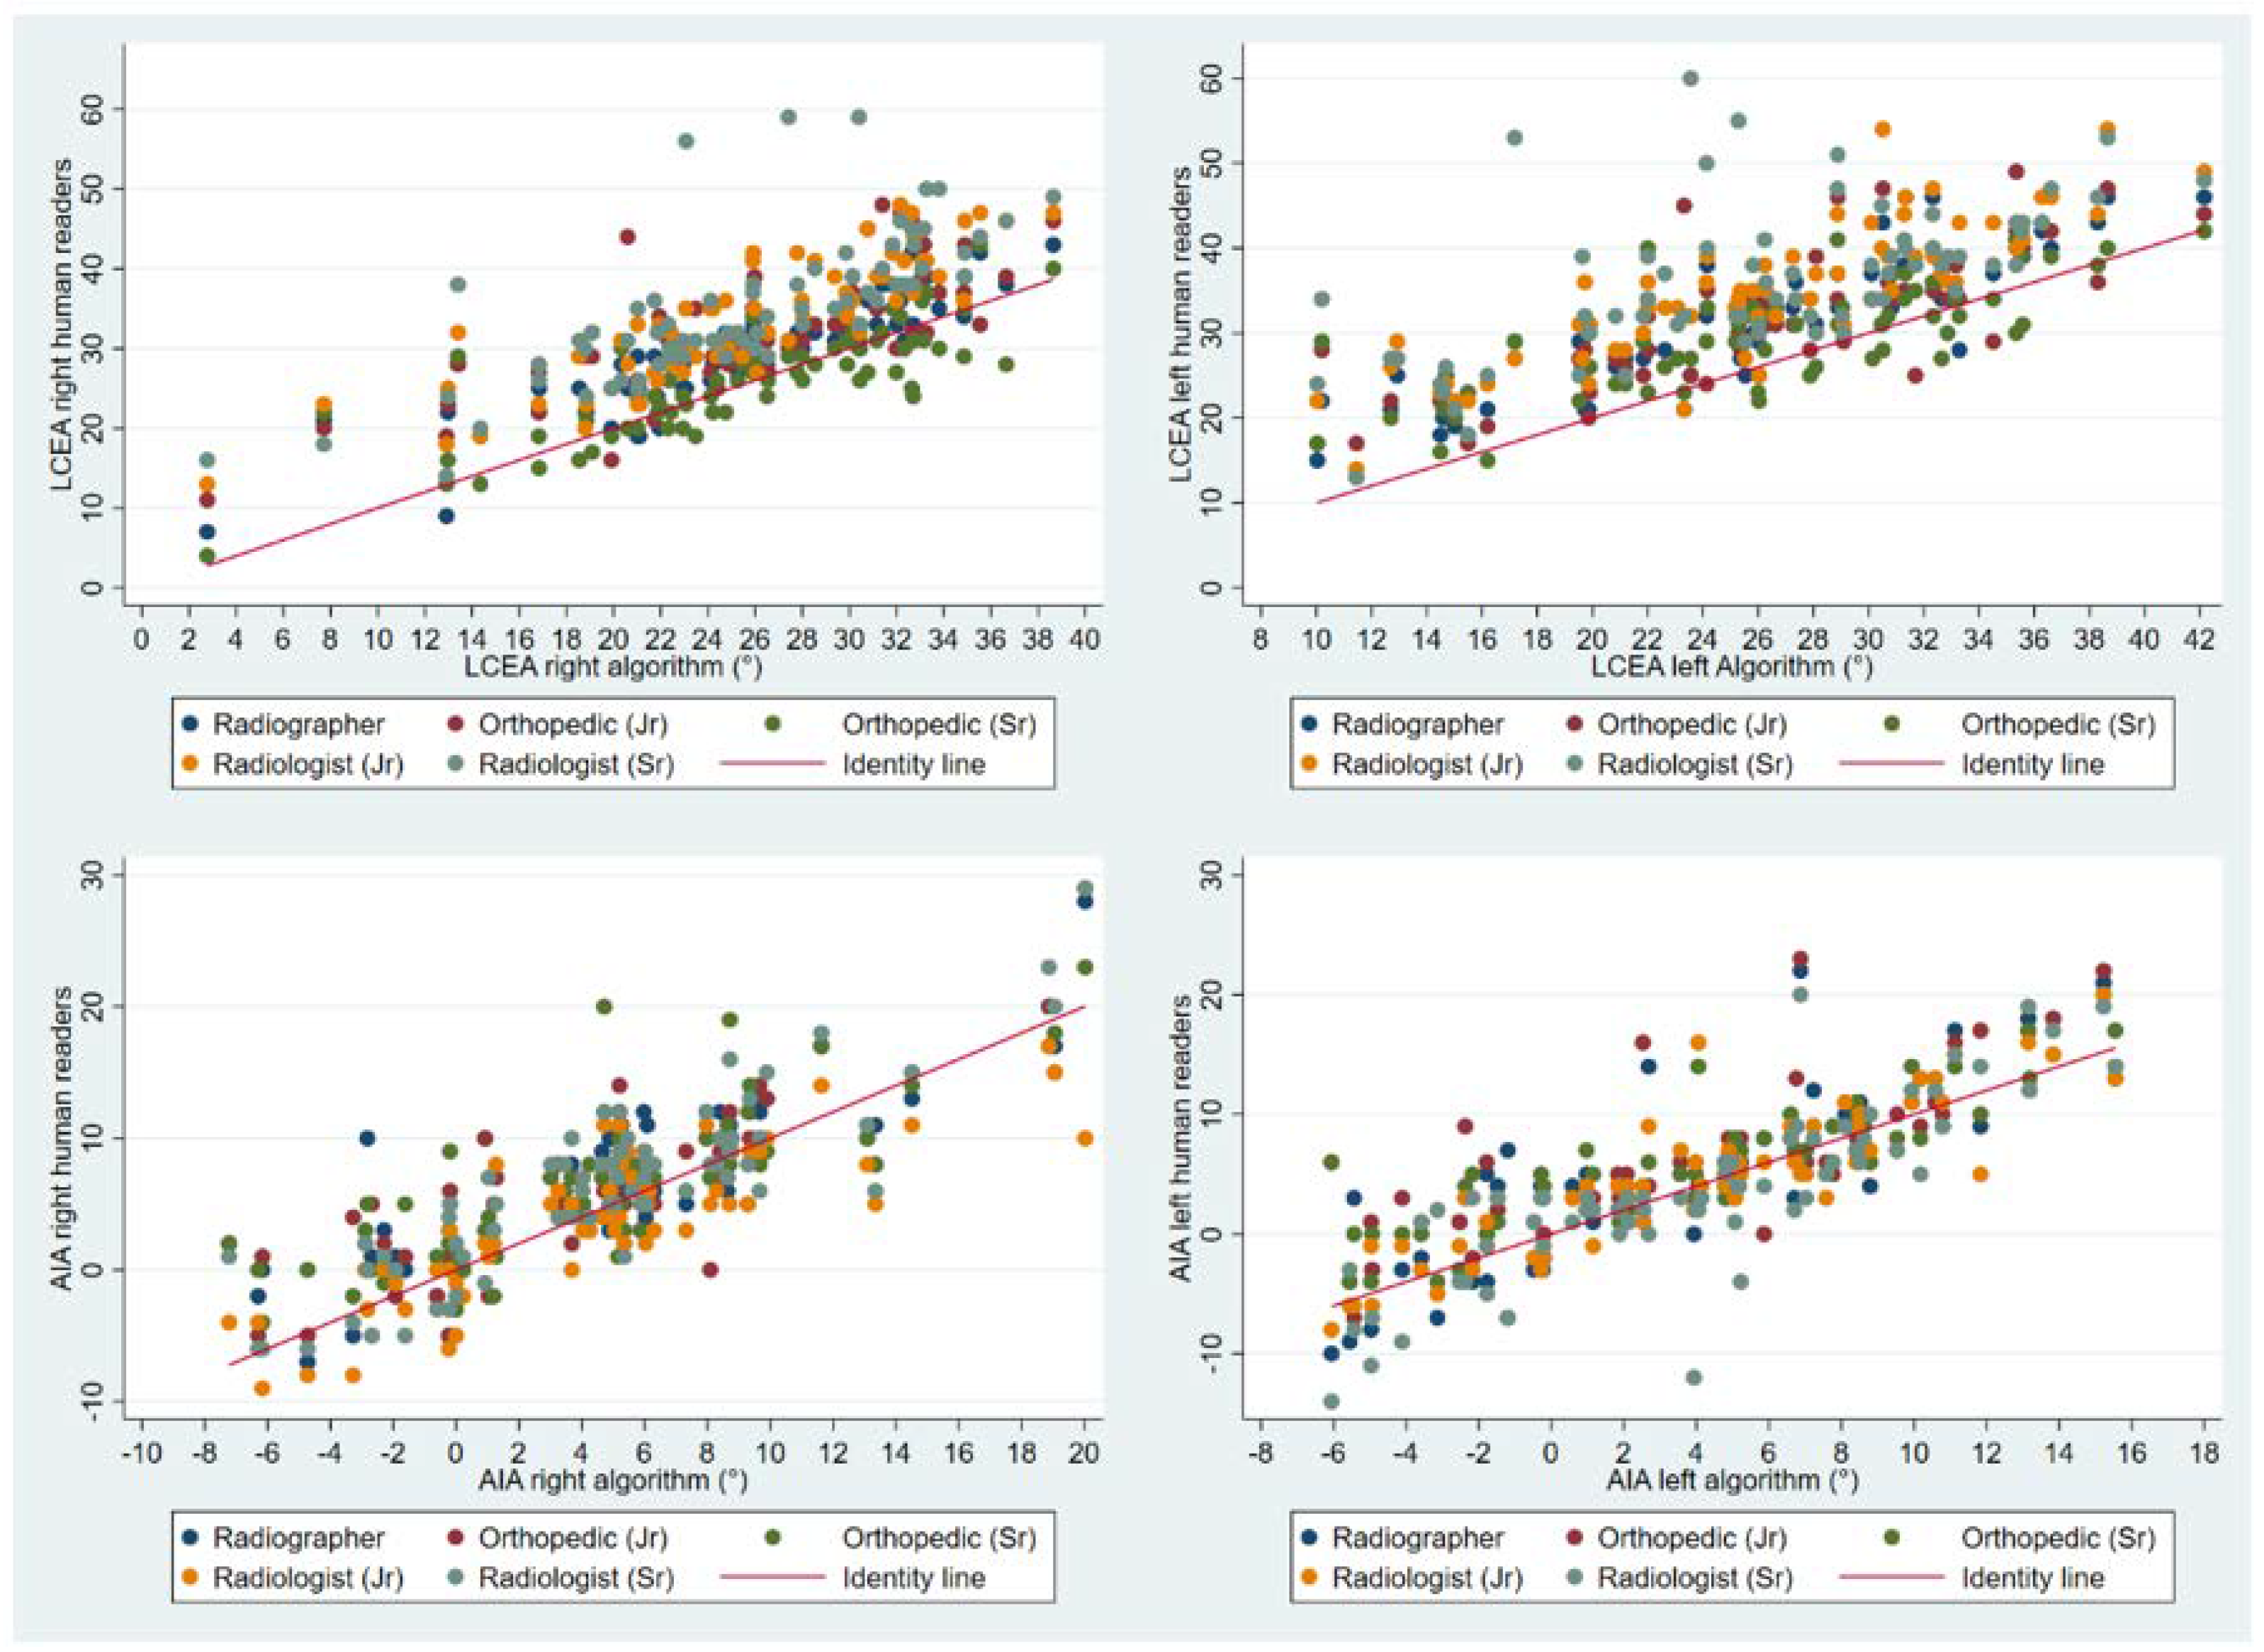
3. Results
4. Discussion
Clinical Implication
Author Contributions
Funding
Institutional Review Board Statement
Informed Consent Statement
Data Availability Statement
Acknowledgments
Conflicts of Interest
References
- Murphy, N.J.; Eyles, J.P.; Hunter, D.J. Hip Osteoarthritis: Etiopathogenesis and Implications for Management. Adv. Ther. 2016, 33, 1921–1946. [Google Scholar] [CrossRef] [PubMed]
- Pun, S.; Kumar, D.; Lane, N.E. Femoroacetabular impingement. Arthritis Rheumatol. 2015, 67, 17–27. [Google Scholar] [CrossRef] [PubMed]
- Bicanic, G.; Barbaric, K.; Bohacek, I.; Aljinovic, A.; Delimar, D. Current concept in dysplastic hip arthroplasty: Techniques for acetabular and femoral reconstruction. World J. Orthop. 2014, 5, 412–424. [Google Scholar] [CrossRef] [PubMed]
- Nunley, R.M.; Prather, H.; Hunt, D.; Schoenecker, P.L.; Clohisy, J.C. Clinical presentation of symptomatic acetabular dysplasia in skeletally mature patients. J. Bone Jt. Surg. 2011, 93 (Suppl. S2), 17–21. [Google Scholar] [CrossRef] [PubMed]
- Leide, R.; Bohman, A.; Wenger, D.; Overgaard, S.; Tiderius, C.J.; Rogmark, C. Hip dysplasia is not uncommon but frequently overlooked: A cross-sectional study based on radiographic examination of 1870 adults. Acta Orthop. 2021, 92, 575–580. [Google Scholar] [CrossRef]
- Park, H.S.; Jeon, K.; Cho, Y.J.; Kim, S.W.; Lee, S.B.; Choi, G.; Lee, S.; Choi, Y.H.; Cheon, J.E.; Kim, W.S.; et al. Diagnostic Performance of a New Convolutional Neural Network Algorithm for Detecting Developmental Dysplasia of the Hip on Anteroposterior Radiographs. Korean J. Radiol. 2021, 22, 612–623. [Google Scholar] [CrossRef] [PubMed]
- Fraiwan, M.; Al-Kofahi, N.; Ibnian, A.; Hanatleh, O. Detection of developmental dysplasia of the hip in X-ray images using deep transfer learning. BMC Med. Inform. Decis. Mak. 2022, 22, 216. [Google Scholar] [CrossRef]
- Ghasseminia, S.; Seyed Bolouri, S.E.; Dulai, S.; Kernick, S.; Brockley, C.; Rakkunedeth Hareendranathan, A.; Zonoobi, D.; Rao, P.; Jaremko, J.L. Automated diagnosis of hip dysplasia from 3D ultrasound using artificial intelligence: A two-center multi-year study. Inform. Med. Unlocked 2022, 33, 101082. [Google Scholar] [CrossRef]
- Bossuyt, P.M.; Reitsma, J.B.; Bruns, D.E.; Gatsonis, C.A.; Glasziou, P.P.; Irwig, L.; Lijmer, J.G.; Moher, D.; Rennie, D.; de Vet, H.C.; et al. STARD 2015: An Updated List of Essential Items for Reporting Diagnostic Accuracy Studies. Clin. Chem. 2015, 61, 1446–1452. [Google Scholar] [CrossRef]
- Kottner, J.; Audigé, L.; Brorson, S.; Donner, A.; Gajewski, B.J.; Hróbjartsson, A.; Roberts, C.; Shoukri, M.; Streiner, D.L. Guidelines for Reporting Reliability and Agreement Studies (GRRAS) were proposed. J. Clin. Epidemiol. 2011, 64, 96–106. [Google Scholar] [CrossRef]
- Carlisle, J.C.; Zebala, L.P.; Shia, D.S.; Hunt, D.; Morgan, P.M.; Prather, H.; Wright, R.W.; Steger-May, K.; Clohisy, J.C. Reliability of various observers in determining common radiographic parameters of adult hip structural anatomy. Iowa Orthop. J. 2011, 31, 52–58. [Google Scholar] [PubMed]
- Jacobsen, S.; Sonne-Holm, S.; Lund, B.; Søballe, K.; Kiaer, T.; Rovsing, H.; Monrad, H. Pelvic orientation and assessment of hip dysplasia in adults. Acta Orthop. Scand. 2004, 75, 721–729. [Google Scholar] [CrossRef] [PubMed]
- He, K.; Zhang, X.; Ren, S.; Sun, J. Deep Residual Learning for Image Recognition. arXiv 2015, arXiv:1512.03385. [Google Scholar] [CrossRef]
- Mascarenhas, V.V.; Castro, M.O.; Rego, P.A.; Sutter, R.; Sconfienza, L.M.; Kassarjian, A.; Schmaranzer, F.; Ayeni, O.R.; Dietrich, T.J.; Robinson, P.; et al. The Lisbon Agreement on Femoroacetabular Impingement Imaging-part 1: Overview. Eur. Radiol. 2020, 30, 5281–5297. [Google Scholar] [CrossRef] [PubMed]
- Hanson, J.A.; Kapron, A.L.; Swenson, K.M.; Maak, T.G.; Peters, C.L.; Aoki, S.K. Discrepancies in measuring acetabular coverage: Revisiting the anterior and lateral center edge angles. J. Hip Preserv. Surg. 2015, 2, 280–286. [Google Scholar] [CrossRef]
- Erenstein, H.G.; Browne, D.; Curtin, S.; Dwyer, R.S.; Higgins, R.N.; Hommel, S.F.; Menzinga, J.; Pires Jorge, J.A.; Sauty, M.; de Vries, G.; et al. The validity and reliability of the exposure index as a metric for estimating the radiation dose to the patient. Radiography 2020, 26 (Suppl. S2), S94–S99. [Google Scholar] [CrossRef]
- Bland, J.M.; Altman, D.G. Measuring agreement in method comparison studies. Stat. Methods Med. Res. 1999, 8, 135–160. [Google Scholar] [CrossRef]
- Carkeet, A. Exact parametric confidence intervals for Bland-Altman limits of agreement. Optom. Vis. Sci. 2015, 92, e71–e80. [Google Scholar] [CrossRef]
- Gerke, O.; Vilstrup, M.H.; Segtnan, E.A.; Halekoh, U.; Høilund-Carlsen, P.F. How to assess intra- and inter-observer agreement with quantitative PET using variance component analysis: A proposal for standardisation. BMC Med. Imaging 2016, 16, 54. [Google Scholar] [CrossRef]
- Lu, M.J.; Zhong, W.H.; Liu, Y.X.; Miao, H.Z.; Li, Y.C.; Ji, M.H. Sample Size for Assessing Agreement between Two Methods of Measurement by Bland-Altman Method. Int. J. Biostat. 2016, 12. [Google Scholar] [CrossRef]
- Ellsworth, B.K.; Sink, E.L.; Doyle, S.M. Adolescent hip dysplasia: What are the symptoms and how to diagnose it. Curr. Opin. Pediatr. 2021, 33, 65–73. [Google Scholar] [CrossRef] [PubMed]
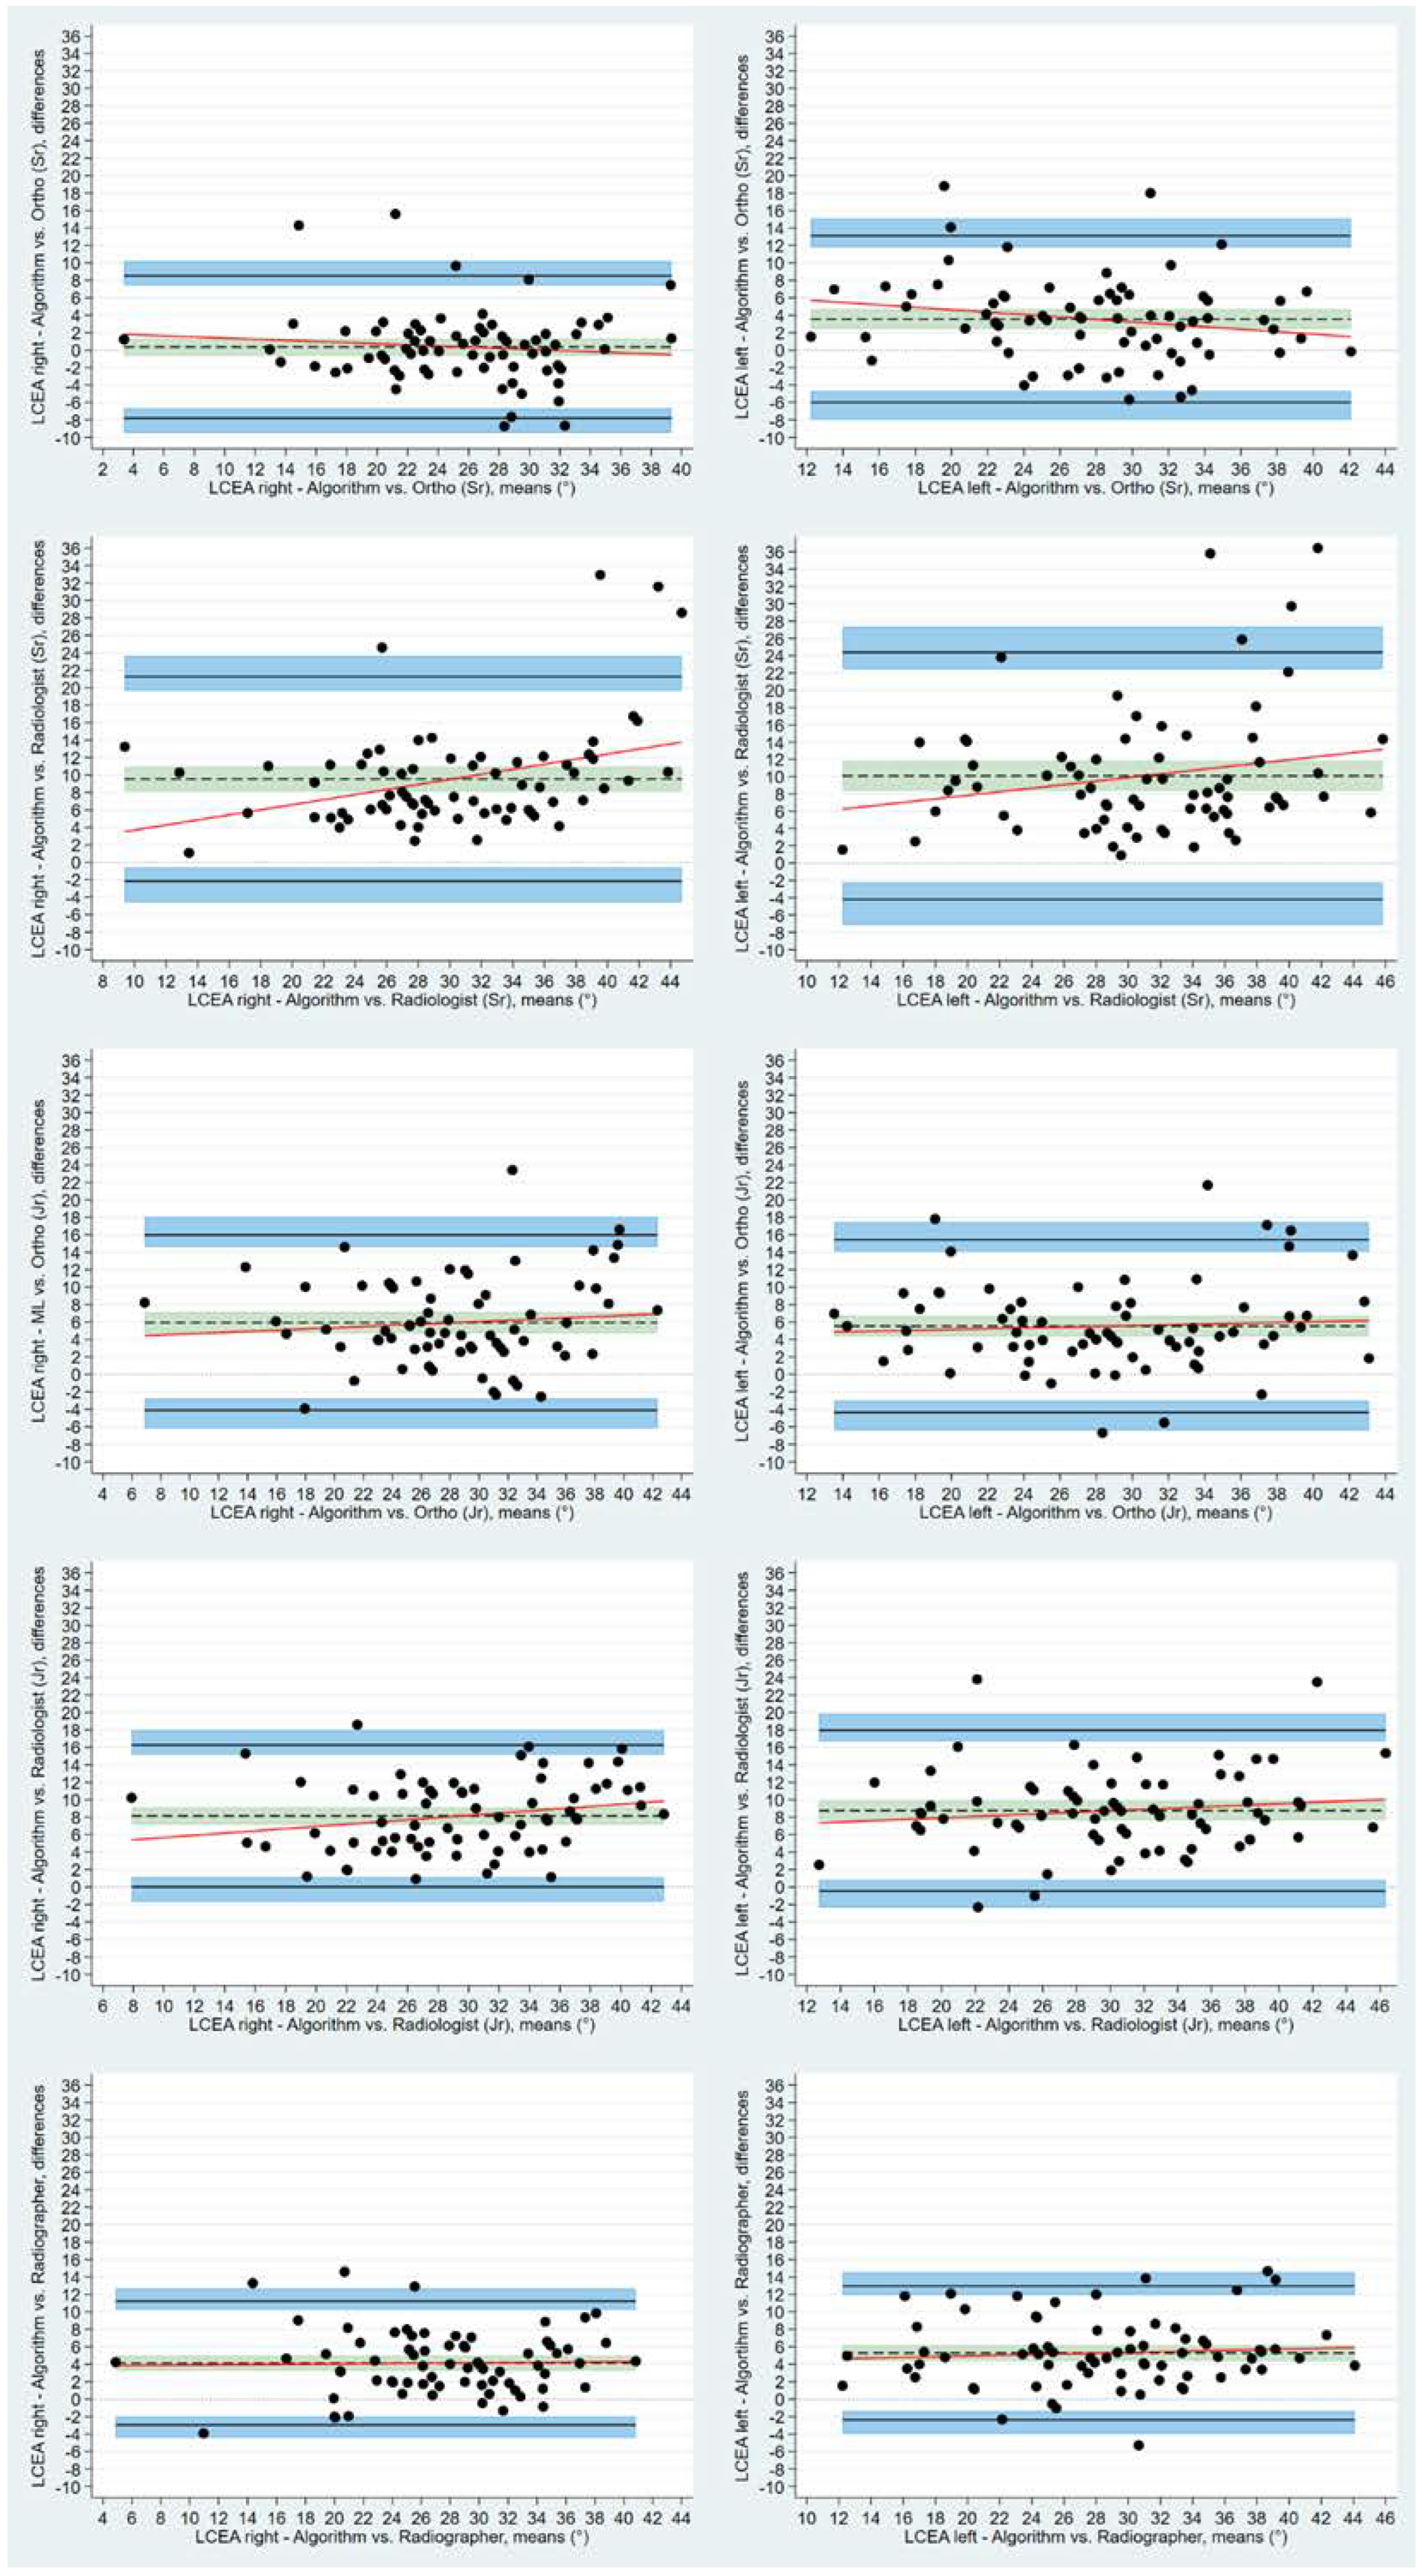
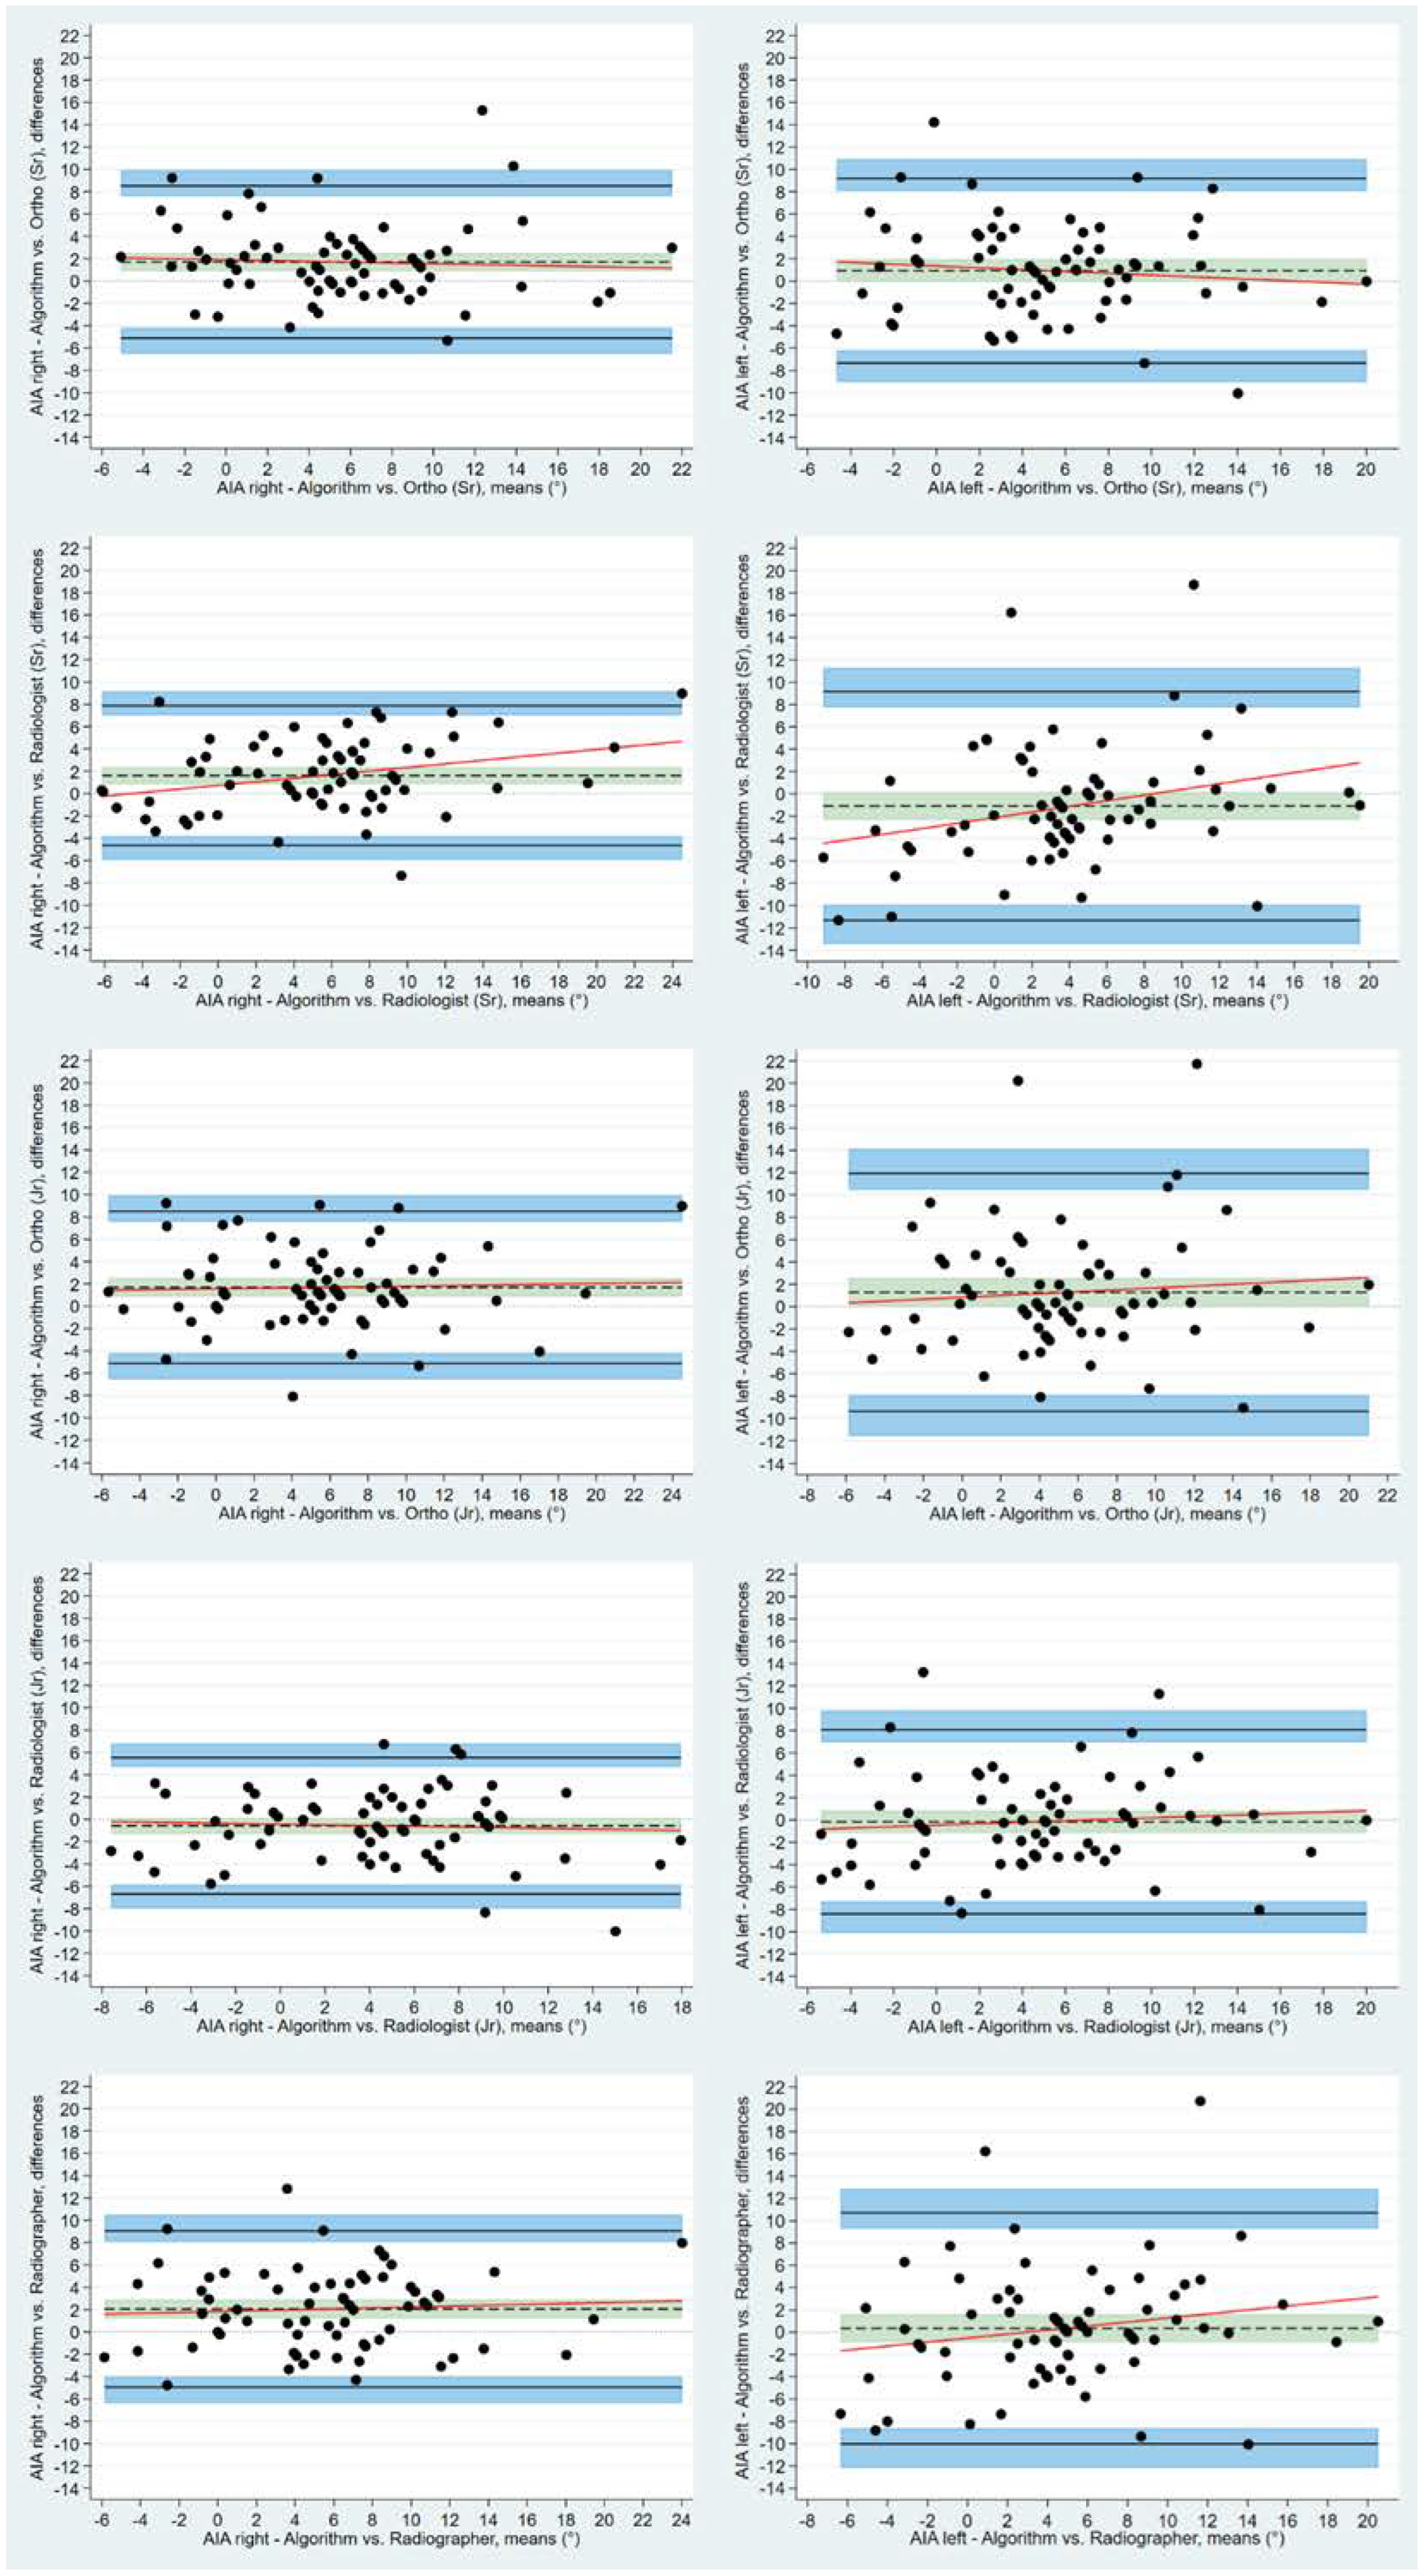
| Mean (SD) | Mean (SD) Diff | Range [min; ma×] | Range Diff [min; ma×] | Q1 | Q1Diff | Q3 | Q3Diff | |
|---|---|---|---|---|---|---|---|---|
| LCEARight | 25.43 (6.96) | 3.97 × 10⁻¹⁴ (4.9 × 10⁻¹⁴) | [2.77; 38.65] | [0; 0] | 21.10 | 0 | 31.16 | 9.95 × 10⁻¹⁴ |
| LCEALeft | 25.91 (7.51) | 4.78 × 10⁻¹⁴ (5.03 × 10⁻¹⁴) | [10.03; 42.16] | [0; 1.03 × 10⁻¹²] | 20.84 | 0 | 31.33 | 9.95 × 10⁻¹⁴ |
| AIARight | 4.69 (5.67) | 4.8 × 10⁻¹⁵ (1.72 × 10⁻¹⁴) | [−7.22; 20.03] | [−1.02 × 10⁻¹⁴; 9.95 × 10⁻¹⁴] | 0.23 | 0 | 8.29 | 9.77 × 10⁻¹⁵ |
| AIALeft | 4.03 (5.40) | 8.14 × 10⁻¹⁵ (2.58 × 10⁻¹⁴) | [−6.06; 15.55] | [−1.02 × 10⁻¹⁴; −9.95 × 10⁻¹⁴] | −0.23 | 0 | 8.11 | 8.88 × 10⁻¹⁴ |
| LCEA (SD) [Range] | AIA (SD) [Range] | |||
|---|---|---|---|---|
| Right | Left | Right | Left | |
| O1 | 29.5 (7.0) [7 to 43] | 31.2 (7.8) [11 to 48] | 6.7 (5.9) [−7 to 28] | 5.0 (6.6) [−10 to 22] |
| O2 | 31.4 (7.4) [11 to 48] | 31.4 (7.8) [17 to 49] | 6.4 (5.8) [−5 to 29] | 6.0 (6.1) [−7 to 23] |
| O3 | 25.8 (6.6) [4 to 43] | 29.5 (6.6) [13 to 43] | 6.4 (5.5) [−4 to 23] | 5.6 (5.3) [−7 to 20] |
| O4 | 33.6 (7.8) [13 to 48] | 34.7 (8.1) [14 to 54] | 4.1 (5.5) [−9 to 17] | 4.5 (6.0) [−8 to 20] |
| O5 | 35.0 (9.0) [14 to 59] | 36.0 (8.9) [13 to 60] | 6.3 (6.6) [−6 to 29] | 3.6 (7.0) [−14 to 20] |
| A | 25.4 (7.0) [3 to 39] | 25.9 (7.5) [10 to 42] | 4.7 (5.7) [−7 to 20] | 4.0 (5.4) [−6 to 16] |
| Bias Mean (SD) | Bias 95% CI | Limits of Agreement | Lower Limit of Agreement 95% CI | Upper Limit of Agreement 95% CI | ||
|---|---|---|---|---|---|---|
| LCEAright | O1 | 4.13 (3.62) | 3.28 to 4.99 | −2.95 to 11.22 | −4.43 to −1.99 | 10.25 to 12.69 |
| O2 | 5.93 (5.12) | 4.72 to 7.15 | −4.10 to 15.97 | −6.19 to −2.73 | 14.60 to 18.05 | |
| O3 | 0.37 (4.16) | −0.61 to 1.36 | −7.79 to 8.53 | −9.48 to −6.67 | 7.42 to 10.23 | |
| O4 | 8.15 (4.14) | 7.17 to 9.13 | 0.02 to 16.27 | −1.66 to 1.13 | 15.16 to 17.96 | |
| O5 | 9.56 (5.98) | 8.14 to 10.97 | −2.16 to 21.27 | −4.59 to −0.56 | 19.67 to 23.70 | |
| LCEAleft | O1 | 5.29 (3.91) | 4.37 to 6.22 | −2.37 to 12.95 | −3.96 to −1.32 | 11.90 to 14.54 |
| O2 | 5.53 (5.04) | 4.34 to 6.73 | −4.36 to 15.42 | −6.41 to −3.01 | 14.07 to 17.47 | |
| O3 | 3.56 (4.87) | 2.41 to 4.74 | −5.99 to 13.10 | −7.97 to −4.68 | 11.80 to 15.09 | |
| O4 | 8.76 (4.70) | 7.65 to 9.87 | −0.45 to 17.96 | −2.36 to 0.81 | 16.70 to 19.87 | |
| O5 | 10.01 (7.29) | 8.37 to 11.82 | −4.19 to 24.38 | −7.16 to −2.24 | 22.43 to 27.35 |
| Bias Mean (SD) | Bias 95% CI | Limits of Agreement | Lower Limit of Agreement 95% CI | Upper Limit of Agreement 95% CI | ||
|---|---|---|---|---|---|---|
| AIAright | O1 | 2.06 (3.57) | 1.21 to 2.90 | −4.94 to 9.05 | −6.39 to −3.98 | 8.10 to 10.50 |
| O2 | 1.69 (3.48) | 0.87 to 2.51 | −5.13 to 8.51 | −6.55 to −4.20 | 7.58 to 9.93 | |
| O3 | 1.70 (3.48) | 0.88 to 2.53 | −5.11 to 8.53 | −6.54 to −4.19 | 7.59 to 9.94 | |
| O4 | −0.58 (3.12) | −1.32 to 0.16 | −6.69 to 5.5 | −7.96 to −5.86 | 4.70 to 6.80 | |
| O5 | 1.62 (3.19) | 0.86 to 2.37 | −4.63 to 7.87 | −5.93 to −3.78 | 7.02 to 9.17 | |
| AIAleft | O1 | 0.35 (5.29) | −0.90 to 1.60 | −10.01 to 10.72 | −12.17 to −8.60 | 9.30 to 12.87 |
| O2 | 1.28 (5.44) | −0.01 to 2.57 | −9.37 to 11.93 | −11.58 to −7.92 | 10.48 to 14.15 | |
| O3 | 0.93 (4.22) | −0.07 to 1.93 | −7.34 to 9.19 | −9.05 to −6.21 | 8.06 to 10.91 | |
| O4 | −0.17 (4.21) | −1.17 to 0.83 | −8.42 to 8.08 | −10.13 to −7.29 | 6.95 to 9.79 | |
| O5 | −1.09 (5.22) | −2.32 to 0.15 | −11.32 to 9.15 | −13.45 to −9.92 | 7.75 to 11.28 |
| Component | Estimate | 95 % CI | p-Value | |
|---|---|---|---|---|
| LCEARight | ||||
| Constant | 26.03 | 19.25 to 32.82 | <0.0001 | |
| Patient variance | 39.46 | 27.80 to 56.01 | ||
| Reader variance | 11.88 | 2.9 to 48.62 | ||
| Repeated measure variance | 7.44 | 0.87 to 63.49 | ||
| Residual variance | 17.80 | 15.36 to 20.62 | ||
| LCEALeft | ||||
| Constant | 28.55 | 21.70 to 35.39 | <0.0001 | |
| Patient variance | 46.32 | 32.77 to 65.49 | ||
| Reader variance | 7.73 | 1.86 to 32.14 | ||
| Repeated measure variance | 7.16 | 0.82 to 62.39 | ||
| Residual variance | 19.08 | 16.47 to 22.10 | ||
| AIARight | ||||
| Constant | 4.84 | 0.66 to 9.02 | 0.023 | |
| Patient variance | 25.36 | 17.97 to 35.79 | ||
| Reader variance | 1.27 | 0.29 to 5.70 | ||
| Repeated measure variance | 1.25 | N/A | ||
| Residual variance | 8.93 | 7.71 to 10.34 | ||
| AIALeft | ||||
| Constant | 3.27 | −1.40 to 7.93 | 0.170 | |
| Patient variance | 33.39 | 23.82 to 46.82 | ||
| Reader variance | 0.65 | 0.13 to 3.23 | ||
| Repeated measure variance | 4.89 | N/A | ||
| Residual variance | 8.80 | 7.60 to 10.20 | ||
| Residual variance | 111.37 | 96.18 to 128.97 |
| Repeatability Coefficient | ||
|---|---|---|
| Same Patient, Same Reader | Same Patient, Different Reader | |
| LCEARight | 11.69 | 15.09 |
| LCEALeft | 12.10 | 14.34 |
| AIARight | 8.28 | 8.85 |
| AIALeft | 8.22 | 8.52 |
Publisher’s Note: MDPI stays neutral with regard to jurisdictional claims in published maps and institutional affiliations. |
© 2022 by the authors. Licensee MDPI, Basel, Switzerland. This article is an open access article distributed under the terms and conditions of the Creative Commons Attribution (CC BY) license (https://creativecommons.org/licenses/by/4.0/).
Share and Cite
Jensen, J.; Graumann, O.; Overgaard, S.; Gerke, O.; Lundemann, M.; Haubro, M.H.; Varnum, C.; Bak, L.; Rasmussen, J.; Olsen, L.B.; et al. A Deep Learning Algorithm for Radiographic Measurements of the Hip in Adults—A Reliability and Agreement Study. Diagnostics 2022, 12, 2597. https://doi.org/10.3390/diagnostics12112597
Jensen J, Graumann O, Overgaard S, Gerke O, Lundemann M, Haubro MH, Varnum C, Bak L, Rasmussen J, Olsen LB, et al. A Deep Learning Algorithm for Radiographic Measurements of the Hip in Adults—A Reliability and Agreement Study. Diagnostics. 2022; 12(11):2597. https://doi.org/10.3390/diagnostics12112597
Chicago/Turabian StyleJensen, Janni, Ole Graumann, Søren Overgaard, Oke Gerke, Michael Lundemann, Martin Haagen Haubro, Claus Varnum, Lene Bak, Janne Rasmussen, Lone B. Olsen, and et al. 2022. "A Deep Learning Algorithm for Radiographic Measurements of the Hip in Adults—A Reliability and Agreement Study" Diagnostics 12, no. 11: 2597. https://doi.org/10.3390/diagnostics12112597
APA StyleJensen, J., Graumann, O., Overgaard, S., Gerke, O., Lundemann, M., Haubro, M. H., Varnum, C., Bak, L., Rasmussen, J., Olsen, L. B., & Rasmussen, B. S. B. (2022). A Deep Learning Algorithm for Radiographic Measurements of the Hip in Adults—A Reliability and Agreement Study. Diagnostics, 12(11), 2597. https://doi.org/10.3390/diagnostics12112597


