Article

Radioembolization-Induced Changes in Hepatic [18F]FDG Metabolism in Non-Tumorous Liver Parenchyma

Department of Radiology and Nuclear Medicine, University Medical Center Utrecht, Heidelberglaan 100, 3584 CX Utrecht, The Netherlands
*
Author to whom correspondence should be addressed.
Diagnostics 2022, 12(10), 2518; https://doi.org/10.3390/diagnostics12102518
Submission received: 24 September 2022 / Revised: 7 October 2022 / Accepted: 13 October 2022 / Published: 17 October 2022
(This article belongs to the Topic F-18 FDG PET/CT Imaging)

Abstract

:
Background: [18F]FDG-PET/CT is increasingly used for response assessments after oncologic treatment. The known response criteria for [18F]FDG-PET/CT use healthy liver parenchyma as the reference standard. However, the [18F]FDG liver metabolism results may change as a result of the given therapy. The aim of this study was to assess changes in [18F]FDG liver metabolism after hepatic 90Y resin radioembolization. Methods: [18F]FDG-PET/CT scans prior to radioembolization and one and three months after radioembolization (consistent with the PERCIST comparability criteria), as well as 90Y-PET/CT scans, were analyzed using 3 cm VOIs. The FDG activity concentration and absorbed dose were measured. A linear mixed-effects logistic regression model and logistic mixed-effects model were used to assess the correlation between the FDG-activity concentration, absorbed dose, and biochemical changes. Results: The median SULVOI,liver at baseline was 1.8 (range = 1.2–2.8). The mean change in SULVOI,liver per month with an increase in time was 0.05 (95%CI 0.02–0.09) at p < 0.001. The median absorbed dose per VOI was 31.3 Gy (range = 0.1–82.3 Gy). The mean percent change in ΔSULVOI,liver for every Gy increase in the absorbed dose was –0.04 (95%CI −0.22–0.14) at p = 0.67. The SULblood and SULspleen results showed no increase. Conclusions: The [18F]FDG metabolism in the normal liver parenchyma is significantly but mildly increased after radioembolization, which can interfere with its use as a threshold for therapy response.

1. Introduction

More and more [18F]FDG-PET/CT studies are being performed for response evaluations, as anatomical imaging modalities lack adequate response assessment ability or useful and consistent response criteria, or have minor prognostic value [1]. In light of these limitations of anatomical imaging, two distinct response assessment criteria were defined for [18F]FDG-PET: the EORTC criteria, in use since 1999 [2]; and the PERCIST criteria, in use since 2009 [1]. Their differences are outlined in Supplementary Table S1. The mean and maximum standard uptake values (SUVmean and SUVmax) corrected for body weight in a 2D region of interest (ROI) in the most metabolic part of as many tumors as possible are used in EORTC [2], while SUVs corrected for lean body mass (=SUL) in a stringent volume of interest (VOI) of 1 cm3 centered on the most metabolic active part of up to 5 tumors (=SULpeak) are used in PERCIST [1]. Additionally, PERCIST uses a SULmean assessment of the right lobe of the liver (or blood pool) for [18F]FDG-PET comparability at different time points and as a threshold to define the response.
In light of the PERCIST criteria and its use of a VOI in the right liver lobe to assess the comparability of [18F]FDG-PET, multiple test–retest studies in healthy volunteers or former cancer patients showed that the quantification of the physiological activity concentrations of [18F]FDG were similar over longer periods of time, including in the liver parenchyma [3]. However, studies performed in oncologic patients (mainly lymphoma patients) showed that some types of chemotherapy had an effect on the healthy liver parenchyma, leading to an increase in mean liver activity upon [18F]FDG-PET [4,5]. This poses a problem with the current response assessment criteria used in lymphoma patients, the Deauville criteria [6,7,8,9,10], in which the response is based on a visual assessment, comparing the tumor uptake to the liver uptake. Theoretically, the response after treatment could be wrongfully overestimated.
For the treatment of hepatic malignancies, radioembolization has gained ground in the last decades. During that time, multiple studies have used [18F]FDG-PET/CT for response assessments and applied the PERCIST criteria [11,12]. However, the concomitant non-target embolization and radiation of the non-tumorous liver parenchyma (NTLP) may lead to a localized and systemic inflammatory reaction [13,14]. Eventually, changes consistent with sinusoidal obstruction syndrome (SOS) and fibrosis can develop [15,16].
We hypothesized that the [18F]FDG activity concentration in NTLP changes after radioembolization, leading to the misinterpretation and possible overestimation of the response using this activity concentration as a threshold in the PERCIST criteria. In this study, it was investigated whether the [18F]FDG activity concentration in NTLP changes after radioembolization and whether alternative reference values can be used.

2. Methods

2.1. Study Population

This retrospective monocenter study comprised all patients treated with 90Y resin microspheres (SIRTeX Medical, Sydney, Australia) in our center from 2009 until July 2015, with an [18F]FDG-PET/CT prior ([18F]FDG-PET/CTprior) and one or three months after treatment ([18F]FDG-PET/CTfollow-up). Patients were only included if the [18F]FDG-PET/CT scans met the PERCIST criteria (Supplementary Table S1) and if a 90Y-PET/CT was performed within 24 h of radioembolization for a regional dose calculation of the NTLP.
The institutional medical ethics committee waived the need for informed consent for this retrospective review.

2.2. Radioembolization Treatment

After a pre-treatment hepatic arteriography to evaluate the vascular anatomy, a simulation was performed with the injection of 99mTc-macroaggregated albumin (MAA) into the hepatic artery or arteries. Standard planar and SPECT images of 99mTc-MAA were obtained for particle distribution assessments and to exclude relevant liver–lung shunting and extrahepatic depositions. In a separate session, 90Y resin microspheres were injected into the hepatic artery or arteries after ensuring adequate catheter placement (similar to the 99mTc-MAA injection position). The therapeutic activity of 90Y resin microspheres was calculated according to the body surface area method.

2.3. [18F]FDG-PET/CT Imaging Protocols

All [18F]FDG-PET/CT scans at all time points were performed on the same PET/CT-scanner (Biograph mCT, Siemens Healthcare, Erlangen, Germany). All patients fasted for at least 6 h prior to intravenous [18F]FDG administration (2.0 MBq/kg) and each patient’s blood glucose level was determined prior to the tracer injection (<11.1 mmol/L). The imaging parameters included a three-dimensional acquisition technique with a 216 mm field of view, 3 min per bed position, and ordered subset expectation maximization iterative reconstruction, including a Gaussian filter, 4 iterations, and 21 subsets. The measurements were performed on image reconstructions according to the EARL criteria [17].

2.4. 90Y-PET/CT Imaging Protocol

All 90Y-PET/CT’s were performed on the same PET/CT-scanner (Biograph mCT, Siemens Healthcare, Erlangen, Germany) within 24 h of treatment. The imaging parameters included a total acquisition time of 30 min for 2 bed positions, TrueX and time-of-flight reconstructions, and a reconstruction using 4 iterations with 21 subsets and a 5 mm full-with at half maximum Gaussian post-reconstruction filter. A low-dose CT scan was acquired for attenuation correction and as an anatomical reference.

2.5. Healthy Liver Parenchyma Analysis

All [18F]FDG-PET/CT and 90Y-PET/CT scans were analyzed using ROVER software (ABX, Radeberg, Germany). A 3 cm VOI in the right lobe of a normal liver is a robust indicator for the identification of the SULmean [18] and is applied in the PERCIST criteria as a threshold parameter. To assess the NTLP activity concentration, the liver was separated into three regions, consistent with the three supplying arteries: the left hemiliver (i.e., the left hepatic artery (LHA)), the right hemiliver (i.e., the right hepatic artery (RHA)), and segment 4 (i.e., the middle hepatic artery (MHA) or segment 4 artery). Segment 4 was considered a separate region, as the MHA can be separately injected.
Spheric VOIs (3 cm in diameter) were placed in the NTLP in all three liver regions and in the spleen. If one of the regions was too diffusely involved in malignancy to accommodate a 3 cm VOI, no VOI was placed. In cases of (extended) right-sided hemihepatectomy, a second VOI was placed in the remaining liver tissue. Cilindrical VOIs with a 2 cm diameter were placed in the ascending, descending, and abdominal aortas, without inclusion of the aortic wall (to avoid elevated [18F]FDG-uptake due to atherosclerosis).
The [18F]FDG-PET/CTfollow-up of each patient was registered to the [18F]FDG-PET/CTprior. ROIs were automatically co-registered onto the [18F]FDG-PET/CTfollow-up, but were manually corrected if the automatic placement of the VOI did not correspond to the location of the VOI on the [18F]FDG-PET/CTprior.
The SULmean and SULmax were calculated for all VOIs.
The same parameters were registered for the spleen, as well as the splenic volume. The splenic volume is known to increase after radioembolization; however, it is unknown whether the [18F]FDG activity concentration changes are correlated to splenic volume changes [19].
In addition, all 90Y-PET/CT scans were registered to the [18F]FDG-PET/CTprior and the liver VOIs were co-registered onto the 90Y-PET/CT, enabling a read-out of the absorbed dose (MBq/mL) in the same three regional VOIs. In a previous report, we validated the use of ROVER software for absorbed dose estimation on 90Y-PET/CT [20].
All measurements on the [18F]FDG-PET/CTprior were performed by one physician (MB; >10 years of experience).

2.6. Biochemical Changes

Laboratory examinations at the time of each PET/CT were noted, including liver function tests (total bilirubin, alkaline phosphatase, gamma-glutamyl transferase (GGT), aspartate aminotransferase (AST), alanine aminotransferase (ALT)) and coagulation parameters (thrombocytes, international normalized ratio (INR), partial thromboplastin time (PTT), activated partial thromboplastin time (APTT), and thrombin time (TT)). The Common Terminology Criteria for Adverse Events (CTCAE) version 5.0 was used to grade biochemical toxicities. The presence of ≥2 CTCAE grade ≥1 for laboratory adverse events was regarded as clinically relevant biochemical toxicity.
Biochemical changes were correlated with changes in [18F]FDG uptake in the NTLP.

2.7. Statistical Analysis

Descriptive statistics were used to explore baseline and treatment characteristics. The changes in SULliver (the average of all VOIs per patient), SULVOI,liver, SULspleen, and SULblood over time were assessed using linear mixed-effects regression models to account for clustered data. Nested models were compared using Akaike’s Information Criterion. A model with a random slope only fitted the data best for all parameters. Time was used as a continuous independent variable. In the analyses of SULliver and SULVOI,liver, the injected activity (MBq) (patient-level) and the absorbed dose per VOI (VOI-level) were included as co-variables to adjust for possible confounding.
The association between the parenchymal-absorbed dose and the change in SULVOI,liver (represented as ΔSULVOI,liver) was also analyzed using a linear mixed-effects regression model with a random slope, with the absorbed dose as the continuous independent variable.
A logistic mixed-effects model was used to assess the association between the presence of clinically relevant biochemical toxicity (using the cut-off definition as described above) per time point and the change in SULVOI,liver. The analysis was adjusted for response to therapy (coded as yes/no for progressive disease) as a possible confounder. All statistical analyses were done with R statistical software version 3.6.2 for Windows. We report here the effect estimates with associated 95% confidence intervals and corresponding two-sided p-values.

3. Results

A total of 292 patients were screened, of whom 43 patients underwent an [18F]FDG-PET/CTprior and ≥1 [18F]FDG-PET/CTfollow-up and an 90Y-PET/CT. Sixteen patients were excluded because they did not meet the PERCIST criteria for inter-study comparisons of [18F]FDG-PET/CT. One additional patient was excluded for having liver metastases that were too diffuse to accommodate a 3 cm VOI in the NTLP. Twenty-six patients were included, with 35 [18F]FDG-PET/CTfollow-up scans (a total of 61 [18F]FDG-PET/CTs), resulting in a total of 62 VOIliver scans that were analyzed in this study (Figure 1). Nine patients had two [18F]FDG-PET/ CTfollow up scans, while the remaining 17 patients had one [18F]FDG-PET/ CTfollow up scans at 1 month (n = 9) or 3 months (n = 8). The baseline characteristics are presented in Table 1.
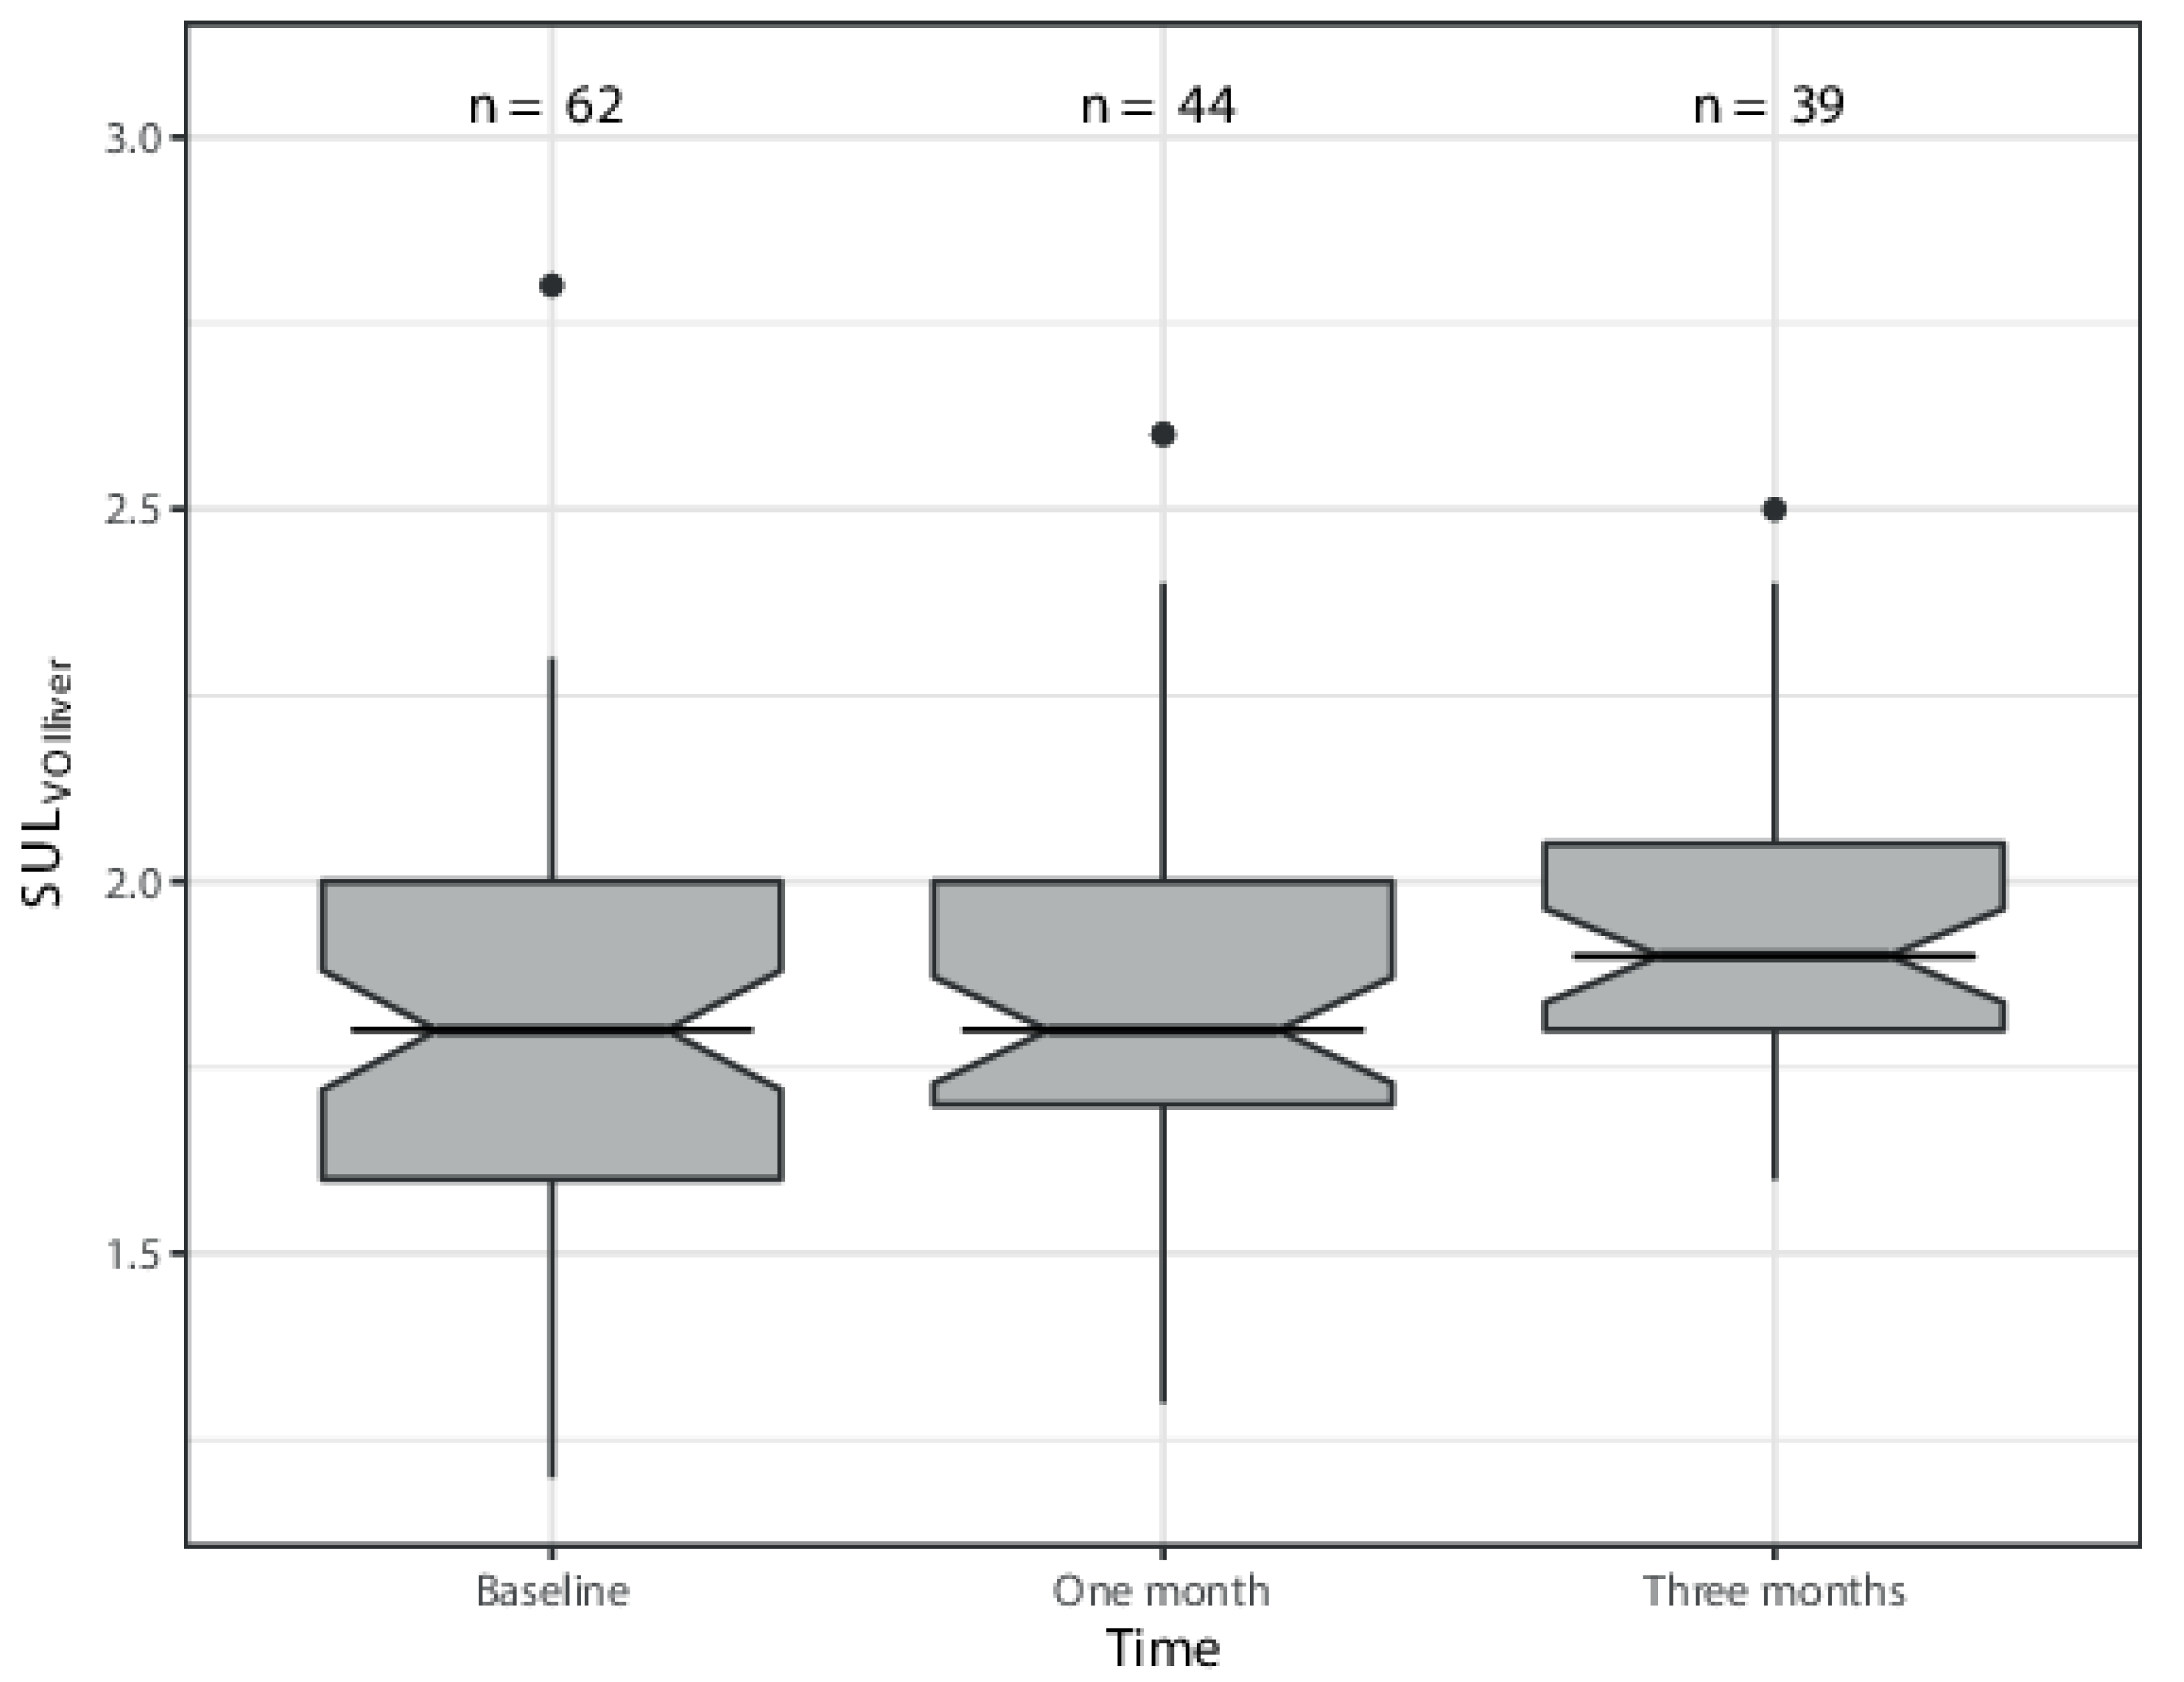
The median post-injection times were 64.5 min, 62.3 min, and 65 min at [18F]FDG-PET/CTprior and the 1 and 3 month [18F]FDG-PET/CTfollow-up scans, respectively (Table 2). The median absorbed dose per VOI was 31.3 Gy (range = 0.1–82.3 Gy). Overall, the median SULVOI,liver at baseline was 1.8 (range = 1.2–2.8). A significant increase in SULVOI,liver over time was found; the mean change in SULVOI,liver per month increase in time was 0.05 (95%CI 0.02–0.09) at p = 0.00088 (Figure 2)(Table 3). The mean percent change in ΔSULVOI,liver for every Gy increase in dose was −0.04 (95%CI -0.22–0.14) at p = 0.67. At the patient level, the median SULVOI (average of all VOIs of the liver parenchyma) was 1.8 (range = 1.5–2.3). The mean change in SULVOI per month increase in time was 0.05 (95%CI 0.01–0.08); p = 0.016 (Table 3).
Overall, the incidence of biochemical toxicity was low. CTCAE grade 3 toxicity was only found for bilirubin, GGT, and APTT (Table 4). PTT, INR, and TT were slightly prolonged in three, three, and one patient(s), respectively. The results of the logistic regression model showed a non-significant association between the clinically relevant biochemical toxicity and change in SULVOI (at the patient level) (95%CI 0.0006–333.29) at p = 0.90 (Table 5) (Figure 3).
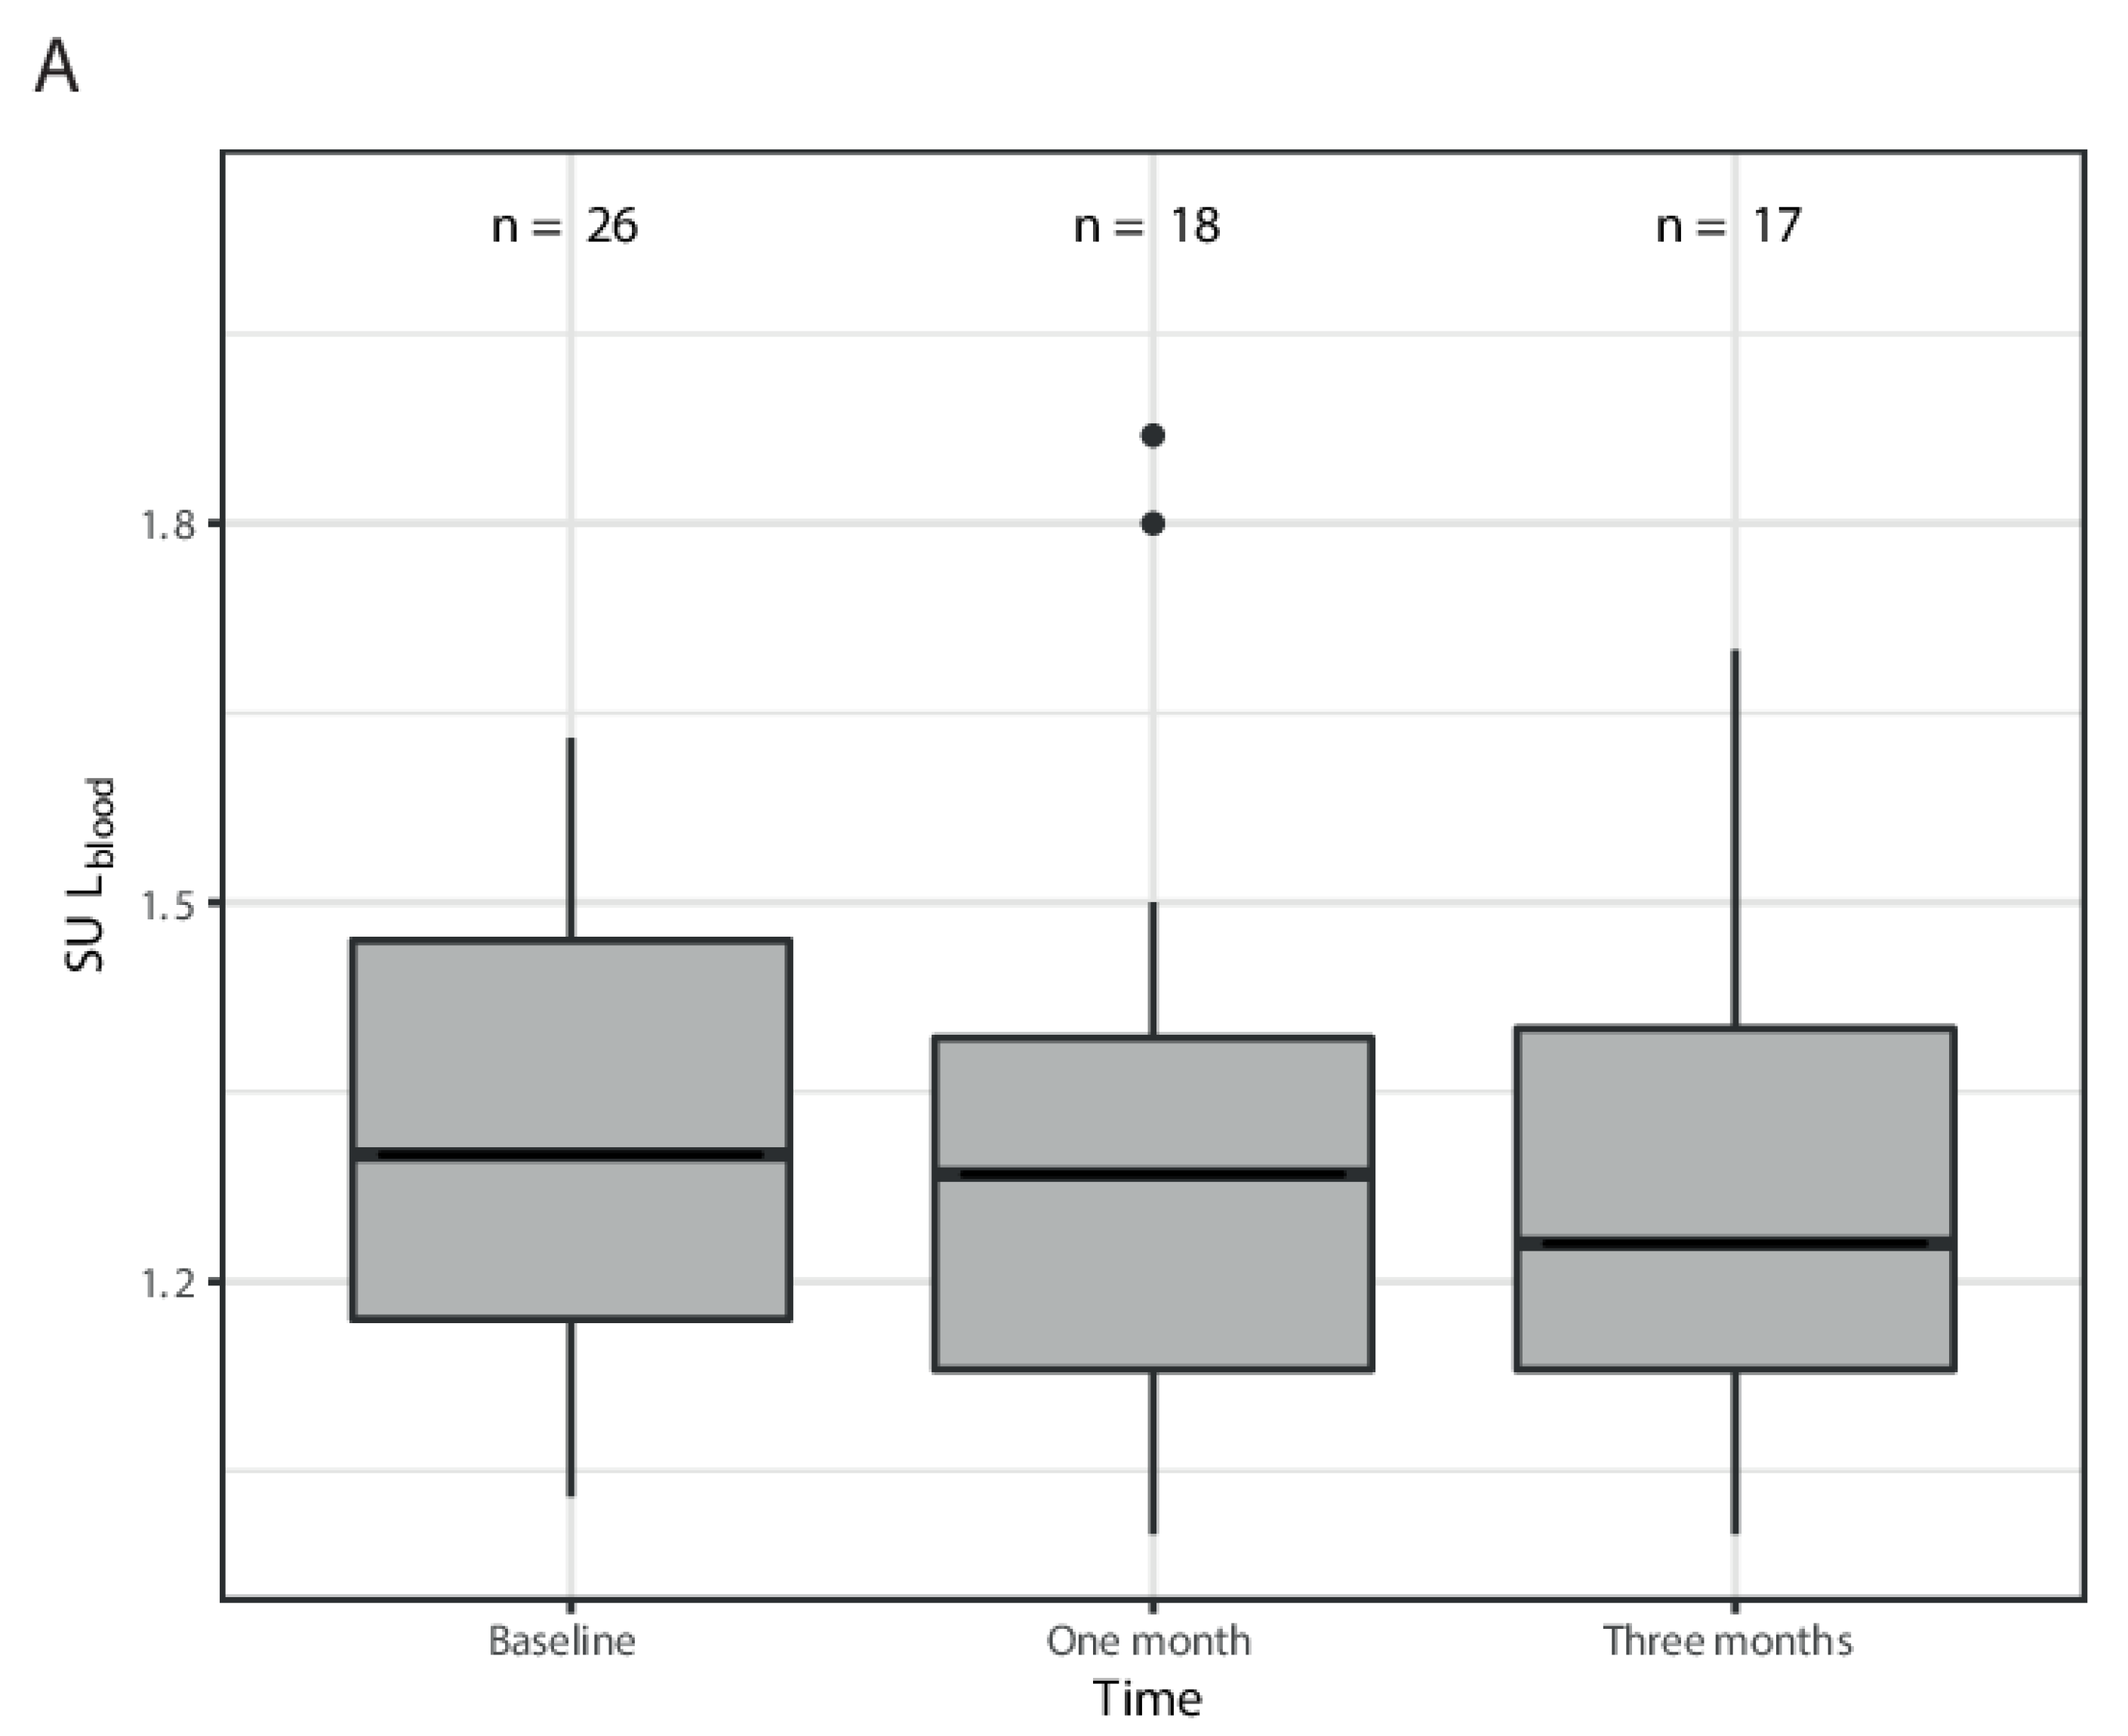
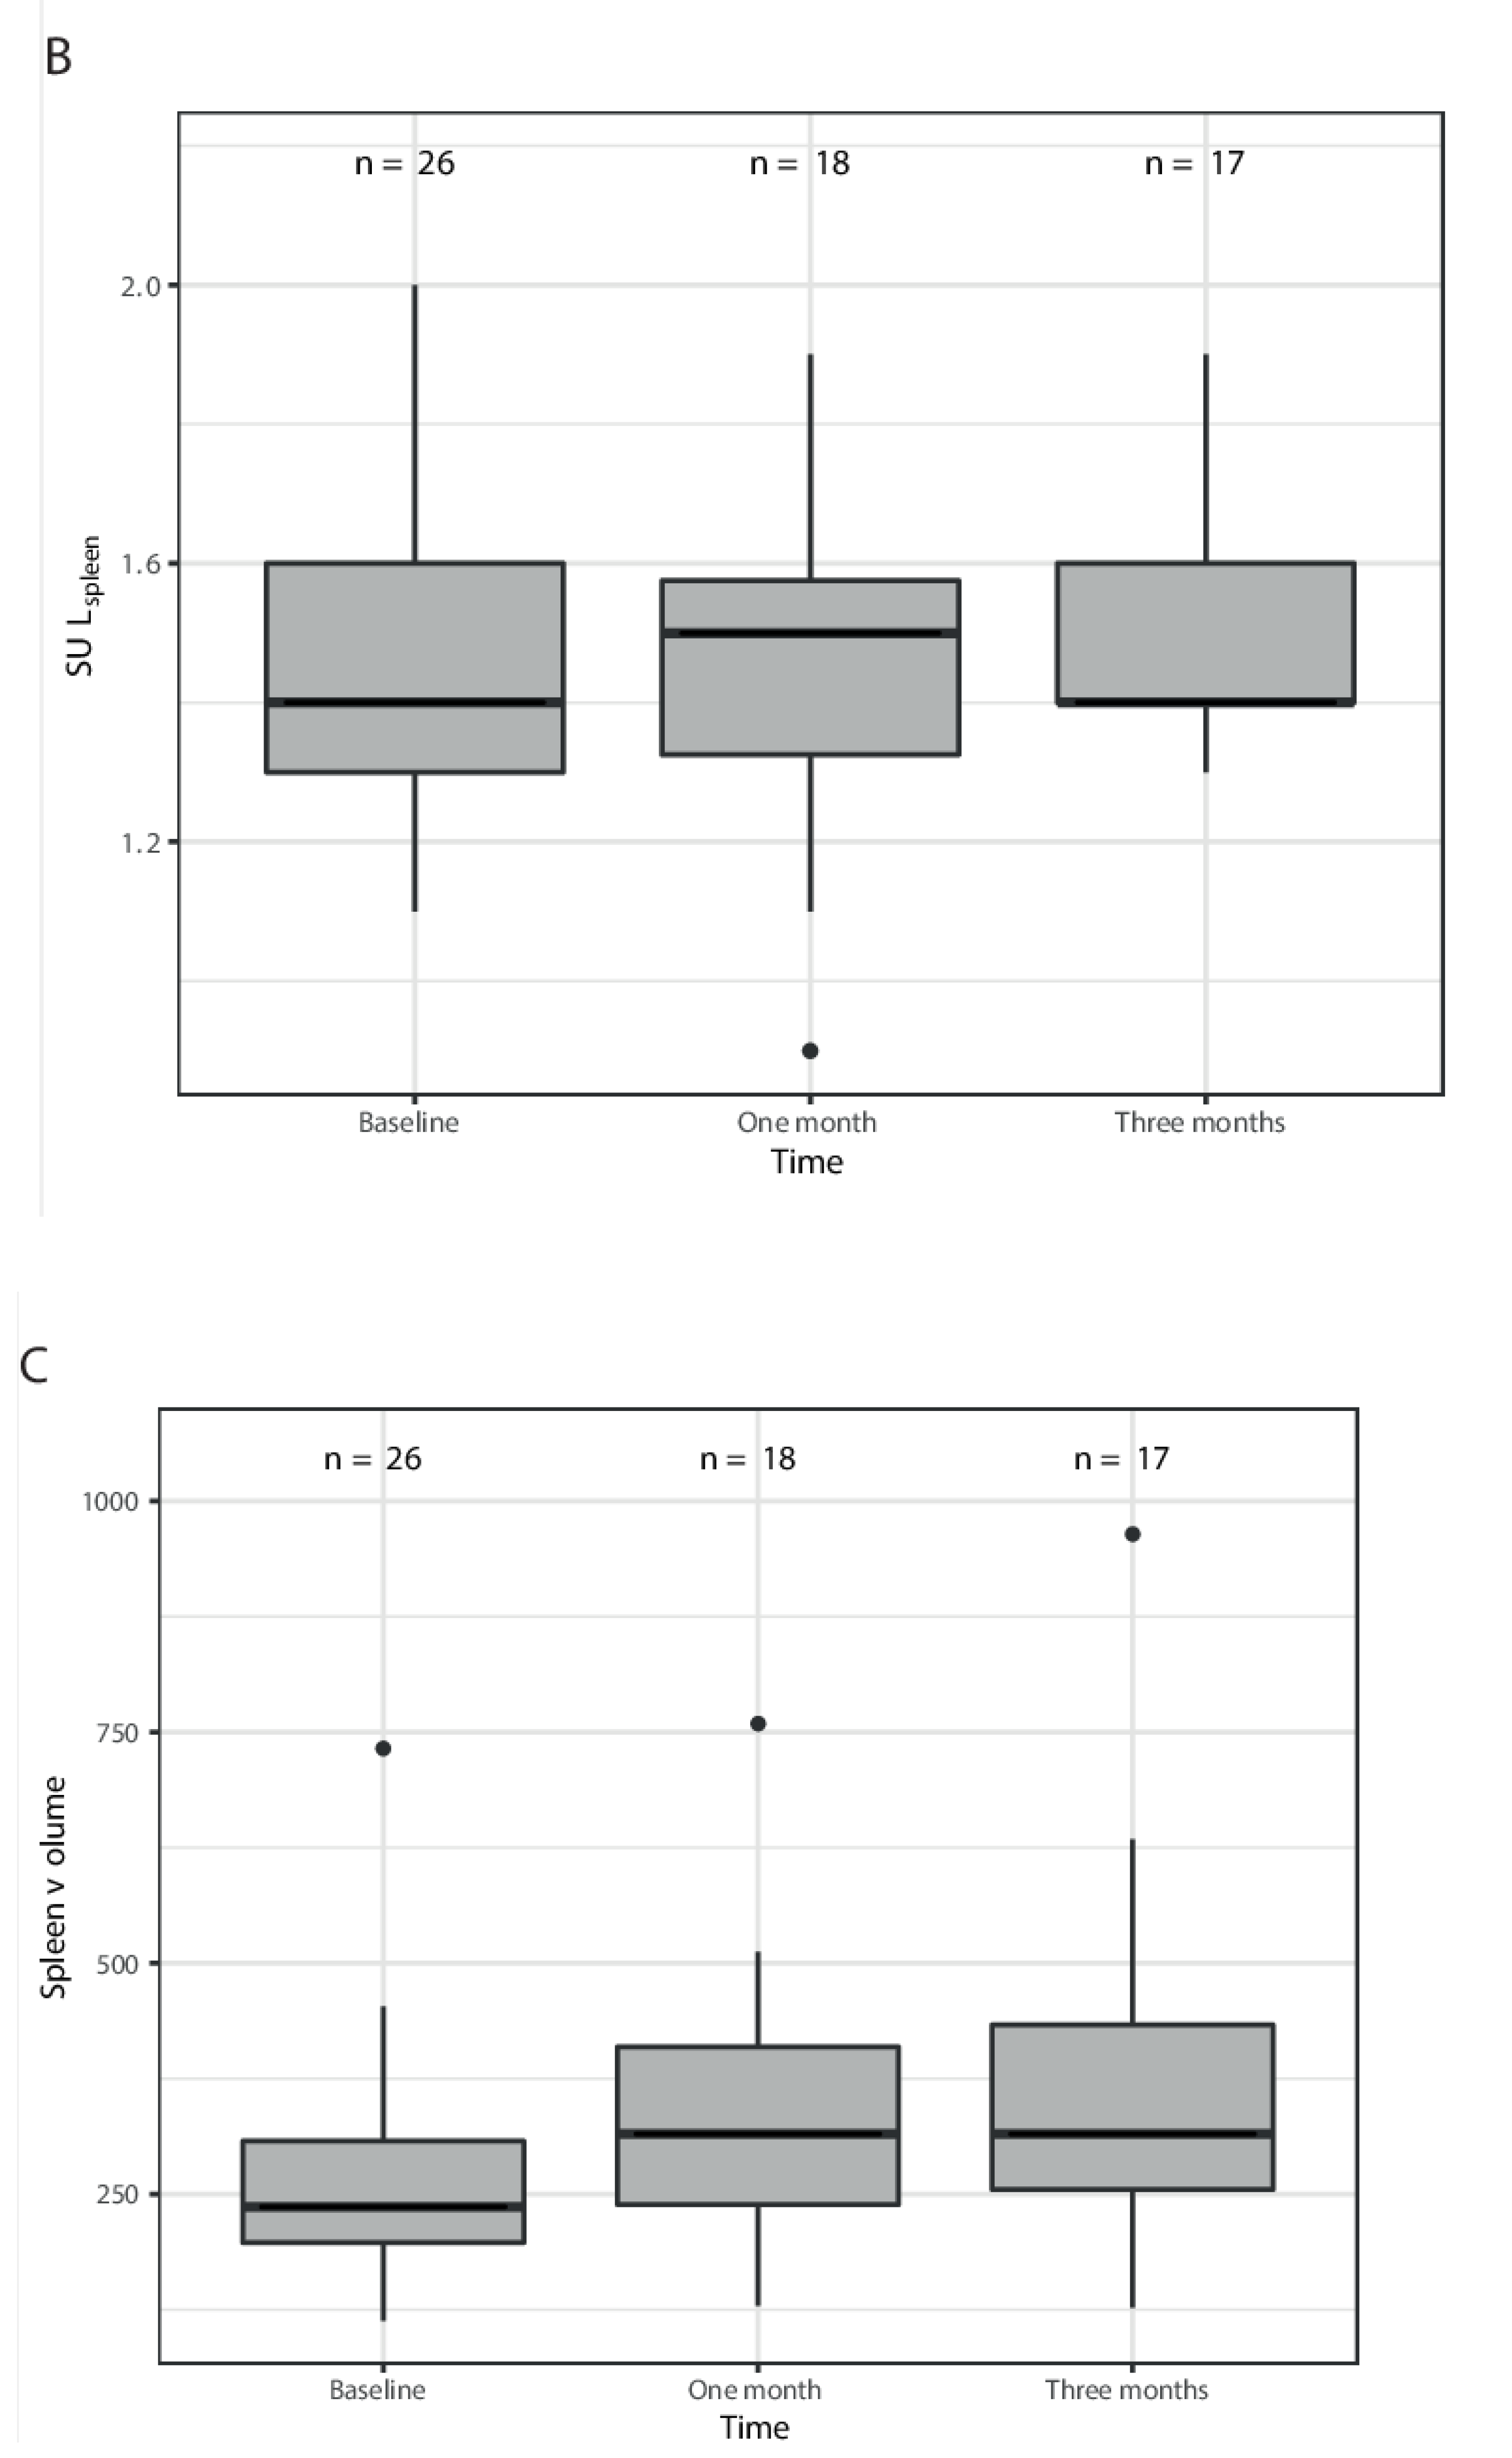
For SULblood, no significant increase or decrease over time was found; the mean change in SULblood per month increase in time was −0.012 (95%CI −0.05–0.03) at p = 0.57 (Figure 4A). SULspleen was also stable over time; the mean change per month increase over time was 0.005 (95%CI −0.04–0.05) at p = 0.83 (Figure 4B), while the splenic volume did not significantly increase over time. There was a 49 mL increase in volume per month (95%CI 32–65, p = 0.0011) (Figure 4C).

4. Discussion

Our data showed that after 90Y radioembolization, the [18F]FDG activity concentration (SULVOI liver) in the collateral targeted NTLP was significantly increased compared to baseline. Although the SULVOI liver increase was minimal, with a mean change in SULVOI,liver per month increase over time of 0.05 with a median SULVOI,liver at baseline of 1.8, this may influence quantitative assessments of liver activity concentrations as used in PERCIST. The influence on routine visual response assessments remains unclear, but will be minimal. Mild changes in [18F]FDG activity concentration, however, could be noticed in our study visually (Figure 5).
Multiple reports on increased [18F]FDG uptake in the liver after chemoradiation therapy for esophageal cancer have been published, with focal as well as diffuse patterns [16,21,22,23,24]. However, only one publication has touched upon the [18F]FDG uptake pattern in normal liver parenchyma 1 month after radioembolization, with no changes compared to baseline [25]. Unfortunately, additional data were lacking and no correlation was made with the absorbed dose.
Remarkably, we did not find an association between the median absorbed dose and the change in SULVOI,liver. In contrast, Nakahara et al. reported a direct visual correspondence to the radiation dose distribution and the pattern of increased [18F]FDG uptake in the liver in a patient after chemoradiation therapy for esophageal cancer [24]. The lack of association in our data may have been due to the limited patient numbers and the limited spread in absorbed doses between the VOIs.
The explanation for the increased [18F]FDG liver activity concentration after radioembolization is largely unknown. Local inflammation seems plausible, although this is not confirmed in the existing (although scarce) histopathology literature [15,26,27,28]. An in vitro assessment of ovarian cancer cell lines after radiotherapy showed swelling and increased [3H]FDG uptake in the surviving cells [29]; a similar phenomenon may be present in hepatocytes after radioembolization. However, the most plausible explanation may be increased [18F]FDG uptake due to sinusoidal obstruction syndrome (SOS). Several authors reported signs of SOS developing within the first 3 months after radioembolization [15,27,28]. As shown by Kim et al. in 35 patients with SOS after platin-based chemotherapy, SOS can lead to a significantly increased [18F]FDG liver activity concentration [30]. The possible explanation they offer is passive [18F]FDG tracer stasis due to endothelial cell injury and peliotic changes. The increase in SULliver in their study (12%) was considerably higher than in our data, yet with similar to our findings; the activity concentration in the blood pool remained unchanged, unlike the splenic activity concentration (which increased significantly in moderate to severe cases of SOS in their study). As the blood pool uptake seems unchanged at different time points after injection, in different patient populations and even after chemotherapy, it may be the best reference value for patients treated with radioembolization [4,6,7,8,9,30,31].
Although PERCIST aims to unify response assessments with [18F]FDG-PET, in our study 30.8% of the patients with [18F]FDG-PET/CT scans at baseline and follow-up were excluded based on the PERCIST timing and scan criteria (apart from the liver SUL criterion). This is consistent with most publications, which show mean exclusion percentages of 22.6–38.3% for PERCIST response assessments, due to the strict criteria for scan comparability (Supplementary Table S1) [9,10,32]. The major restrictions include the difference in post-injection scanning time (<15 min) and the minimum of 50 min needed for post-injection scanning. Unfortunately, these are significant factors in SUV measurements and major logistical problems for most nuclear medicine departments. As shown in several test–retest studies, the interval between injection and acquisition is a significant parameter for underestimating liver activity [31,32,33,34]. This may be explained by the abundance of the enzyme glucose-6-phoshphatase in the liver, causing continuous glycolysis and a decrease in FDG retention [35]. Thus, it is essential to minimalize the differences in FDG uptake time between scans to ensure a consistent threshold for PET-based response assessments (as used in PERCIST, the Deauville criteria, etc.). The post-injection times between [18F]FDG-PET/CT scans in our study were not significantly different (Table 2). However, in 5/26 of the right liver VOIs, the SULVOI, liver showed a ≥0.3 SUL unit change, violating the scan restrictions according to the PERCIST criteria. In these cases, the radioembolization-induced increased [18F]FDG liver activity concentration would have resulted in exclusion. However, these minimal changes in SULVOI will probably not be clinically relevant in routine visual response assessments. With the increased use of the modified PERCIST criteria, the reference threshold of the VOIliver is lowered, and the use of a more robust reference value in clinical studies is advisable [36].
A comparison of [18F]FDG liver activity concentrations with earlier reported results is difficult, due to the differences in the quantification or correction of the [18F]FDG uptake, i.e., the use of ROIs or VOIs; the use of SUVmax, SUVmean, or the total lesion/liver glycolysis (TLG); and correction for the body surface area (BSA) vs. body weight vs. lean body mass (LBM). Only the LBM-corrected SUV (SUL) is not significantly affected by body weight, contrary to the BSA-corrected or body-weight-corrected SUV. The calculations are not affected by age, blood glucose, diabetes, or gender [3,4,31]. Therefore, in our study, SUL was chosen for all measurements, consistent with the PERCIST criteria.
There were a few limitations to this study, the foremost of which was the small patient number with consistently acquired PET/CT scans according to the PERCIST guidelines. A patient cohort with only lobar treatments, enabling an in-patient comparison with non-treated NTLP, would be better by avoiding inter-patient biological differences. Additionally, a comparison of patients treated with different commercially available microspheres (with their differing specific activity levels) could help to further evaluate the role of [18F]FDG PET/CT as a follow-up tool after radioembolization. Given the expanding use of both external beam radiotherapy and radioembolization and the increasing use of PET/CT for response assessments, further research is required.

5. Conclusions

The [18F]FDG liver activity concentration in the background liver (SULVOI ) is mildly but significantly increased after radioembolization; therefore, this can interfere with the use of the background liver results firstly as a threshold for therapy response and secondly as a comparability criterion in the PERCIST criteria. An alternative and more consistent threshold is the [18F]FDG activity concentration in the blood pool (SULblood).

Supplementary Materials

The following supporting information can be downloaded at: https://www.mdpi.com/article/10.3390/diagnostics12102518/s1, Table S1: PERCIST criteria.

Author Contributions

Conceptualization, M.N.B. and A.J.B.; methodology, C.v.R. and M.N.B.; formal analysis, C.v.R. and M.N.B.; investigation, M.N.B.; data curation, M.N.B.; writing—original draft preparation, M.N.B.; writing—review and editing, M.N.B., C.v.R., A.J.B. and M.G.L.; visualization, C.v.R.; supervision, M.G.L.; project administration, A.J.B. All authors have read and agreed to the published version of the manuscript.

Funding

This research received no external funding.

Institutional Review Board Statement

Ethical review and approval were waived for this study due to the retrospective nature of this study and the informed consent obtained from all patients to use their imaging and clinical data (as participant in other studies on radioembolization treatments).

Informed Consent Statement

Written informed consent was waived by the Institutional Review Board.

Data Availability Statement

The data presented in this study are available on reasonable request from the corresponding author.

Conflicts of Interest

The authors of this manuscript declare relationships with the following companies: BTG/Boston Scientific, Terumo, and Quirem. A. Braat is a speaker for BTG/Boston Scientific and Terumo. M. Lam receives research support from Terumo, Quirem, and Boston Scientific, and is a consultant on their behalf. The department of Radiology and Nuclear Medicine of the University Medical Center Utrecht receives royalty payments from Quirem. Their radioembolization products were, however, not used in this article. The other authors of this manuscript (C. van Roekel, M.N.G.J.A. Braat) declare no relationships with any companies whose products or services may be related to the subject matter of the article.

References

  1. Wahl, R.L.; Jacene, H.; Kasamon, Y.; Lodge, M.A. From RECIST to PERCIST: Evolving Considerations for PET response criteria in solid tumors. J. Nucl. Med. 2009, 50 (Suppl. 1), 122s–150s. [Google Scholar] [CrossRef] [PubMed] [Green Version]
  2. Young, H.; Baum, R.; Cremerius, U.; Herholz, K.; Hoekstra, O.; Lammertsma, A.A.; Pruim, J.; Price, P. Measurement of clinical and subclinical tumour response using [18F]-fluorodeoxyglucose and positron emission tomography: Review and 1999 EORTC recommendations. European Organization for Research and Treatment of Cancer (EORTC) PET Study Group. Eur. J. Cancer. 1999, 35, 1773–1782. [Google Scholar] [CrossRef]
  3. Skougaard, K.; Nielsen, D.; Jensen, B.V.; Hendel, H.W. Comparison of EORTC criteria and PERCIST for PET/CT response evaluation of patients with metastatic colorectal cancer treated with irinotecan and cetuximab. J. Nucl. Med. 2013, 54, 1026–1031. [Google Scholar] [CrossRef] [PubMed] [Green Version]
  4. Paquet, N.; Albert, A.; Foidart, J.; Hustinx, R. Within-patient variability of (18)F-FDG: Standardized uptake values in normal tissues. J. Nucl. Med. 2004, 45, 784–788. [Google Scholar]
  5. Kanstrup, I.L.; Klausen, T.L.; Bojsen-Moller, J.; Magnusson, P.; Zerahn, B. Variability and reproducibility of hepatic FDG uptake measured as SUV as well as tissue-to-blood background ratio using positron emission tomography in healthy humans. Clin. Physiol. Funct. Imaging 2009, 29, 108–113. [Google Scholar] [CrossRef]
  6. Boktor, R.R.; Walker, G.; Stacey, R.; Gledhill, S.; Pitman, A.G. Reference range for intrapatient variability in blood-pool and liver SUV for 18F-FDG PET. J. Nucl. Med. 2013, 54, 677–682. [Google Scholar] [CrossRef] [Green Version]
  7. Chiaravalloti, A.; Danieli, R.; Abbatiello, P.; Di Pietro, B.; Travascio, L.; Cantonetti, M.; Guazzaroni, M.; Orlacchio, A.; Simonetti, G.; Schillaci, O. Factors affecting intrapatient liver and mediastinal blood pool (1)(8)F-FDG standardized uptake value changes during ABVD chemotherapy in Hodgkin’s lymphoma. Eur. J. Nucl. Med. Mol. Imaging. 2014, 41, 1123–1132. [Google Scholar] [CrossRef]
  8. Ceriani, L.; Suriano, S.; Ruberto, T.; Zucca, E.; Giovanella, L. 18F-FDG uptake changes in liver and mediastinum during chemotherapy in patients with diffuse large B-cell lymphoma. Clin. Nucl. Med. 2012, 37, 949–952. [Google Scholar] [CrossRef]
  9. Rubello, D.; Gordien, P.; Morliere, C.; Guyot, M.; Bordenave, L.; Colletti, P.M.; Hindié, E. Variability of Hepatic 18F-FDG Uptake at Interim PET in Patients With Hodgkin Lymphoma. Clin. Nucl. Med. 2015, 40, e405–e410. [Google Scholar] [CrossRef]
  10. Fencl, P.; Belohlavek, O.; Harustiak, T.; Zemanova, M. The analysis of factors affecting the threshold on repeated 18F-FDG-PET/CT investigations measured by the PERCIST protocol in patients with esophageal carcinoma. Nucl. Med. Commun. 2012, 33, 1188–1194. [Google Scholar] [CrossRef]
  11. Barrington, S.F.; Qian, W.; Somer, E.J.; Franceschetto, A.; Bagni, B.; Brun, E.; Almquist, H.; Loft, A.; Højgaard, L.; Federico, M.; et al. Concordance between four European centres of PET reporting criteria designed for use in multicentre trials in Hodgkin lymphoma. Eur. J. Nucl. Med. Mol. Imaging 2010, 37, 1824–1833. [Google Scholar] [CrossRef] [PubMed]
  12. Bagni, O.; Filippi, L.; Schillaci, O. The role of (18)F-FDG positron emission tomography in the follow-up of liver tumors treated with (90)Yttrium radioembolization. Am. J. Nucl. Med. Mol. Imaging 2015, 5, 220–232. [Google Scholar] [PubMed]
  13. Fernandez-Ros, N.; Iñarrairaegui, M.; Paramo, A.J.; Berasain, C.; Avila, M.; Chopitea, A.; Varo, N.; Sarobe, P.; Bilbao, I.J.; Dominguez, I.; et al. Radioembolization of hepatocellular carcinoma activates liver regeneration, induces inflammation and endothelial stress and activates coagulation. Liver Int. 2015, 35, 1590–1596. [Google Scholar] [CrossRef] [PubMed]
  14. Chew, V.; Lee, Y.H.; Pan, L.; Nasir, N.J.; Lim, C.J.; Chua, C.; Lai, L.; Hazirah, S.N.; Lim, T.K.H.; Goh, B.K.; et al. Immune activation underlies a sustained clinical response to Yttrium-90 radioembolisation in hepatocellular carcinoma. Gut 2019, 68, 335–346. [Google Scholar] [CrossRef] [PubMed]
  15. Nalesnik, M.A.; Federle, M.; Buck, D.; Fontes, P.; Carr, B.I. Hepatobiliary effects of 90yttrium microsphere therapy for unresectable hepatocellular carcinoma. Hum. Pathol. 2009, 40, 125–134. [Google Scholar] [CrossRef] [PubMed]
  16. Shai, S.E.; Lin, Y.H.; Lai, Y.L.; Tang, H.W.; Hsieh, Y.W.; Hung, S.C. Phantom simulation of liver metastasis on a positron emission tomography with computed tomography scan after neoadjuvant chemoradiotherapy for distal esophageal cancer: A case report. J. Med. Case Rep. 2020, 14, 106. [Google Scholar] [CrossRef] [PubMed]
  17. Kaalep, A.; Sera, T.; Oyen, W.; Krause, B.J.; Chiti, A.; Liu, Y.; Boellaard, R. EANM/EARL FDG-PET/CT accreditation—summary results from the first 200 accredited imaging systems. Eur. J. Nucl. Med. Mol. Imaging 2018, 45, 412–422. [Google Scholar] [CrossRef] [Green Version]
  18. Viner, M.; Mercier, G.; Hao, F.; Malladi, A.; Subramaniam, R.M. Liver SULmean at FDG PET/CT: Interreader agreement and impact of placement of volume of interest. Radiology 2013, 267, 596–601. [Google Scholar] [CrossRef]
  19. Lam, M.G.; Banerjee, A.; Louie, J.D.; Sze, D.Y. Splenomegaly-associated thrombocytopenia after hepatic yttrium-90 radioembolization. Cardiovasc. Intervent. Radiol. 2014, 37, 1009–1017. [Google Scholar] [CrossRef]
  20. van den Hoven, A.F.; Rosenbaum, C.E.; Elias, S.G.; de Jong, H.W.; Koopman, M.; Verkooijen, H.M.; Alavi, A.; van den Bosch, M.A.; Lam, M.G. Insights into the Dose-Response Relationship of Radioembolization with Resin 90Y-Microspheres: A Prospective Cohort Study in Patients with Colorectal Cancer Liver Metastases. J. Nucl. Med. 2016, 57, 1014–1019. [Google Scholar] [CrossRef] [Green Version]
  21. Grant, M.J.; Didier, R.A.; Stevens, J.S.; Beyder, D.D.; Hunter, J.G.; Thomas, C.R.; Coakley, F.V. Radiation-induced liver disease as a mimic of liver metastases at serial PET/CT during neoadjuvant chemoradiation of distal esophageal cancer. Abdom. Imaging 2014, 39, 963–968. [Google Scholar] [CrossRef] [PubMed]
  22. Iyer, R.B.; Balachandran, A.; Bruzzi, J.F.; Johnson, V.; Macapinlac, H.A. Munden RF. PET/CT and hepatic radiation injury in esophageal cancer patients. Cancer Imaging 2007, 7, 189–194. [Google Scholar] [CrossRef] [PubMed] [Green Version]
  23. Wong, J.J.; Anthony, M.P.; Lan Khong, P. Hepatic radiation injury in distal esophageal carcinoma: A case report. Clin. Nucl. Med. 2012, 37, 709–711. [Google Scholar] [CrossRef] [PubMed]
  24. Nakahara, T.; Takagi, Y.; Takemasa, K.; Mitsui, Y.; Tsuyuki, A.; Shigematsu, N.; Kubo, A. Dose-related fluorodeoxyglucose uptake in acute radiation-induced hepatitis. Eur. J. Gastroenterol. Hepatol. 2008, 20, 1040–1044. [Google Scholar] [CrossRef] [PubMed]
  25. Bienert, M.; McCook, B.; Carr, B.I.; Geller, D.A.; Sheetz, M.; Tutor, C.; Amesur, N.; Avril, N. 90Y microsphere treatment of unresectable liver metastases: Changes in 18F-FDG uptake and tumour size on PET/CT. Eur. J. Nucl. Med. Mol. Imaging 2005, 32, 778–787. [Google Scholar] [CrossRef]
  26. Bilbao, J.I.; de Martino, A.; de Luis, E.; Díaz-Dorronsoro, L.; Alonso-Burgos, A.; de la Cuesta, M.A.; Sangro, B.; García de Jalón, J.A. Biocompatibility, inflammatory response, and recannalization characteristics of nonradioactive resin microspheres: Histological findings. Cardiovasc. Intervent. Radiol. 2009, 32, 727–736. [Google Scholar] [CrossRef] [Green Version]
  27. Sangro, B.; Gil-Alzugaray, B.; Rodriguez, J.; Sola, I.; Martinez-Cuesta, A.; Viudez, A.; Chopitea, A.; Iñarrairaegui, M.; Arbizu, J.; Bilbao, J.I. Liver disease induced by radioembolization of liver tumors: Description and possible risk factors. Cancer 2008, 112, 1538–1546. [Google Scholar] [CrossRef]
  28. Pasciak, A.S.; Abiola, G.; Liddell, R.P.; Crookston, N.; Besharati, S.; Donahue, D.; Thompson, R.E.; Frey, E.; Anders, R.A.; Dreher, M.R. The number of microspheres in Y90 radioembolization directly affects normal tissue radiation exposure. Eur. J. Nucl. Med. Mol. Imaging 2020, 47, 816–827. [Google Scholar] [CrossRef]
  29. Higashi, K.; Clavo, A.C.; Wahl, R.L. In vitro assessment of 2-fluoro-2-deoxy-D-glucose, L-methionine and thymidine as agents to monitor the early response of a human adenocarcinoma cell line to radiotherapy. J. Nucl. Med. 1993, 34, 773–779. [Google Scholar]
  30. Kim, H.; Baek, S.E.; Moon, J.; Roh, Y.H.; Lee, N.; Cho, A. Increased hepatic FDG uptake on PET/CT in hepatic sinusoidal obstructive syndrome. Oncotarget 2016, 7, 69024–69031. [Google Scholar] [CrossRef] [Green Version]
  31. Kuruva, M.; Mittal, B.R.; Abrar, M.L.; Kashyap, R.; Bhattacharya, A. Multivariate analysis of various factors affecting background liver and mediastinal standardized uptake values. Indian J. Nucl. Med. 2012, 27, 20–23. [Google Scholar] [PubMed] [Green Version]
  32. Yuan, H.; Tong, D.K.; Vardhanabhuti, V.; Khong, P.L. Factors that affect PERCIST-defined test-retest comparability: An exploration of feasibility in routine clinical practice. Clin. Nucl. Med. 2015, 40, 941–944. [Google Scholar] [CrossRef] [PubMed]
  33. Hofheinz, F.; Apostolova, I.; Oehme, L.; Kotzerke, J.; van den Hoff, J. Test-Retest Variability in Lesion SUV and Lesion SUR in (18)F-FDG PET: An Analysis of Data from Two Prospective Multicenter Trials. J. Nucl. Med. 2017, 58, 1770–1775. [Google Scholar] [CrossRef] [Green Version]
  34. Hofheinz, F.; Maus, J.; Zschaeck, S.; Rogasch, J.; Schramm, G.; Oehme, L.; Apostolova, I.; Kotzerke, J.; Hoff, J.V.D. Interobserver variability of image-derived arterial blood SUV in whole-body FDG PET. EJNMMI Res. 2019, 9, 23. [Google Scholar] [CrossRef] [PubMed]
  35. Torizuka, T.; Tamaki, N.; Inokuma, T.; Magata, Y.; Sasayama, S.; Yonekura, Y.; Tanaka, A.; Yamaoka, Y.; Yamamoto, K.; Konishi, J. In vivo assessment of glucose metabolism in hepatocellular carcinoma with FDG-PET. J Nucl Med. 1995, 36, 1811–1817. [Google Scholar]
  36. Deipolyi, A.R.; England, R.W.; Ridouani, F.; Riedl, C.C.; Kunin, H.S.; Boas, F.E.; Yarmohammadi, H.; Sofocleous, C.T. PET/CT Imaging Characteristics After Radioembolization of Hepatic Metastasis from Breast Cancer. Cardiovasc. Intervent. Radiol. 2020, 43, 488–494. [Google Scholar] [CrossRef]
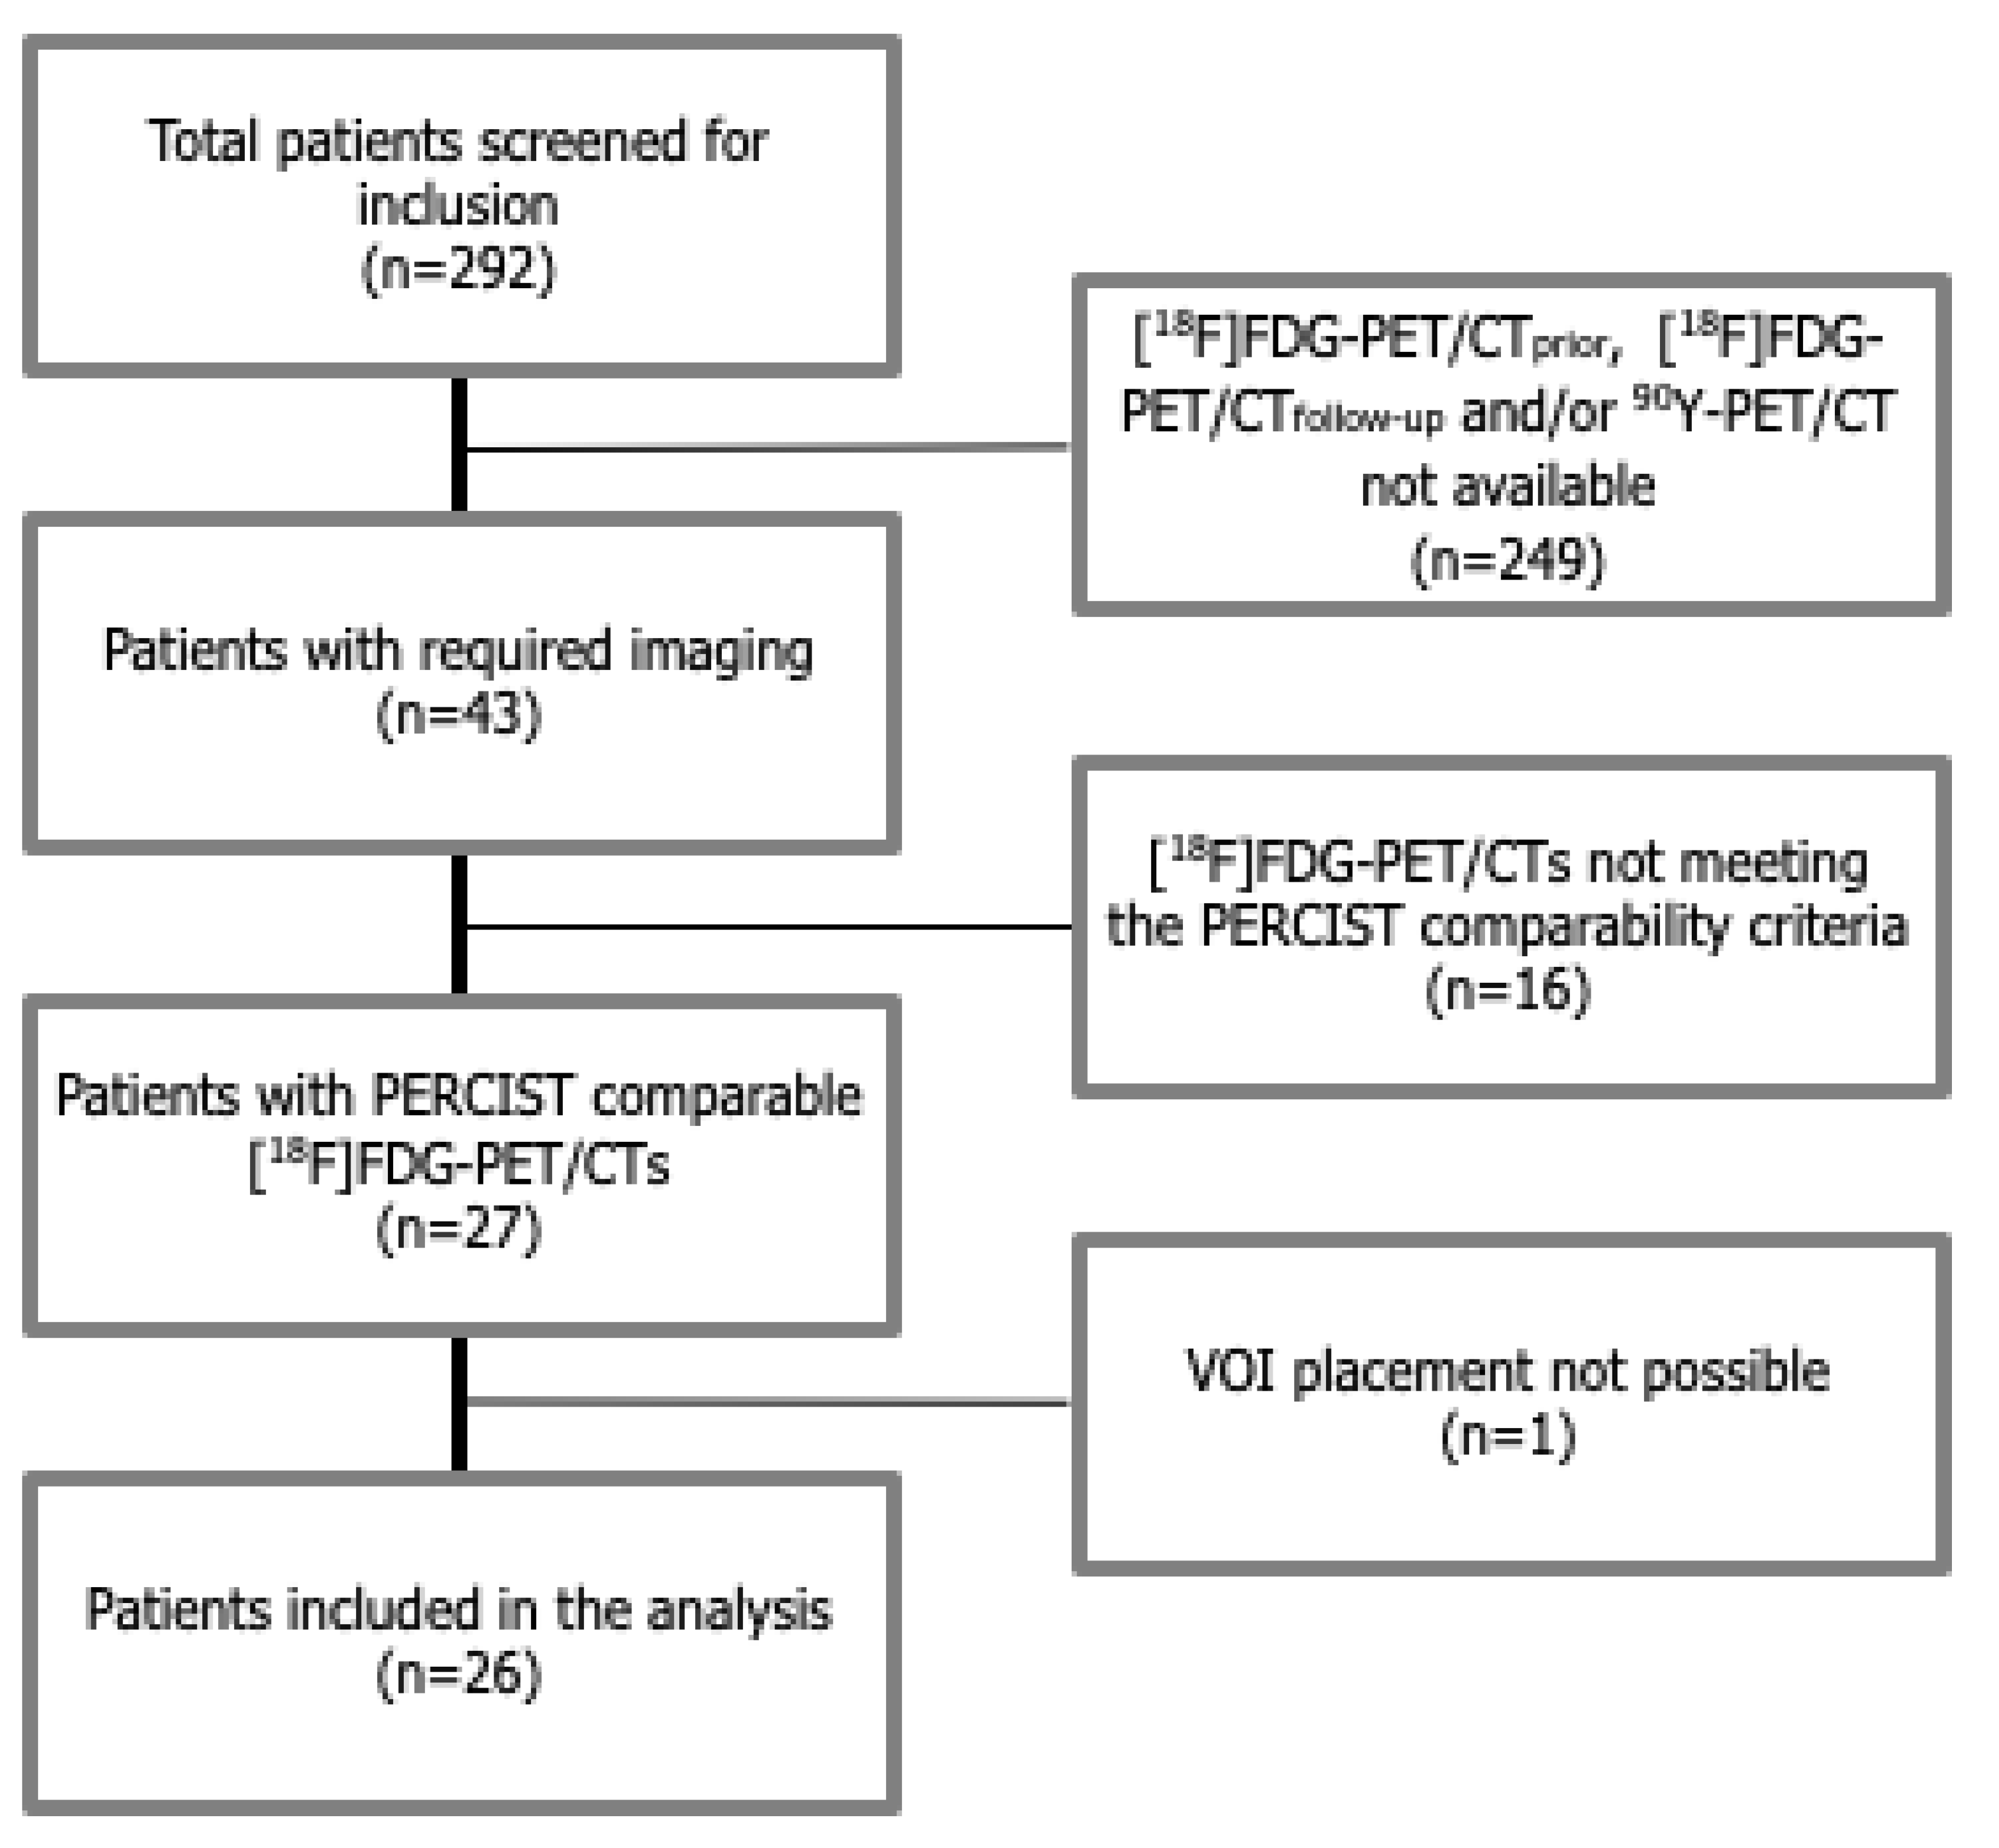
Figure 1. Flowchart of the study.
Diagnostics 12 02518 g001
Figure 2. Changes in SULVOI,liver over time compared to baseline values.
Diagnostics 12 02518 g002
Figure 3. Differences in SULliver (patient-level) versus biochemical toxicity. Numbers represent the different durations of biochemical toxicity determination per patient. Some patients had measurements at two follow-up times so numbers do not equal total number of patients.
Diagnostics 12 02518 g003
Figure 4. Changes in SULblood (A) and SULspleen (B) over time compared to baseline and changes in splenic volume (C) over time compared to baseline.
Diagnostics 12 02518 g004aDiagnostics 12 02518 g004b
Figure 5. Case example of visual increase in [18F]FDG activity concentration in non-tumorous liver tissue. A 75 year old woman with colorectal liver metastases underwent a [18F]FDG-PET/CTprior (A) and a [18F]FDG-PET/CTfollow-up (B) 15 days prior and 29 days after radioembolization, respectively. The images are similarly scaled (0–7 SUVlean body mass). One month after radioembolization, a reduced [18F]FDG activity concentration can be seen in the metastases, but the background non-tumorous liver activity concentration has visually increased (SULVOI,liver increase from 1.8 to 2.4 in the VOIright liver).
Diagnostics 12 02518 g005
Table 1. Baseline characteristics of the included patients.
Total Number of Evaluable Patients26
Male/Female16/10
Median age in years (range)66 (34–79)
Median time from baseline F-18 FDG-PET/CT to Y-90-RE in days (range)24 (1–44)
Median weight in kg (range)82 (57–110)
Number of patients known with diabetes mellitus1
Number of patients with use of anti-diabetic medication1
Primary tumor
-
Colorectal carcinoma
-
Pancreatic adenocarcinoma

25
1
Prior locoregional treatment
-
Extended right hemihepatectomy
-
Left hemihepatectomy + one metastasectomy in the right hemiliver
-
Multiple metastasectomies
-
Radiofrequency ablation

3
1
3
1
Median injected activity in MBq (range)1484 (345–2164)
Treatment
-
Whole liver delivery
-
Sequential delivery
-
Lobar treatment

22
1
3
Prior systemic treatment26
No. of systemic treatment lines
-
1
-
2
-
3
-
4

9
12
4
1
Legend: RE = radioembolization.
Table 2. F-18 FDG-PET/CT specifications and measurements of the study population.
Time After REBaselineOne MonthThree Months
Number of examinations261817
Median (range)
Serum glucose level in mmol/L6.4 (5.1–9.8)6.3 (4.2–10.3)6.6 (4.4–10.4)
Post-injection time in minutes64.5 (56–85)62.5 (58–78)65 (51–86)
Injected activity in MBq/kg2.03 (1.81–2.37)2.03 (1.66–2.50)1.94 (1.69–2.62)
SULmean segment 2-31.8 (1.5–2.2)1.9 (1.5–2.6)1.95 (1.6–2.4)
SULmean segment 41.7 (1.5–2.1)1.7 (1.6–2.1)1.8 (1.6–2.2)
SULmean right hemiliver1.9 (1.2–2.8)1.7 (1.3–2.6)1.9 (1.7–2.5)
SULmean spleen1.4 (1.1–2.0)1.5 (0.9–1.9)1.5 (1.3–1.9)
SULmean bloodpool1.3 (1.03–1.63)1.27 (1.00–1.87)1.23 (1.00–1.70)
Table 3. Relation of the SULVOI over time based on linear mixed effects regression analyses.
Independent VariableMean Change in SULVOI Per Month Increase in Time (95%CI); p-Value
SULVOI (patient-level)UnadjustedAdjusted (for administered activity Y90)
0.05 (0.01–0.08); 0.0160.03 (−0.04–0.1); 0.38
SULVOI,liver (VOI-level)UnadjustedAdjusted (for absorbed dose per VOI)
0.05 (0.02–0.09), 0.000880.05 (0.02–0.08); 0.00084
Legend: Numbers represent the different durations of biochemical toxicity determination per patient. Some patients had measurements at two follow-up times, so numbers do not equal total number of patients.
Table 4. Incidence rates of biochemical toxicity between baseline and three months after radioembolization according to CTCAE version 5.
CTCAE Grade123
Alanine aminotransferase11
Alkaline phosphatase63
Aspartate aminotransferase141
Bilirubin511
Gamma-glutamyl transferase353
Platelets92
APTT1311
Table 5. Relation between SULVOI,liver and clinically relevant biochemical toxicity based on mixed-effects logistic regression analyses with SULVOI,liver as the independent variable.
Clinically Relevant Biochemical Toxicity Yes Versus No
Dependent variableOdds ratio for clinically relevant biochemical toxicity for every month increase in SULVOI,liver (95% CI); p-value
Unadjusted modelAdjusted model (for progressive disease)
Clinically relevant biochemical toxicity
(based on laboratory parameters)
(no n = 14, yes n = 21)
0.42 (0.0006–296.82); 0.690.48 (0.0006–333.29); 0.90
Publisher’s Note: MDPI stays neutral with regard to jurisdictional claims in published maps and institutional affiliations.