
Automatic Liver Viability Scoring with Deep Learning and Hyperspectral Imaging

 ,
,  , , ,
, , ,  ,
,  ,
,  and
and 
Abstract
1. Introduction
2. Materials and Methods
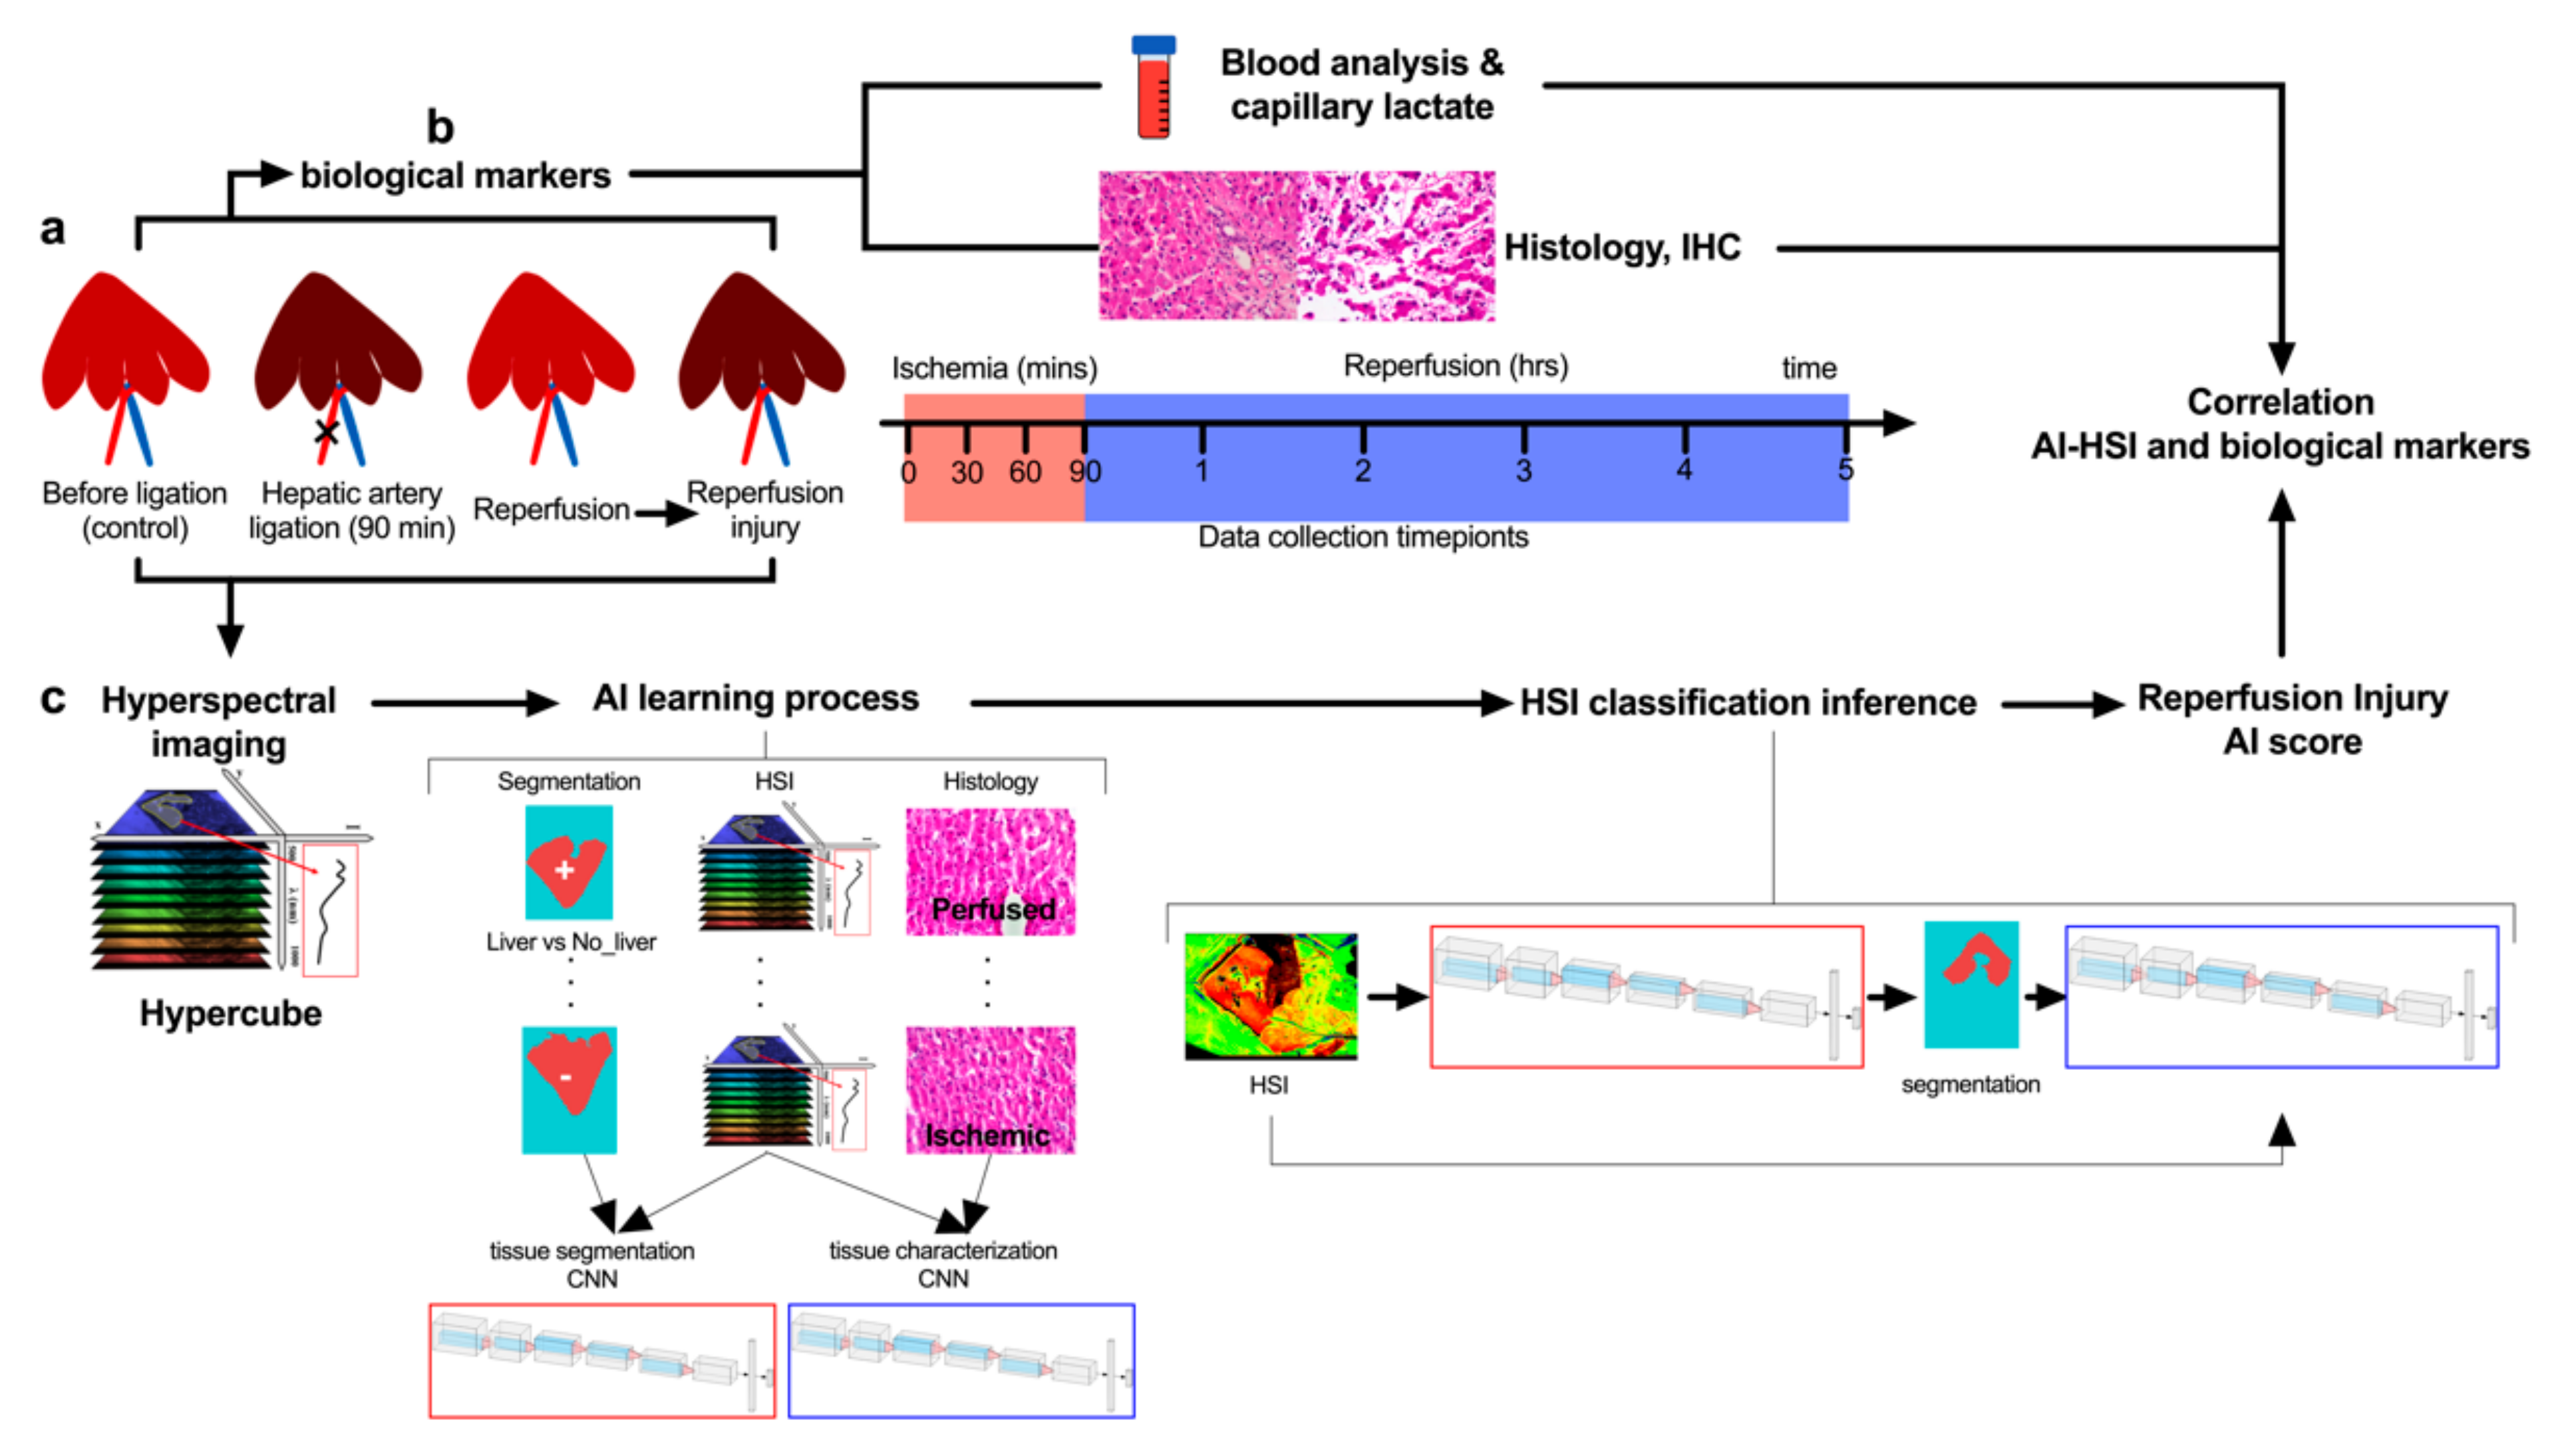
2.1. Study Design
2.2. Animals
2.3. Surgical Procedure
2.4. Hyperspectral Imaging
2.5. Artificial Intelligence-Based Analysis
2.5.1. Overview
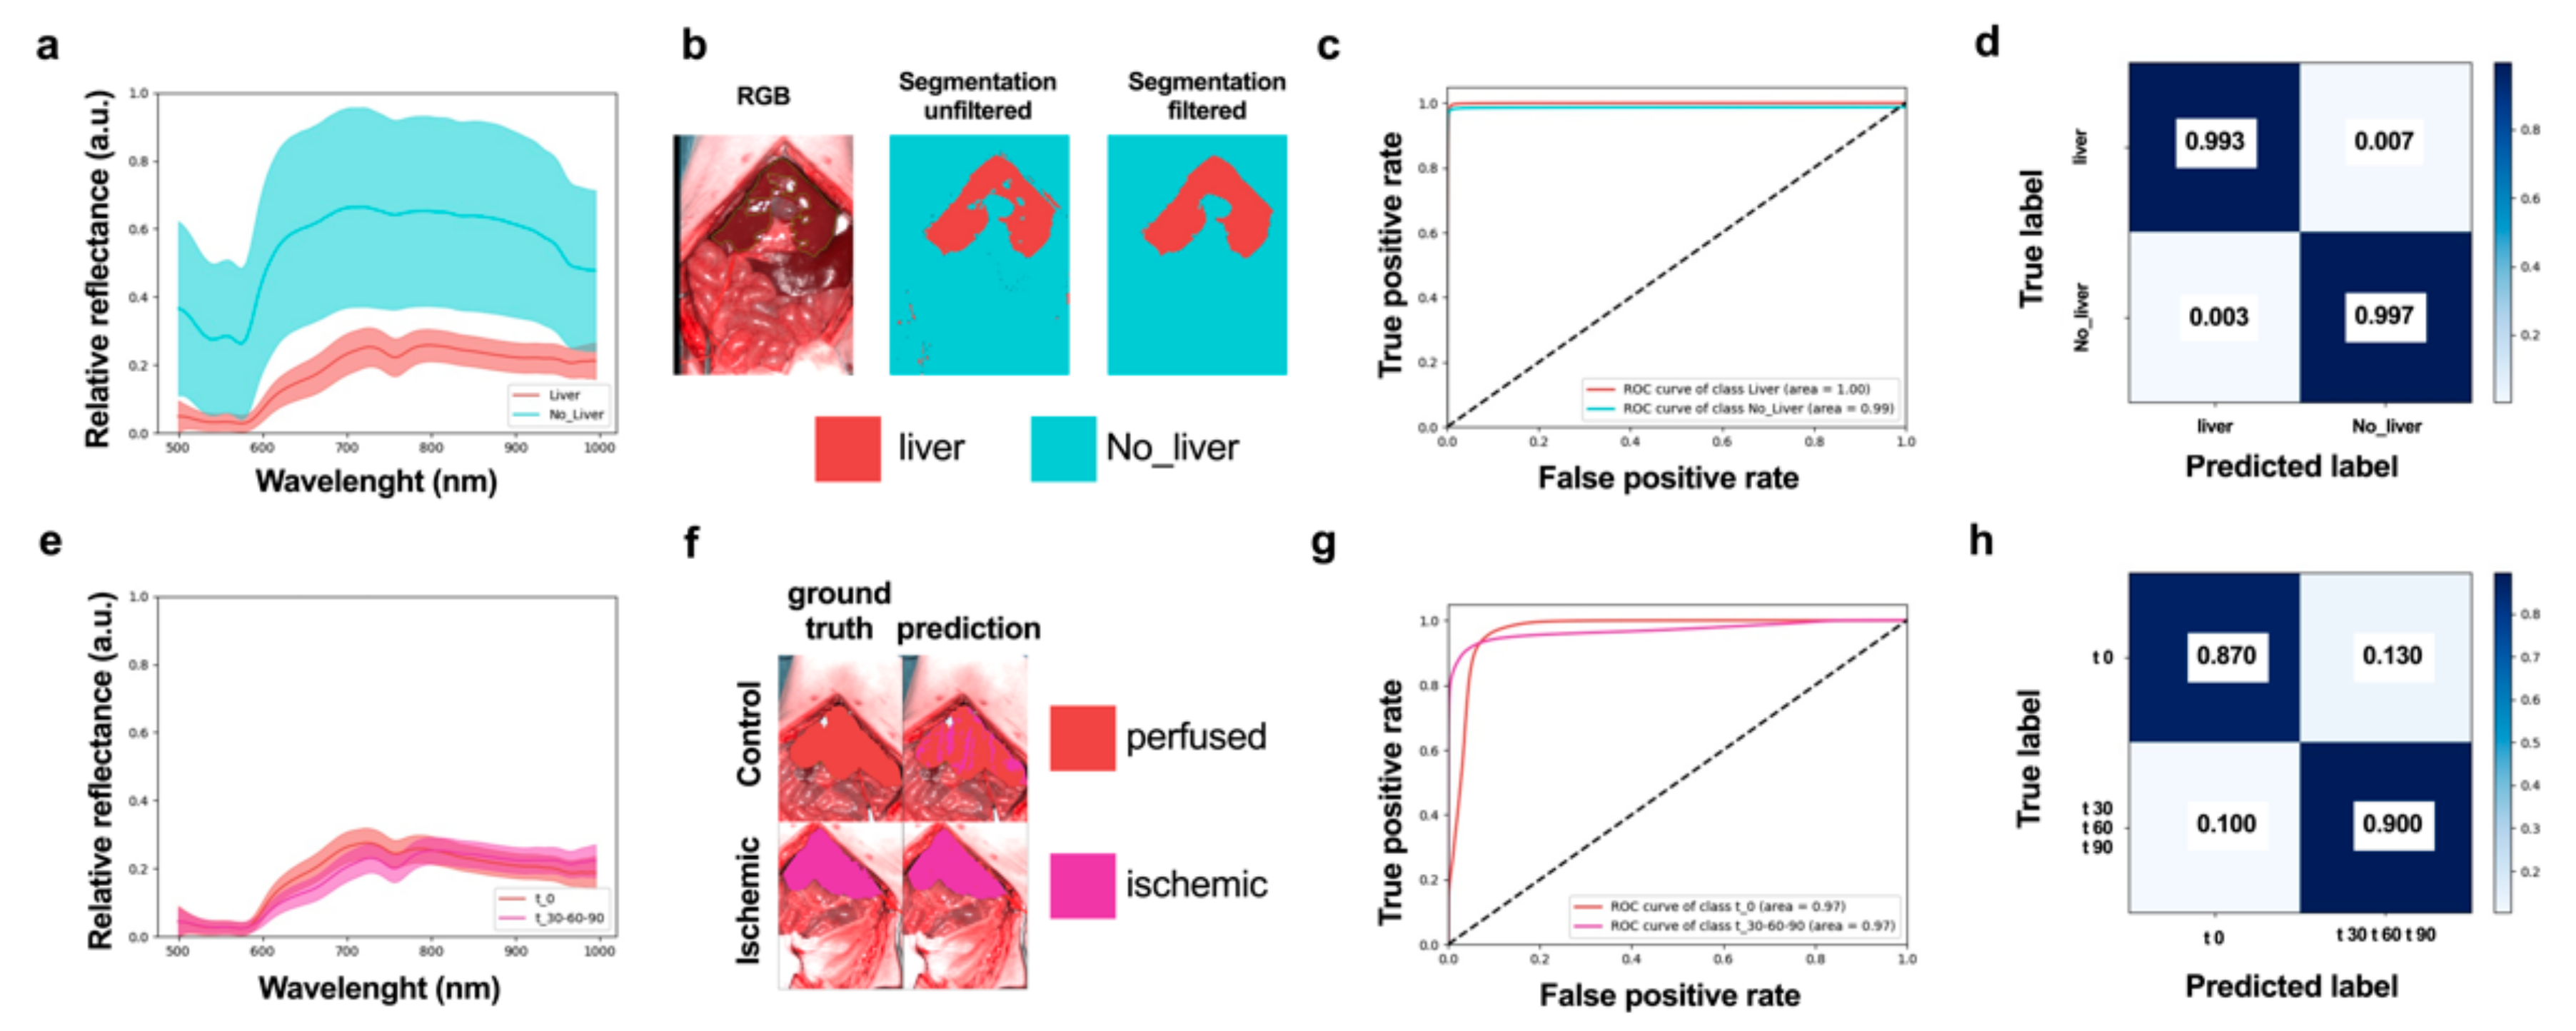
2.5.2. Organ Segmentation CNN and Post-Segmentation Filtering
2.5.3. Tissue Characterization CNN
2.5.4. CNN Design and Implementation
2.5.5. AI Training Processes
2.6. Blood Analysis
2.7. Histology
2.8. Immunohistochemistry Staining
2.9. Confocal Endomicroscopy
2.10. Statistical Analysis
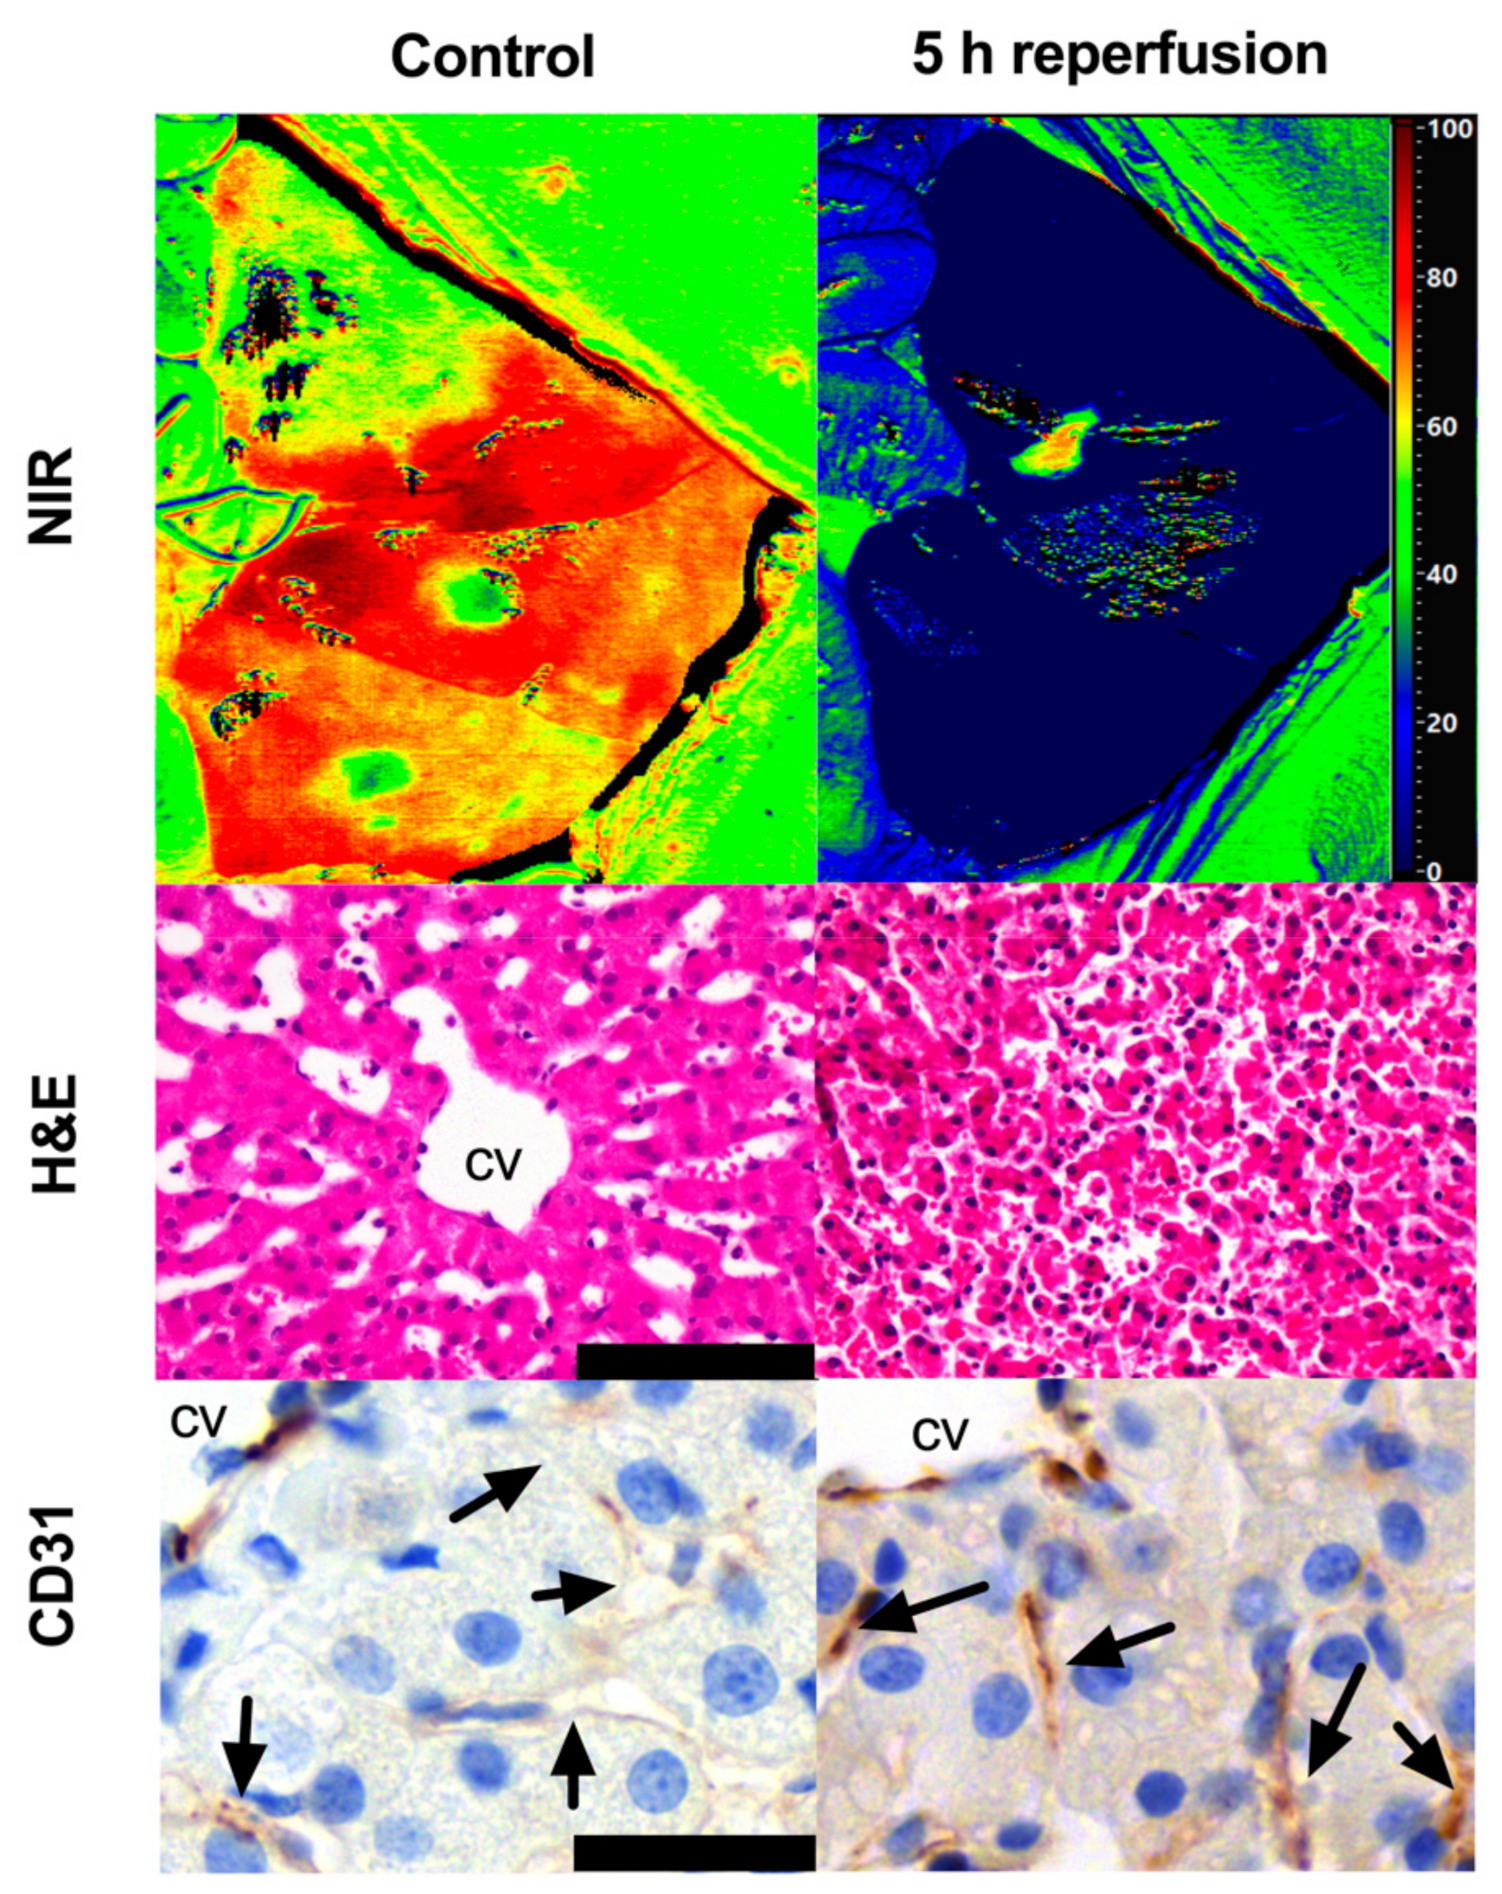
3. Results
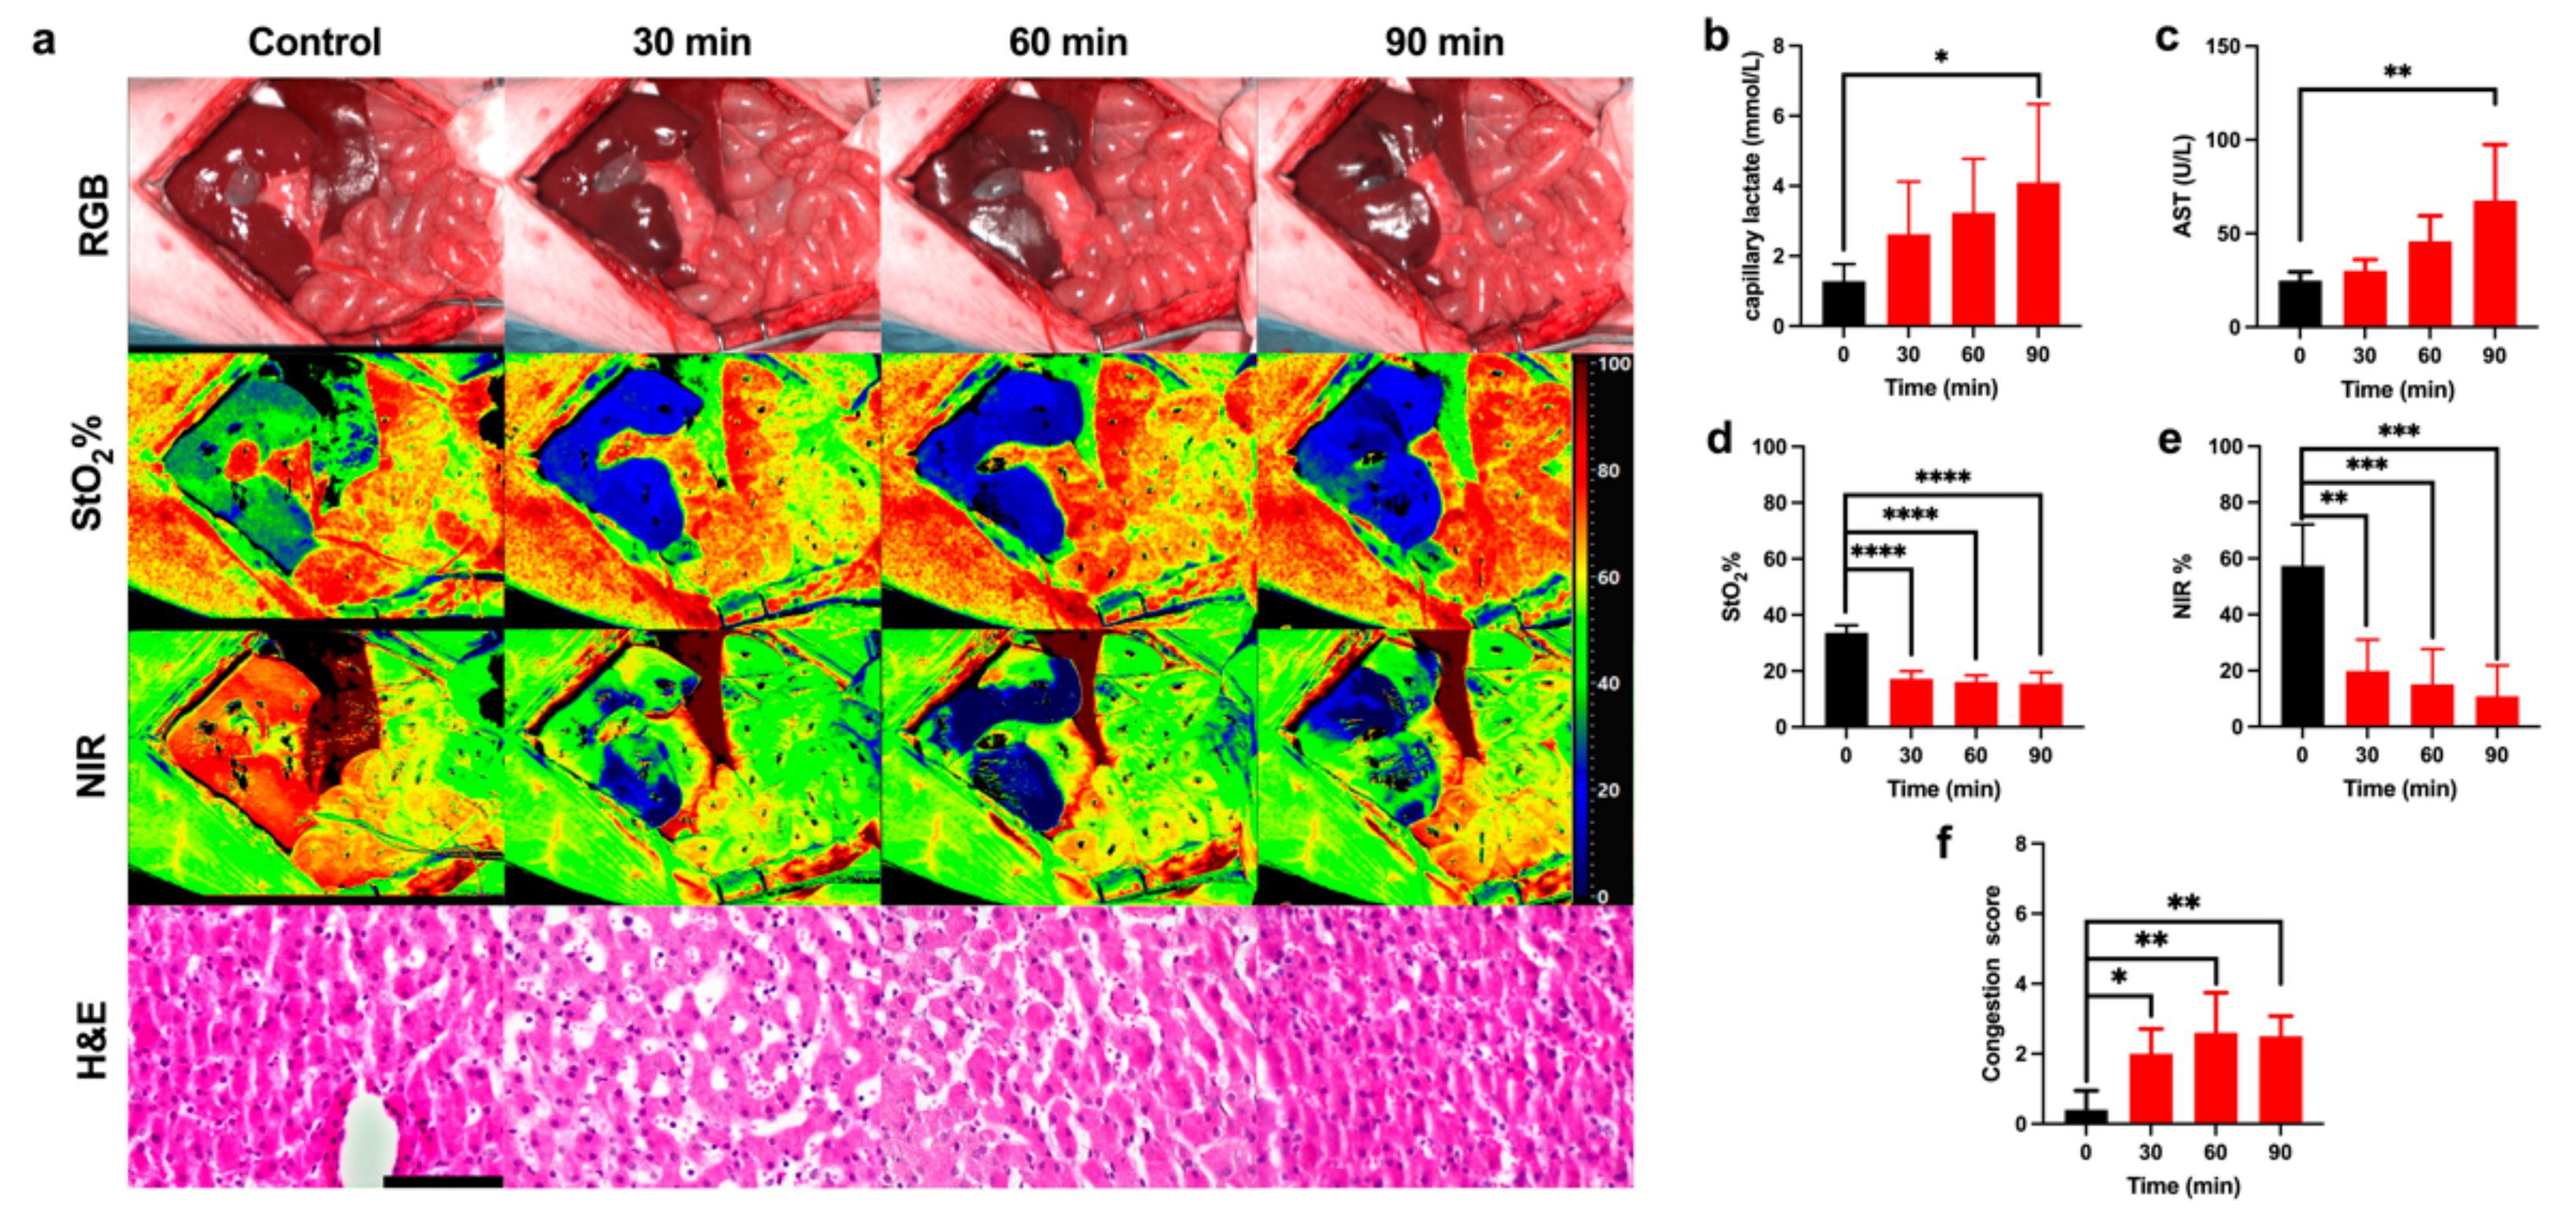
3.1. Ischemic Phase
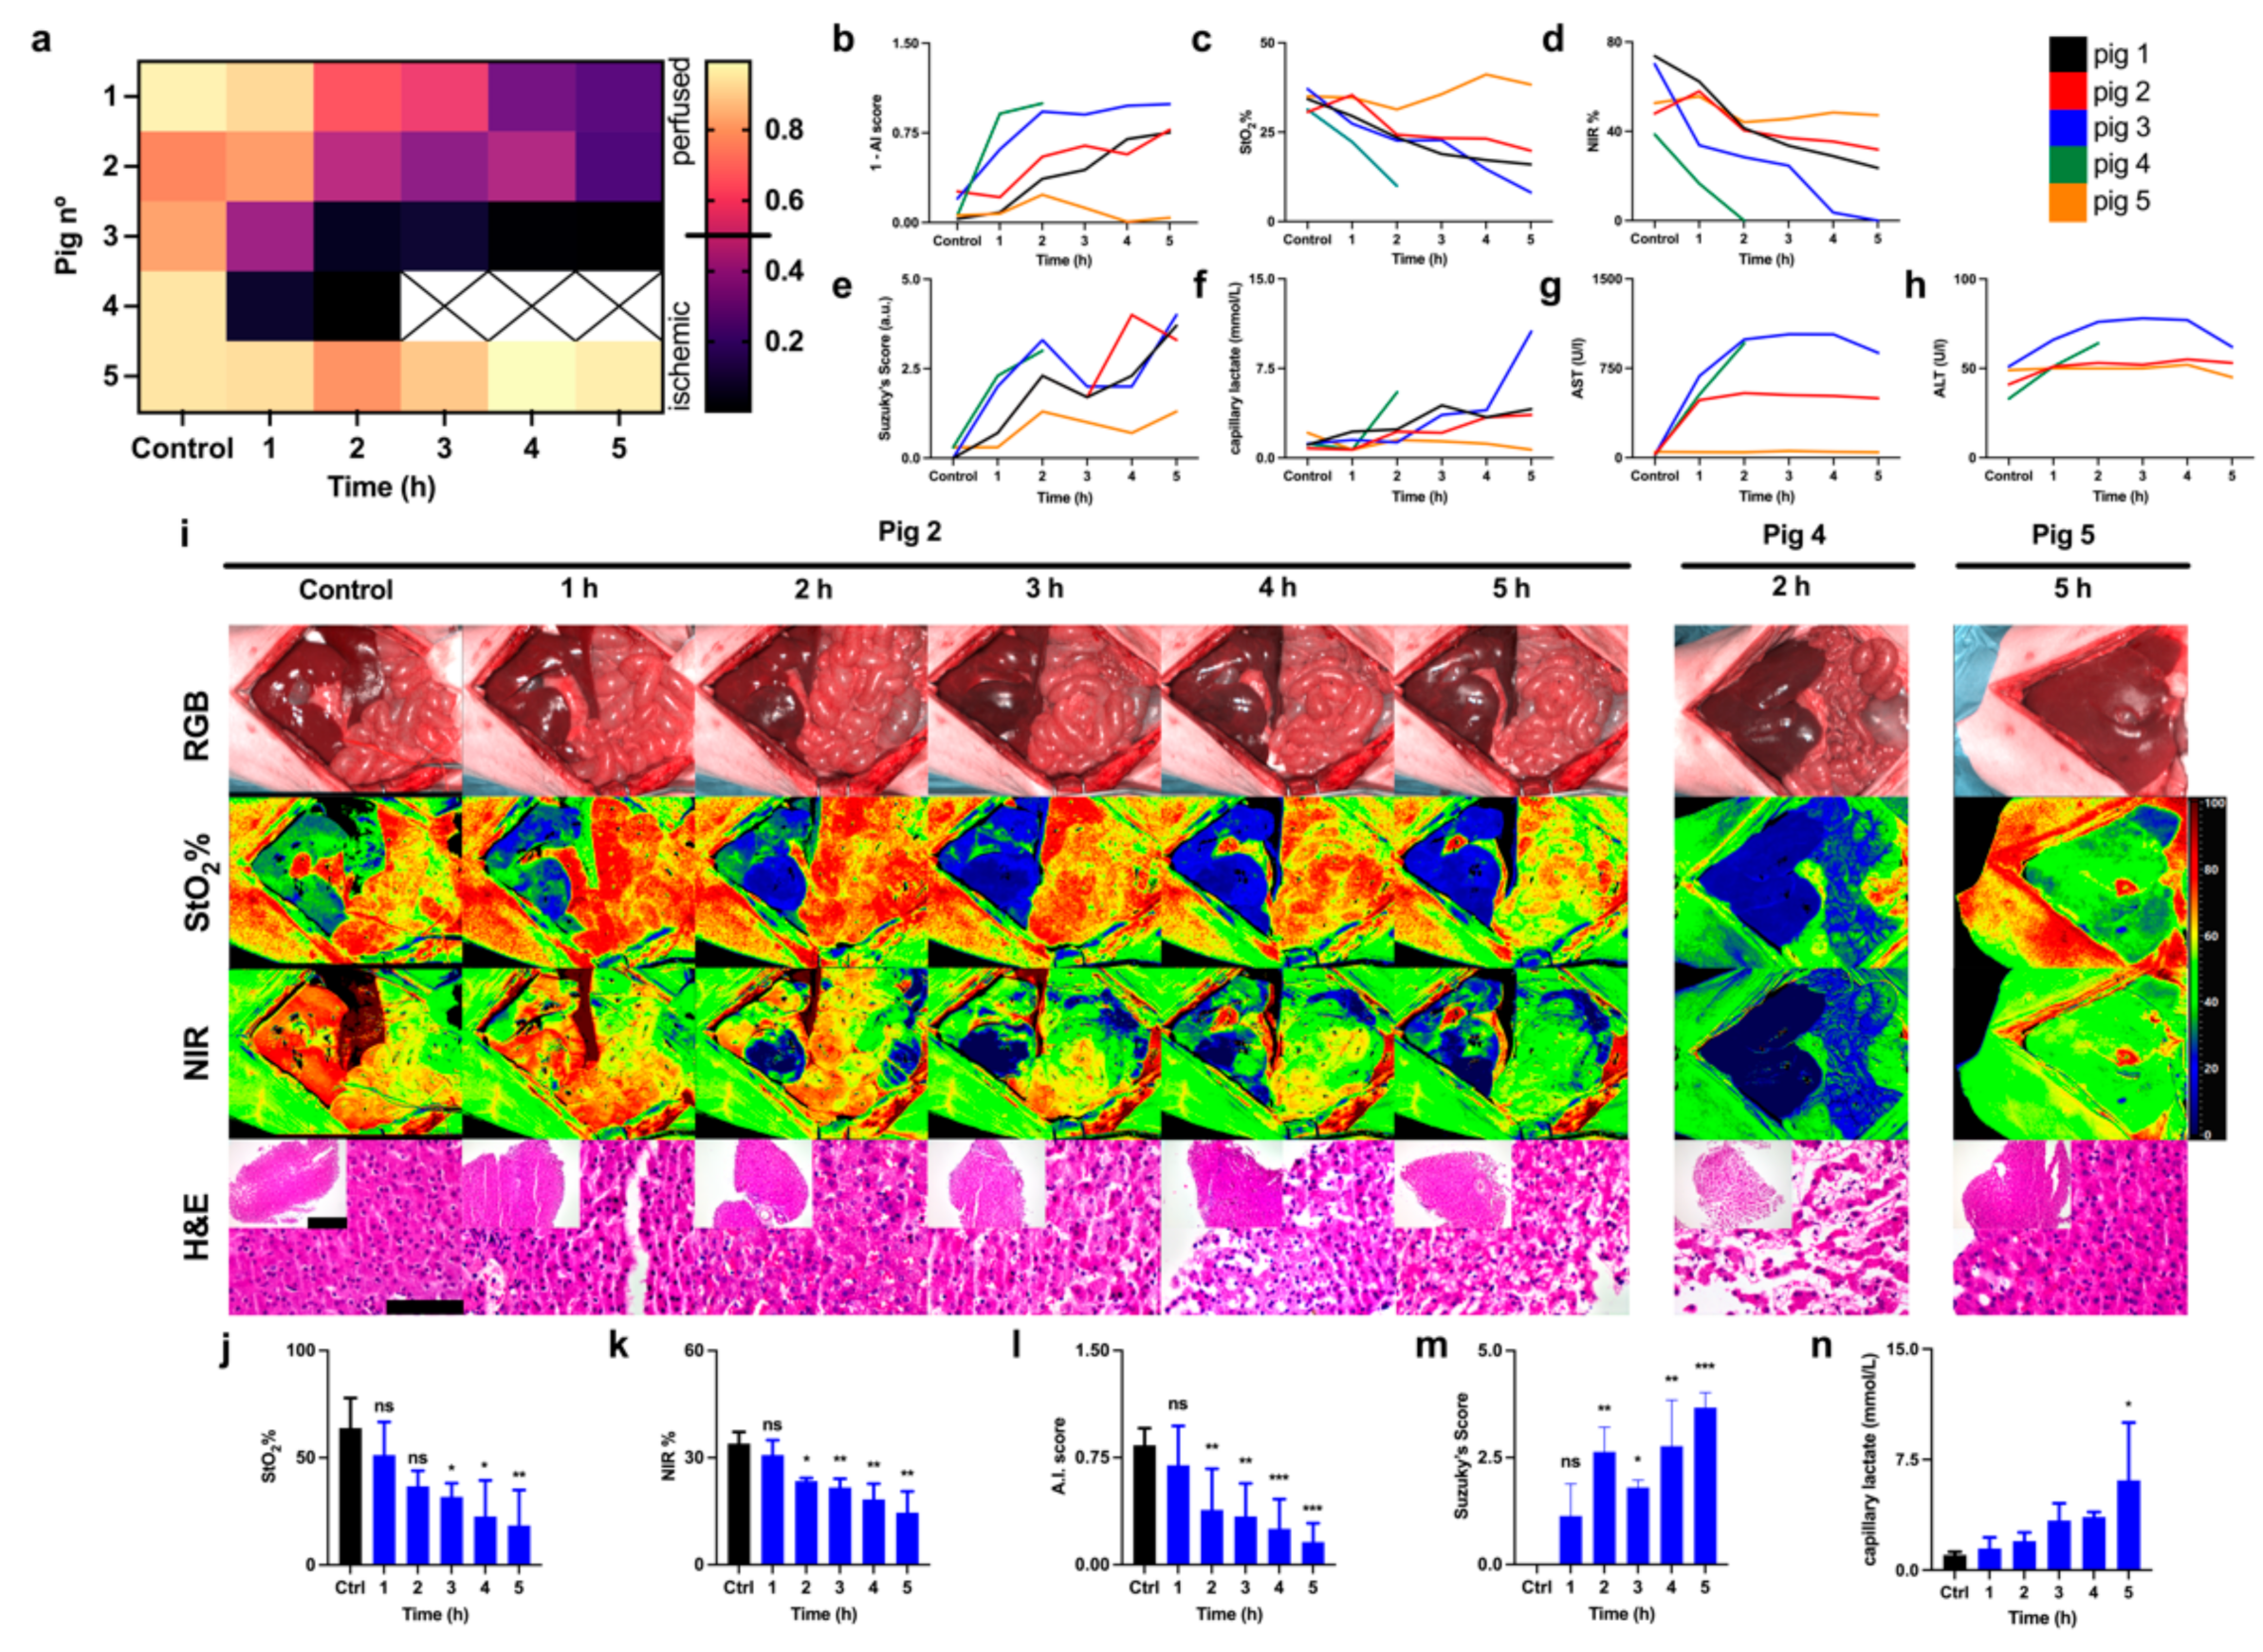
3.2. Reperfusion Phase
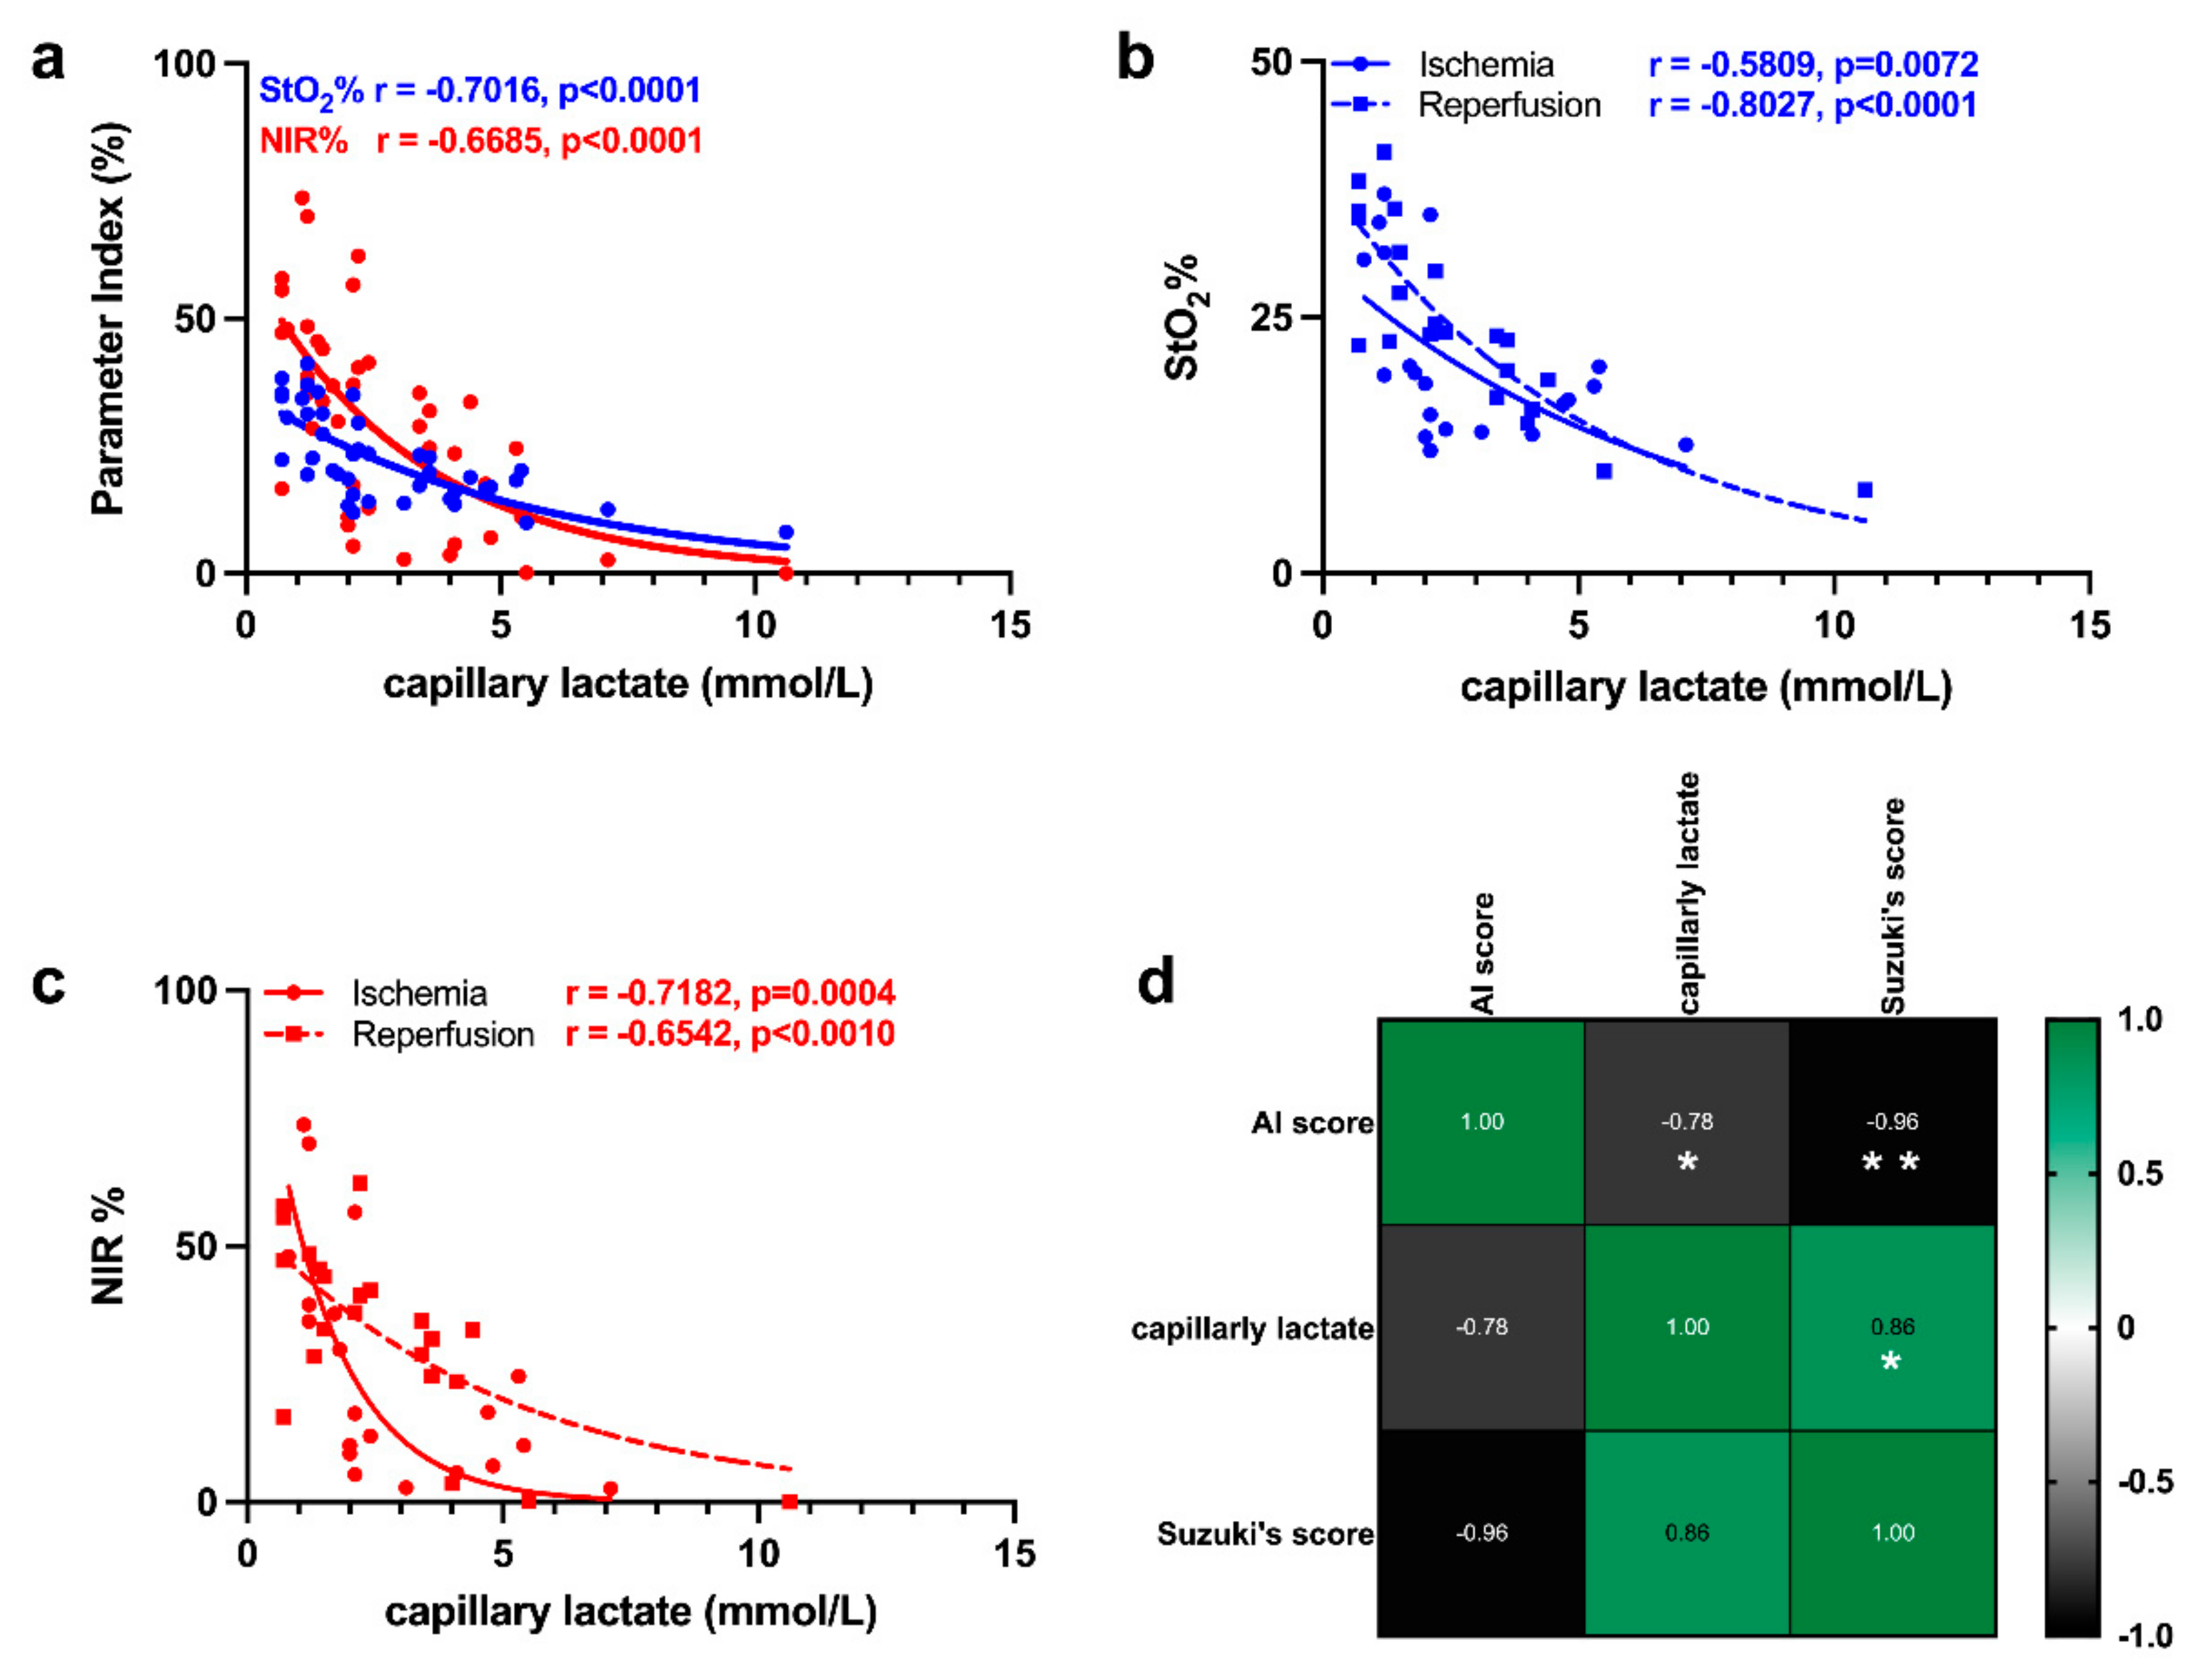
3.3. Correlation of HSI with Capillary Lactate
4. Discussion
4.1. Ischemic Phase
4.2. Reperfusion Phase
5. Conclusions
Supplementary Materials
Author Contributions
Funding
Institutional Review Board Statement
Informed Consent Statement
Data Availability Statement
Acknowledgments
Conflicts of Interest
References
- Lu, G.; Fei, B. Medical hyperspectral imaging: A review. J. Biomed. Opt. 2014, 19, 10901. [Google Scholar] [CrossRef]
- Ortega, S.; Fabelo, H.; Iakovidis, D.K.; Koulaouzidis, A.; Callico, G.M. Use of Hyperspectral/Multispectral Imaging in Gastroenterology. Shedding Some–Different–Light into the Dark. J. Clin. Med. 2019, 8, 36. [Google Scholar] [CrossRef] [PubMed]
- Fei, B. Chapter 3.6—Hyperspectral imaging in medical applications. In Data Handling in Science and Technology; Amigo, J.M., Ed.; Elsevier: Amsterdam, The Netherlands, 2020; Volume 32, pp. 523–565. [Google Scholar]
- Holmer, A.; Marotz, J.; Wahl, P.; Dau, M.; Kammerer, P.W. Hyperspectral imaging in perfusion and wound diagnostics—Methods and algorithms for the determination of tissue parameters. Biomed. Tech. 2018, 63, 547–556. [Google Scholar] [CrossRef]
- Jansen-Winkeln, B.; Holfert, N.; Köhler, H.; Moulla, Y.; Takoh, J.P.; Rabe, S.M.; Mehdorn, M.; Barberio, M.; Chalopin, C.; Neumuth, T.; et al. Determination of the transection margin during colorectal resection with hyperspectral imaging (HSI). Int. J. Colorectal. Dis. 2019, 34, 731–739. [Google Scholar] [CrossRef] [PubMed]
- Chin, J.A.; Wang, E.C.; Kibbe, M.R. Evaluation of hyperspectral technology for assessing the presence and severity of peripheral artery disease. J. Vasc. Surg. 2011, 54, 1679–1688. [Google Scholar] [CrossRef]
- Poole, K.M.; Tucker-Schwartz, J.M.; Sit, W.W.; Walsh, A.J.; Duvall, C.L.; Skala, M.C. Quantitative optical imaging of vascular response in vivo in a model of peripheral arterial disease. Am. J. Physiol. Heart Circ. Physiol. 2013, 305, H1168–H1180. [Google Scholar] [CrossRef] [PubMed]
- Best, S.L.; Thapa, A.; Holzer, M.J.; Jackson, N.; Mir, S.A.; Cadeddu, J.A.; Zuzak, K.J. Minimal arterial in-flow protects renal oxygenation and function during porcine partial nephrectomy: Confirmation by hyperspectral imaging. Urology 2011, 78, 961–966. [Google Scholar] [CrossRef]
- Kazune, S.; Caica, A.; Luksevics, E.; Volceka, K.; Grabovskis, A. Impact of increased mean arterial pressure on skin microcirculatory oxygenation in vasopressor-requiring septic patients: An interventional study. Ann. Intensive Care 2019, 9, 97. [Google Scholar] [CrossRef] [PubMed]
- Sumpio, B.J.; Citoni, G.; Chin, J.A.; Sumpio, B.E. Use of hyperspectral imaging to assess endothelial dysfunction in peripheral arterial disease. J. Vasc. Surg. 2016, 64, 1066–1073. [Google Scholar] [CrossRef]
- Grambow, E.; Dau, M.; Sandkühler, N.A.; Leuchter, M.; Holmer, A.; Klar, E.; Weinrich, M. Evaluation of peripheral artery disease with the TIVITA® Tissue hyperspectral imaging camera system. Clin. Hemorheol. Microcirc. 2019, 73, 3–17. [Google Scholar] [CrossRef]
- Oliveira, T.H.C.; Marques, P.E.; Proost, P.; Teixeira, M.M.M. Neutrophils: A cornerstone of liver ischemia and reperfusion injury. Lab. Investig. 2018, 98, 51–62. [Google Scholar] [CrossRef] [PubMed]
- Kelly, D.M.; Shiba, H.; Nakagawa, S.; Irefin, S.; Eghtesad, B.; Quintini, C.; Aucejo, F.; Hashimoto, K.; Fung, J.J.; Miller, C. Hepatic blood flow plays an important role in ischemia-reperfusion injury. Liver Transpl. 2011, 17, 1448–1456. [Google Scholar] [CrossRef] [PubMed]
- Pastacaldi, S.; Teixeira, R.; Montalto, P.; Rolles, K.; Burroughs, A.K. Hepatic artery thrombosis after orthotopic liver transplantation: A review of nonsurgical causes. Liver Transpl. 2001, 7, 75–81. [Google Scholar] [CrossRef] [PubMed]
- Wanner, G.A.; Ertel, W.; Muller, P.; Hofer, Y.; Leiderer, R.; Menger, M.D.; Messmer, K. Liver ischemia and reperfusion induces a systemic inflammatory response through Kupffer cell activation. Shock 1996, 5, 34–40. [Google Scholar] [CrossRef]
- Clavien, P.A.; Camargo, C.A., Jr.; Gorczynski, R.; Washington, M.K.; Levy, G.A.; Langer, B.; Greig, P.D. Acute reactant cytokines and neutrophil adhesion after warm ischemia in cirrhotic and noncirrhotic human livers. Hepatology 1996, 23, 1456–1463. [Google Scholar] [CrossRef]
- Haugaa, H.; Thorgersen, E.B.; Pharo, A.; Boberg, K.M.; Foss, A.; Line, P.D.; Sanengen, T.; Almaas, R.; Grindheim, G.; Pischke, S.E.; et al. Early bedside detection of ischemia and rejection in liver transplants by microdialysis. Liver Transpl. 2012, 18, 839–849. [Google Scholar] [CrossRef]
- Machado, M.; Fernandes, A.; Ferreira, C.; Marum, S.; Marques Vidal, P.; Mourão, L.; Marcelino, P. Value of serial serum lactate evaluation in liver transplant patients at the ICU. Crit. Care 2006, 10, P313. [Google Scholar] [CrossRef][Green Version]
- Ikeda, T.; Yanaga, K.; Kishikawa, K.; Kakizoe, S.; Shimada, M.; Sugimachi, K. Ischemic injury in liver transplantation: Difference in injury sites between warm and cold ischemia in rats. Hepatology 1992, 16, 454–461. [Google Scholar] [CrossRef]
- Russo, L.; Gracia-Sancho, J.; García-Calderó, H.; Marrone, G.; García-Pagán, J.C.; García-Cardeña, G.; Bosch, J. Addition of simvastatin to cold storage solution prevents endothelial dysfunction in explanted rat livers. Hepatology 2012, 55, 921–930. [Google Scholar] [CrossRef]
- Hide, D.; Ortega-Ribera, M.; Garcia-Pagan, J.C.; Peralta, C.; Bosch, J.; Gracia-Sancho, J. Effects of warm ischemia and reperfusion on the liver microcirculatory phenotype of rats: Underlying mechanisms and pharmacological therapy. Sci. Rep. 2016, 6, 22107. [Google Scholar] [CrossRef]
- Mills, A.; Mellnick, V. Imaging features of hepatic arterial and venous flow abnormalities. Clin. Liver Dis. 2018, 11, 27–32. [Google Scholar] [CrossRef]
- Levesque, E.; Hoti, E.; Azoulay, D.; Adam, R.; Samuel, D.; Castaing, D.; Saliba, F. Non-invasive ICG-clearance: A useful tool for the management of hepatic artery thrombosis following liver transplantation. Clin. Transpl. 2011, 25, 297–301. [Google Scholar] [CrossRef]
- Levesque, E.; Saliba, F.; Benhamida, S.; Ichai, P.; Azoulay, D.; Adam, R.; Castaing, D.; Samuel, D. Plasma disappearance rate of indocyanine green: A tool to evaluate early graft outcome after liver transplantation. Liver Transpl. 2009, 15, 1358–1364. [Google Scholar] [CrossRef]
- Kubota, K.; Kita, J.; Shimoda, M.; Rokkaku, K.; Kato, M.; Iso, Y.; Sawada, T. Intraoperative assessment of reconstructed vessels in living-donor liver transplantation, using a novel fluorescence imaging technique. J. Hepatobiliary Pancreat. Surg. 2006, 13, 100–104. [Google Scholar] [CrossRef]
- Skowno, J.J.; Karpelowsky, J.S.; Watts, N.R.; Little, D.G. Can transcutaneous near infrared spectroscopy detect severe hepatic ischemia: A juvenile porcine model. Paediatr. Anaesth. 2016, 26, 1188–1196. [Google Scholar] [CrossRef]
- Ungerstedt, J.; Nowak, G.; Ungerstedt, U.; Ericzon, B.G. Microdialysis monitoring of porcine liver metabolism during warm ischemia with arterial and portal clamping. Liver Transpl. 2009, 15, 280–286. [Google Scholar] [CrossRef]
- Pischke, S.E.; Tronstad, C.; Holhjem, L.; Line, P.D.; Haugaa, H.; Tønnessen, T.I. Hepatic and abdominal carbon dioxide measurements detect and distinguish hepatic artery occlusion and portal vein occlusion in pigs. Liver Transpl. 2012, 18, 1485–1494. [Google Scholar] [CrossRef] [PubMed]
- Urade, T.; Felli, E.; Barberio, M.; Al-Taher, M.; Felli, E.; Goffin, L.; Agnus, V.; Ettorre, G.M.; Marescaux, J.; Mutter, D.; et al. Hyperspectral enhanced reality (HYPER) for anatomical; liver resection. Surg. Endosc. 2020, 35, 1844–1850. [Google Scholar] [CrossRef] [PubMed]
- Felli, E.; Al-Taher, M.; Collins, T.; Baiocchini, A.; Felli, E.; Barberio, M.; Ettorre, G.M.; Mutter, D.; Lindner, V.; Hostettler, A.; et al. Hyperspectral evaluation of hepatic oxygenation in a model of total vs. arterial liver ischaemia. Sci. Rep. 2020, 10, 15441. [Google Scholar] [CrossRef] [PubMed]
- Nachabe, R.; Evers, D.J.; Hendriks, B.H.; Lucassen, G.W.; van der Voort, M.; Wesseling, J.; Ruers, T.J. Effect of bile absorption coefficients on the estimation of liver tissue optical properties and related implications in discriminating healthy and tumorous samples. Biomed. Opt. Express 2011, 2, 600–614. [Google Scholar] [CrossRef] [PubMed]
- Paoletti, M.E.; Haut, J.M.; Plaza, J.; Plaza, A. Deep learning classifiers for hyperspectral imaging: A review. Isprs J. Photogramm. Remote Sens. 2019, 158, 279–317. [Google Scholar] [CrossRef]
- Camps-Valls, G.; Tuia, D.; Bruzzone, L.; Benediktsson, J.A. Advances in Hyperspectral Image Classification: Earth Monitoring with Statistical Learning Methods. IEEE Signal Process. Mag. 2014, 31, 45–54. [Google Scholar] [CrossRef]
- Goetz, A.F.H. Three decades of hyperspectral remote sensing of the Earth: A personal view. Remote Sens. Environ. 2009, 113, S5–S16. [Google Scholar] [CrossRef]
- Halicek, M.; Lu, G.; Little, J.V.; Wang, X.; Patel, M.; Griffith, C.C.; El-Deiry, M.W.; Chen, A.Y.; Fei, B. Deep convolutional neural networks for classifying head and neck cancer using hyperspectral imaging. J. Biomed. Opt. 2017, 22, 60503. [Google Scholar] [CrossRef] [PubMed]
- Fei, B.; Lu, G.; Wang, X.; Zhang, H.; Little, J.V.; Patel, M.R.; Griffith, C.C.; El-Diery, M.W.; Chen, A.Y. Label-free reflectance hyperspectral imaging for tumor margin assessment: A pilot study on surgical specimens of cancer patients. J. Biomed. Opt. 2017, 22, 1–7. [Google Scholar] [CrossRef]
- Li, X.; Li, W.; Xu, X.; Hu, W.H. Cell classification using convolutional neural networks in medical hyperspectral imagery. In Proceedings of the 2017 2nd International Conference on Image, Vision and Computing (ICIVC), Chengdu, China, 2–4 June 2017; pp. 501–504. [Google Scholar]
- Barberio, M.; Longo, F.; Fiorillo, C.; Seeliger, B.; Mascagni, P.; Agnus, V.; Lindner, V.; Geny, B.; Charles, A.L.; Gockel, I.; et al. HYPerspectral Enhanced Reality (HYPER): A physiology-based surgical guidance tool. Surg. Endosc. 2020, 34, 1736–1744. [Google Scholar] [CrossRef]
- Barberio, M.; Felli, E.; Seyller, E.; Longo, F.; Chand, M.; Gockel, I.; Geny, B.; Swanstrom, L.; Marescaux, J.; Agnus, V.; et al. Quantitative fluorescence angiography versus hyperspectral imaging to assess bowel ischemia: A comparative study in enhanced reality. Surgery 2020, 168, 178–184. [Google Scholar] [CrossRef]
- Felli, E.; Al-Taher, M.; Felli, E.; Cinelli, L.; Marescaux, J.; Diana, M. Protocol for the pig liver ischemia/reperfusion injury. Protoc. Exchagne 2020. [Google Scholar] [CrossRef]
- Kilkenny, C.; Browne, W.; Cuthill, I.C.; Emerson, M.; Altman, D.G.; NC3Rs Reporting Guidelines Working Group. Animal research: Reporting in vivo experiments: The ARRIVE guidelines. Br. J. Pharm. 2010, 160, 1577–1579. [Google Scholar] [CrossRef]
- Uchida, M.; Takemoto, Y.; Nagasue, N.; Kimoto, T.; Dhar, D.K.; Nakamura, T. Calcium in pig livers following ischemia and reperfusion. J. Hepatol. 1994, 20, 714–719. [Google Scholar] [CrossRef]
- Rampes, S.; Ma, D. Hepatic ischemia-reperfusion injury in liver transplant setting: Mechanisms and protective strategies. J. Biomed. Res. 2019, 33, 221–234. [Google Scholar] [CrossRef] [PubMed]
- Kulcke, A.; Holmer, A.; Wahl, P.; Siemers, F.; Wild, T.; Daeschlein, G. A compact hyperspectral camera for measurement of perfusion parameters in medicine. Biomed. Tech. 2018, 63, 519–527. [Google Scholar] [CrossRef] [PubMed]
- Hamida, A.B.; Benoit, A.; Lambert, P.; Amar, C.B. 3-D Deep Learning Approach for Remote Sensing Image Classification. Ieee Trans. Geosci. Remote Sens. 2018, 56, 4420–4434. [Google Scholar] [CrossRef]
- Iandola, F.N.; Han, S.; Moskewicz, M.W.; Ashraf, K.; Dally, W.J.; Keutzer, K. SqueezeNet: AlexNet-level accuracy with 50x fewer parameters and <0.5MB model size. arXiv 2016, arXiv:1602.07360. [Google Scholar]
- He, K.; Zhang, X.; Ren, S.; Sun, J. Delving Deep into Rectifiers: Surpassing Human-Level Performance on ImageNet Classification. In Proceedings of the 2015 IEEE International Conference on Computer Vision (ICCV), Santiago, Chile, 7–13 December 2015; pp. 1026–1034. [Google Scholar]
- Suzuki, S.; Toledo-Pereyra, L.H.; Rodriguez, F.J.; Cejalvo, D. Neutrophil infiltration as an important factor in liver ischemia and reperfusion injury. Modulating effects of FK506 and cyclosporine. Transplantation 1993, 55, 1265–1272. [Google Scholar] [CrossRef]
- Brockmann, J.G.; August, C.; Wolters, H.H.; Homme, R.; Palmes, D.; Baba, H.; Spiegel, H.U.; Dietl, K.H. Sequence of reperfusion influences ischemia/reperfusion injury and primary graft function following porcine liver transplantation. Liver Transpl. 2005, 11, 1214–1222. [Google Scholar] [CrossRef] [PubMed]
- Lee, H.T.; Park, S.W.; Kim, M.; D’Agati, V.D. Acute kidney injury after hepatic ischemia and reperfusion injury in mice. Lab. Invest. 2009, 89, 196–208. [Google Scholar] [CrossRef]
- Farnebo, S.; Winbladh, A.; Zettersten, E.K.; Sandstrom, P.; Gullstrand, P.; Samuelsson, A.; Theodorson, E.; Sjoberg, F. Urea clearance: A new technique based on microdialysis to assess liver blood flow studied in a pig model of ischemia/reperfusion. Eur. Surg. Res. 2010, 45, 105–112. [Google Scholar] [CrossRef]
- Forrester, J.V.; Dick, A.D.; McMenamin, P.G.; Roberts, F.; Pearlman, E. Chapter 5—Physiology of vision and the visual system. In The Eye, 4th ed.; Forrester, J.V., Dick, A.D., McMenamin, P.G., Roberts, F., Pearlman, E., Eds.; W.B. Saunders: Philadelphia, PA, USA, 2016; pp. 269–337.e262. [Google Scholar]
- Imamoto, Y.; Shichida, Y. Cone visual pigments. Biochim. Biophys. Acta 2014, 1837, 664–673. [Google Scholar] [CrossRef]
- Lautt, W.W. Hepatic Circulation: Physiology and Pathophysiology. In Hepatic Circulation: Physiology and Pathophysiology; Sciences, M.C.L., Ed.; Morgan and Claypool: San Rafael, CA, USA, 2009. [Google Scholar]
- Lautt, W.W.; Schafer, J.; Legare, D.J. Hepatic blood flow distribution: Consideration of gravity, liver surface, and norepinephrine on regional heterogeneity. Can. J. Physiol. Pharm. 1993, 71, 128–135. [Google Scholar] [CrossRef]
- Vollmar, B.; Menger, M.D. The hepatic microcirculation: Mechanistic contributions and therapeutic targets in liver injury and repair. Physiol. Rev. 2009, 89, 1269–1339. [Google Scholar] [CrossRef] [PubMed]
- Shen, L.; Uz, Z.; Ince, C.; van Gulik, T. Alterations in intestinal serosal microcirculation precipitated by the Pringle manoeuvre. BMJ Case Rep. 2019, 12, e228111. [Google Scholar] [CrossRef]
- Baiocchini, A.; Del Nonno, F.; Taibi, C.; Visco-Comandini, U.; D’Offizi, G.; Piacentini, M.; Falasca, L. Publisher Correction: Liver sinusoidal endothelial cells (LSECs) modifications in patients with chronic hepatitis C. Sci. Rep. 2020, 10, 1420. [Google Scholar] [CrossRef] [PubMed]
- Scoazec, J.Y.; Feldmann, G. In situ immunophenotyping study of endothelial cells of the human hepatic sinusoid: Results and functional implications. Hepatology 1991, 14, 789–797. [Google Scholar] [CrossRef] [PubMed]
- Lalor, P.F.; Lai, W.K.; Curbishley, S.M.; Shetty, S.; Adams, D.H. Human hepatic sinusoidal endothelial cells can be distinguished by expression of phenotypic markers related to their specialised functions in vivo. World J. Gastroenterol. 2006, 12, 5429–5439. [Google Scholar] [CrossRef]
- He, K.; Zhang, X.; Ren, S.; Sun, J. Deep Residual Learning for Image Recognition. In Proceedings of the 2016 IEEE Conference on Computer Vision and Pattern Recognition (CVPR), Las Vegas, NV, USA, 27–30 June 2016; pp. 770–778. [Google Scholar]
- Kim, J.S.; Kim, K.W.; Lee, J.; Kwon, H.J.; Kwon, J.H.; Song, G.W.; Lee, S.G. Diagnostic Performance for Hepatic Artery Occlusion After Liver Transplantation: Computed Tomography Angiography Versus Contrast-Enhanced Ultrasound. Liver Transpl. 2019, 25, 1651–1660. [Google Scholar] [CrossRef]
- Pinna, A.D.; Smith, C.V.; Furukawa, H.; Starzl, T.E.; Fung, J.J. Urgent revascularization of liver allografts after early hepatic artery thrombosis. Transplantation 1996, 62, 1584–1587. [Google Scholar] [CrossRef] [PubMed]
- Diana, M. Enabling precision digestive surgery with fluorescence imaging. Transl. Gastroenterol. Hepatol. 2017, 2, 97. [Google Scholar] [CrossRef]


Publisher’s Note: MDPI stays neutral with regard to jurisdictional claims in published maps and institutional affiliations. |
© 2021 by the authors. Licensee MDPI, Basel, Switzerland. This article is an open access article distributed under the terms and conditions of the Creative Commons Attribution (CC BY) license (https://creativecommons.org/licenses/by/4.0/).
Share and Cite
Felli, E.; Al-Taher, M.; Collins, T.; Nkusi, R.; Felli, E.; Baiocchini, A.; Lindner, V.; Vincent, C.; Barberio, M.; Geny, B.; et al. Automatic Liver Viability Scoring with Deep Learning and Hyperspectral Imaging. Diagnostics 2021, 11, 1527. https://doi.org/10.3390/diagnostics11091527
Felli E, Al-Taher M, Collins T, Nkusi R, Felli E, Baiocchini A, Lindner V, Vincent C, Barberio M, Geny B, et al. Automatic Liver Viability Scoring with Deep Learning and Hyperspectral Imaging. Diagnostics. 2021; 11(9):1527. https://doi.org/10.3390/diagnostics11091527
Chicago/Turabian StyleFelli, Eric, Mahdi Al-Taher, Toby Collins, Richard Nkusi, Emanuele Felli, Andrea Baiocchini, Veronique Lindner, Cindy Vincent, Manuel Barberio, Bernard Geny, and et al. 2021. "Automatic Liver Viability Scoring with Deep Learning and Hyperspectral Imaging" Diagnostics 11, no. 9: 1527. https://doi.org/10.3390/diagnostics11091527
APA StyleFelli, E., Al-Taher, M., Collins, T., Nkusi, R., Felli, E., Baiocchini, A., Lindner, V., Vincent, C., Barberio, M., Geny, B., Ettorre, G. M., Hostettler, A., Mutter, D., Gioux, S., Schuster, C., Marescaux, J., Gracia-Sancho, J., & Diana, M. (2021). Automatic Liver Viability Scoring with Deep Learning and Hyperspectral Imaging. Diagnostics, 11(9), 1527. https://doi.org/10.3390/diagnostics11091527