
An Artificial Intelligence-Enabled Pipeline for Medical Domain: Malaysian Breast Cancer Survivorship Cohort as a Case Study

 , ,
, ,
Abstract
1. Introduction
2. Materials and Methods
2.1. Database Design
| Algorithm 1: Cartesian product to select lifestyle and clinical factors from different tables. |
|
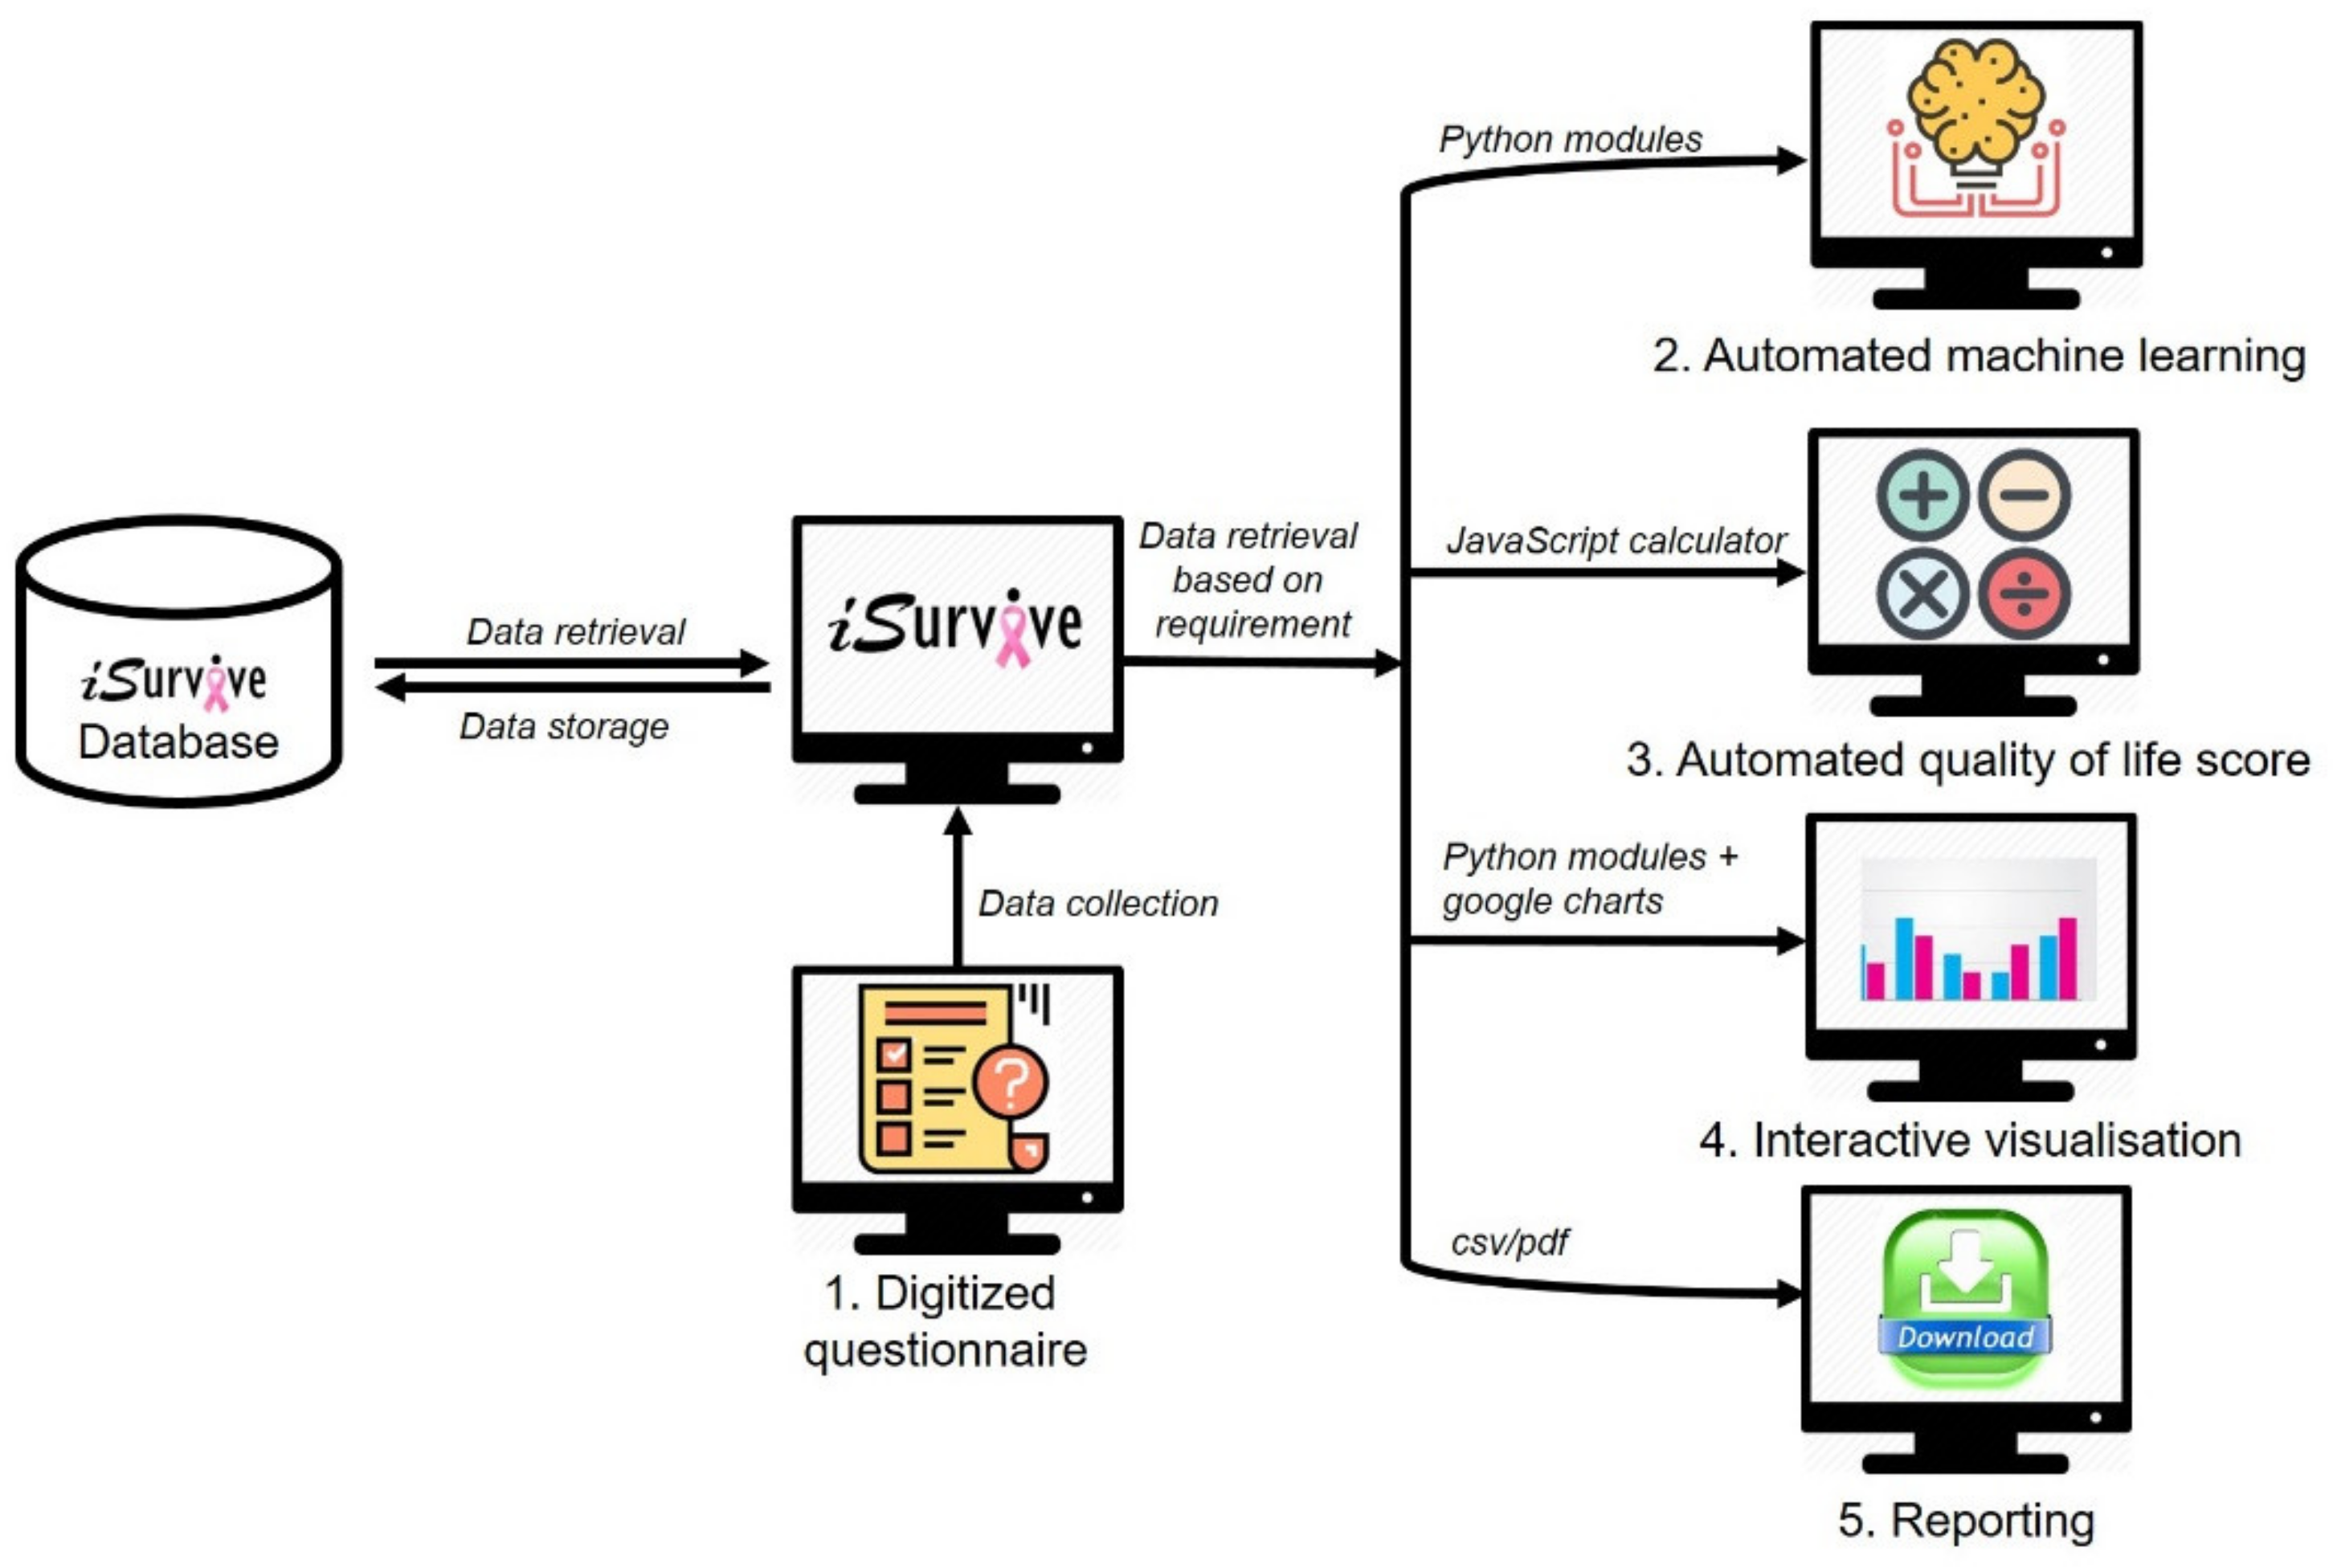
2.2. Pipeline to Develop iSurvive
2.2.1. Digitization of Questionnaires
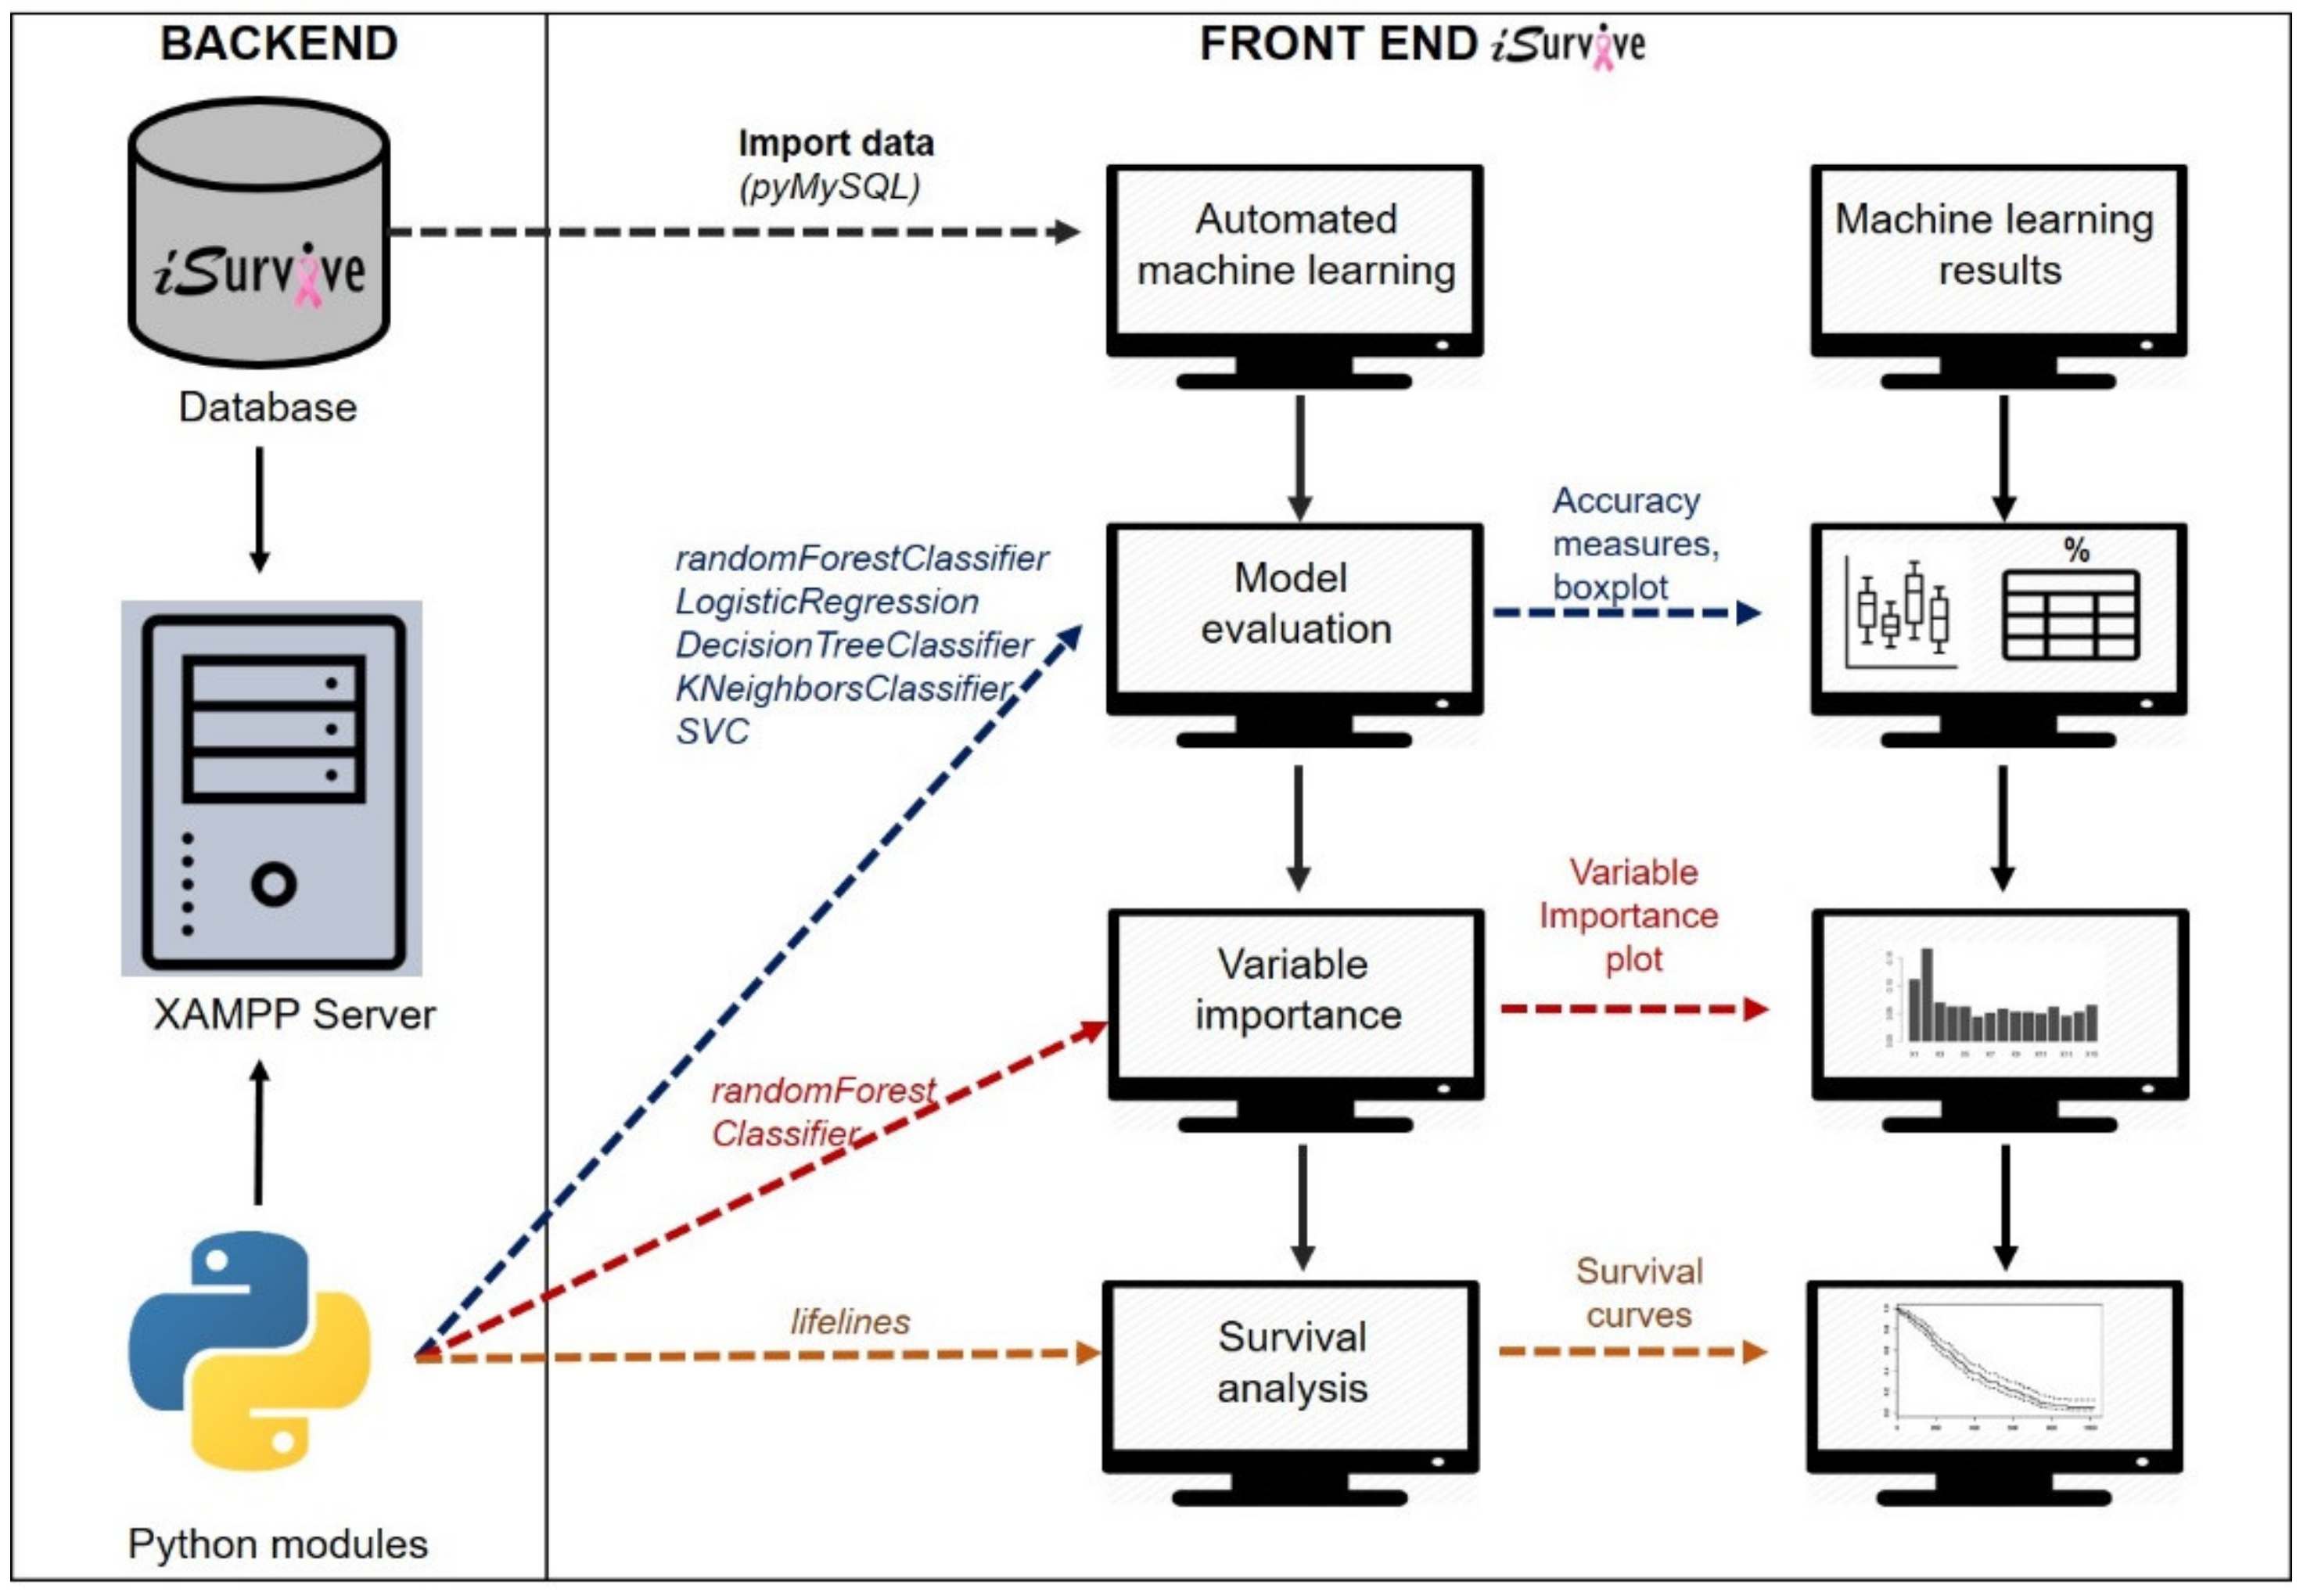
2.2.2. Automated Machine Learning Module
| Algorithm 2: Python-HTML integration for automated machine learning. |
|
2.2.3. Automated Quality of Life Scoring
2.2.4. Interactive Visualizations
| Algorithm 3: Model of the automated visualization from database. |
|
2.2.5. Download Module
3. Results
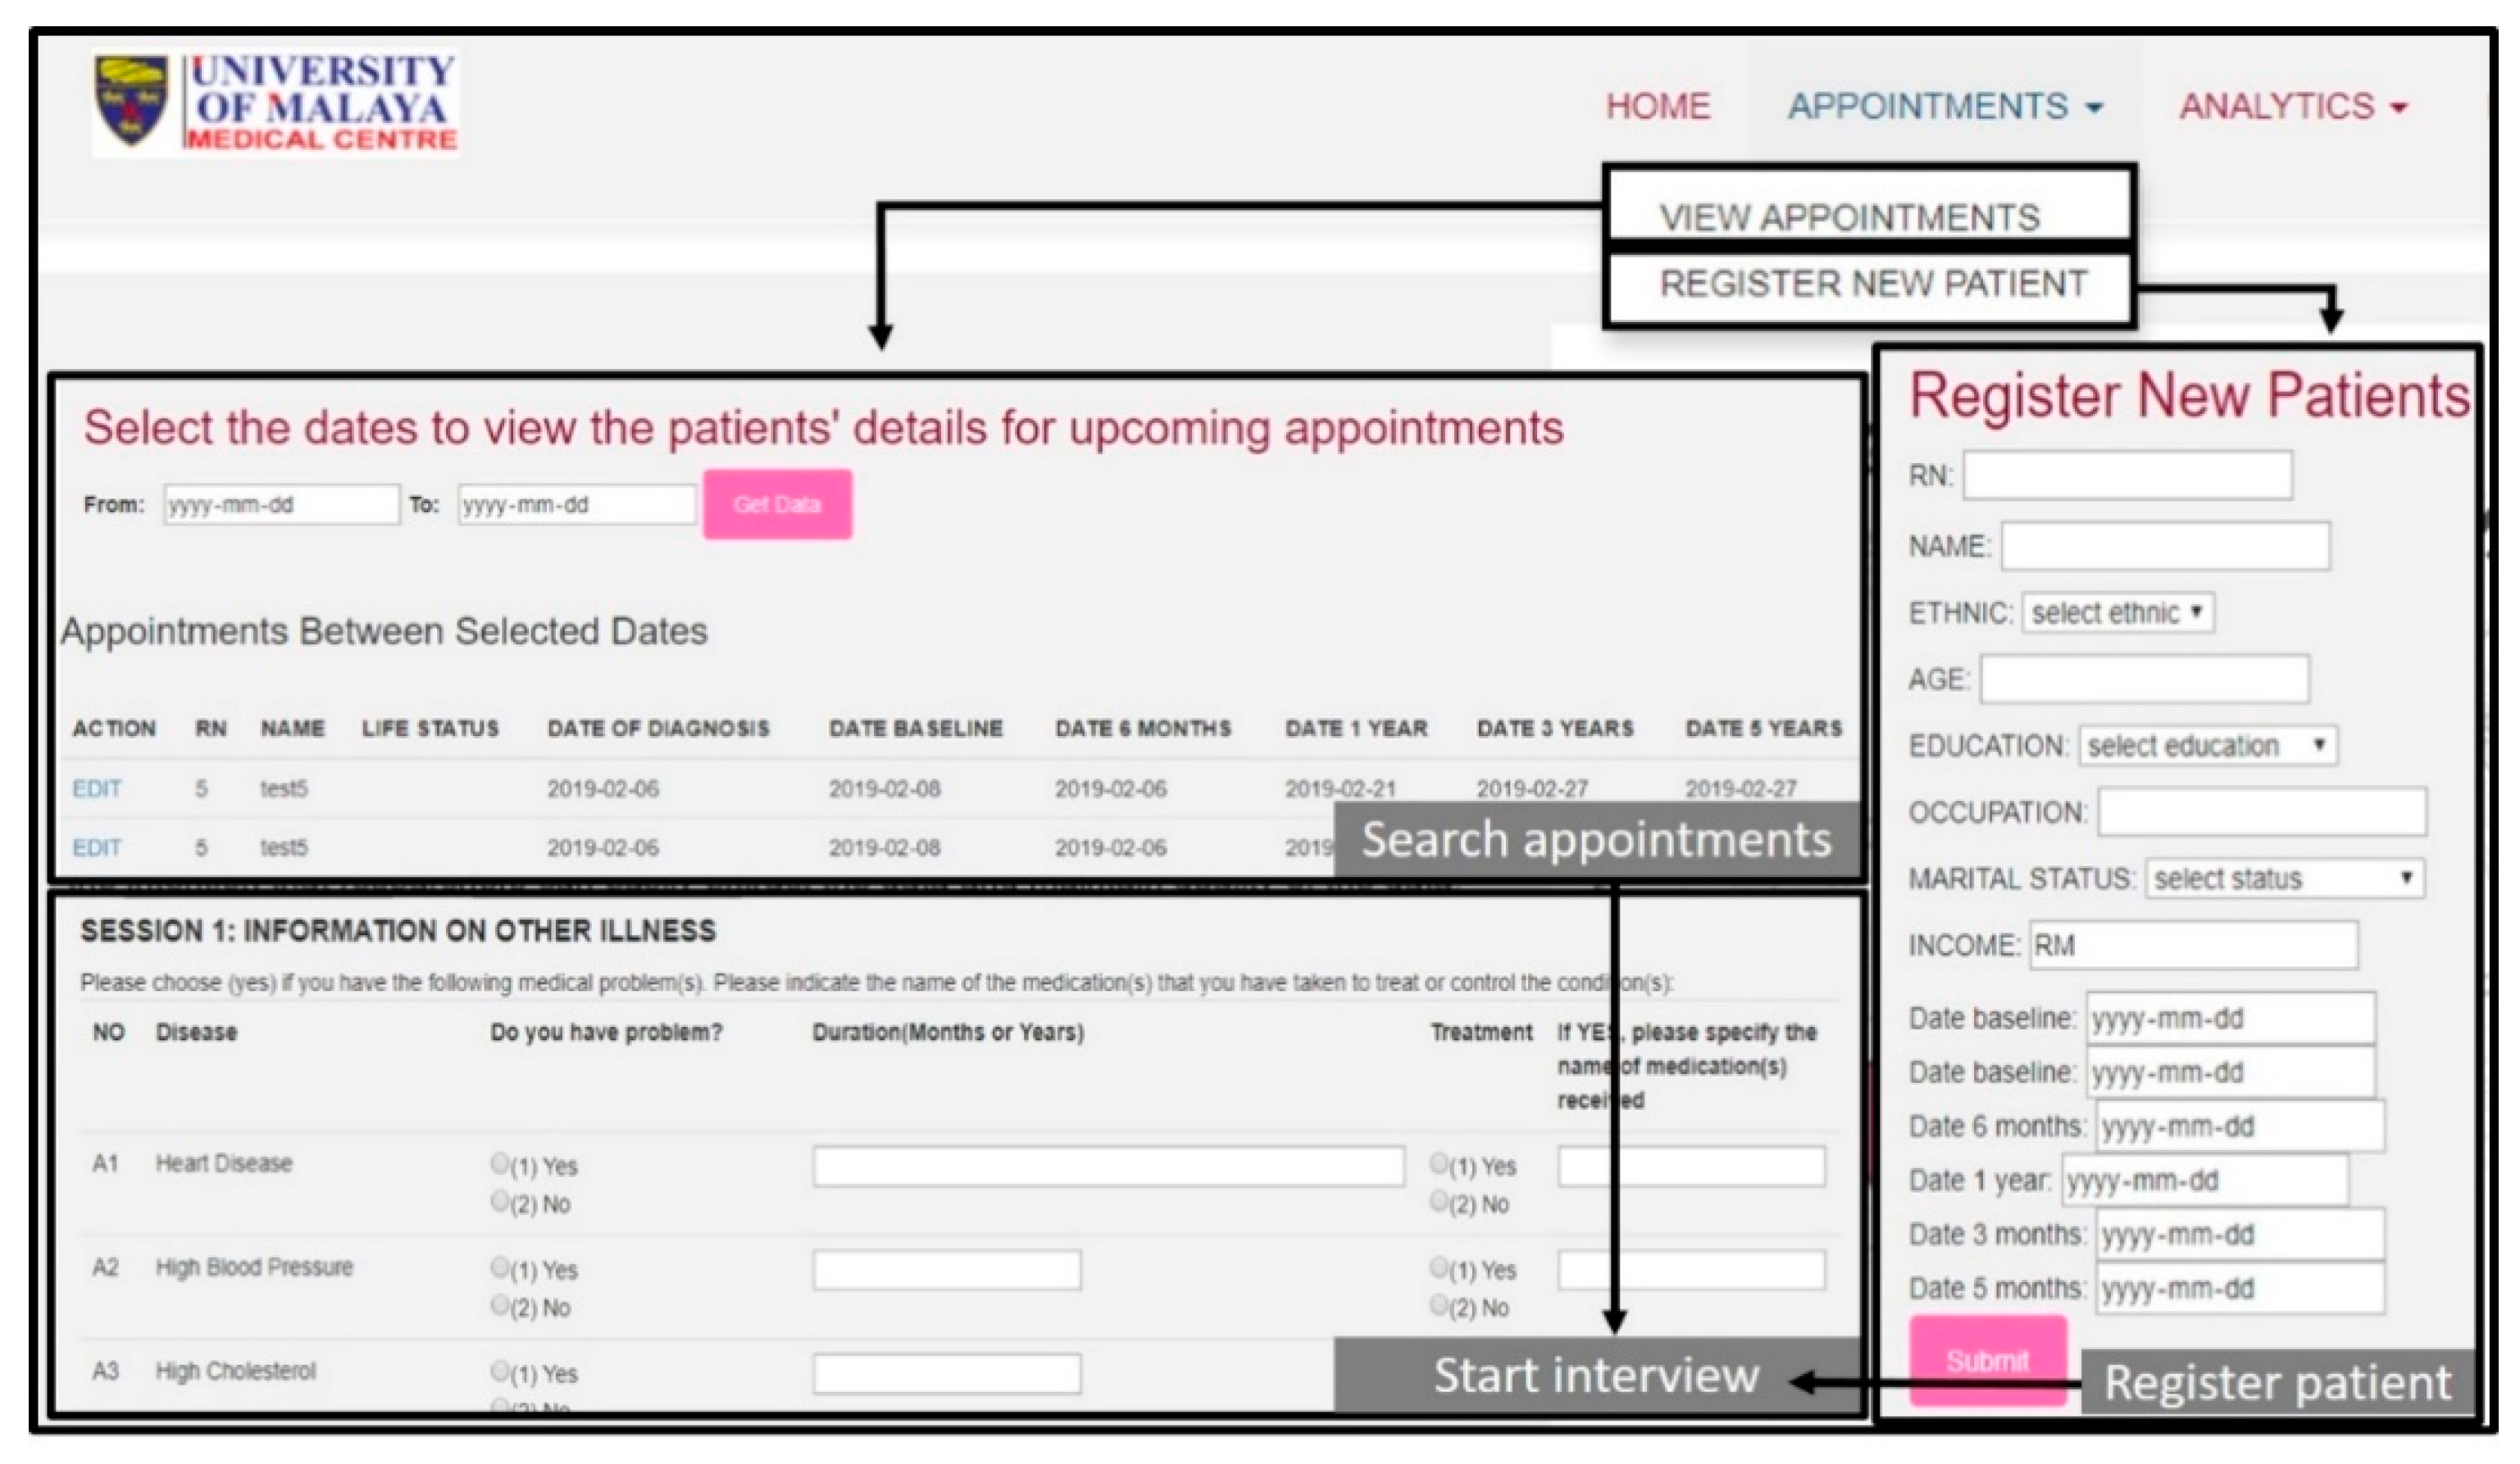
3.1. Digitized Questionnaire in iSurvive
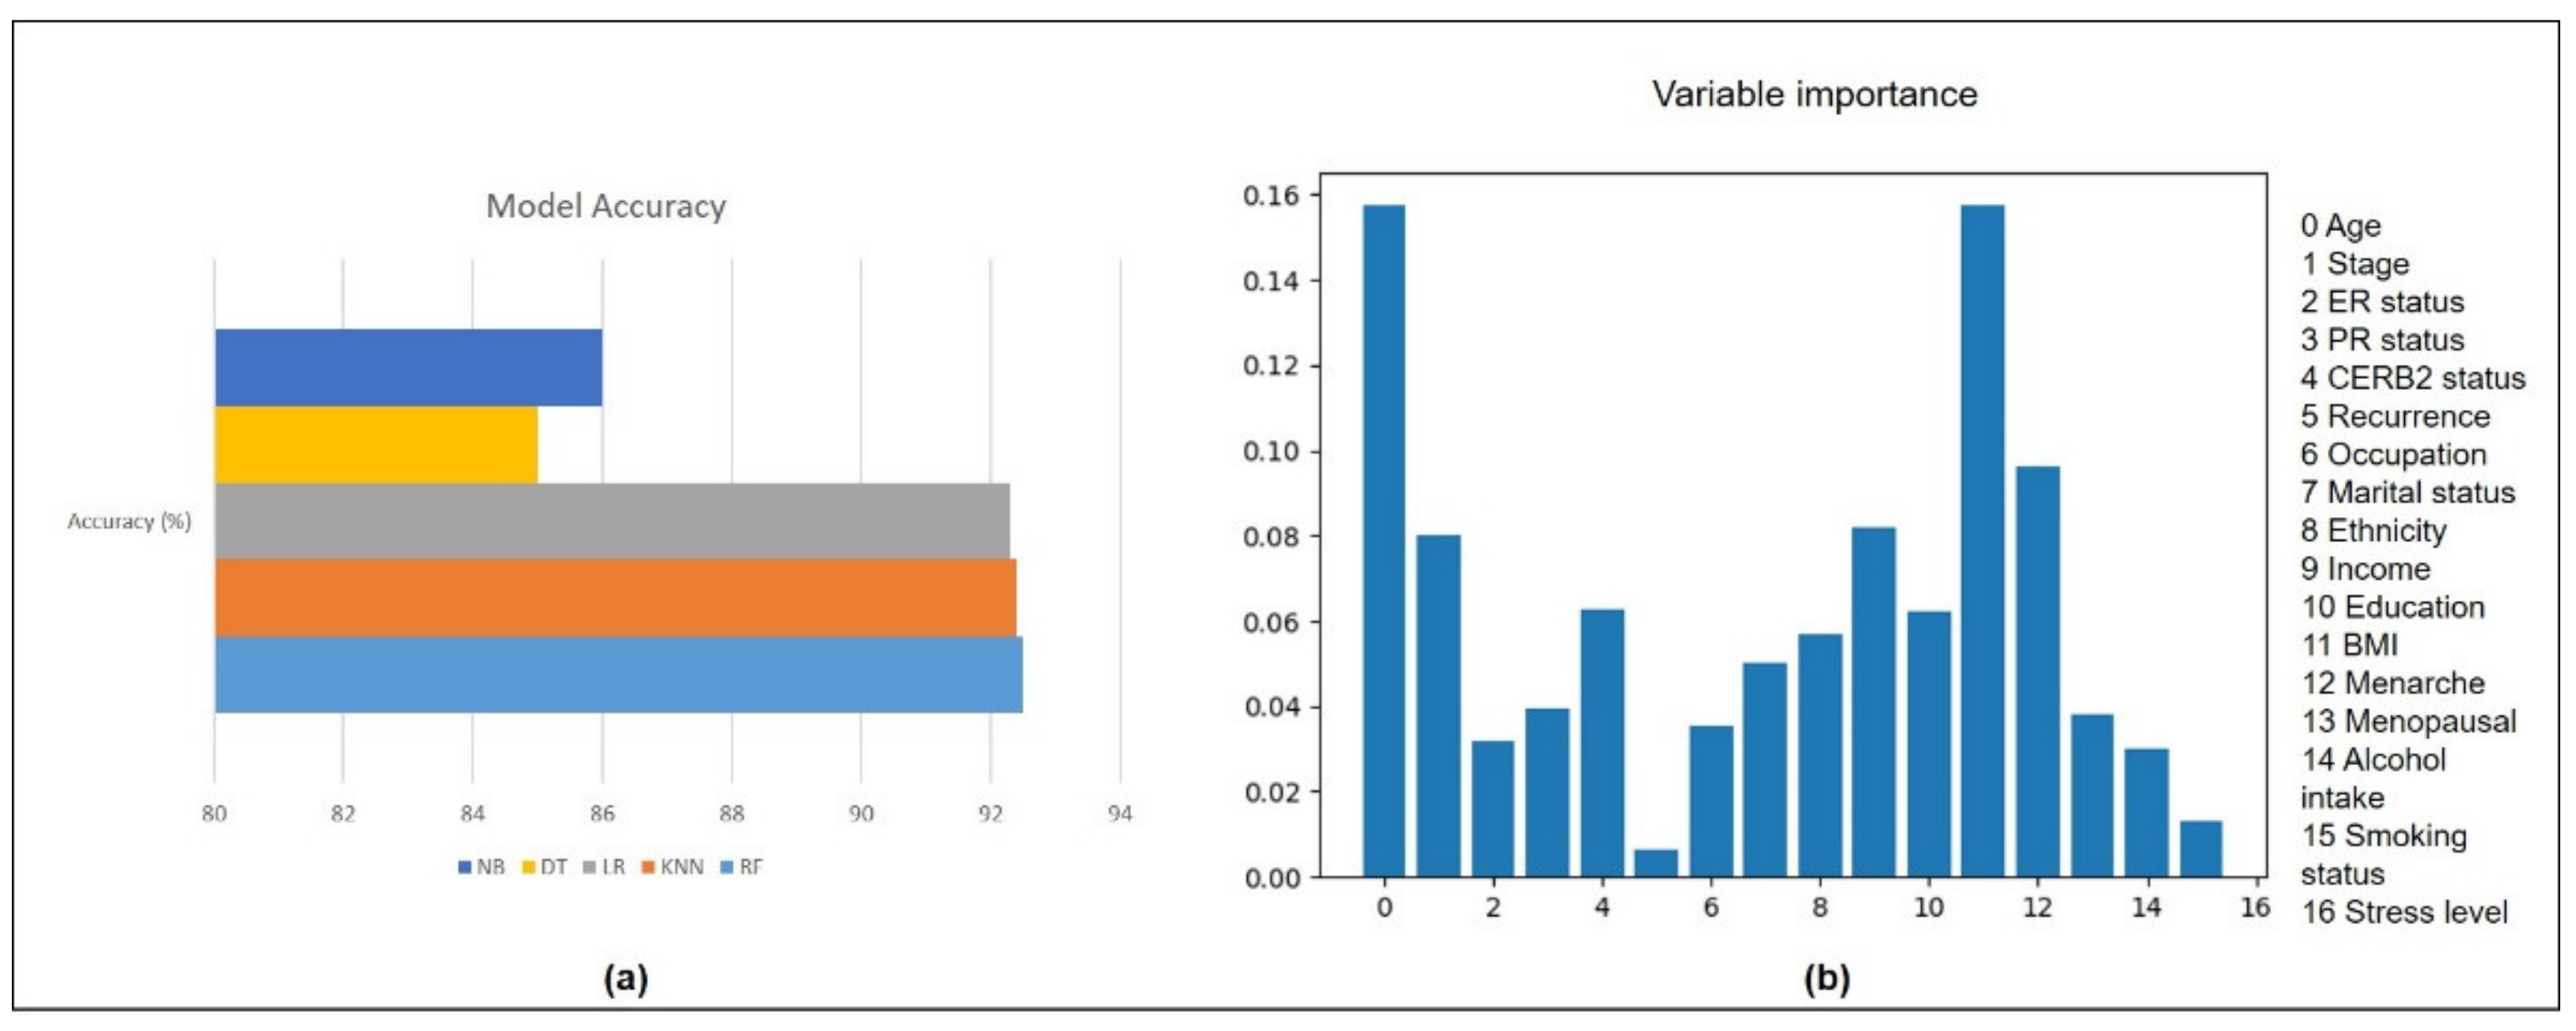
3.2. Automated Machine Learning in iSurvive
3.3. Automated Quality of Life Scoring in iSurvive
3.4. Interactive Visualizations
3.5. Download Module in iSurvive
4. Discussion
4.1. Comparison with Previous Studies and Signifcance of This Study
4.2. Future Works and Recommendation
5. Conclusions
Author Contributions
Funding
Institutional Review Board Statement
Informed Consent Statement
Data Availability Statement
Acknowledgments
Conflicts of Interest
Abbreviation
| Artificial Intelligence | AI |
| Body Mass Index | BMI |
| European Organisation for Research and Treatment of Cancer | EORTC |
| Malaysian Breast Cancer Survivorship Cohort | MyBCC |
| Relational Database Management System | RDMS |
| Quality of Life | QoL |
| Structured Query Language | SQL |
| University Malaya Medical Centre | UMMC |
References
- Bray, F.; Ferlay, J.; Soerjomataram, I.; Siegel, R.L.; Torre, L.A.; Jemal, A. Global cancer statistics 2018: GLOBOCAN estimates of incidence and mortality worldwide for 36 cancers in 185 countries. CA Cancer J. Clin. 2018, 68, 394–424. [Google Scholar] [CrossRef] [PubMed]
- Jensen, M.B.; Ejlertsen, B.; Mouridsen, H.T.; Christiansen, P. Improvements in breast cancer survival between 1995 and 2012 in Denmark: The importance of earlier diagnosis and adjuvant treatment. Acta Oncol. 2016, 55, 24–35. [Google Scholar] [CrossRef] [PubMed]
- Choudhury, A.; Asan, O.; Mansouri, M. Role of Artificial Intelligence, Clinicians & Policymakers in Clinical Decision Making: A Systems Viewpoint. In Proceedings of the 2019 International Symposium on Systems Engineering (ISSE), Edinburgh, UK, 1–3 October 2019. [Google Scholar]
- Tresp, V.; Overhage, J.M.; Bundschus, M.; Rabizadeh, S.; Fasching, P.A.; Yu, S. Going Digital: A Survey on Digitalization and Large Scale Data Analytics in Healthcare. Proc. IEEE 2016, 104, 1–25. [Google Scholar] [CrossRef]
- Lamy, J.; Sekar, B.; Guezennec, G.; Bouaud, J.; Séroussi, B. Arti fi cial Intelligence In Medicine Explainable arti fi cial intelligence for breast cancer: A visual case-based reasoning approach. Artif. Intell. Med. 2019, 94, 42–53. [Google Scholar] [CrossRef]
- Denkert, C.; von Minckwitz, G.; Darb-Esfahani, S.; Lederer, B.; Heppner, B.I.; Weber, K.E.; Budczies, J.; Huober, J.; Klauschen, F.; Furlanetto, J.; et al. Tumour-infiltrating lymphocytes and prognosis in different subtypes of breast cancer: A pooled analysis of 3771 patients treated with neoadjuvant therapy. Lancet Oncol. 2018, 19, 40–50. [Google Scholar] [CrossRef]
- Maliniak, M.L.; Patel, A.V.; McCullough, M.L.; Campbell, P.T.; Leach, C.R.; Gapstur, S.M.; Gaudet, M.M. Obesity, physical activity, and breast cancer survival among older breast cancer survivors in the Cancer Prevention Study-II Nutrition Cohort. Breast Cancer Res. Treat. 2018, 167, 133–145. [Google Scholar] [CrossRef]
- Scruggs, S.; Mama, S.K.; Carmack, C.L.; Douglas, T.; Diamond, P.; Basen-Engquist, K. Randomized Trial of a Lifestyle Physical Activity Intervention for Breast Cancer Survivors: Effects on Transtheoretical Model Variables. Health Promot. Pract. 2018, 19, 134–144. [Google Scholar] [CrossRef]
- Islam, T.; Bhoo-pathy, N.; Su, T.T.; Majid, H.A.; Nahar, A.M.; Ng, C.G.; Dahlui, M.; Hussain, S.; Cantwell, M.; Murray, L.; et al. The Malaysian Breast Cancer Survivorship Cohort (MyBCC): A study protocol. BMJ Open 2015, 5, e008643. [Google Scholar] [CrossRef] [PubMed]
- Weaver, C.A.; Ball, M.J.; Kim, G.R.; Kiel, J.M. Healthcare Information Management Systems: Cases, Strategies, and Solutions, 4th ed.; Springer Science & Business Media: Berlin/Heidelberg, Germany, 2015; pp. 1–600. [Google Scholar]
- Kharya, S.; Agrawal, S.; Soni, S. Naive Bayes Classifiers: A Probabilistic Detection Model for Breast Cancer. Int. J. Comput. Appl. 2014, 92, 26–31. [Google Scholar] [CrossRef]
- Bar-Lev Schleider, L.; Mechoulam, R.; Lederman, V.; Hilou, M.; Lencovsky, O.; Betzalel, O.; Shbiro, L.; Novack, V. Prospective analysis of safety and efficacy of medical cannabis in large unselected population of patients with cancer. Eur. J. Intern. Med. 2018, 49, 37–43. [Google Scholar] [CrossRef] [PubMed]
- Liu, X.; Mao, Y.-H.; Wang, H.-T.; Chen, X.-G.; Zhao, B.; Sun, Y. Path Analysis on Medical Expenditures of 855 Patients with Chronic Kidney Disease in a Hospital in Beijing. Chin. Med. J. 2018, 131, 25. [Google Scholar] [CrossRef]
- Villegas-Ch, W.; Román-Cañizares, M.; Palacios-Pacheco, X. Improvement of an online education model with the integration of machine learning and data analysis in an LMS. Appl. Sci. 2020, 10, 5371. [Google Scholar] [CrossRef]
- Yamamoto, K.; Sumi, E.; Yamazaki, T.; Asai, K.; Yamori, M.; Teramukai, S.; Bessho, K.; Yokode, M.; Fukushima, M. A pragmatic method for electronic medical record-based observational studies: Developing an electronic medical records retrieval system for clinical research. BMJ Open 2012, 2, e001622. [Google Scholar] [CrossRef][Green Version]
- Leong, S.P.L.; Shen, Z.-Z.; Liu, T.-J.; Agarwal, G.; Tajima, T.; Paik, N.-S.; Sandelin, K.; Derossis, A.; Cody, H.; Foulkes, W.D. Is Breast Cancer the Same Disease in Asian and Western Countries? World J. Surg. 2010, 34, 2308–2324. [Google Scholar] [CrossRef]
- Yip, C.H.; Bhoo Pathy, N.; Uiterwaal, C.S.; Taib, N.A.; Tan, G.H.; Mun, K.S.; Choo, W.Y.; Rhodes, A. Factors affecting estrogen receptor status in a multiracial Asian country: An analysis of 3557 cases. Breast 2011, 20, S60–S64. [Google Scholar] [CrossRef]
- Schulze, V.; Lin, Y.; Karathanos, A.; Brockmeyer, M.; Zeus, T.; Polzin, A.; Perings, S.; Kelm, M.; Wolff, G. Patent foramen ovale closure or medical therapy for cryptogenic ischemic stroke: An updated meta-analysis of randomized controlled trials. Clin. Res. Cardiol. 2018, 107, 745–755. [Google Scholar] [CrossRef] [PubMed]
- Ganggayah, M.D.; Taib, N.A.; Har, Y.C.; Lio, P.; Dhillon, S.K. Predicting factors for survival of breast cancer patients using machine learning techniques. BMC Med. Inform. Decis. Mak. 2019, 4, 1–17. [Google Scholar] [CrossRef] [PubMed]
- Aaronson, N.K.; Ahmedzai, S.; Bergman, B.; Bullinger, M.; Cull, A.; Duez, N.J.; Filiberti, A.; Flechtner, H.; Fleishman, S.B.; de Haes, J.C.J.M.; et al. The European Organisation for Research and Treatment of Cancer QLQ-C30: A quality-of-life instrument for use in international clinical trials in oncology. J. Natl. Cancer Inst. 1993, 85, 365–376. [Google Scholar] [CrossRef] [PubMed]
- Genuer, R.; Poggi, J.-M.; Tuleau-Malot, C. VSURF: An R Package for Variable Selection Using Random Forests. R J. 2015, 7, 19–33. [Google Scholar] [CrossRef]
- Mosca, E.; Alfieri, R.; Merelli, I.; Viti, F.; Calabria, A.; Milanesi, L. Open Access DATABASE A multilevel data integration resource for breast cancer study. BMC Syst. Biol. 2010, 4, 1–11. [Google Scholar] [CrossRef]
- Lebedev, A.V.; Westman, E.; van Westen, G.J.P.; Kramberger, M.G.; Lundervold, A.; Aarsland, D.; Soininen, H.; Kłoszewska, I.; Mecocci, P.; Tsolaki, M.; et al. Random Forest ensembles for detection and prediction of Alzheimer’s disease with a good between-cohort robustness. NeuroImage Clin. 2014, 6, 115–125. [Google Scholar] [CrossRef] [PubMed]
- Mandelblatt, J. Descriptive Review of the Literature on Breast Cancer Outcomes: 1990 Through 2000. J. Natl. Cancer Inst. Monogr. 2004, 2004, 8–44. [Google Scholar] [CrossRef][Green Version]
- Tin Tin, S.; Elwood, J.M.; Brown, C.; Sarfati, D.; Campbell, I.; Scott, N.; Ramsaroop, R.; Seneviratne, S.; Harvey, V.; Lawrenson, R. Ethnic disparities in breast cancer survival in New Zealand: Which factors contribute? BMC Cancer 2018, 18, 1–10. [Google Scholar] [CrossRef] [PubMed]
- Wallwiener, M.; Matthies, L.; Simoes, E.; Keilmann, L.; Hartkopf, A.D.; Alexander, N.; Walter, C.B.; Sickenberger, N.; Wallwiener, S.; Feisst, M.; et al. Reliability of an e-PRO tool of EORTC QLQ-C30 for measurement of health-related quality of life in patients with breast cancer: Prospective randomized trial. J. Med. Internet Res. 2017, 19, e322. [Google Scholar] [CrossRef]
- Lo, L.L.; Hons, M.; Collins, I.M.; Bressel, M.; Butow, P.; Emery, J.; Keogh, L.; Weideman, P.; Hlthprom, G.; Steel, E.; et al. The iPrevent online breast cancer risk assessment and risk management tool: Usability and acceptability testing. JMIR Form. Res. 2018, 2, 1–11. [Google Scholar] [CrossRef]
- Baseman, J.; Revere, D.; Baldwin, L. A Mobile Breast Cancer Survivorship Care App: Pilot Study. JMIR Cancer 2017, 3, 1–10. [Google Scholar] [CrossRef] [PubMed]
- Ritvo, P.; Obadia, M.; Mina, D.S.; Alibhai, S.; Sabiston, C.; Oh, P.; Campbell, K.; Mccready, D.; Auger, L.; Michelle, J. Smartphone-Enabled Health Coaching Intervention (iMOVE) to Promote Long-Term Maintenance of Physical Activity in Breast Cancer Survivors: Protocol for a Feasibility Pilot Randomized Controlled Trial. JMIR Res. Protoc. 2017, 6, 1–16. [Google Scholar] [CrossRef]
- Zillner, S.; Hauer, T.; Rogulin, D.; Tsymbal, A.; Huber, M.; Solomonides, T.; Lane, C.; Bs, B.; Ag, D.S. Semantic Visualization of Patient Information. In Proceedings of the 2008 21st IEEE International Symposium on Computer-Based Medical Systems, Jyvaskyla, Finland, 17–19 June 2008; pp. 296–301. [Google Scholar]
- Bergqvist, J.; Strang, P. Breast Cancer Patients’ Preferences for Truth Versus Hope Are Dynamic and Change During Late Lines of Palliative Chemotherapy. J. Pain Symptom Manag. 2019, 57, 746–752. [Google Scholar] [CrossRef]


| Scale | Number of Questions | Range | Questions Numbers | |
|---|---|---|---|---|
| Global health status/QoL | ||||
| Global health status/QoL (revised) † | QL2 | 2 | 6 | 29, 30 |
| Functional scales | ||||
| Physical functioning (revised) † | PF2 | 5 | 3 | 1 to 5 |
| Role functioning (revised) † | RF2 | 2 | 3 | 6, 7 |
| Emotional functioning | EF | 4 | 3 | 21 to 24 |
| Cognitive functioning | CF | 2 | 3 | 20, 25 |
| Social functioning | SF | 2 | 3 | 26, 27 |
| Symptom scales/items | ||||
| Fatigue | FA | 3 | 3 | 10, 12, 18 |
| Nausea and vomiting | NV | 2 | 3 | 14, 15 |
| Pain | PA | 2 | 3 | 9, 19 |
| Dyspnoea | DY | 1 | 3 | 8 |
| Insomnia | SL | 1 | 3 | 11 |
| Appetite loss | AP | 1 | 3 | 13 |
| Constipation | CO | 1 | 3 | 16 |
| Diarrhoea | DI | 1 | 3 | 17 |
| Financial difficulties | FI | 1 | 3 | 28 |
| Scale | Number of Questions | Range | Question Numbers | |
|---|---|---|---|---|
| Functional scales | ||||
| Body image | BRBI | 4 | 3 | 9–12 |
| Sexual functioning † | BRSEF | 2 | 3 | 14, 15 |
| Sexual enjoyment † | BRSEE | 1 | 3 | 16 |
| Future perspective | BRFU | 1 | 3 | 13 |
| Symptom scales/items | ||||
| Systemic therapy side effects | BRST | 7 | 3 | 1–4, 6, 7, 8 |
| Breast symptoms | BRBS | 4 | 3 | 20–23 |
| Arm symptoms | BRAS | 3 | 3 | 17, 18, 19 |
| Upset by hair loss | BRHL | 1 | 3 | 5 |
Publisher’s Note: MDPI stays neutral with regard to jurisdictional claims in published maps and institutional affiliations. |
© 2021 by the authors. Licensee MDPI, Basel, Switzerland. This article is an open access article distributed under the terms and conditions of the Creative Commons Attribution (CC BY) license (https://creativecommons.org/licenses/by/4.0/).
Share and Cite
Ganggayah, M.D.; Dhillon, S.K.; Islam, T.; Kalhor, F.; Chiang, T.C.; Kalafi, E.Y.; Taib, N.A. An Artificial Intelligence-Enabled Pipeline for Medical Domain: Malaysian Breast Cancer Survivorship Cohort as a Case Study. Diagnostics 2021, 11, 1492. https://doi.org/10.3390/diagnostics11081492
Ganggayah MD, Dhillon SK, Islam T, Kalhor F, Chiang TC, Kalafi EY, Taib NA. An Artificial Intelligence-Enabled Pipeline for Medical Domain: Malaysian Breast Cancer Survivorship Cohort as a Case Study. Diagnostics. 2021; 11(8):1492. https://doi.org/10.3390/diagnostics11081492
Chicago/Turabian StyleGanggayah, Mogana Darshini, Sarinder Kaur Dhillon, Tania Islam, Foad Kalhor, Teh Chean Chiang, Elham Yousef Kalafi, and Nur Aishah Taib. 2021. "An Artificial Intelligence-Enabled Pipeline for Medical Domain: Malaysian Breast Cancer Survivorship Cohort as a Case Study" Diagnostics 11, no. 8: 1492. https://doi.org/10.3390/diagnostics11081492
APA StyleGanggayah, M. D., Dhillon, S. K., Islam, T., Kalhor, F., Chiang, T. C., Kalafi, E. Y., & Taib, N. A. (2021). An Artificial Intelligence-Enabled Pipeline for Medical Domain: Malaysian Breast Cancer Survivorship Cohort as a Case Study. Diagnostics, 11(8), 1492. https://doi.org/10.3390/diagnostics11081492