Abstract
Background: Pyogenic vertebral osteomyelitis (PVO) is a bacterial infection involving the intervertebral disc, vertebral body, and paravertebral soft tissues. Damaged intervertebral structure is a major cause of persistent back pain even after successful antibiotic therapy, which can be improved by achieving autofusion or via additional surgical fixation. In this study, we analyzed the clinical and radiological features predicting intervertebral autofusion after successful antibiotic therapy in lumbar PVO. Methods: This study was retrospectively conducted with 32 patients (20 men and 12 women) diagnosed with lumbar PVO that was completely cured with no recurrences after antibiotic therapy. They were divided into two groups with (group A, n = 18) and without (group B, n = 14) intervertebral autofusion at six-month follow-up. Differences in back pain, blood inflammatory markers, and radiological features of PVO on simultaneous 18F-fluorodeoxyglucose positron emission tomography/magnetic resonance imaging (18F-FDG-PET/MRI) of the intervertebral structure between the two groups were analyzed. Results: The mean duration of antibiotic therapy was 41.44 ± 14.21 (21–89) days. Group A showed a statistically higher erythrocyte sedimentation ratio (ESR; 59.28 ± 32.33 vs. 33.93 ± 18.76 mm/h, p = 0.014; normal range of ESR < 25), maximum standardized 18F-FDG uptake (SUVmax; 5.56 ± 1.86 vs. 3.98 ± 1.40, p = 0.013), and sustained extensive edematous changes on T2-weighted fat saturation (T2FS) MRI (p = 0.015) immediately after successful antibiotic therapy. However, no significant differences were observed in back pain, C-reactive protein, or the distribution of 18F-FDG uptake/contrast enhancement on 18F-FDG-PET/MRI (p > 0.05). Conclusions: Higher ESR and SUVmax of the intervertebral structure and sustained extensive edematous change on T2FS MRI immediately after successful antibiotic therapy are related with subsequent intervertebral autofusion, which should be carefully considered when assessing therapeutic response in PVO.
1. Introduction
Pyogenic vertebral osteomyelitis (PVO) is a bacterial infection involving the spine and adjacent structures [1]. PVO shows non-specific symptoms, which are not necessarily accompanied with a fever. In addition, the imaging findings do not always correlate with symptoms [2,3,4,5]. Moreover, the causative bacteria are not identified in approximately 50% of patients with PVO. Hence, they are usually treated with an average of about six weeks of empirical parenteral antibiotics [2,6]. Unfortunately, no clear treatment guidelines have been established because of the regional variability of causative microorganisms and resistance to antibiotics [7]. The therapeutic response to antibiotic therapy for PVO has been assessed based on clinical symptoms and blood inflammatory markers. However, clinical symptoms can vary between individuals, and blood inflammatory markers, including erythrocyte sedimentation ratio (ESR) and C-reactive protein (CRP), are easily affected by the other physical conditions [4]. In addition, magnetic resonance imaging (MRI), recognized as the best imaging modality for spinal disease, is not helpful in determining therapeutic response of PVO. MRI cannot accurately distinguish the residual PVO lesions from the structural damage or the tissues restored after successful antibiotic therapy [8].
Recently, it has been reported that simultaneous 18F-fluorodeoxyglucose positron emission tomography (18F-FDG-PET) can be used to determine therapeutic response in spinal infections. 18F-FDG-PET is less affected by other physical conditions and shows more objective results compared with blood inflammatory markers [9]. Several studies have shown a higher diagnostic accuracy in detecting residual infectious lesion by measuring the degree of 18F-FDG uptake on 18F-FDG-PET than by using CRP and MRI [9,10,11]. In addition, Jeon et al. [5] reported differences between the degree of 18F-FDG uptake and clinical symptoms in patients with cured PVO depending on the site of major structural damage. Therefore, additional studies are required to assess therapeutic response more accurately. PVO mainly destroys the intervertebral structure, which can become unstable and result in sustained back pain even after successful antibiotic therapy. Usually, the damaged intervertebral structures are stabilized with autofusion between the vertebrae; however, some patients showing sustained instability require additional surgical fixation.
In this study, we analyzed the clinical and radiological features identified at the time of discontinuation of antibiotic therapy as it relates to intervertebral autofusion at six-month follow-up for patients with cured PVO.
2. Materials and Methods
2.1. Patients and Data Collection
This retrospective study included 61 patients (37 men and 24 women) with lumbar PVO. It was conducted using prospectively collected clinical and radiological data from February 2017 to September 2020 in a single tertiary hospital. Diagnosis of lumbar PVO was made mainly based on the clinical symptoms (including fever, back pain, or neurological signs) and specific MRI findings with a contiguous single PVO lesion; the diagnosis was not dependent on the causative microorganism identified from PVO lesion or blood cultures. Patients with tuberculous vertebral osteomyelitis, tumor, bone infection other than the PVO, trauma, concomitant severe medical problems, spinal instrumentation or bone cement on the PVO lesion, recurrence of PVO within 6-month follow-up, pregnancy, or those < 20 years old were excluded. The PVO lesion comprised the upper and lower vertebrae centering on the infected disc with or without involving paraspinal muscle; such lesions were defined as single level PVO [10]. Those comprising three vertebrae involving two infected discs were defined as two levels of PVO.
All patients provided voluntary written informed consent for performing additional simultaneous 18F-FDG-PET/MRI during the clinical assessment for assessing therapeutic response. The entire study and the analysis of clinical and radiological data were conducted under the approval of the institutional review board (Yeungnam University Hospital, 2016-12-019-013, and 22 December 2016).
2.2. Clinical Assessment
All patients underwent clinical assessments for therapeutic response based on the clinical symptoms and blood inflammatory markers after conducting parenteral antibiotic therapy for at least 3 weeks. The parenteral antibiotics to be used were selected after consulting infectious disease physicians. Back pain was measured using visual analog scale (VAS) with 0 representing no pain to 10 representing maximum pain. ESR (normal range of <25 mm/h) and CRP (normal range of <0.5 mg/dL) were used as the blood inflammatory markers.
Cure was defined as improved clinical symptoms with no fever and normalized CRP for at least six months after the discontinuation of parenteral antibiotic therapy. Recurrence was defined as re-developing clinical symptoms with/without fever, re-elevation of CRP, or newly identified or aggravated PVO on MRI within six months of follow-up period.
2.3. Radiological Criteria of Intervertebral Autofusion
The intervertebral fusion was determined based on the criteria presented by Lee et al. [12]:
- (1)
- Definitive fusion: Definitive bony trabecular bridging across the graft/host interface, no motion (less than 3°) on flexion–extension radiographs, and no gap at the interface.
- (2)
- Probable fusion: No definitive bony trabecular crossing, no detectable motion, and no identifiable gap at the interface.
- (3)
- Possible pseudoarthrosis: No bony trabecular crossing, no motion, but an identifiable gap at the interface.
- (4)
- Definite pseudoarthrosis: No traversing trabecular bone, definitive gap, and motion greater than 3°.
We categorized the patients into two groups depending on the intervertebral autofusion at six-month follow-up. Group A, which included above categories 1 and/or 2, was defined as intervertebral autofusion, while group B, which included above categories 3 and/or 4, was defined as no intervertebral autofusion.
2.4. Radiological Assessment of 18F-FDG-PET/MRI
In the patients with cured PVO and no recurrence, 18F-FDG-PET/MRIs obtained when parenteral antibiotic therapy was discontinued were included in this study. Two physicians with ≥10 years of experience in nuclear medicine analyzed the imaging data obtained from 18F-FDG-PET/MRI independently with information about the clinical status of the patients.
2.4.1. Intensity of 18F-FDG Uptake on the Intervertebral Structure of Cured PVO Lesion
The maximum standardized 18F-FDG uptake value (SUVmax) on the intervertebral structures, including the disc and endplates of the PVO lesion, was evaluated on 18F-FDG-PET/MRI. The vertebral endplates are thin structures located above and below the ends of the intervertebral disc and mechanical interface between the vertebral body and the intervertebral disc made of osseous and cartilaginous components [13,14]. The SUVmax values were determined using a computerized imaging system, and the difference in the SUVmax values between the two groups was analyzed.
2.4.2. Distribution Patterns of 18F-FDG Uptake, Contrast Enhancement, and Edematous Change on 18F-FDG-PET/MRI of Cured PVO Lesion
The distribution pattern of 18F-FDG uptake on 18F-FDG-PET, contrast enhancement on T1-weighted contrast (T1C) MRI, and high signal intensity implying edematous changes on T2-weighted fat saturation (T2FS) MRI in the PVO lesion were interpreted based on the criteria presented by Yu et al. [4]. In case of any disagreement on the distribution pattern between the two nuclear medicine physicians, the final decision was reached after a discussion. The distribution patterns were graded as follows.
- (1)
- Grade I: Activities on the overall vertebral body, paravertebral soft tissue/muscle, and epidural space with lower or similar intensity compared to the normal region.
- (2)
- Grade II: Limited activities on the margin or bulk of a destroyed disc/endplate rather than the vertebral body, paravertebral soft tissue/muscle, and epidural space with higher intensity than the normal region.
- (3)
- Grade III: Significantly increased activities compared to the normal region on the overall vertebral body, paravertebral soft tissue/muscle, and epidural space.
2.5. Data Acquisition of PET/MRI
Prior to injecting FDG (3.7 MBq/kg) to perform simultaneous 18F-FDG-PET/MRI (Biograph mMR; Siemens Healthcare, Erlangen, Germany), the patients were asked to fast for at least 6 h and their blood glucose levels were maintained at <8.9 mmol/L. Data acquisition of 18F-FDG-PET/MRI was initiated 60 min after the injection of FDG. The patient was placed and scanned in one–two bed positions under the approved surface coil. Data acquisition of 18F-FDG-PET was performed for >20 min; the MRI data were simultaneously acquired using a preset sequence protocol [10].
2.6. Statistical Analysis
A Chi-squared test was performed to assess the relationship between the categorical variables. Student’s t-test for parametric continuous variables and Mann–Whitney U test for non-parametric continuous variables were used to compare the two population means. Statistical analyses were performed with SPSS version 25.0 (SPSS Inc., Chicago, IL, USA); p values < 0.05 were considered statistically significant.
3. Results
3.1. Demographic and Clinical Data
Among the 61 patients, 29 were excluded because of the follow-up loss (n = 2), bone infection other than the PVO (n = 1), concomitant severe medical problems (n = 3), spinal instrumentation or bone cement on the PVO lesion (n = 7), recurrence during the follow-up period (n = 2), and no radiography at 6-month follow-up (n = 14). The final analyses were performed on 32 patients (20 men and 12 women) with a mean age of 69.25 ± 10.20 (50–85) years. They were divided into two groups depending on whether autofusion was noted at six-month follow-up radiographs (18 of group A: intervertebral autofusion, 14 of group B: no intervertebral autofusion). No statistically significant differences were noted for age, sex, initial extent of PVO, initial involvement of PVO, and initial clinical symptoms between the two groups (p > 0.05). The cause of PVO was identified as spontaneous and procedure-related in 43.7% (14/32) and 56.3% (18/32) of the patients, respectively (p > 0.05). The mean follow-up period was 12.84 ± 6.98 (6–35) months. Detailed data are presented in Table 1.

Table 1.
Demographic and clinical data of 32 patients.
3.2. Microorganisms and Antibiotics
The identification rate of causative microorganism was 40.6% (13/32) in blood or tissue culture. Culture for PVO lesion was the major route to identify the causative microorganism (61.5%, 8/13). Methicillin-sensitive Staphylococcus aureus (MSSA) was the main causative microorganism (38.5%, 5/13). The mean duration of the parenteral antibiotic therapy was 41.44 ± 14.21 (21–89) days. Group A showed a statistically significant longer duration of parenteral antibiotic therapy compared with group B (45.94 ± 16.09 vs. 35.64 ± 8.86 days, p = 0.040). Detailed data are presented in Table 2.
Table 2.
Microorganisms and antibiotics.
3.3. Clinical Features
Blood inflammatory markers including ESR and CRP were measured at initial diagnosis and discontinuation of antibiotic therapy, respectively. CRP showed no statistically significant difference at initial diagnosis (8.97 ± 7.91 vs. 8.79 ± 9.31 mg/dL, p = 0.722) and discontinuation of antibiotic therapy (0.85 ± 1.14 vs. 0.73 ± 0.78 mg/dL, p = 0.635) between the two groups, respectively. However, group A showed statistically significant higher ESR compared with that shown by group B at initial diagnosis (74.67 ± 23.57 vs. 50.21 ± 29.94 mm/h, p = 0.015) and discontinuation of antibiotic therapy (59.28 ± 32.33 vs. 33.93 ± 18.76 mm/h, p = 0.014). Back pain was measured using VAS at initial diagnosis and discontinuation of antibiotic therapy. No statistically significant difference was observed at initial diagnosis (7.94 ± 0.64 vs. 7.79 ± 1.31, p = 0.985) and discontinuation of antibiotic therapy (4.39 ± 0.92 vs. 4.29 ± 1.14, p = 0.955) between the two groups. Detailed data are presented in Table 3.
Table 3.
Comparison of clinical and radiological features between groups A and B.
3.4. Radiological Features
The locations of SUVmax on 18F-FDG-PET were identified as 26 on intervertebral structures and 6 on vertebral bodies/paraspinal muscles. No statistically significant difference was noted in the location of SUVmax between the two groups. The mean SUVmax of intervertebral structure was 4.87 ± 1.83 (2.10–10.51) in all patients. The difference in the mean SUVmax values of the two groups was statistically significant (5.56 ± 1.86 vs. 3.98 ± 1.40, p = 0.013). Detailed data are presented in Table 3.
The distribution patterns of the 18F-FDG uptake on 18F-FDG-PET, contrast enhancement on T1C MRI, and high signal intensity on T2FS MRI in the PVO lesions of all patients were examined. There were 18 of grade II and 14 of grade III on 18F-FDG-PET; 4 of grade II and 28 of grade III on T1C MRI; and 9 of grade II and 23 of grade III on T2FS MRI. A statistically significant difference was noted in the distribution pattern of high signal intensity on T2FS MRI between the two groups (p = 0.015). However, no statistically significant difference was observed in the distribution patterns of the 18F-FDG uptake on 18F-FDG-PET (p = 0.419) and contrast enhancement on T1C MRI (p = 0.178). Detailed data are presented in Table 4.
Table 4.
Distribution patterns of 18F-FDG uptake on 18F-FDG-PET, contrast enhancement on T1C, and high signal intensity on T2FS.
4. Discussion
Jeon et al. [10] reported the usefulness of 18F-FDG-PET for assessing the therapeutic response in PVO. They observed that 18F-FDG-PET showed better diagnostic accuracy for detecting residual lesions than CRP or MRI. They also showed that the combination of FDG-PET and CRP can be the best modality. 18F-FDG-PET is based on the 18F-FDG uptake by the activated inflammatory cells consuming a large amount of glucose during phagocytoses. Conversely, the 18F-FDG uptake can decrease because of the disappearance of activated inflammatory cells after successful antibiotic therapy. The 18F-FDG uptake on the PVO lesion is less affected by other conditions and can be used as an independent modality for assessing the therapeutic response in PVO [15,16,17]. In the distribution pattern of the 18F-FDG uptake on the PVO lesion, the cured PVO lesion shows that the 18F-FDG uptake is limited to the intervertebral structure in contrast to the extensive distribution of the 18F-FDG uptake observed in the non-cured PVO lesion [5,10]. However, the clinical and radiological features of the cured PVO vary depending on the location of the major structural damage of the PVO lesion. When an intervertebral structure is involved, it may lead to more severe back pain and a higher CRP than those involved in vertebral body/paravertebral muscle, showing favorable clinical features despite more advanced structural damage with a higher 18F-FDG uptake [5]. These findings may be helpful for assessing the therapeutic response in patients with PVO presenting various structural damages and clinical symptoms.
Back pain caused by the destruction of intervertebral discs and endplates may continue during the post-treatment course of PVO even after successful antibiotic therapy. Although some PVO lesions presenting back pain related with sustained instability may require additional fusion surgery, this study showed that most PVO lesions were stabilized with intervertebral autofusion or maintained joint function without any instability after successful antibiotic therapy. At 6-month follow-up, intervertebral autofusion was achieved in 59.3% of patients, and instability was identified in only 6.2% (2/32) of patients. However, there is still insufficient literature on the rate of autofusion or instability requiring surgical treatment. In this study, 14 patients were excluded because of insufficient radiological data at six-month follow-up, which can be a major limitation in obtaining higher levels of evidence; however, no patient was treated with additional fusion surgery. Hence, we can suggest that a large portion of intervertebral damage caused by PVO can be treated with intervertebral autofusion or preserved as an intervertebral joint after successful antibiotic therapy. Compared to group B with no intervertebral autofusion at six-month follow-up, group A with intervertebral autofusion showed more extensive edematous changes to vertebral bodies and a higher 18F-FDG uptake on the intervertebral structure immediately after antibiotic therapy (Figure 1 and Figure 2).
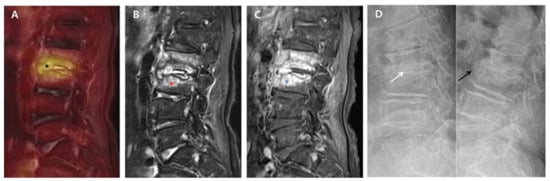
Figure 1.
18F-FDG-PET/MRI immediately after successful antibiotic therapy and radiographs at six-month follow-up in a patient with autofusion (group A). A 78-year-old female patient shows PVO of L2–3 on 18F-FDG-PET/MRI with SUVmax 5.03 of the intervertebral structure (black asterisk) after 56 days of ceftriaxone (ESR 71 mm/h and CRP 0.67 mg/dL). In the distribution pattern of the PVO lesion, 18F-FDG uptake (black asterisk) on 18F-FDG-PET (A) is limited on the damaged disc and endplates (grade II). However, T2FS MRI (B) and T1C MRI (C) show significantly increased high signal intensity (red asterisk) and contrast enhancement (blue asterisk) on the overall PVO lesion (grade III), respectively. On the dynamic radiographs at six-month follow-up (D), stable intervertebral structure presenting with the formation of syndesmophyte (black arrow) is noted with no intervertebral gap (white arrow). 18. F-FDG-PET/MRI, 18F-fluorodeoxyglucose positron emission tomography/magnetic resonance imaging; SUVmax, maximum standardized 18F-FDG uptake value; PVO, pyogenic vertebral osteomyelitis; CRP, C-reactive protein (normal range of < 0.5 mg/dL); ESR, erythrocyte sedimentation rate (normal range of <25 mm/h); T2FS, T2-weighted fat saturation; T1C, T1-weighted contrast; MRI, magnetic resonance imaging.
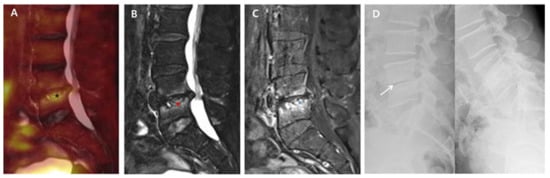
Figure 2.
18F-FDG-PET/MRI immediately after successful antibiotic therapy and radiographs at six-month follow-up in a patient with no autofusion (group B). A 73-year-old male patient shows PVO of L4–5 on 18F-FDG-PET/MRI with SUVmax 3.83 of the intervertebral structure (black asterisk) after 56 days of ceftriaxone (ESR 37 mm/h and CRP 0.16 mg/dL). In the distribution pattern of the PVO lesion, 18F-FDG uptake (black asterisk) on 18F-FDG-PET (A), high signal intensity (red asterisk) on T2FS MRI (B), and contrast enhancement (black asterisk) on T1C MRI (C) are limited around the destroyed disc and endplates rather than the bone and soft tissue with almost improved discitis (grade II). The dynamic radiographs at six-month follow-up (D) show an unstable intervertebral structure presenting with an intervertebral gap (white arrow), and there is no definite formation of syndesmophyte. 18. F-FDG-PET/MRI, 18F-fluorodeoxyglucose positron emission tomography/magnetic resonance imaging; SUVmax, maximum standardized 18F-FDG uptake value; PVO, pyogenic vertebral osteomyelitis; CRP, C-reactive protein (normal range of <0.5 mg/dL); ESR, erythrocyte sedimentation rate (normal range of <25 mm/h); T2FS, T2-weighted fat saturation; T1C, T1-weighted contrast; MRI, magnetic resonance imaging.
We investigated pathophysiological characteristics related to the specific radiological features identified in group A. The 18F-FDG uptake in a vertebral fracture has been reported previously. He et al. [18] reported SUVmax of 1.7–4.9 with a mean value of 2.9 ± 1.0 in 18 benign vertebral compression fractures. A benign fracture may continue to show 18F-FDG uptake up to six weeks after the fracture. Additionally, there may be significant differences in the duration and intensity of 18F-FDG uptake depending on the fracture site and severity [19]. However, Jeon et al. [5] have reported sustained elevation of 18F-FDG uptake (SUVmax 4.34 ± 1.24) in the intervertebral structure of PVO immediately after successful antibiotic therapy with a mean duration of approximately 40 days. This phenomenon was observed mainly because of the formation of vascular structures and chronic inflammation presenting as part of the healing process of the destroyed structures after acute inflammation against infection [8,9]. In addition, we believe that the degree of structural damage caused by PVO is greater than that observed in a benign fracture, which may account for the higher 18F-FDG uptake in PVO. Increased 18F-FDG uptake on the intervertebral structure is also correlated with the occurrence and magnitude of endplate subsidence [20]. Suto et al. [21] reported that a higher 18F-FDG uptake and ESR are related to the disease activity and severity of joint destruction in rheumatoid arthritis. We noted higher 18F-FDG uptake in group A than in group B because of the profound damage of the intervertebral structure at initial diagnosis and aggravation during the treatment period. In particular, a higher ESR at initial diagnosis in group A supports the presence of more severe structural destruction at initial diagnosis than that in group B.
Intervertebral autofusion observed in group A is usually characterized by the formation of syndesmophytes at the anterior portion of intervertebral structure as in ankylosing spondylitis (AS). Although AS is not directly comparable with PVO because of their different developmental origin, AS can help in understanding the radiological features of group A because a large number of patients with AS show preceding bone marrow edema before the formation of syndesmophytes. Current studies suggest that spinal inflammation caused by tissue repair may further stimulate syndesmophyte formation or calcification [22,23]. In AS, the bridging of the intervertebral space by bony spurs or osteophytes, which emerge from the periosteum close to the joint or intervertebral space, is based on endochondral ossification. This phenomenon can cause the deposition of the chondrogenic matrix, followed by remodeling into bone, and may present a type of joint repair strategy [24]. Stress on the joint may be responsible for the formation of osteophytes; both mechanical and inflammatory stress can precipitate their formation. Formation of osteophytes can be interpreted as an attempt by the body to repair or stabilize and reduce motion in the affected joint via bone ankylosis and complete stabilization of the joint [24]. Based on the preceding bone marrow edema and subsequent ankylosis in AS, the greater mechanical and inflammatory stress in PVO compared with that in AS, which was particularly evident in group A, may lead to extensive bone marrow edema and bone bridging in a relatively short period.
The severity of damage on the intervertebral structure depends on the destructive status at initial diagnosis and its aggravation during the treatment period. MRI can reveal structural damage in the form of increased water signals, which are associated with inflammatory edema and correlated with the histopathological grading of inflammation [25,26]. Even after successful antibiotic therapy, the damaged intervertebral structure of the cured PVO is under the inflammatory repair process and exposed to mechanical stress by patient activities, which present as sustained bone marrow edema and elevated 18F-FDG uptake on the intervertebral structure and vertebral bodies. These issues may vary depending on the severity of structural damage and the activity of the repair processes. Therefore, extensive bone marrow edema, which can also be presented as grade III and higher 18F-FDG uptake on the intervertebral structure, were more frequent in group A than in group B. We believe that the higher ESR immediately after successful antibiotic therapy in group A is also responsible for the sustained elevation of 18F-FDG and extensive bone marrow edema. These features (sustained elevation of ESR, extensive edematous changes, and higher 18F-FDG uptake in the cured PVO) are suggestive of intervertebral autofusion. Therefore, it is important not to diagnose these features as a false-positive related to residual PVO in the assessment of therapeutic response.
In this study, we used 18F-FDG-PET/MRI for assessing the therapeutic response in PVO and attempted to identify the factors responsible for intervertebral autofusion based on the clinical and radiological features of the cured PVO. Although our study is a novel attempt using 18F-FDG-PET/MRI, it has some limitations as well. First, to date, 18F-fluoride-PET imaging is used as an indicator of osteoblastic activity, which can be more useful than 18F-FDG-PET to assess fracture healing [27]. However, we evaluated autofusion using 18F-FDG-PET, which was taken while assessing the therapeutic response in PVO, because it is effective and inevitable for assessing such therapeutic response. Second, we used radiographs to identify intervertebral autofusion and stabilization at six-month follow-up. However, computed tomography (CT) scans can afford more accurate imaging to identify the bone structure, which is a more useful modality to evaluate intervertebral fusion. Further studies with 18F-fluoride-PET and CT scan under a prospective study design with a large number of participants are required to identify the exact status of intervertebral autofusion after successful antibiotic therapy in PVO.
5. Conclusions
Clinical and radiological features of the cured PVO vary immediately after successful antibiotic therapy. Sustained elevation of ESR, extensive edematous changes on T2FS MRI, and higher 18F-FDG uptake on 18F-FDG-PET in the cured PVO imply intervertebral autofusion as the stabilizing process of the damaged intervertebral structure, which may be helpful for assessing therapeutic response in PVO.
Author Contributions
I.S. was the assistant clinician for the study process, collected and curated the data, and wrote the manuscript. I.J. was the principal clinician for the entire study design and process and edited the manuscript. E.K. investigated and treated the aspects of nuclear medicine and data collection. All authors have read and agreed to the published version of the manuscript.
Funding
This work was supported by the National Research Foundation of Korea (NRF) grant funded by the Korea government (MSIP; Ministry of Science, ICT & Future Plan (NRF-2019M3E5D1A02068142), which was involved in the design of the study and collection, analysis, and interpretation of data as well as the manuscript.
Institutional Review Board Statement
This study was conducted according to the guidelines of the Declaration of Helsinki, and approved by the Institutional Review Board (Yeungnam University Hospital, 2016-12-019-013, and 22 December 2016).
Informed Consent Statement
Voluntary written informed consents for participating in this study and performing simultaneous 18F-FDG-PET/MRI were obtained from all patients.
Data Availability Statement
The datasets acquired and analyzed during the current study are available from the corresponding author on the reasonable request.
Acknowledgments
Not applicable.
Conflicts of Interest
The authors declare no conflict of interest.
References
- Colmenero, J.D.; Jimenez-Mejias, M.E.; Sanchez-Lora, F.J.; Reguera, J.M.; Palomino-Nicas, J.; Martos, F.; de las Heras, J.G.; Pachon, J. Pyogenic, tuberculous, and brucellar vertebral osteomyelitis: A descriptive and comparative study of 219 cases. Ann. Rheum. Dis. 1997, 56, 709–715. [Google Scholar] [CrossRef] [PubMed]
- Berbari, E.F.; Kanj, S.S.; Kowalski, T.J.; Darouiche, R.O.; Widmer, A.F.; Schmitt, S.K.; Hendershot, E.F.; Holtom, P.D.; Huddleston, P.M., 3rd; Petermann, G.W.; et al. 2015 infectious diseases society of america (IDSA) clinical practice guidelines for the diagnosis and treatment of native vertebral osteomyelitis in adultsa. Clin. Infect. Dis. 2015, 61, e26–e46. [Google Scholar] [CrossRef] [PubMed] [Green Version]
- Perronne, C.; Saba, J.; Behloul, Z.; Salmon-Ceron, D.; Leport, C.; Vilde, J.L.; Kahn, M.F. Pyogenic and tuberculous spondylodiskitis (vertebral osteomyelitis) in 80 adult patients. Clin. Infect. Dis. 1994, 19, 746–750. [Google Scholar] [CrossRef]
- Yu, G.J.; Koslowsky, I.L.; Riccio, S.A.; Chu, A.K.M.; Rabin, H.R.; Kloiber, R. Diagnostic challenges in pyogenic spinal infection: An expanded role for FDG-PET/CT. Eur. J. Clin. Microbiol. Infect. Dis. 2018, 37, 501–509. [Google Scholar] [CrossRef] [PubMed]
- Jeon, I.; Kong, E.; Yu, D.; Hong, C.P. Clinical and radiological analysis of pyogenic vertebral osteomyelitis immediately after successful antimicrobial therapy: Considerations for assessing therapeutic response. Diagnostics 2020, 10, 861. [Google Scholar] [CrossRef]
- Zimmerli, W. Vertebral osteomyelitis. N. Engl. J. Med. 2010, 362, 1022–1029. [Google Scholar] [CrossRef]
- Kim, J.; Kim, Y.S.; Peck, K.R.; Kim, E.S.; Cho, S.Y.; Ha, Y.E.; Kang, C.I.; Chung, D.R.; Song, J.H. Outcome of culture-negative pyogenic vertebral osteomyelitis: Comparison with microbiologically confirmed pyogenic vertebral osteomyelitis. Semin. Arthritis Rheum. 2014, 44, 246–252. [Google Scholar] [CrossRef]
- Zarrouk, V.; Feydy, A.; Salles, F.; Dufour, V.; Guigui, P.; Redondo, A.; Fantin, B. Imaging does not predict the clinical outcome of bacterial vertebral osteomyelitis. Rheumatology 2007, 46, 292–295. [Google Scholar] [CrossRef] [Green Version]
- Nanni, C.; Boriani, L.; Salvadori, C.; Zamparini, E.; Rorato, G.; Ambrosini, V.; Gasbarrini, A.; Tumietto, F.; Cristini, F.; Scudeller, L.; et al. FDG PET/CT is useful for the interim evaluation of response to therapy in patients affected by haematogenous spondylodiscitis. Eur. J. Nucl. Med. Mol. Imaging 2012, 39, 1538–1544. [Google Scholar] [CrossRef]
- Jeon, I.; Kong, E.; Kim, S.W.; Cho, I.H.; Hong, C.P. Assessment of therapeutic response in pyogenic vertebral osteomyelitis using 18F-FDG-PET/MRI. Diagnostics 2020, 10, 916. [Google Scholar] [CrossRef]
- Kim, S.J.; Kim, I.J.; Suh, K.T.; Kim, Y.K.; Lee, J.S. Prediction of residual disease of spine infection using F-18 FDG PET/CT. Spine 2009, 34, 2424–2430. [Google Scholar] [CrossRef] [PubMed] [Green Version]
- Lee, C.K.; Vessa, P.; Lee, J.K. Chronic disabling low back pain syndrome caused by internal disc derangements. The results of disc excision and posterior lumbar interbody fusion. Spine 1995, 20, 356–361. [Google Scholar] [CrossRef]
- Lawan, A.; Leung, A.; Battie, M.C. Vertebral endplate defects: Nomenclature, classification and measurement methods: A scoping review. Eur. Spine J. 2020, 29, 1397–1409. [Google Scholar] [CrossRef]
- Roberts, S.; Menage, J.; Eisenstein, S.M. The cartilage end-plate and intervertebral disc in scoliosis: Calcification and other sequelae. J. Orthop. Res. 1993, 11, 747–757. [Google Scholar] [CrossRef]
- Signore, A.; Glaudemans, A.W. The molecular imaging approach to image infections and inflammation by nuclear medicine techniques. Ann. Nucl. Med. 2011, 25, 681–700. [Google Scholar] [CrossRef] [PubMed]
- Bj0rksten, B.; Boquist, L. Histopathological aspects of chronic recurrent multifocal osteomyelitis. J. Bone Jt. Surg. 1980, 62, 376–380. [Google Scholar] [CrossRef] [Green Version]
- Goldsmith, S.J.; Vallabhajosula, S. Clinically proven radiopharmaceuticals for infection imaging: Mechanisms and applications. Semin. Nucl. Med. 2009, 39, 2–10. [Google Scholar] [CrossRef] [PubMed]
- He, X.; Zhao, L.; Guo, X.; Zhao, L.; Wu, J.; Huang, J.; Sun, L.; Xie, C.; Chen, H. Differential diagnostic value of 18F-FDG PET/CT for benign and malignant vertebral compression fractures: Comparison with magnetic resonance imaging. Cancer Manag. Res. 2018, 10, 2105–2115. [Google Scholar] [CrossRef] [Green Version]
- Shon, I.H.; Fogelman, I. F-18 FDG positron emission tomography and benign fractures. Clin. Nucl. Med. 2003, 28, 171–175. [Google Scholar] [CrossRef]
- Peters, M.; Willems, P.; Weijers, R.; Wierts, R.; Jutten, L.; Urbach, C.; Arts, C.; van Rhijn, L.; Brans, B. Pseudarthrosis after lumbar spinal fusion: The role of 18 F-fluoride PET/CT. Eur. J. Nucl. Med. Mol. Imaging 2015, 42, 1891–1898. [Google Scholar] [CrossRef] [PubMed]
- Suto, T.; Okamura, K.; Yonemoto, Y.; Okura, C.; Tsushima, Y.; Takagishi, K. Prediction of large joint destruction in patients with rheumatoid arthritis using 18F-FDG PET/CT and disease activity score. Medicine 2016, 95, e2841. [Google Scholar] [CrossRef] [PubMed]
- Chiowchanwisawakit, P.; Lambert, R.G.; Conner-Spady, B.; Maksymowych, W.P. Focal fat lesions at vertebral corners on magnetic resonance imaging predict the development of new syndesmophytes in ankylosing spondylitis. Arthritis Rheum. 2011, 63, 2215–2225. [Google Scholar] [CrossRef]
- Zhao, Z.; Wang, G.; Wang, Y.; Yang, J.; Wang, Y.; Zhu, J.; Huang, F. Correlation between magnetic resonance imaging (MRI) findings and the new bone formation factor Dkk-1 in patients with spondyloarthritis. Clin. Rheumatol. 2019, 38, 465–475. [Google Scholar] [CrossRef] [PubMed] [Green Version]
- Schett, G.; Landewe, R.; van der Heijde, D. Tumour necrosis factor blockers and structural remodelling in ankylosing spondylitis: What is reality and what is fiction? Ann. Rheum. Dis. 2007, 66, 709–711. [Google Scholar] [CrossRef] [PubMed]
- Bollow, M.; Fischer, T.; Reisshauer, H.; Backhaus, M.; Sieper, J.; Hamm, B.; Braun, J. Quantitative analyses of sacroiliac biopsies in spondyloarthropathies: T cells and macrophages predominate in early and active sacroiliitis—Cellularity correlates with the degree of enhancement detected by magnetic resonance imaging. Ann. Rheum. Dis. 2000, 59, 135–140. [Google Scholar] [CrossRef]
- Krabbe, S.; Sorensen, I.J.; Jensen, B.; Moller, J.M.; Balding, L.; Madsen, O.R.; Lambert, R.G.W.; Maksymowych, W.P.; Pedersen, S.J.; Ostergaard, M. Inflammatory and structural changes in vertebral bodies and posterior elements of the spine in axial spondyloarthritis: Construct validity, responsiveness and discriminatory ability of the anatomy-based CANDEN scoring system in a randomised placebo-controlled trial. RMD Open 2018, 4, e000624. [Google Scholar]
- Hsu, W.K.; Feeley, B.T.; Krenek, L.; Stout, D.B.; Chatziioannou, A.F.; Lieberman, J.R. The use of 18 F-fluoride and 18 F-FDG PET scans to assess fracture healing in a rat femur model. Eur. J. Nucl. Med. Mol. Imaging 2007, 34, 1291–1301. [Google Scholar] [CrossRef] [Green Version]
Publisher’s Note: MDPI stays neutral with regard to jurisdictional claims in published maps and institutional affiliations. |
© 2021 by the authors. Licensee MDPI, Basel, Switzerland. This article is an open access article distributed under the terms and conditions of the Creative Commons Attribution (CC BY) license (https://creativecommons.org/licenses/by/4.0/).