
Quantitative Analysis of the Time–Intensity Curve of Contrast-Enhanced Ultrasound of the Liver: Differentiation of Benign and Malignant Liver Lesions

 , , and
Abstract
:1. Introduction
2. Materials and Methods
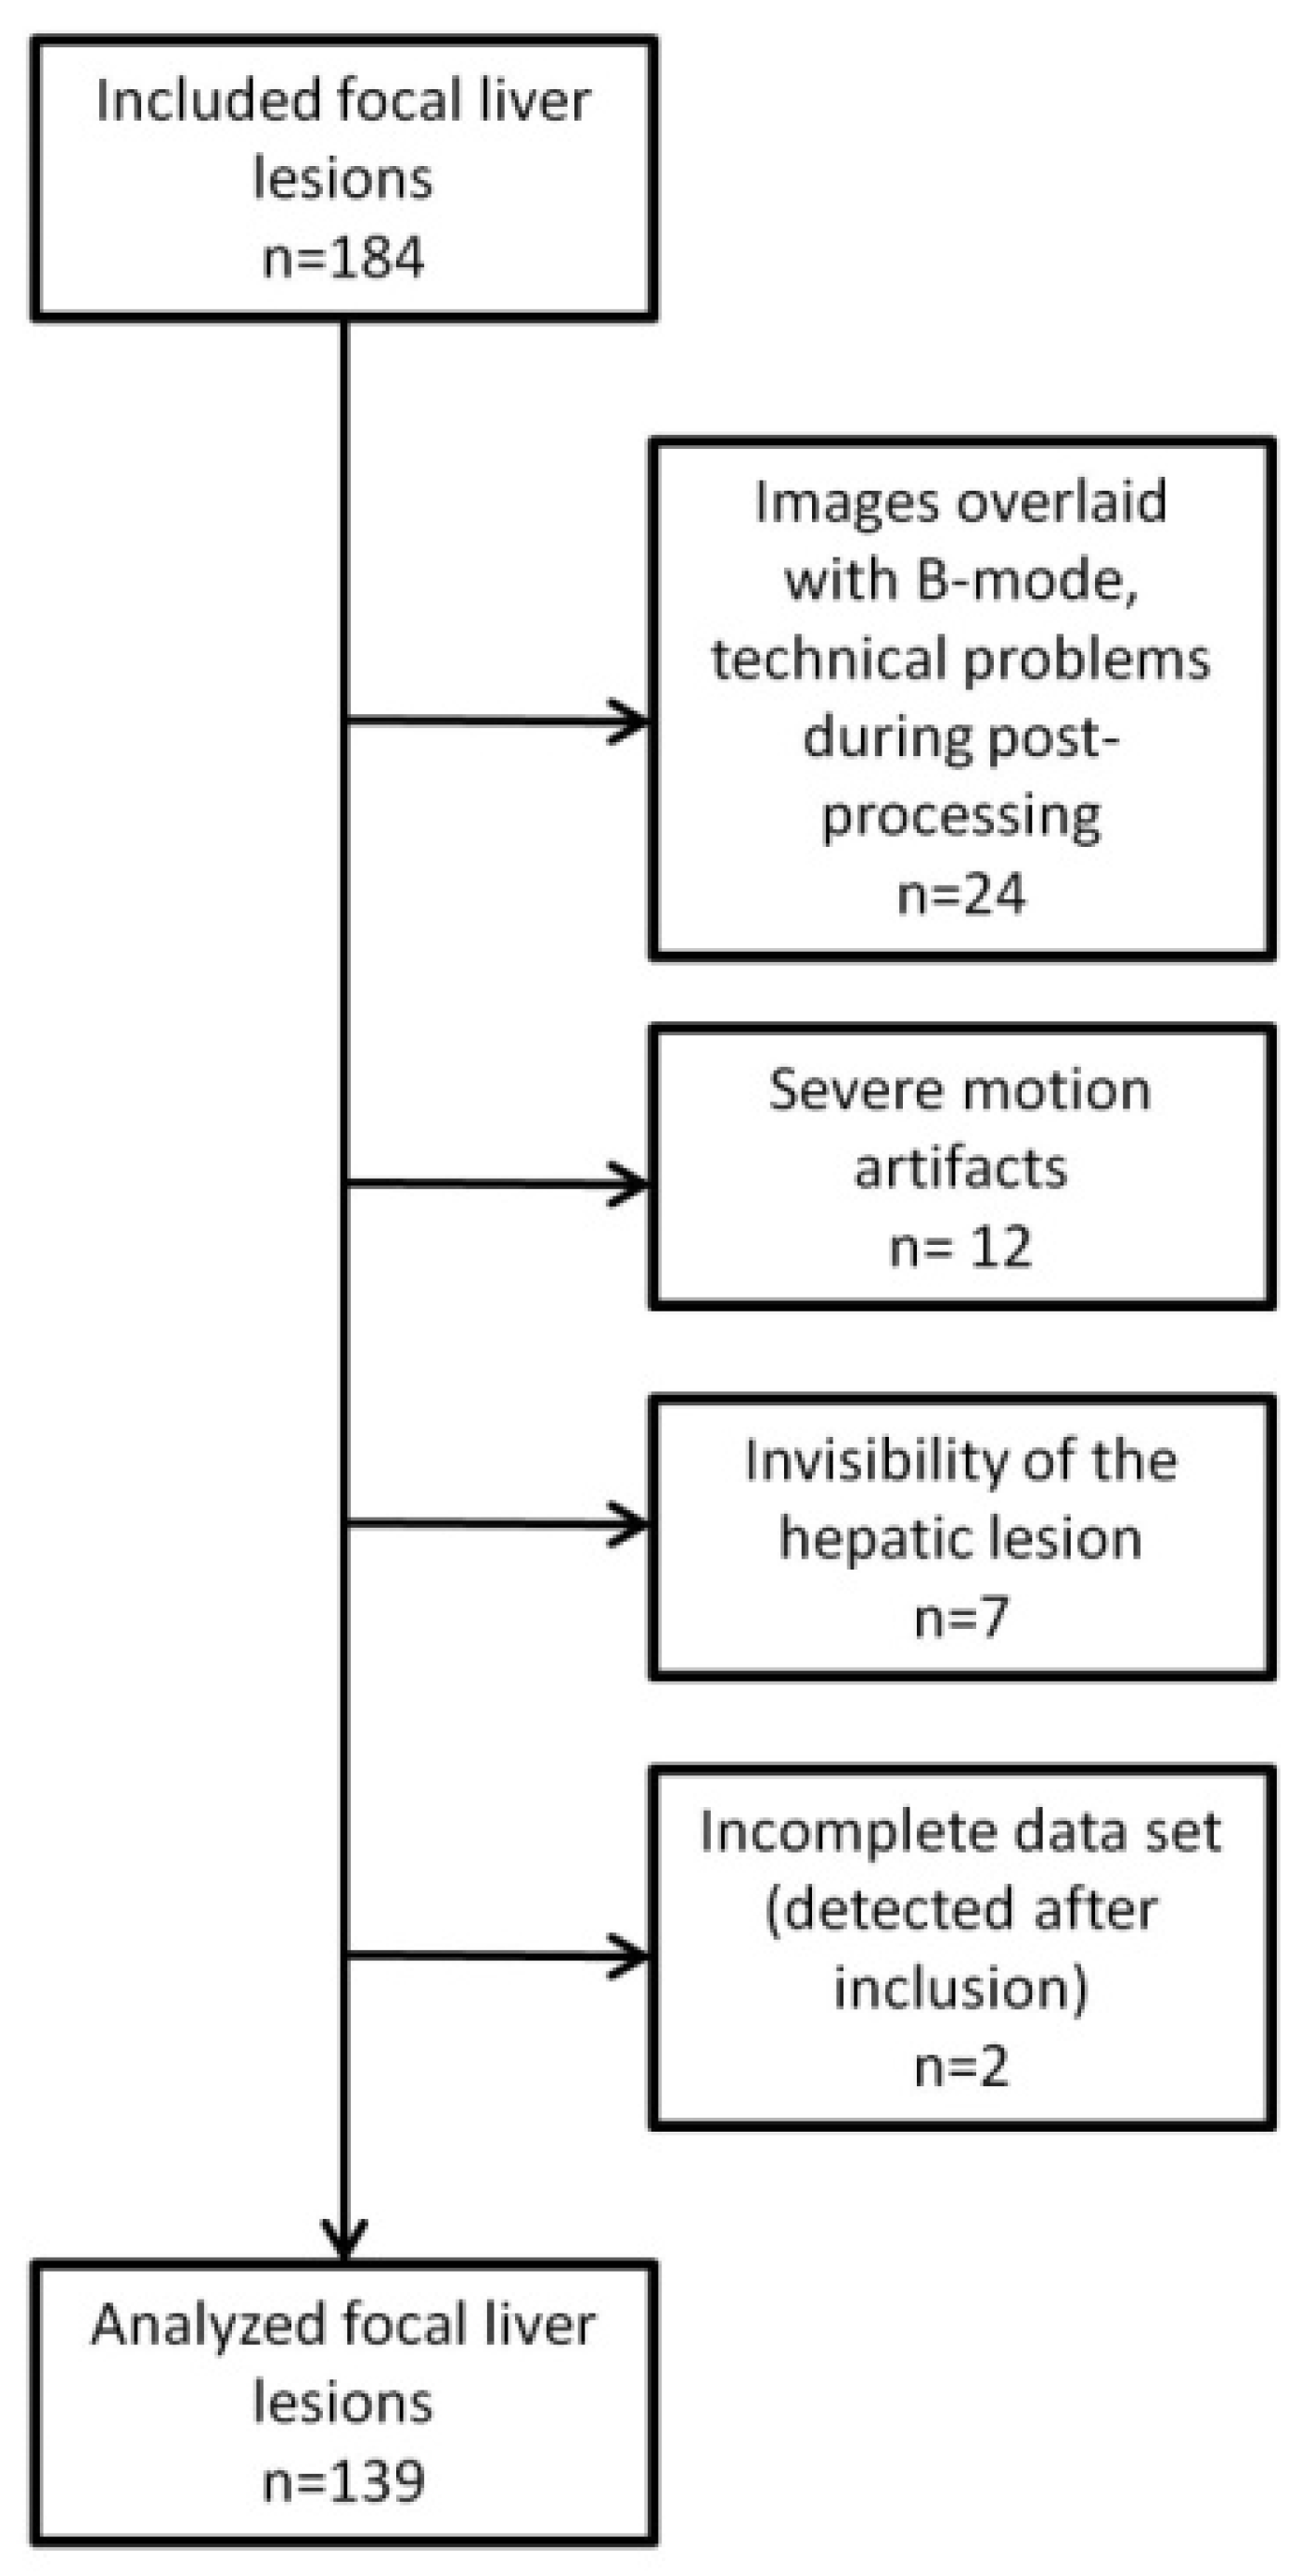
2.1. Study Cohort
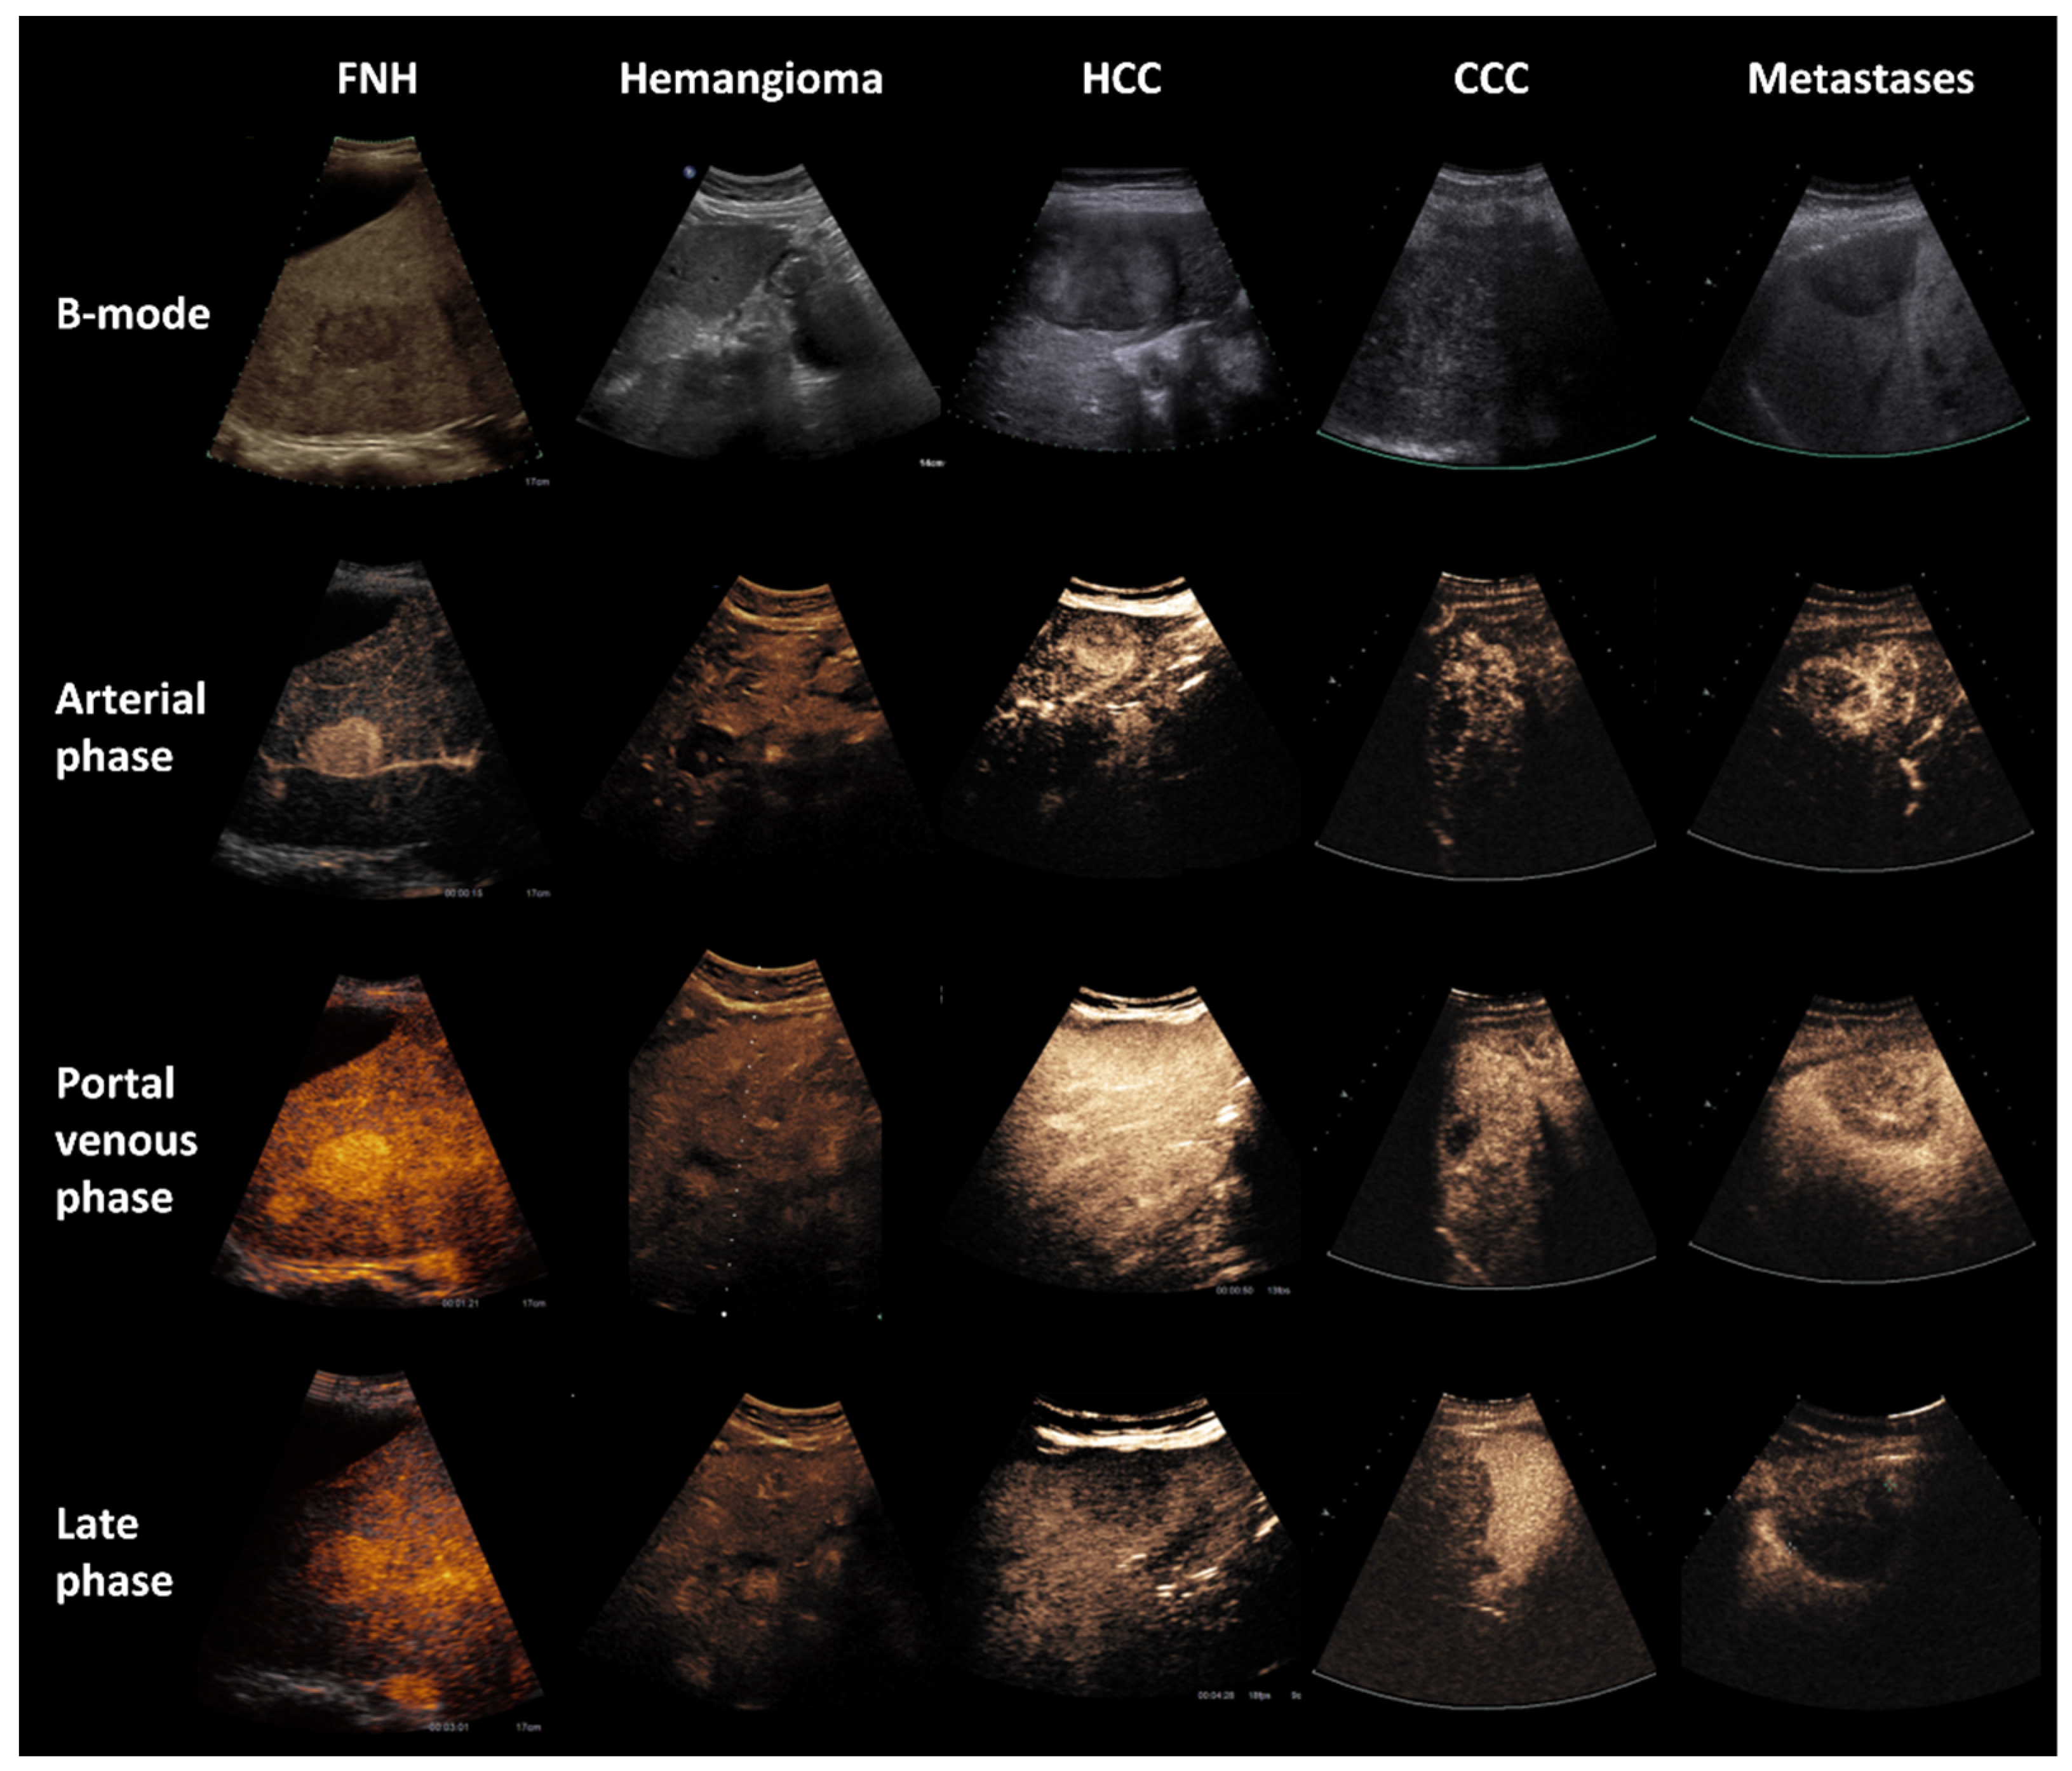
2.2. CEUS
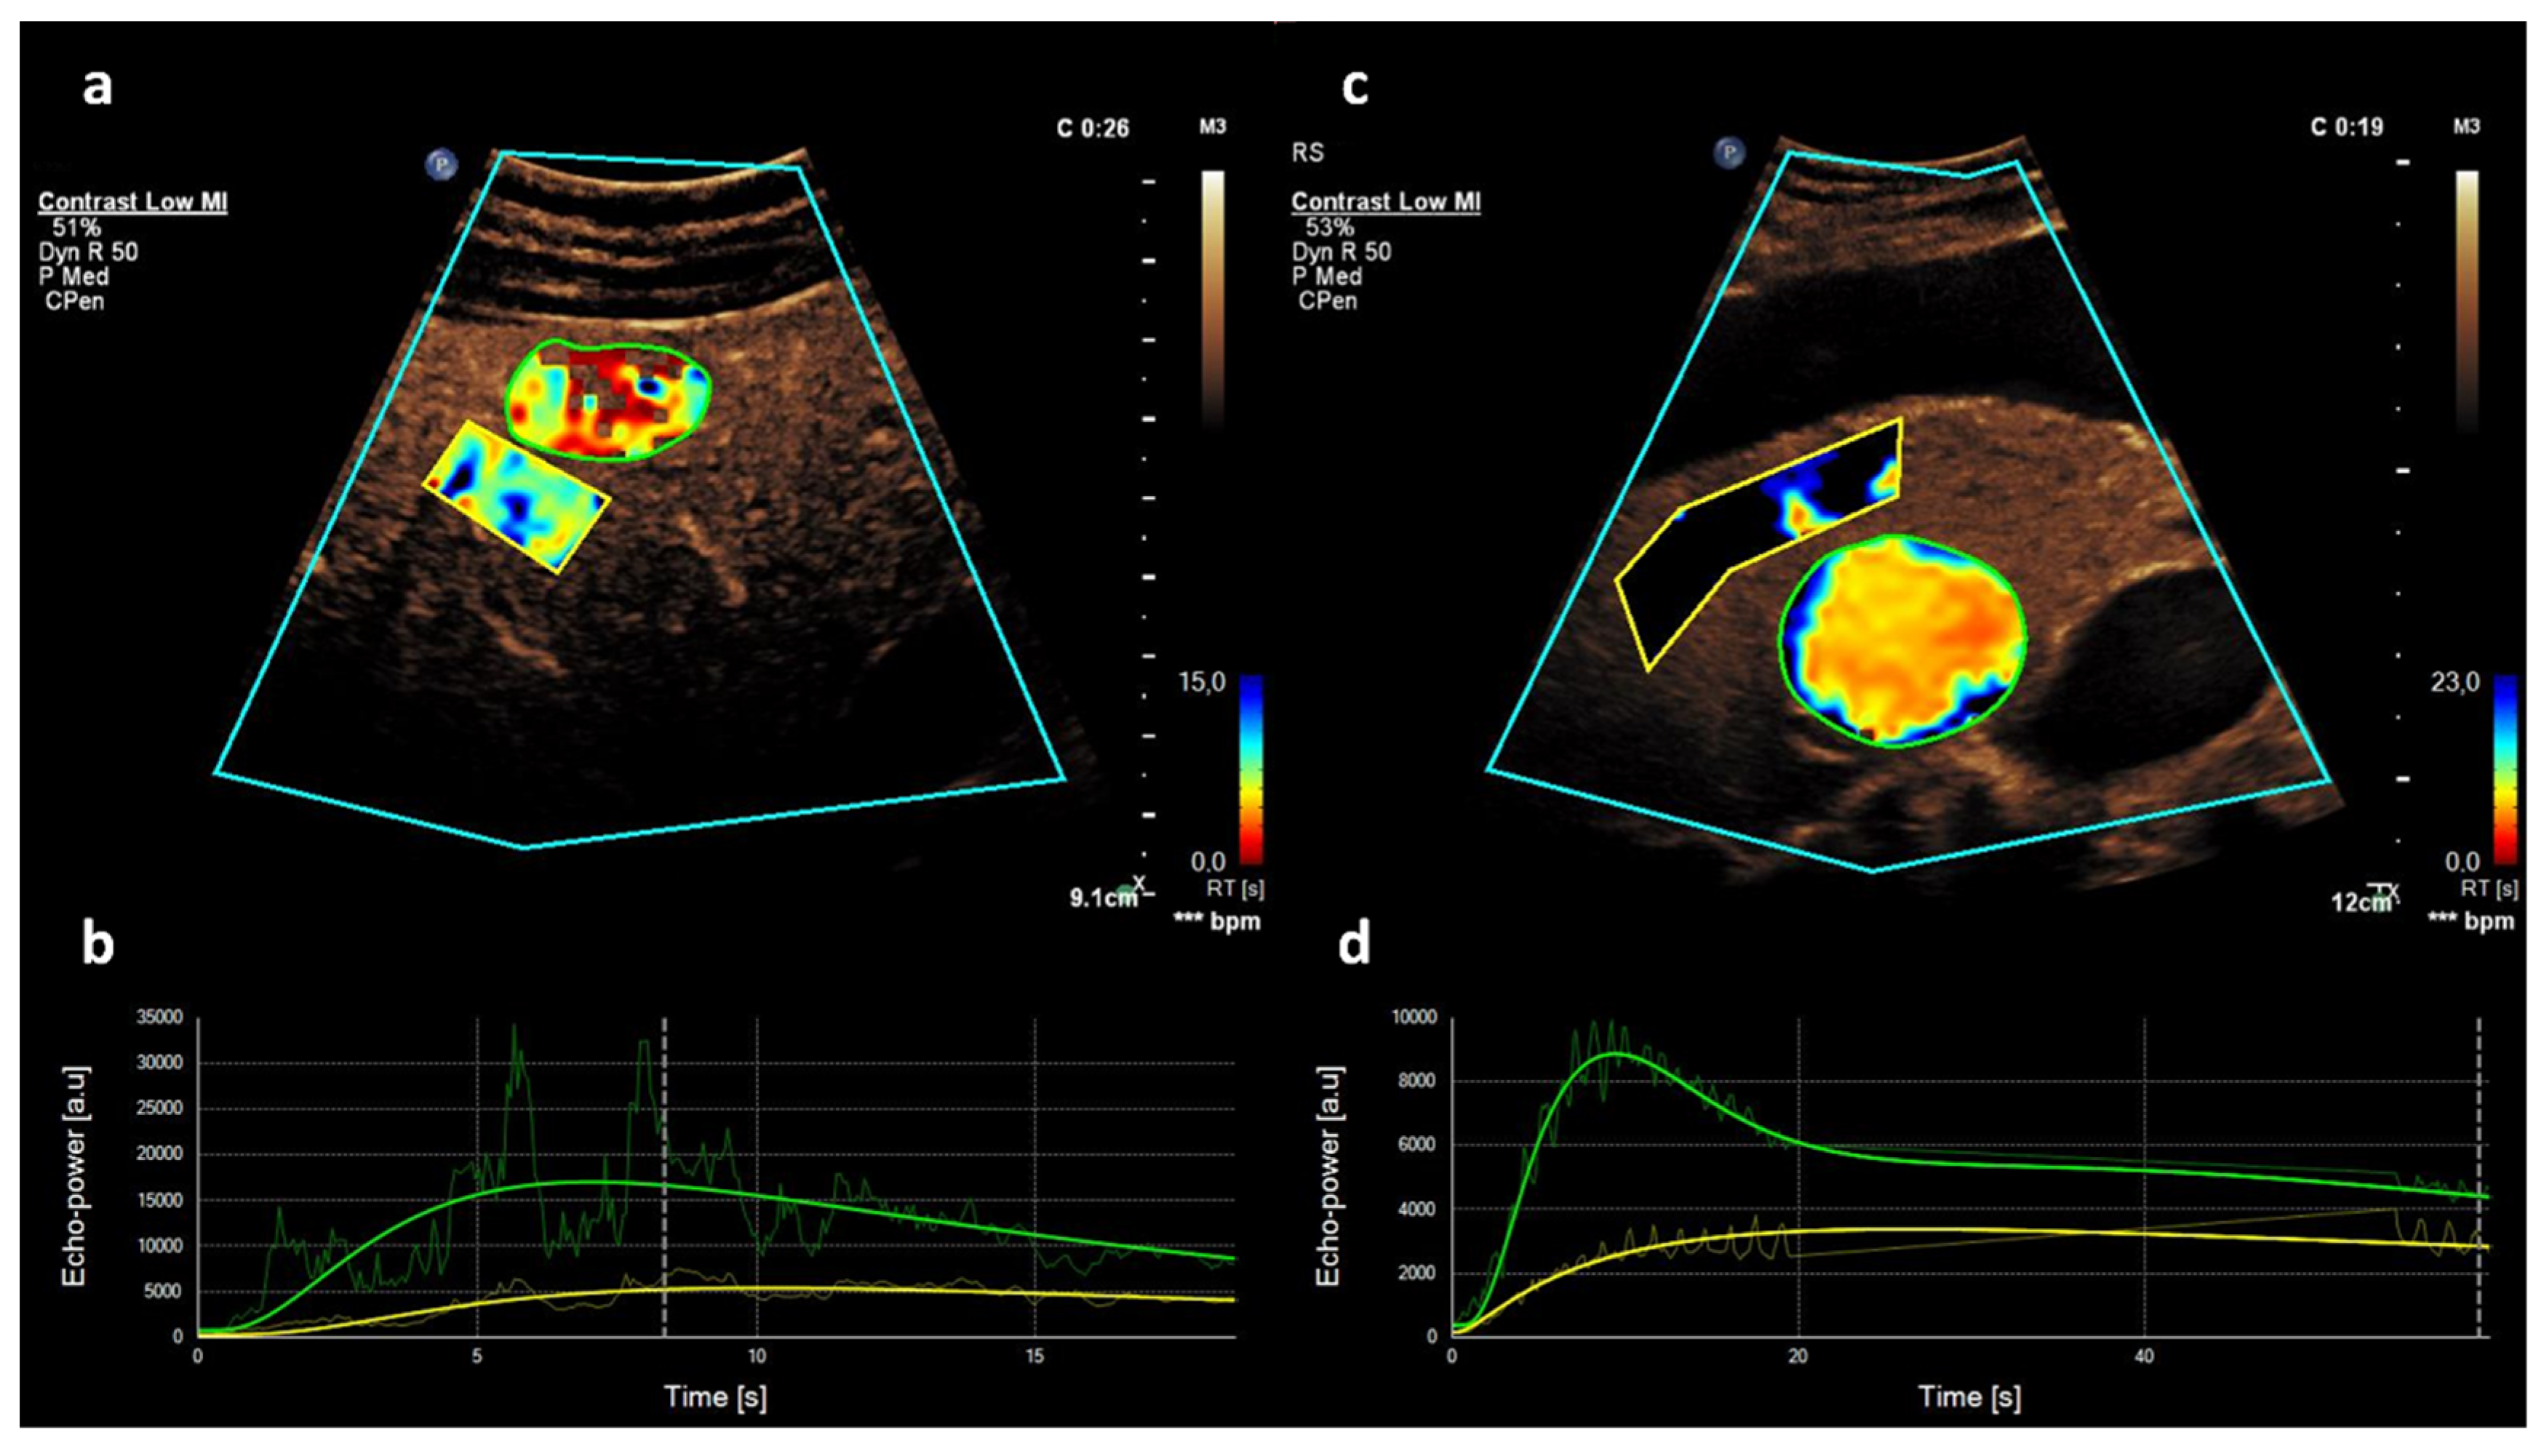
2.3. Quantitative CEUS Assessment
3. Results
3.1. Patient Characteristics
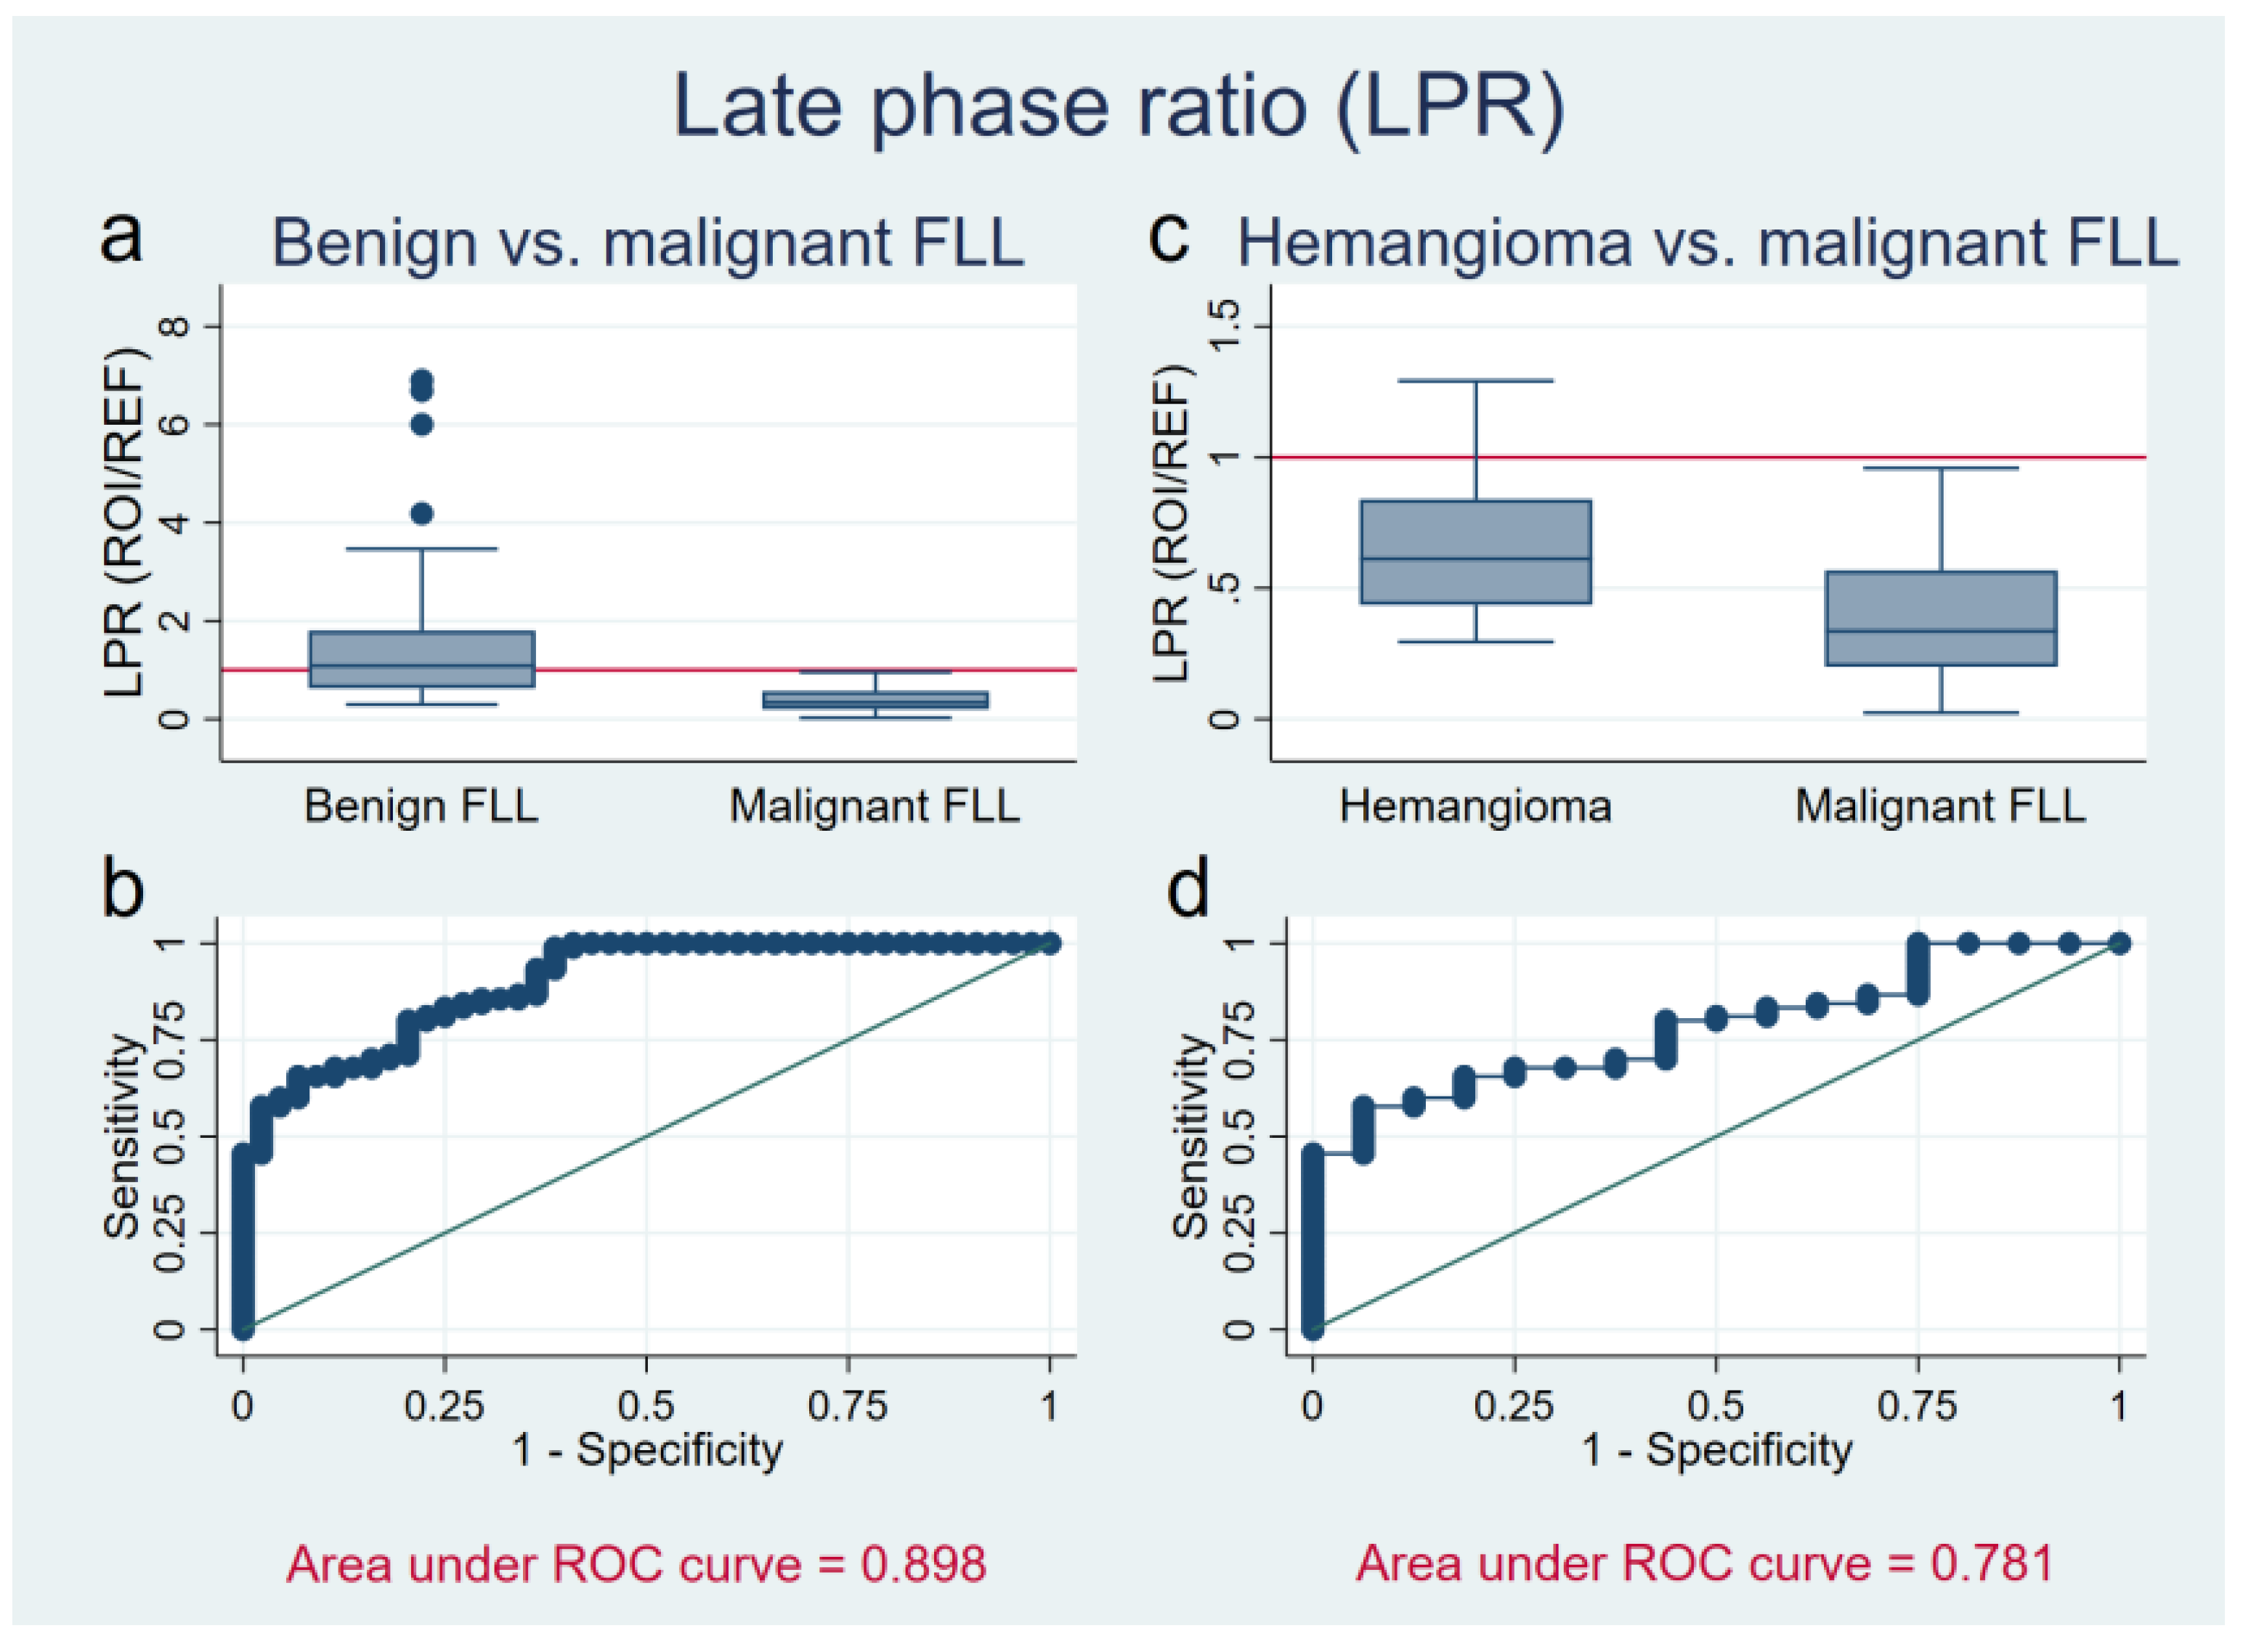
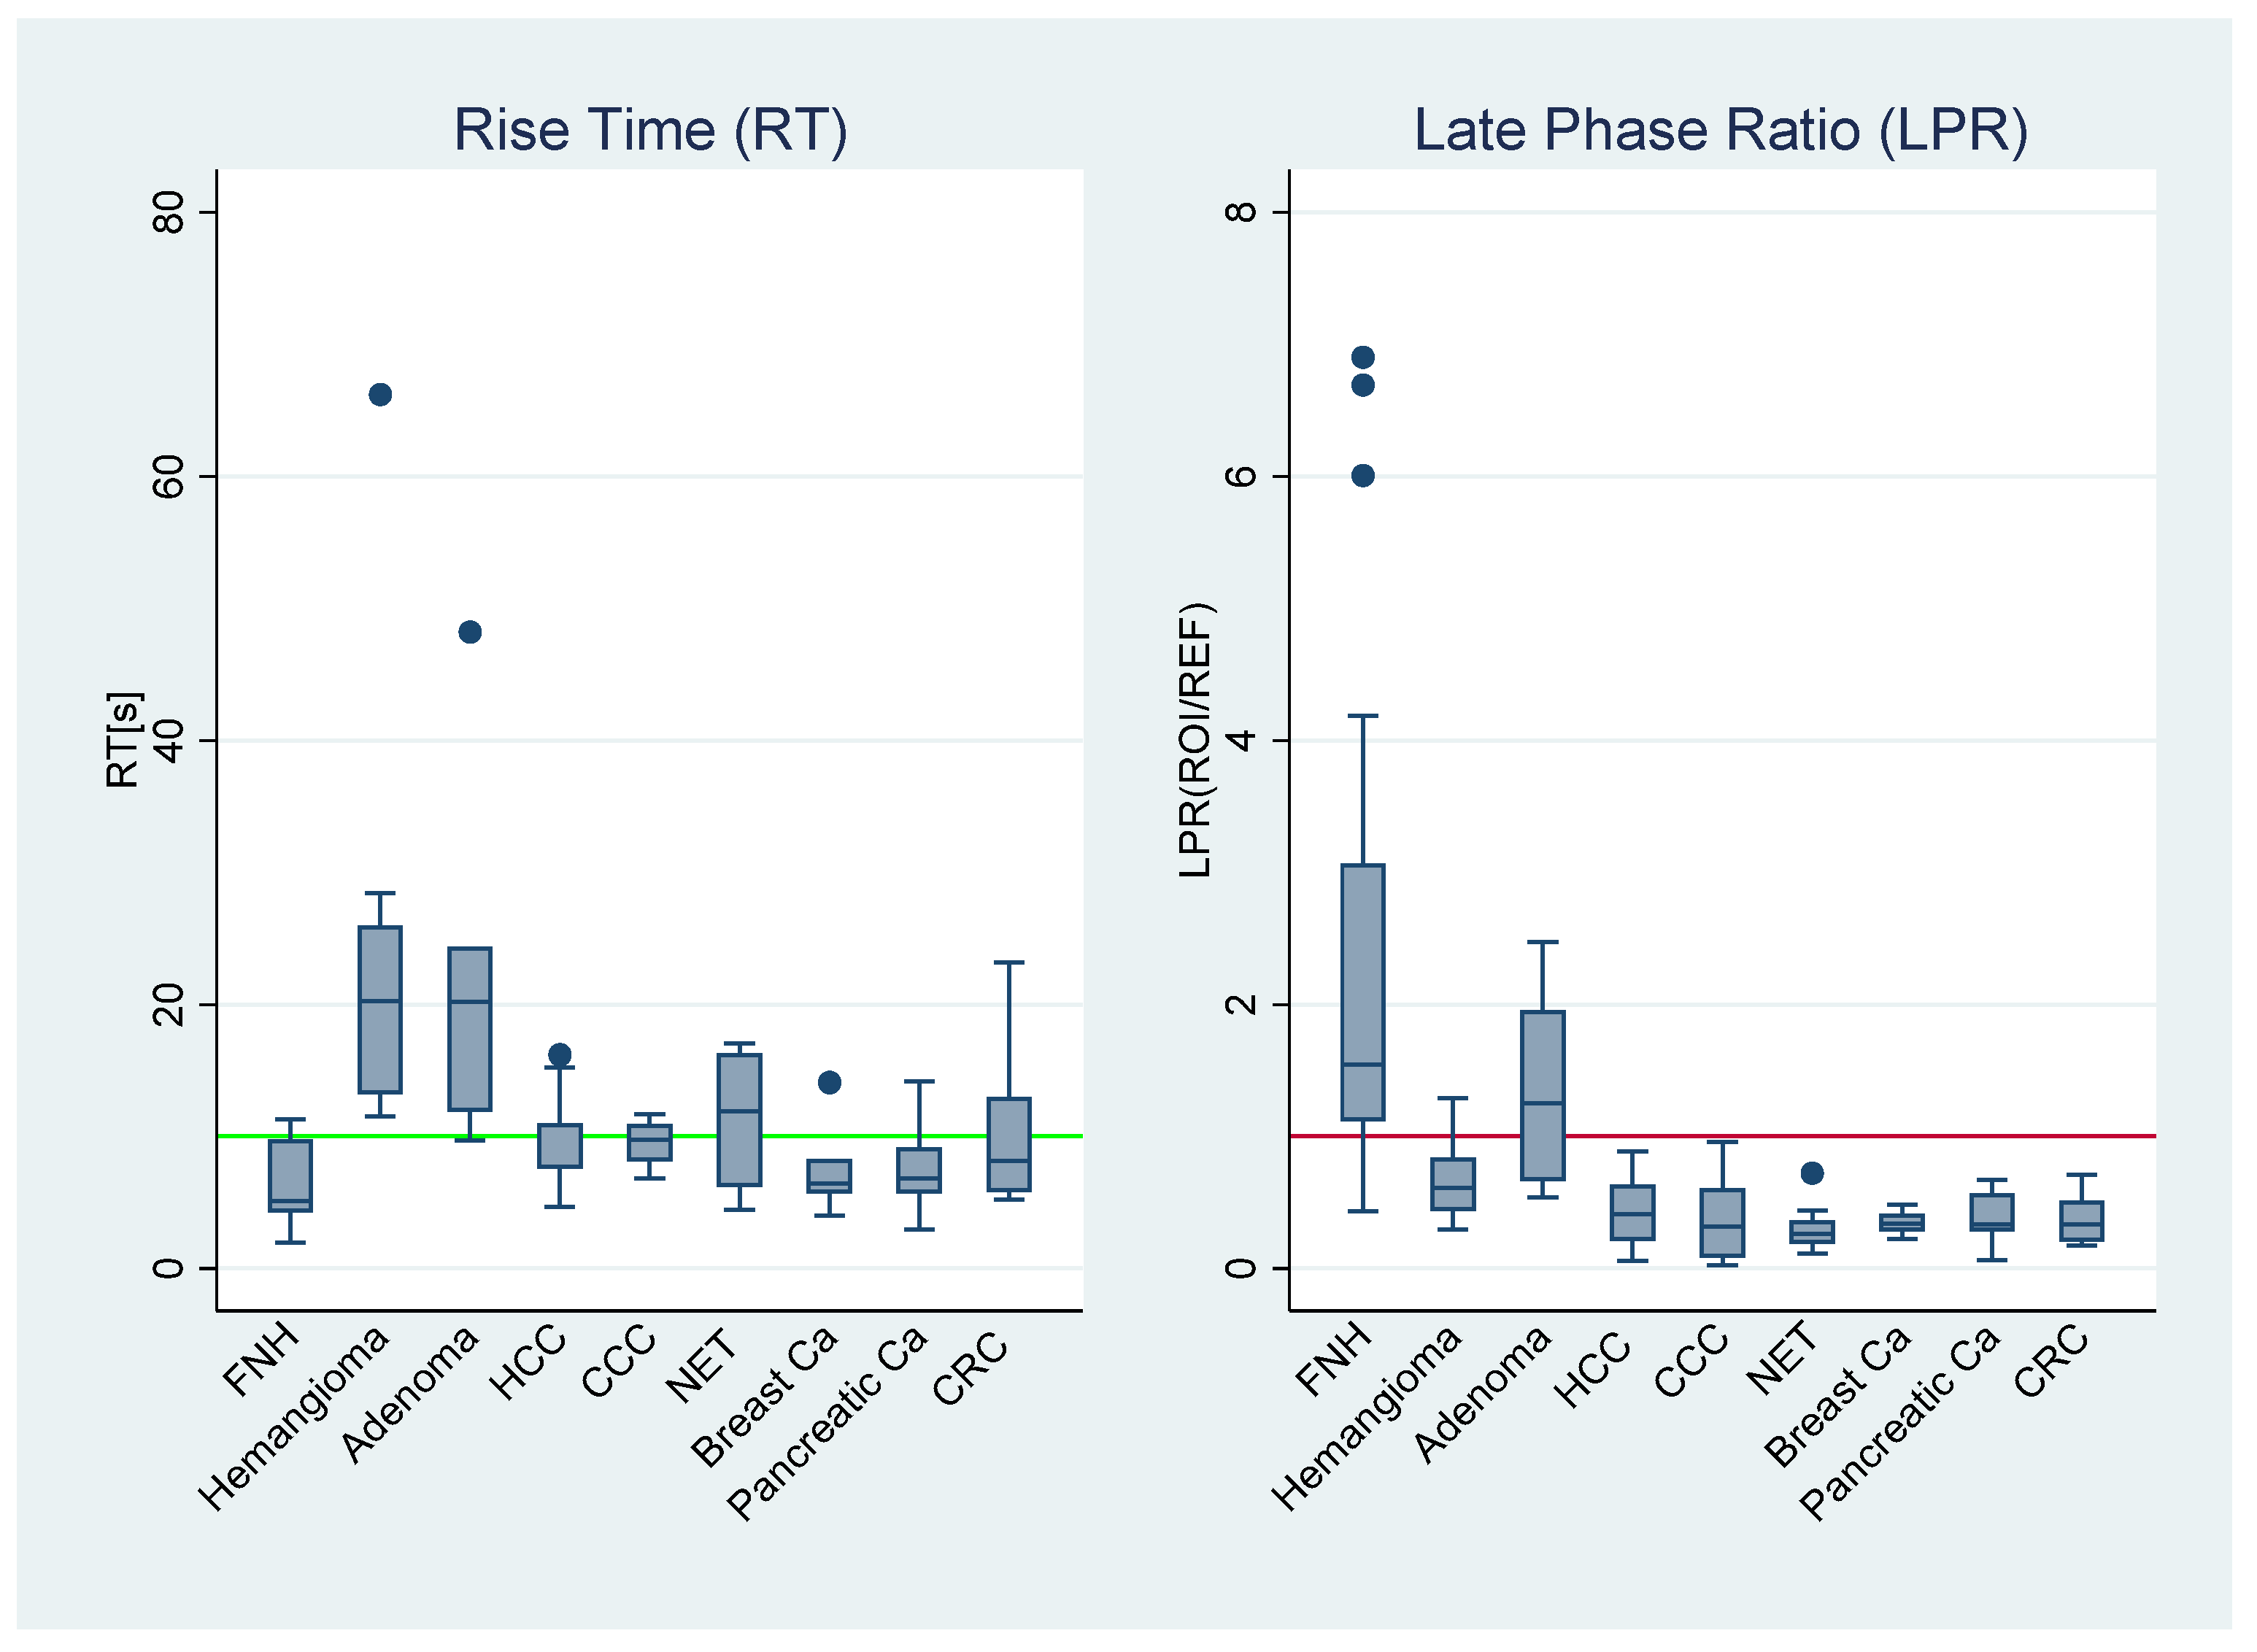
3.2. Late Phase Ratio
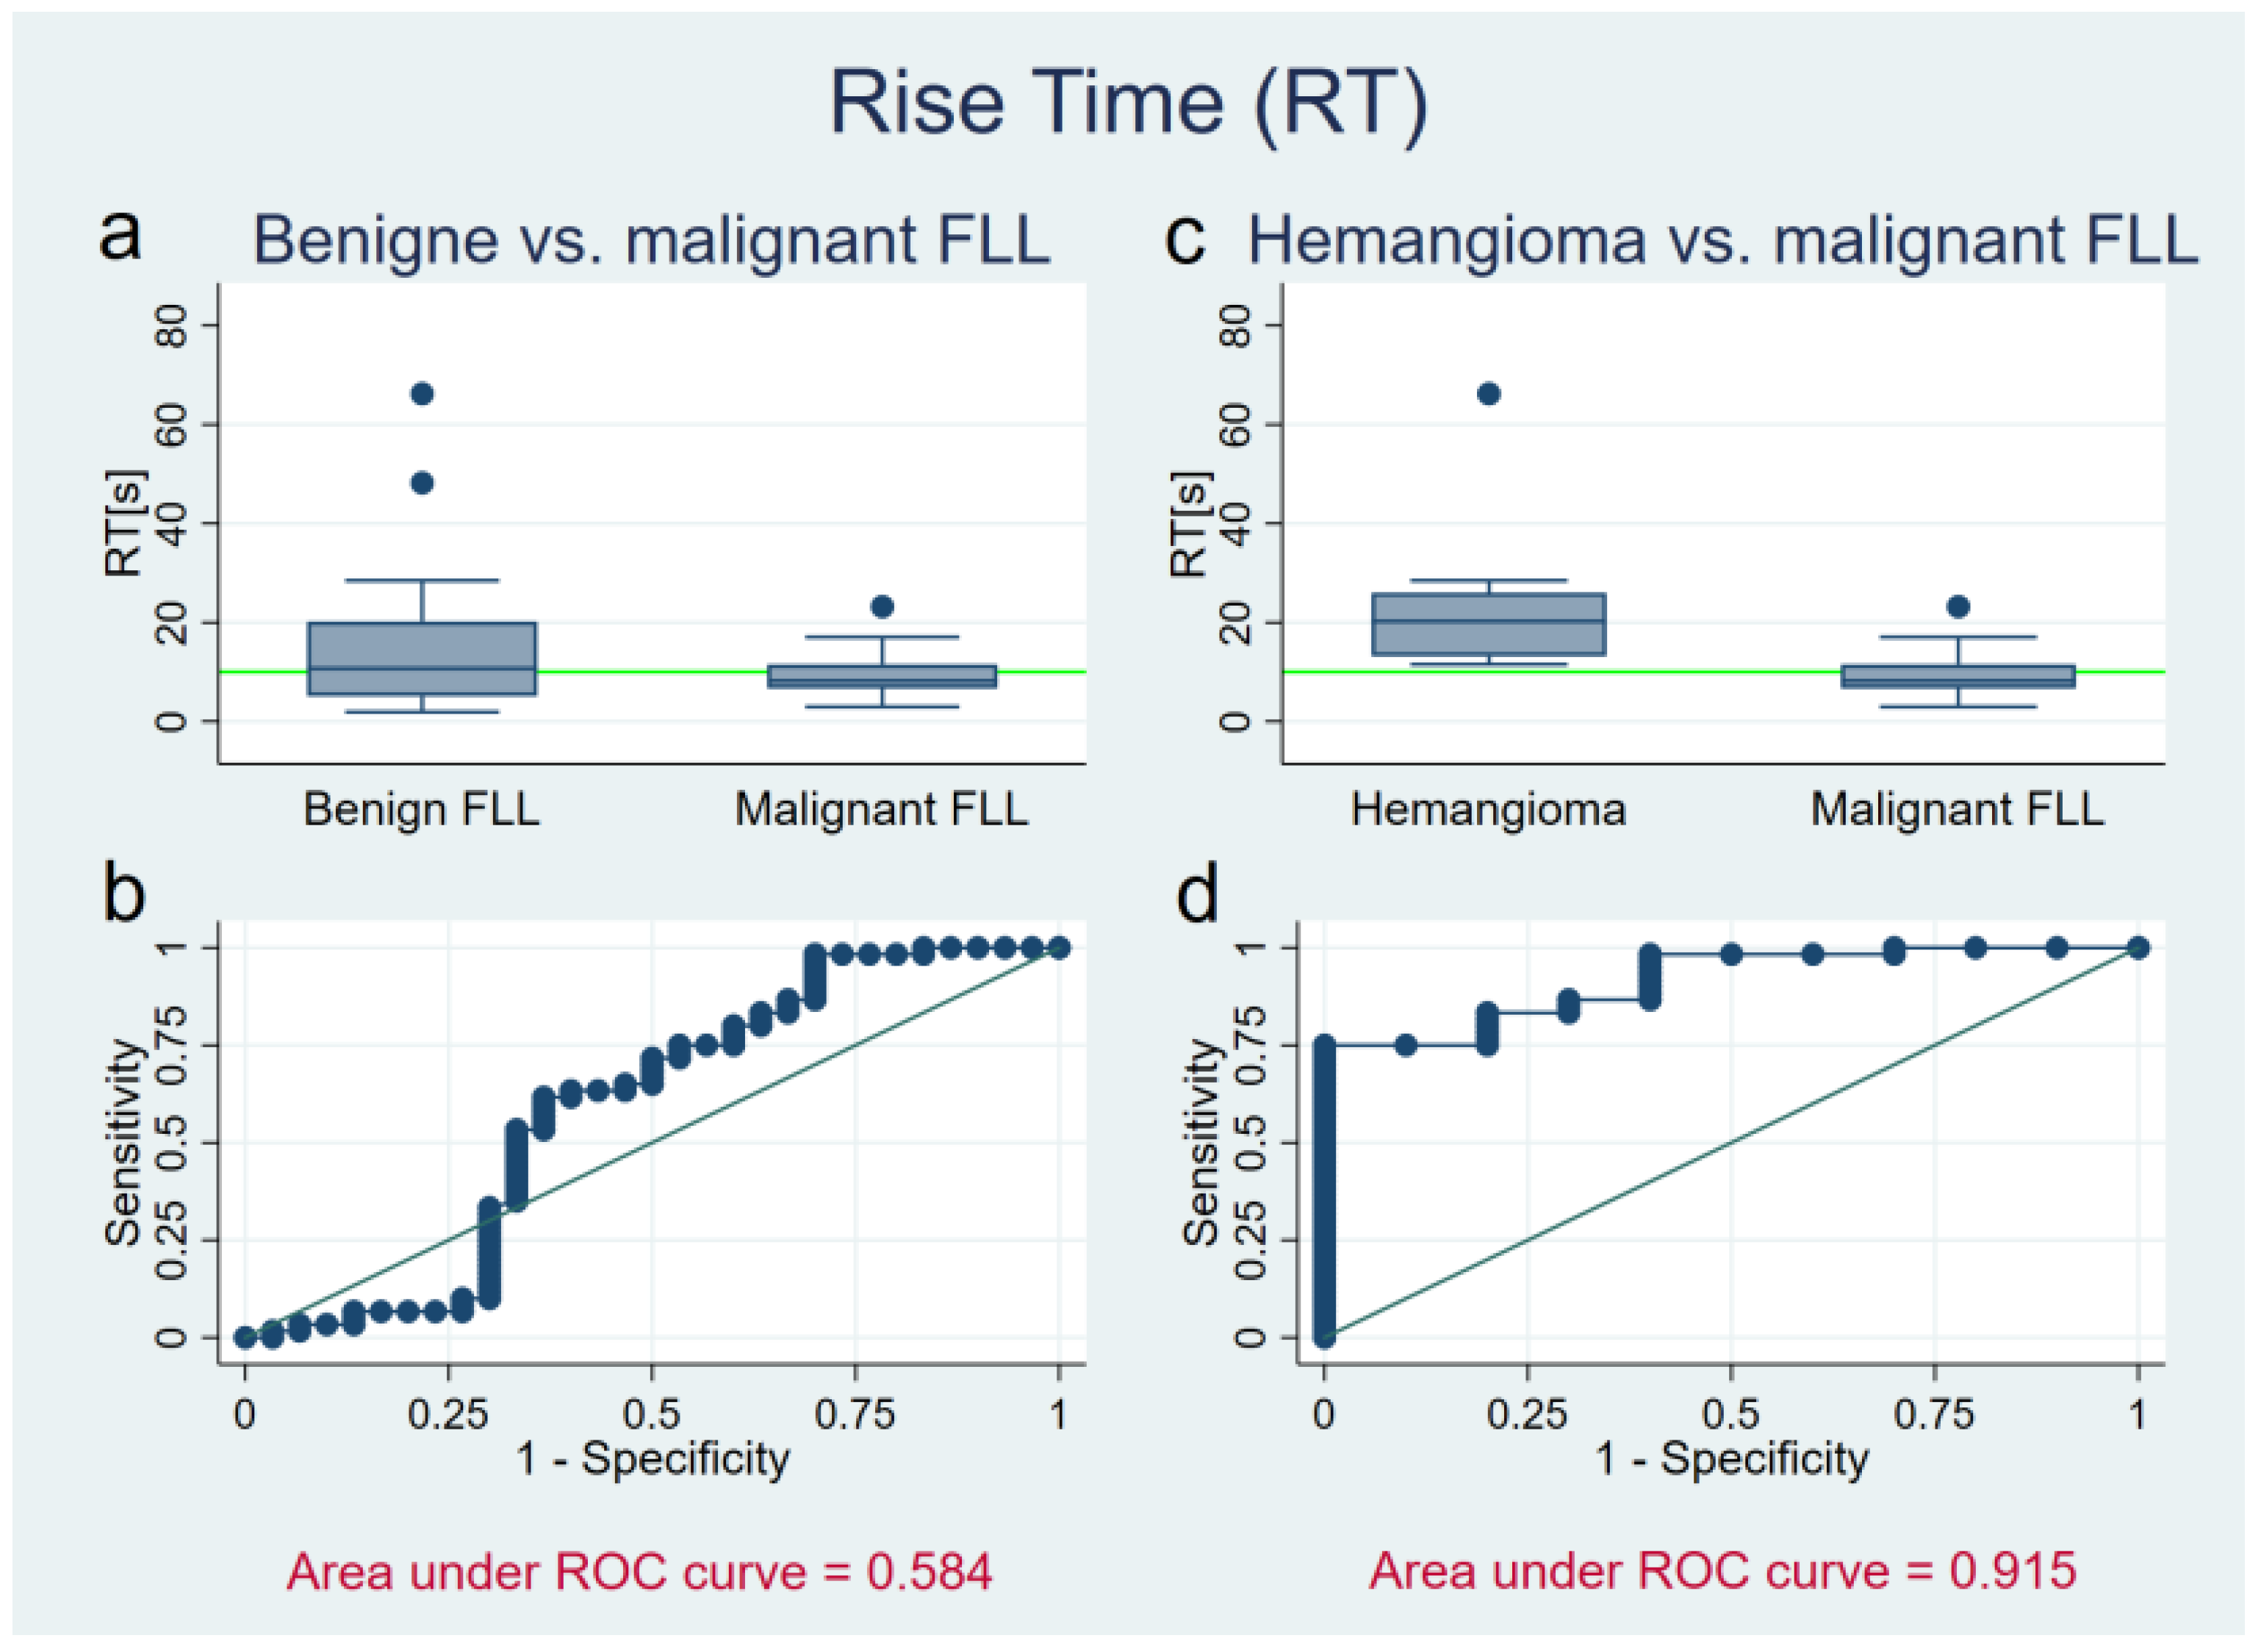
3.3. Rise Time
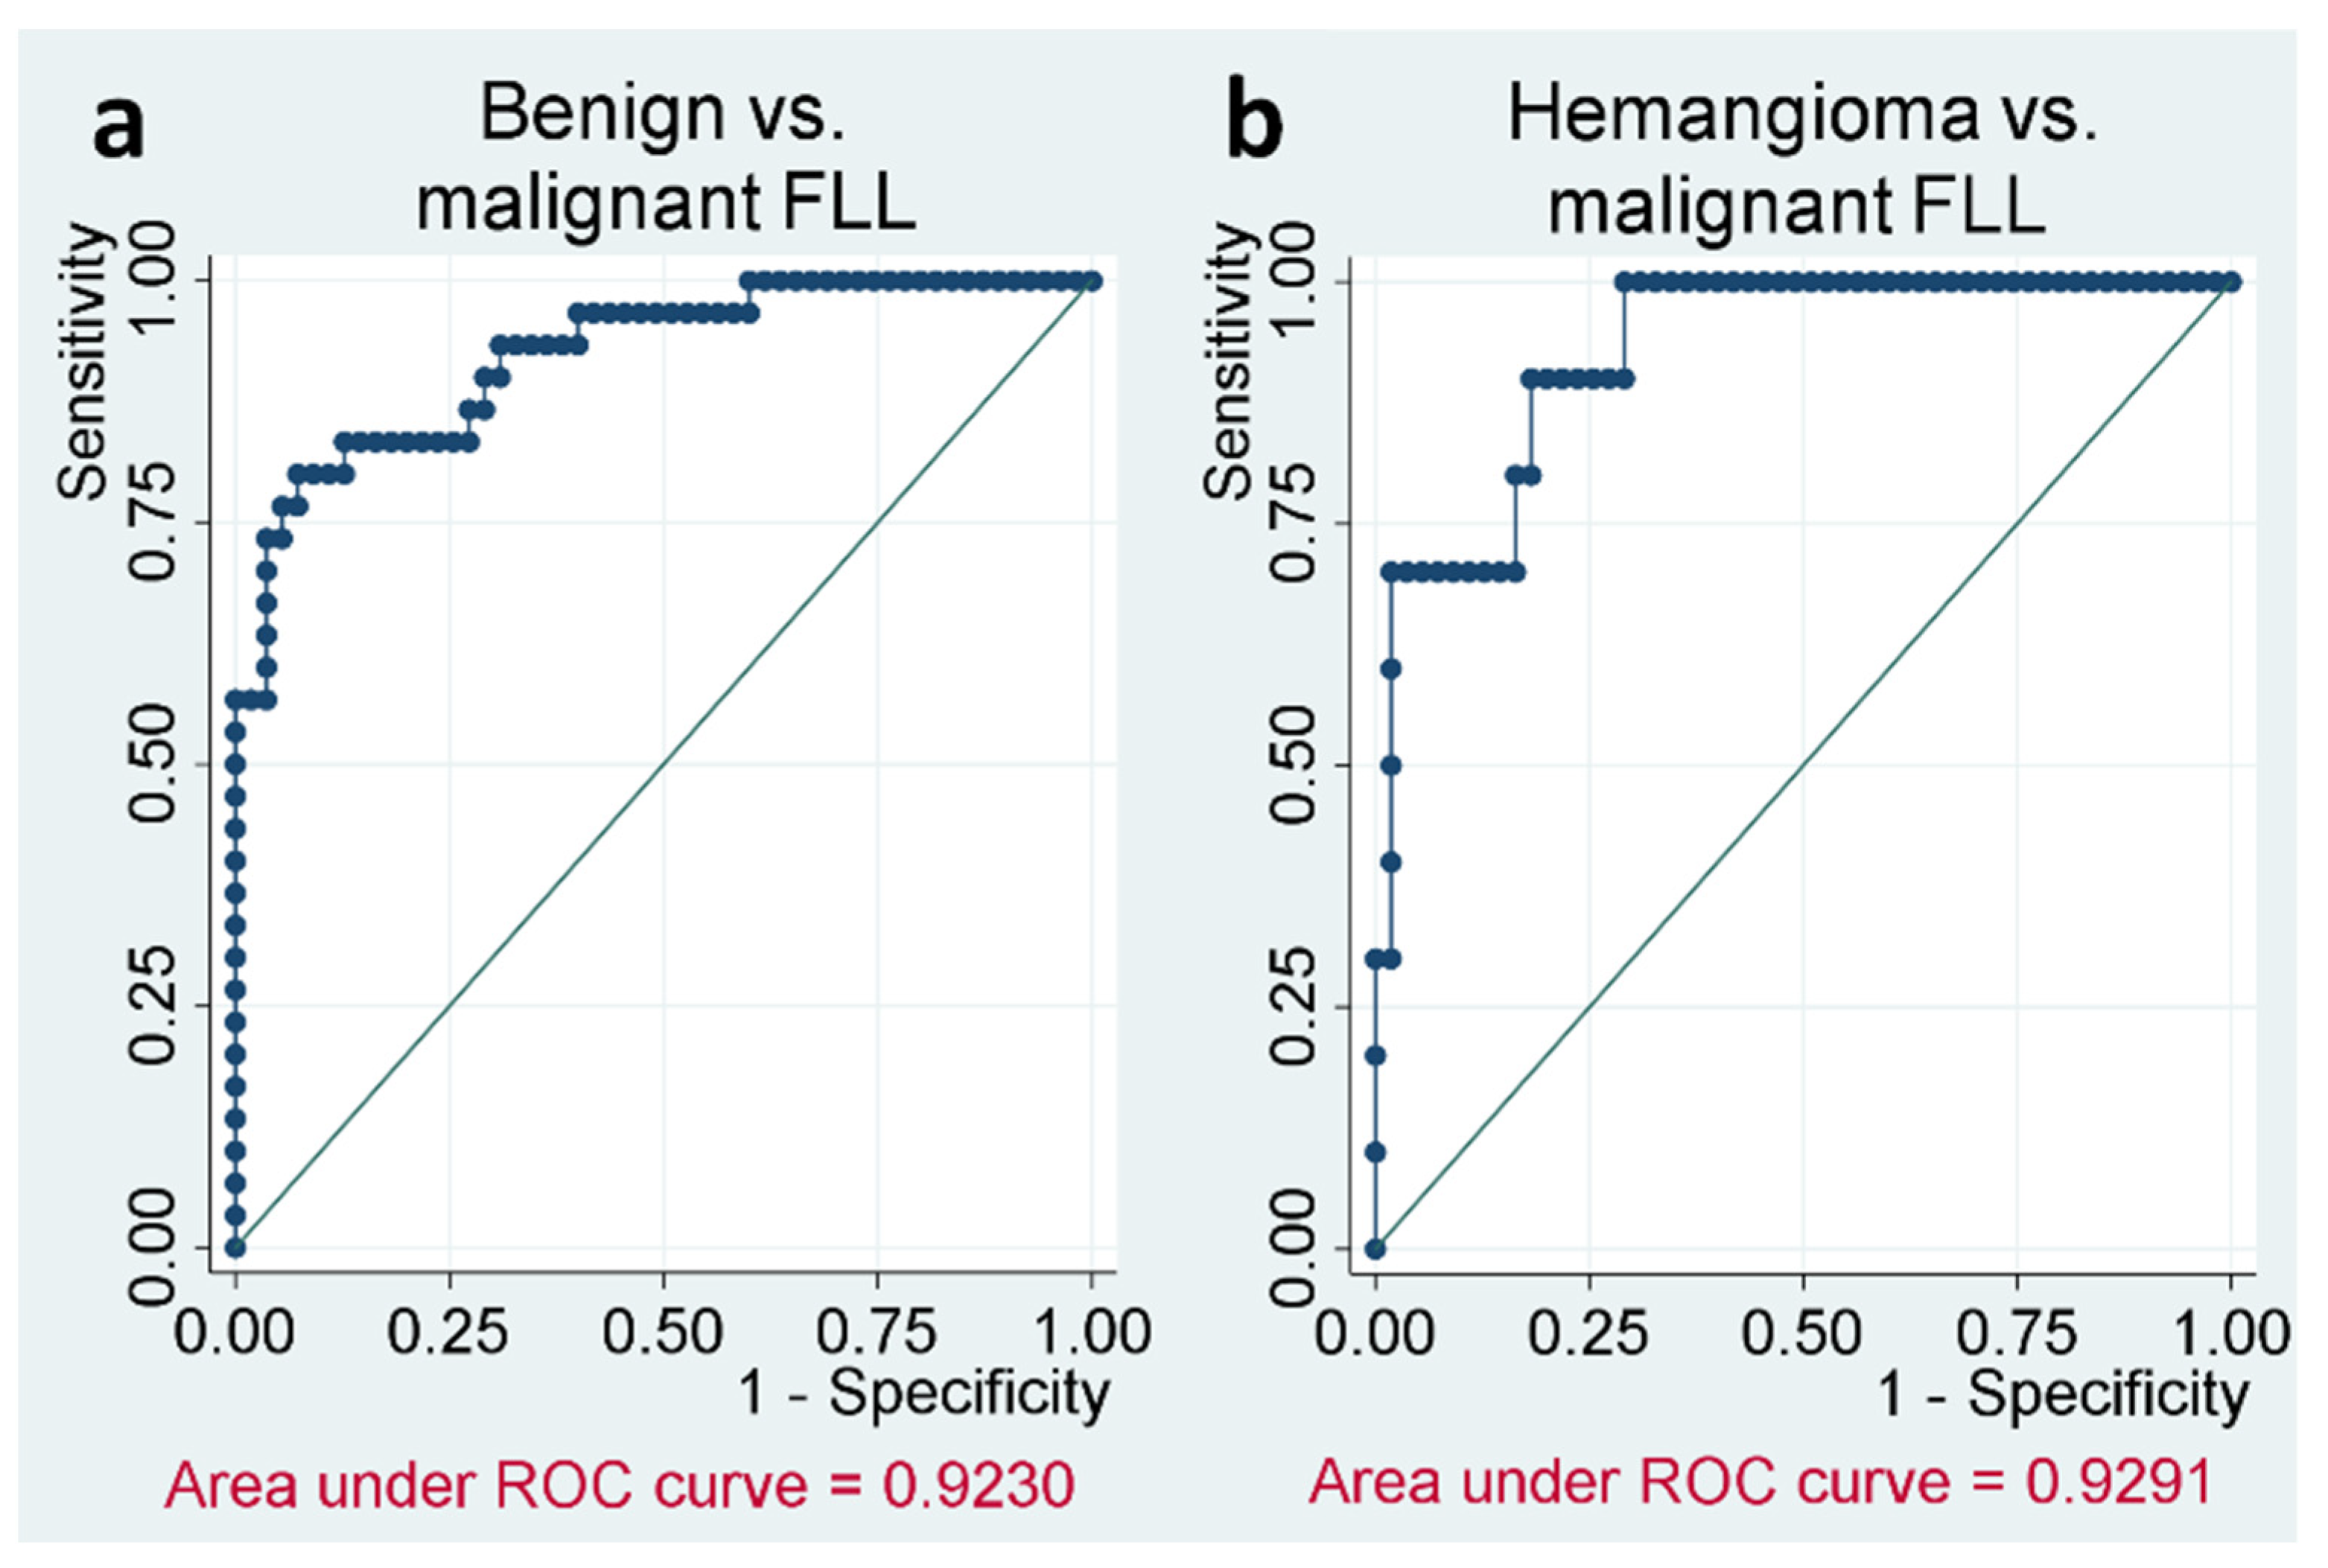
3.4. Logistic Regression
4. Discussion
5. Conclusions
Author Contributions
Funding
Institutional Review Board Statement
Informed Consent Statement
Conflicts of Interest
References
- Strobel, D.; Bernatik, T. Diagnostik bei fokalen Leberläsionen: Stellenwert der Kontrastmittelsonographie. Dtsch. Ärzteblatt 2006, 103, 789–793. [Google Scholar]
- Galle, P.R.; Forner, A.; Llovet, J.M.; Mazzaferro, V.; Piscaglia, F.; Raoul, J.L. EASL Clinical Practice Guidelines: Management of hepatocellular carcinoma. J. Hepatol. 2018, 69, 182–236. [Google Scholar] [CrossRef] [PubMed] [Green Version]
- Bernatik, T.; Seitz, K.; Blank, W.; Schuler, A.; Dietrich, C.F.; Strobel, D. Unclear Focal Liver Lesions in Contrast-Enhanced Ultrasonography—Lessons to be Learned from the DEGUM Multicenter Study for the Characterization of Liver Tumors. Ultraschall Med. Eur. J. Ultrasound 2010, 31, 577–581. [Google Scholar] [CrossRef] [PubMed]
- Strobel, D.; Seitz, K.; Blank, W.; Schuler, A.; Dietrich, C.; Von Herbay, A.; Friedrich-Rust, M.; Kunze, G.; Becker, D.; Will, U.; et al. Contrast-enhanced Ultrasound for the Characterization of Focal Liver Lesions—Diagnostic Accuracy in Clinical Practice (DEGUM multicenter trial). Ultraschall Med. Eur. J. Ultrasound 2008, 29, 499–505. [Google Scholar] [CrossRef] [PubMed]
- Seitz, K.; Bernatik, T.; Strobel, D.; Blank, W.; Friedrich-Rust, M.; Strunk, H.; Greis, C.; Kratzer, W.; Schuler, A. Contrast-Enhanced Ultrasound (CEUS) for the Characterization of Focal Liver Lesions in Clinical Practice (DEGUM Multicenter Trial): CEUS vs. MRI—A Prospective Comparison in 269 Patients. Ultraschall Med. Eur. J. Ultrasound 2010, 31, 492–499. [Google Scholar] [CrossRef] [PubMed]
- Wilson, S.R.; Burns, P.N.; Kono, Y. Contrast-Enhanced Ultrasound of Focal Liver Masses: A Success Story. Ultrasound Med. Biol. 2020, 46, 1059–1070. [Google Scholar] [CrossRef]
- Chiorean, L.; Cantisani, V.; Jenssen, C.; Sidhu, P.; Baum, U.; Dietrich, C. Focal masses in a non-cirrhotic liver: The additional benefit of CEUS over baseline imaging. Eur. J. Radiol. 2015, 84, 1636–1643. [Google Scholar] [CrossRef]
- Westwood, M.; Joore, M.; Grutters, J.; Redekop, K.; Armstrong, N.; Lee, K.; Gloy, V.; Raatz, H.; Misso, K.; Severens, J.; et al. Contrast-enhanced ultrasound using SonoVue® (sulphur hexafluoride microbub-bles) compared with contrast-enhanced computed tomography and contrast-enhanced magnetic resonance imaging for the characterisation of focal liver lesions and detection of liver metastases: A systematic review and cost-effectiveness analysis. Health Technol. Assess. 2013, 17, 1–243. [Google Scholar]
- Strobel, D.; Seitz, K.; Blank, W.; Schuler, A.; Dietrich, C.F.; Von Herbay, A.; Friedrich-Rust, M.; Bernatik, T. Tumor-Specific Vascularization Pattern of Liver Metastasis, Hepatocellular Carcinoma, Hemangioma and Focal Nodular Hyperplasia in the Differential Diagnosis of 1349 Liver Lesions in Contrast-Enhanced Ultrasound (CEUS). Ultraschall Med. Eur. J. Ultrasound 2009, 30, 376–382. [Google Scholar] [CrossRef] [PubMed]
- Claudon, M.; Dietrich, C.F.; Choi, B.I.; Cosgrove, D.O.; Kudo, M.; Nolsøe, C.P.; Piscaglia, F.; Wilson, S.R.; Barr, R.G.; Chammas, M.C.; et al. Guidelines and Good Clinical Practice Recommendations for Contrast Enhanced Ultrasound (CEUS) in the Liver—Update 2012. Ultrasound Med. Biol. 2013, 39, 187–210. [Google Scholar] [CrossRef] [PubMed]
- Battaglia, V.; Cervelli, R. Liver investigations: Updating on US technique and contrast-enhanced ultrasound (CEUS). Eur. J. Radiol. 2017, 96, 65–73. [Google Scholar] [CrossRef] [PubMed]
- Wilson, S.R.; Burns, P.N. An Algorithm for the Diagnosis of Focal Liver Masses Using Microbubble Contrast-Enhanced Pulse-Inversion Sonography. Am. J. Roentgenol. 2006, 186, 1401–1412. [Google Scholar] [CrossRef] [PubMed]
- Gatos, I.; Tsantis, S.; Spiliopoulos, S.; Skouroliakou, A.; Theotokas, I.; Zoumpoulis, P.; Hazle, J.D.; Kagadis, G.C. A new automated quantification algorithm for the detection and evaluation of focal liver lesions with contrast-enhanced ultrasound. Med. Phys. 2015, 42, 3948–3959. [Google Scholar] [CrossRef]
- Beyer, L.P.; Pregler, B.; Wiesinger, I.; Stroszczynski, C.; Wiggermann, P.; Jung, E.-M. Continuous Dynamic Registration of Microvascularization of Liver Tumors with Contrast-Enhanced Ultrasound. Radiol. Res. Pract 2014, 2014, 347416. [Google Scholar] [CrossRef] [PubMed]
- Goertz, R.S.; Bernatik, T.; Strobel, D.; Hahn, E.G.; Haendl, T. Software-based quantification of contrast-enhanced ultrasound in focal liver lesions—A feasibility study. Eur. J. Radiol. 2010, 75, e22–e26. [Google Scholar] [CrossRef]
- Bracco Suisse SA—Software Applications: VueBox™ v5.0: Quantifizierungstoolbox Bedienungsanleitung; Bracco Suisse SA: Genève, Switzerland, 2014.
- Bittmann, Felix (2018): Einführung in die Logistische Regression mit Stata. Available online: http://felix-bittmann.de/downloads/artikel/einfuehrung_logit_regression_mit_Stata.pdf (accessed on 10 July 2021).
- Giannetti, A.; Franci, L.; Grechi, C.; Giangregorio, F. Contrast-enhanced sonography in the diagnosis of hepatic hemangiomas: Atypical appearance due to the washout of microbubbles. J. Clin. Ultrasound 2012, 41, 361–365. [Google Scholar] [CrossRef] [PubMed]
- Wildner, D.; Schellhaas, B.; Strack, D.; Goertz, R.S.; Pfeifer, L.; Fiessler, C.; Neurath, M.F.; Strobel, D.; Fießler, C. Differentiation of malignant liver tumors by software-based perfusion quantification with dynamic contrast-enhanced ultrasound (DCEUS). Clin. Hemorheol. Microcirc. 2019, 71, 39–51. [Google Scholar] [CrossRef] [PubMed]
- Chaubal, N.; Joshi, M.; Bam, A.; Chaubal, R. Contrast-Enhanced Ultrasound of Focal Liver Lesions. Semin. Roentgenol. 2016, 51, 334–357. [Google Scholar] [CrossRef] [PubMed]
- Bartolotta, T.V.; Vernuccio, F.; Taibbi, A.; Lagalla, R. Contrast-Enhanced Ultrasound in Focal Liver Lesions: Where Do We Stand? Semin. Ultrasound CT MRI 2016, 37, 573–586. [Google Scholar] [CrossRef] [PubMed]
- Pei, X.-Q.; Liu, L.; Xiong, Y.-H.; Zou, R.-H.; Chen, M.-S.; Li, A.-H.; Cai, M.-Y. Quantitative analysis of contrast-enhanced ultrasonography: Differentiating focal nodular hyperplasia from hepatocellular carcinoma. Br. J. Radiol. 2013, 86, 20120536. [Google Scholar] [CrossRef] [Green Version]
- Zheng, S.-G.; Xu, H.-X.; Liu, L.-N.; Wang, Y.; Zhang, Y.-F.; Guo, L.-H.; Liu, C.; Xu, J.-M.; Sun, L.-P.; Wu, J. Parametric imaging with contrast-enhanced ultrasound: Usefulness for characterization of dynamic effects of microvascularization for hepatocellular carcinoma and focal nodular hyperplasia. Clin. Hemorheol. Microcirc. 2013, 55, 375–389. [Google Scholar] [CrossRef]
- Kong, W.-T.; Ji, Z.-B.; Wang, W.-P.; Cai, H.; Huang, B.-J.; Ding, H. Evaluation of Liver Metastases Using Contrast-Enhanced Ultrasound: Enhancement Patterns and Influencing Factors. Gut Liver 2016, 10, 283–287. [Google Scholar] [CrossRef] [PubMed] [Green Version]
- Pei, X.Q.; Liu, L.Z.; Zheng, W.; Cai, M.Y.; Han, F.; He, J.H.; Li, A.H.; Chen, M.S. Contrast-enhanced ultrasonography of hepatocellular carcinoma: Correlation between quantitative parameters and arteries in neoangiogenesis or sinusoidal capillarization. Eur. J. Radiol. 2012, 81, e182–e188. [Google Scholar] [CrossRef]
- Seitz, K.; Strobel, D.; Bernatik, T.; Blank, W.; Friedrich-Rust, M.; Von Herbay, A.; Dietrich, C.F.; Strunk, H.; Kratzer, W.; Schuler, A. Contrast-Enhanced Ultrasound (CEUS) for the Characterization of Focal Liver Lesions—Prospective Comparison in Clinical Practice: CEUS vs. CT (DEGUM Multicenter Trial) Parts of this Manuscript were presented at the Ultrasound Dreiländertreffen 2008, Davos. Ultraschall Med. Eur. J. Ultrasound 2009, 30, 383–389. [Google Scholar] [CrossRef] [PubMed]
- Piscaglia, F.; Bolondi, L. The safety of Sonovue® in abdominal applications: Retrospective analysis of 23188 investigations. Ultrasound Med. Biol. 2006, 32, 1369–1375. [Google Scholar] [CrossRef] [PubMed]
- Schwarze, V.; Marschner, C.; De Figueiredo, G.N.; Rübenthaler, J.; Clevert, D.-A. Single-Center Study: Evaluating the Diagnostic Performance and Safety of Contrast-Enhanced Ultrasound (CEUS) in Pregnant Women to Assess Hepatic Lesions. Ultraschall Med. Eur. J. Ultrasound 2019, 41, 29–35. [Google Scholar] [CrossRef] [PubMed]
- Seitz, K.; Strobel, D. A Milestone: Approval of CEUS for Diagnostic Liver Imaging in Adults and Children in the USA. Ultraschall Med. Eur. J. Ultrasound 2016, 37, 229–232. [Google Scholar] [CrossRef]
- Marrero, J.A.; Kulik, L.M.; Sirlin, C.B.; Zhu, A.X.; Finn, R.S.; Abecassis, M.M.; Roberts, L.R.; Heimbach, J.K. Diagnosis, Staging, and Management of Hepatocellular Carcinoma: 2018 Practice Guidance by the American Association for the Study of Liver Diseases. Hepatology 2018, 68, 723–750. [Google Scholar] [CrossRef] [Green Version]
- Yang, D.; Li, R.; Zhang, X.-H.; Tang, C.-L.; Ma, K.-S.; Guo, D.-Y.; Yan, X.-C. Perfusion Characteristics of Hepatocellular Carcinoma at Contrast-enhanced Ultrasound: Influence of the Cellular differentiation, the Tumor Size and the Underlying Hepatic Condition. Sci. Rep. 2018, 8, 4713. [Google Scholar] [CrossRef] [Green Version]
- Kondo, T.; Maruyama, H.; Kiyono, S.; Sekimoto, T.; Shimada, T.; Takahashi, M.; Ogasawara, S.; Suzuki, E.; Ooka, Y.; Tawada, A.; et al. Intensity-Based Assessment of Microbubble-Enhanced Ultrasonography: Phase-Related Diagnostic Ability for Cellular Differentiation of Hepatocellular Carcinoma. Ultrasound Med. Biol. 2015, 41, 3079–3087. [Google Scholar] [CrossRef] [PubMed]


| Entity | n | Art. Phase | Late Phase | M/F | Age | Tumor Size | Cirrhosis | Evaluation | Previous Treatments | ||
|---|---|---|---|---|---|---|---|---|---|---|---|
| Histo | CT/MR | Follow up | |||||||||
| Total | 139 | 90 | 134 | 64/75 | 59 ± 17 | 3.4 ± 2.7 | 28 | 60 | 75 | 4 | |
| FNH | 20 | 15 | 20 | 3/17 | 39 ± 13 | 4.4 ± 2.6 | 0 | 3 | 14 | 3 | |
| Hemangioma | 16 | 10 | 16 | 5/11 | 50 ± 11 | 2.2 ± 1.9 | 1 | 16 | |||
| Adenoma | 8 | 5 | 8 | 3/5 | 49 ± 23 | 2.6 ± 1.5 | 0 | 3 | 4 | 1 | 1× partial resection |
| HCC | 30 | 17 | 28 | 24/6 | 62 ± 9 | 3.7 ± 2.8 | 26 | 9 | 21 | 2×TACE 1× liver transplant | |
| CCC | 16 | 13 | 14 | 8/8 | 68 ± 14 | 5.3 ± 3.2 | 0 | 16 | 0 | 2× partial resection, 1× PDT | |
| Metastasis | |||||||||||
| NET | 14 | 7 | 14 | 8/6 | 62 ± 17 | 3.8 ± 3.7 | 0 | 8 | 6 | 3× RPT 1× hemi- hepatectomy1× TACE | |
| Breast Ca | 7 | 6 | 7 | 0/7 | 67 ± 14 | 2.8 ± 2.0 | 1 | 4 | 3 | ||
| Pancreatic Ca | 14 | 9 | 13 | 6/8 | 69 ± 12 | 1.1 ± 0.3 | 0 | 9 | 5 | 1× liver transplant | |
| CRC | 14 | 8 | 14 | 7/7 | 70 ± 13 | 2.7 ± 2.0 | 0 | 8 | 6 | 2× partial resection | |
Publisher’s Note: MDPI stays neutral with regard to jurisdictional claims in published maps and institutional affiliations. |
© 2021 by the authors. Licensee MDPI, Basel, Switzerland. This article is an open access article distributed under the terms and conditions of the Creative Commons Attribution (CC BY) license (https://creativecommons.org/licenses/by/4.0/).
Share and Cite
Schwarz, S.; Clevert, D.-A.; Ingrisch, M.; Geyer, T.; Schwarze, V.; Rübenthaler, J.; Armbruster, M. Quantitative Analysis of the Time–Intensity Curve of Contrast-Enhanced Ultrasound of the Liver: Differentiation of Benign and Malignant Liver Lesions. Diagnostics 2021, 11, 1244. https://doi.org/10.3390/diagnostics11071244
Schwarz S, Clevert D-A, Ingrisch M, Geyer T, Schwarze V, Rübenthaler J, Armbruster M. Quantitative Analysis of the Time–Intensity Curve of Contrast-Enhanced Ultrasound of the Liver: Differentiation of Benign and Malignant Liver Lesions. Diagnostics. 2021; 11(7):1244. https://doi.org/10.3390/diagnostics11071244
Chicago/Turabian StyleSchwarz, Sonja, Dirk-André Clevert, Michael Ingrisch, Thomas Geyer, Vincent Schwarze, Johannes Rübenthaler, and Marco Armbruster. 2021. "Quantitative Analysis of the Time–Intensity Curve of Contrast-Enhanced Ultrasound of the Liver: Differentiation of Benign and Malignant Liver Lesions" Diagnostics 11, no. 7: 1244. https://doi.org/10.3390/diagnostics11071244
APA StyleSchwarz, S., Clevert, D.-A., Ingrisch, M., Geyer, T., Schwarze, V., Rübenthaler, J., & Armbruster, M. (2021). Quantitative Analysis of the Time–Intensity Curve of Contrast-Enhanced Ultrasound of the Liver: Differentiation of Benign and Malignant Liver Lesions. Diagnostics, 11(7), 1244. https://doi.org/10.3390/diagnostics11071244