
Changes in the Functional Brain Network of Children Undergoing Repeated Epilepsy Surgery: An EEG Source Connectivity Study


 ,
, 
 , ,
, , 
Abstract

1. Introduction
2. Materials and Methods
2.1. Subjects
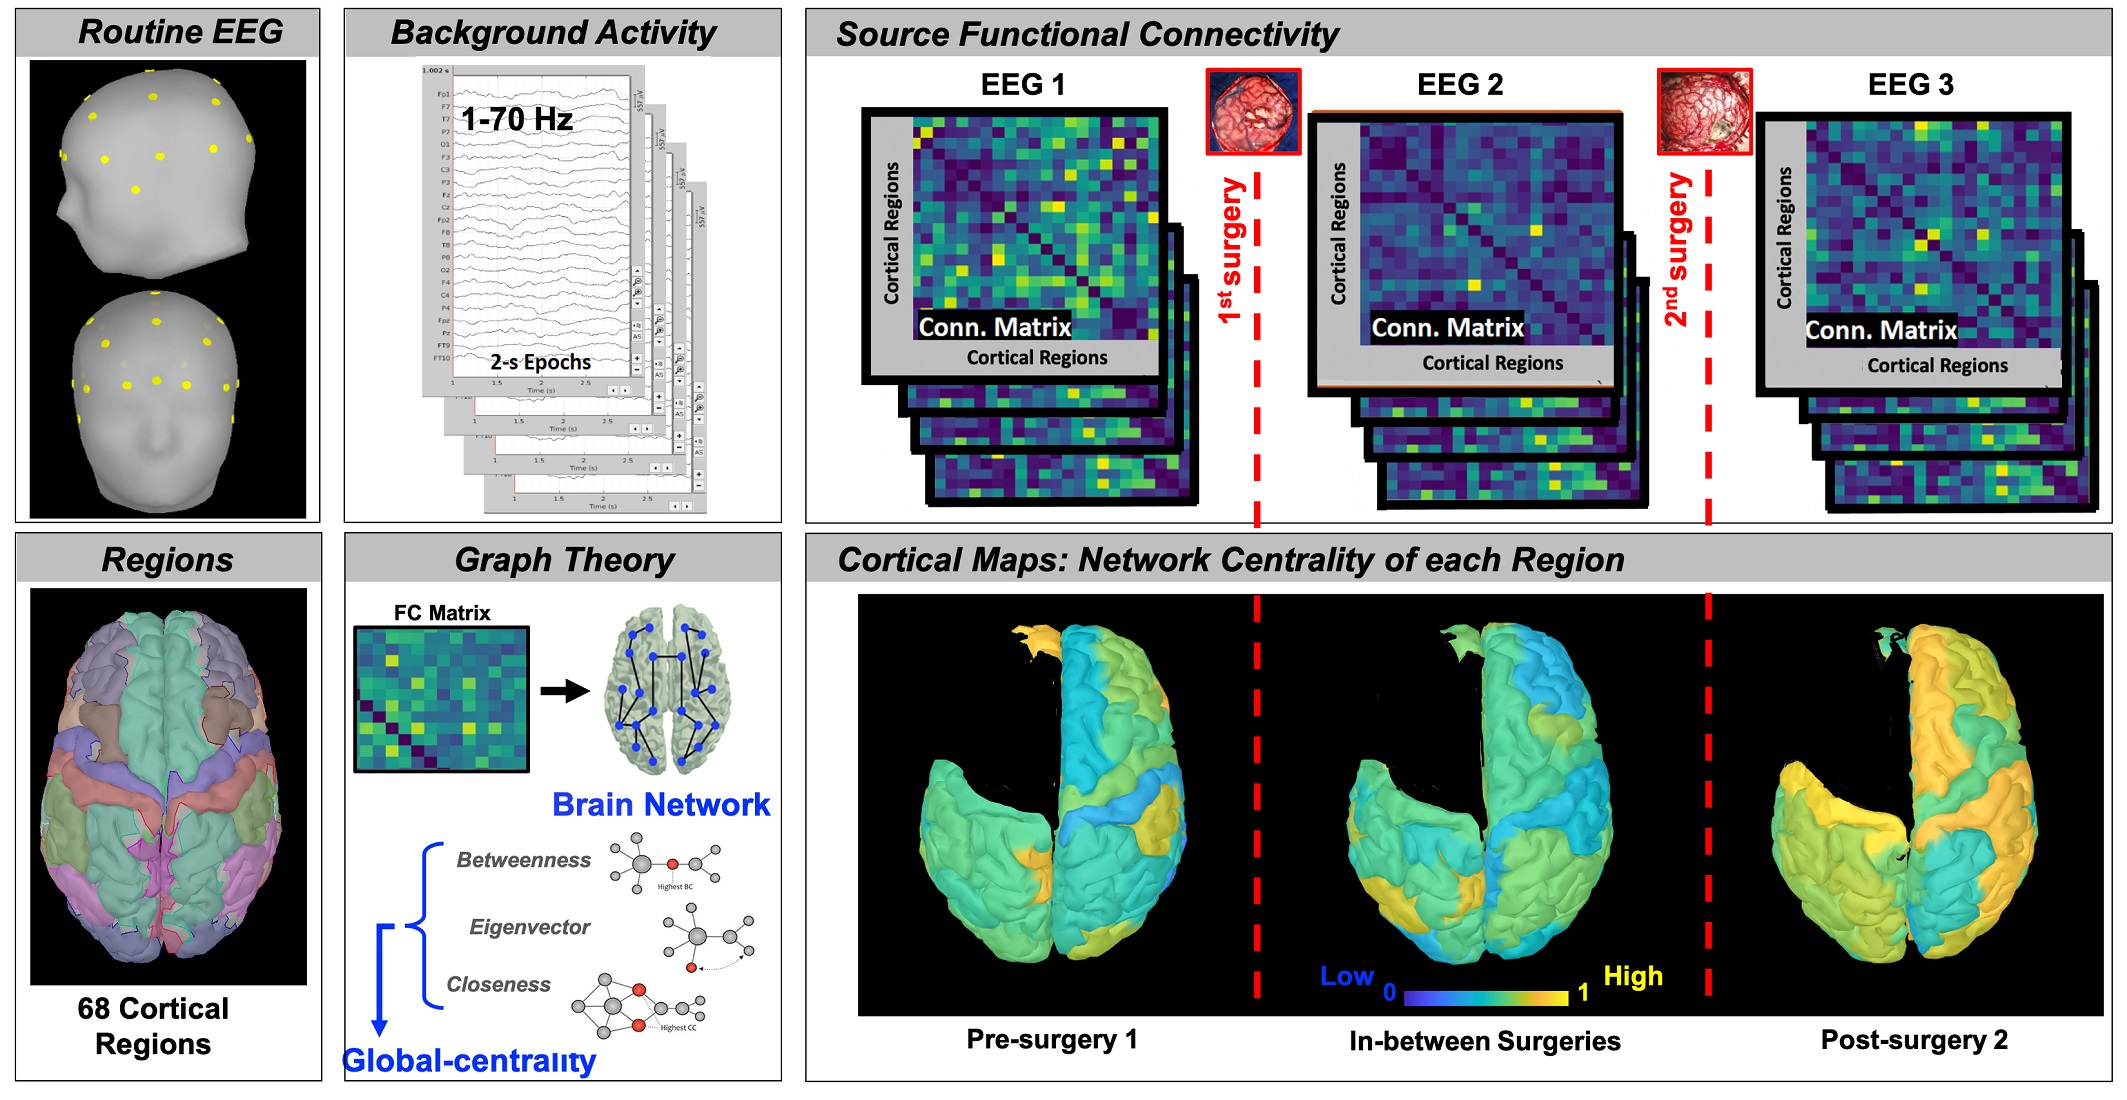
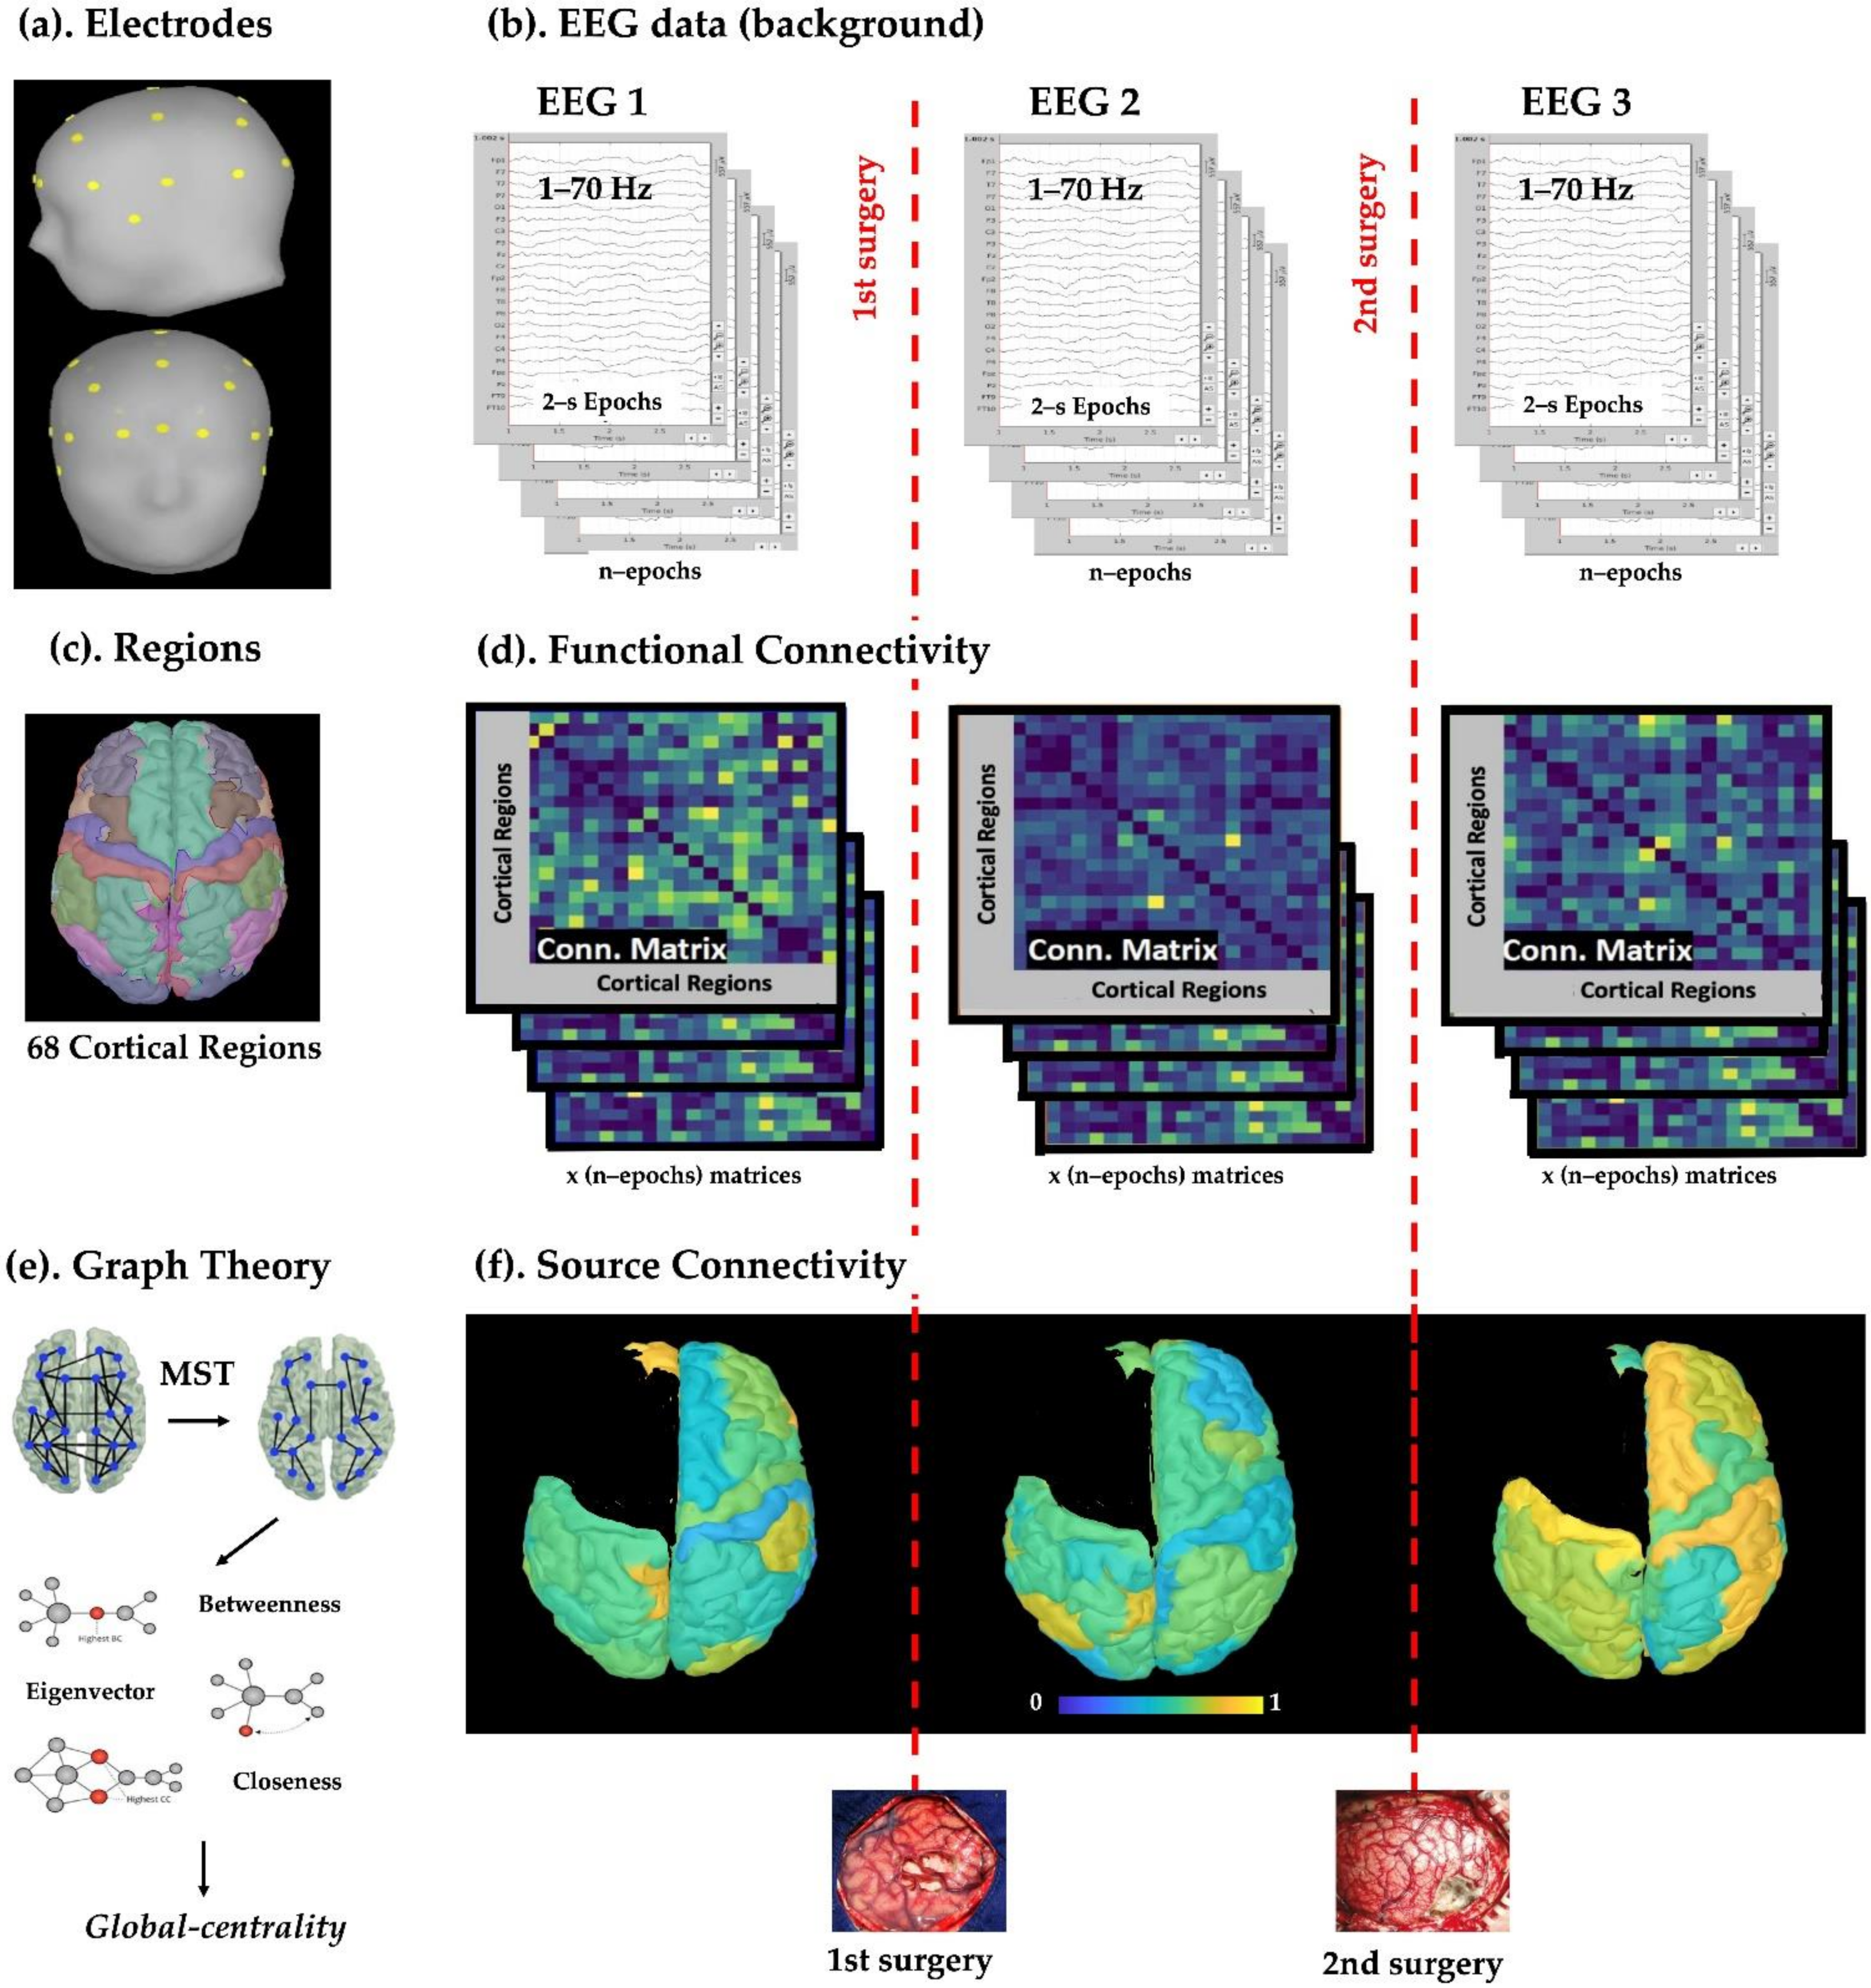
2.2. Scalp EEG Data
2.3. Cortical Parcellation and Regions of Interest
2.4. Estimation of Source Activity and Cortical Parcellation
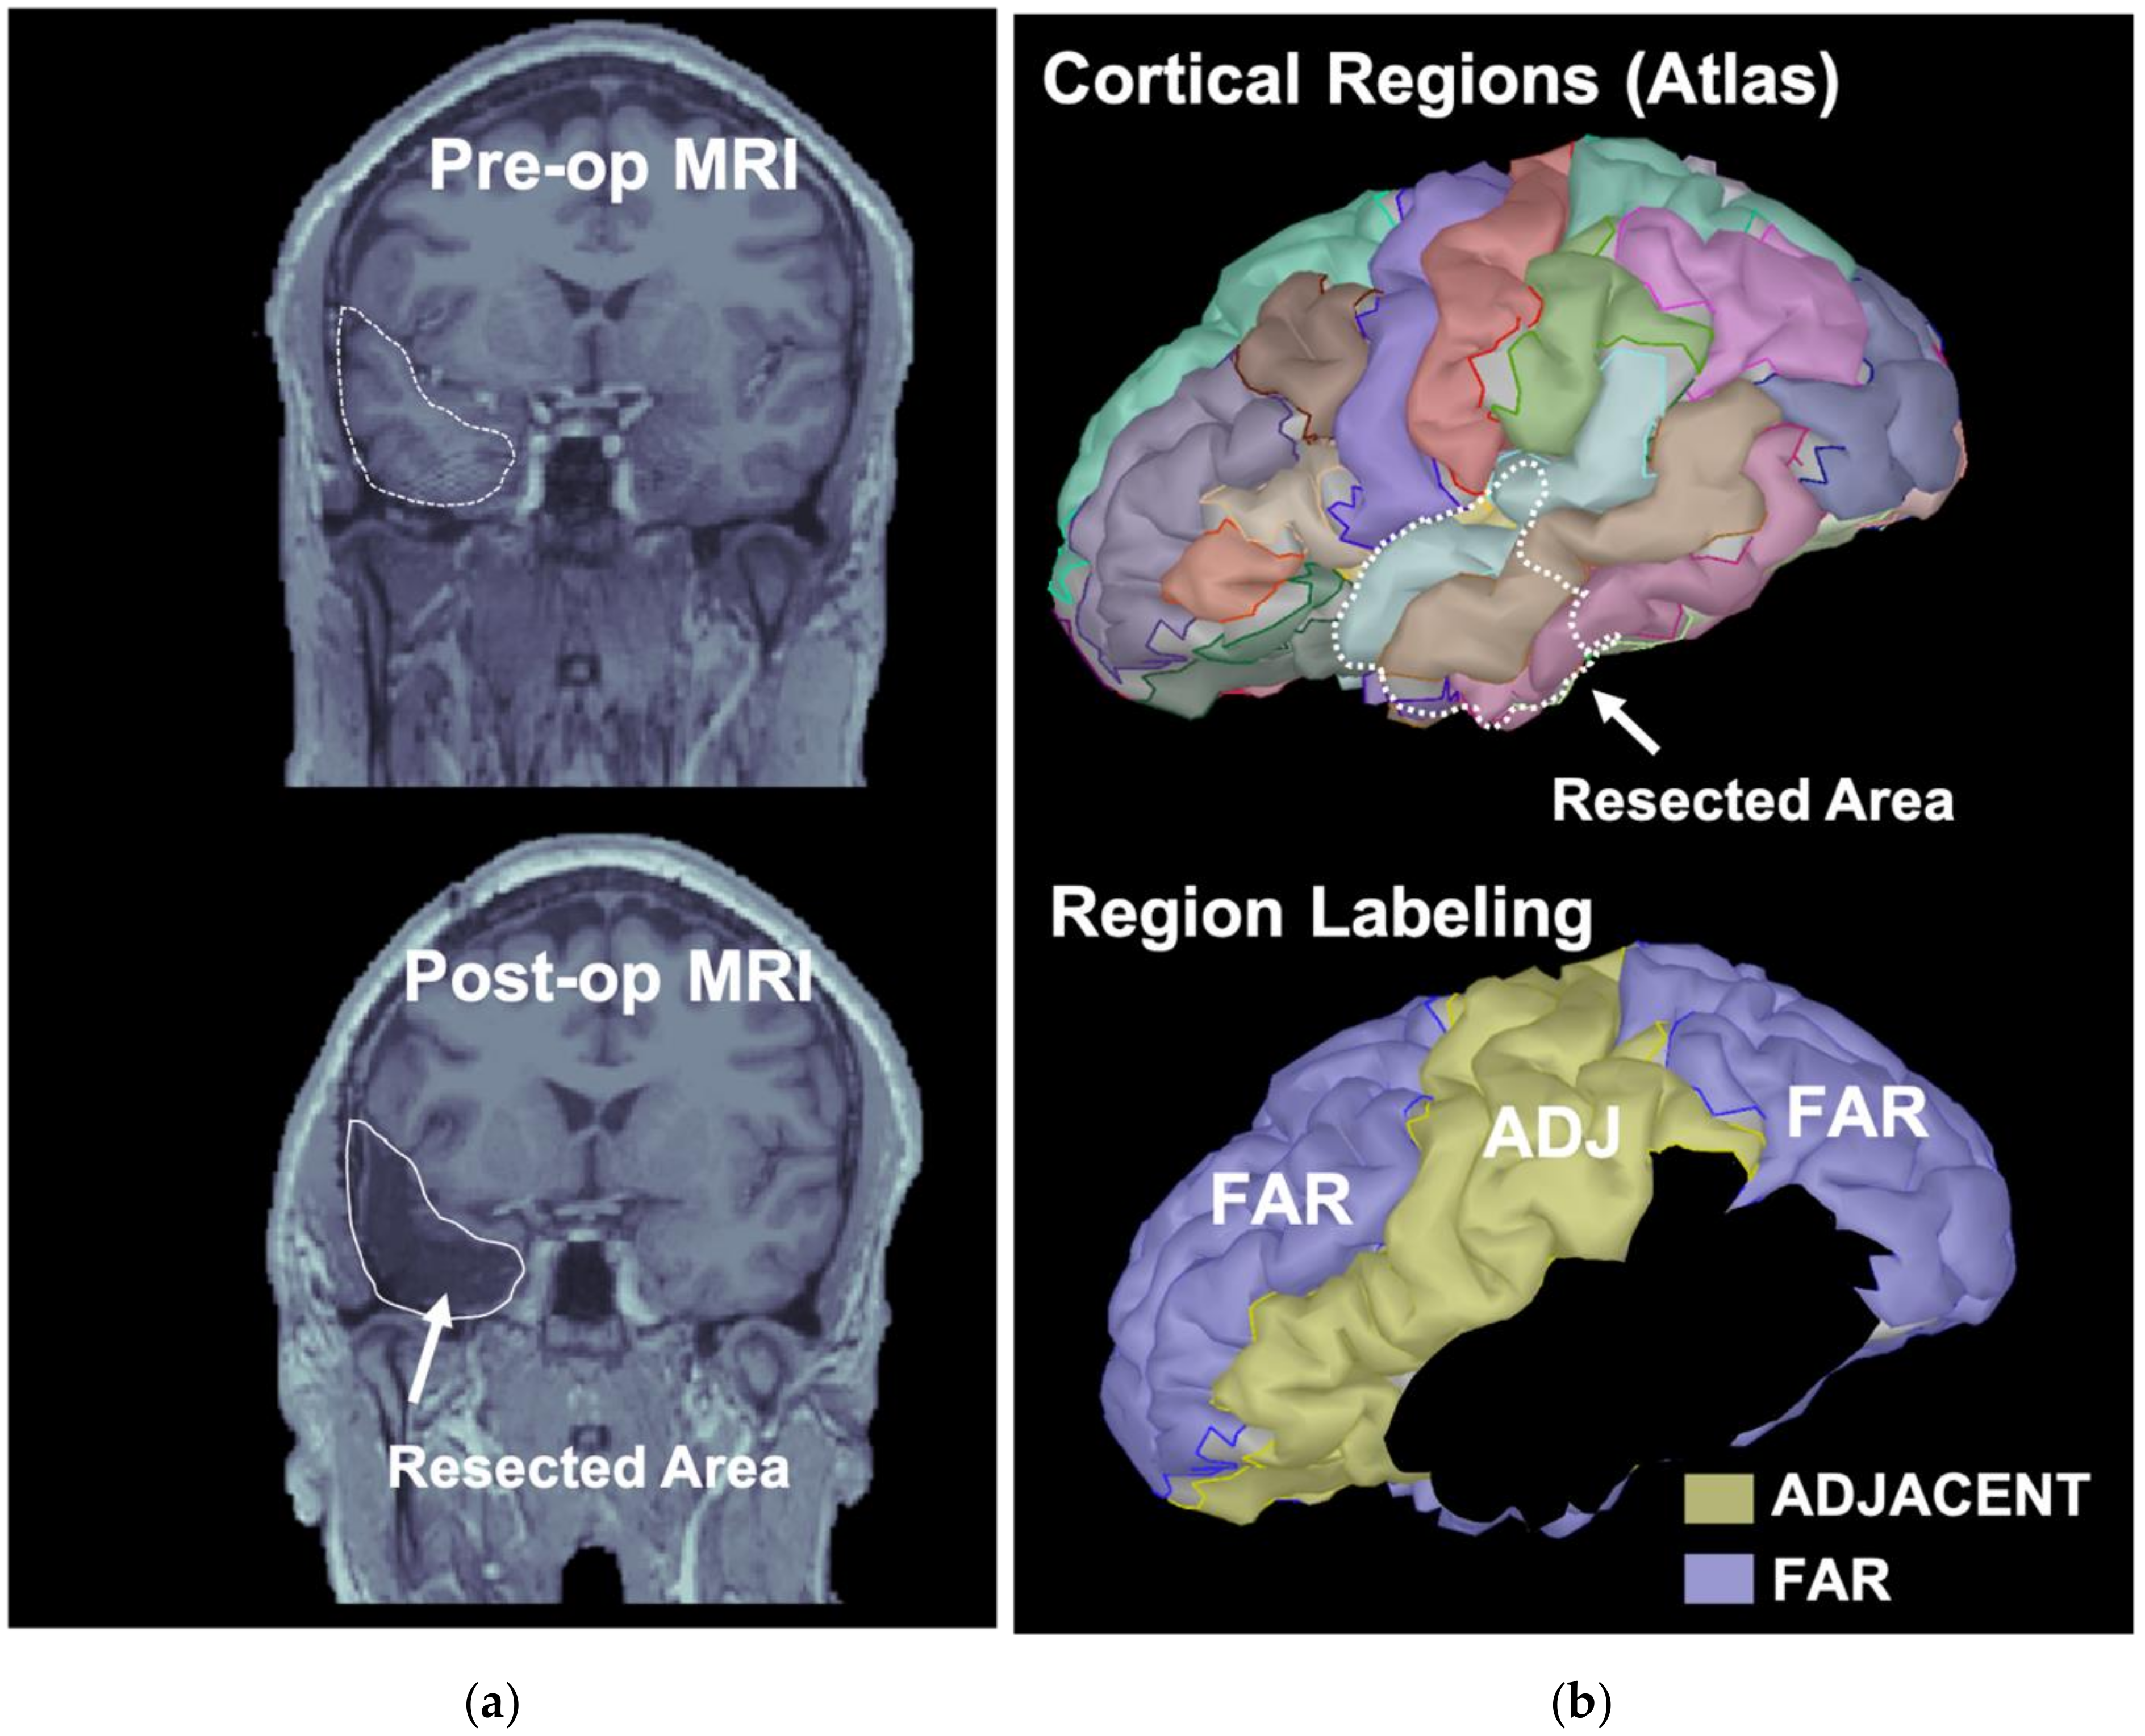
2.5. Classification of ROIs Based on the Resection
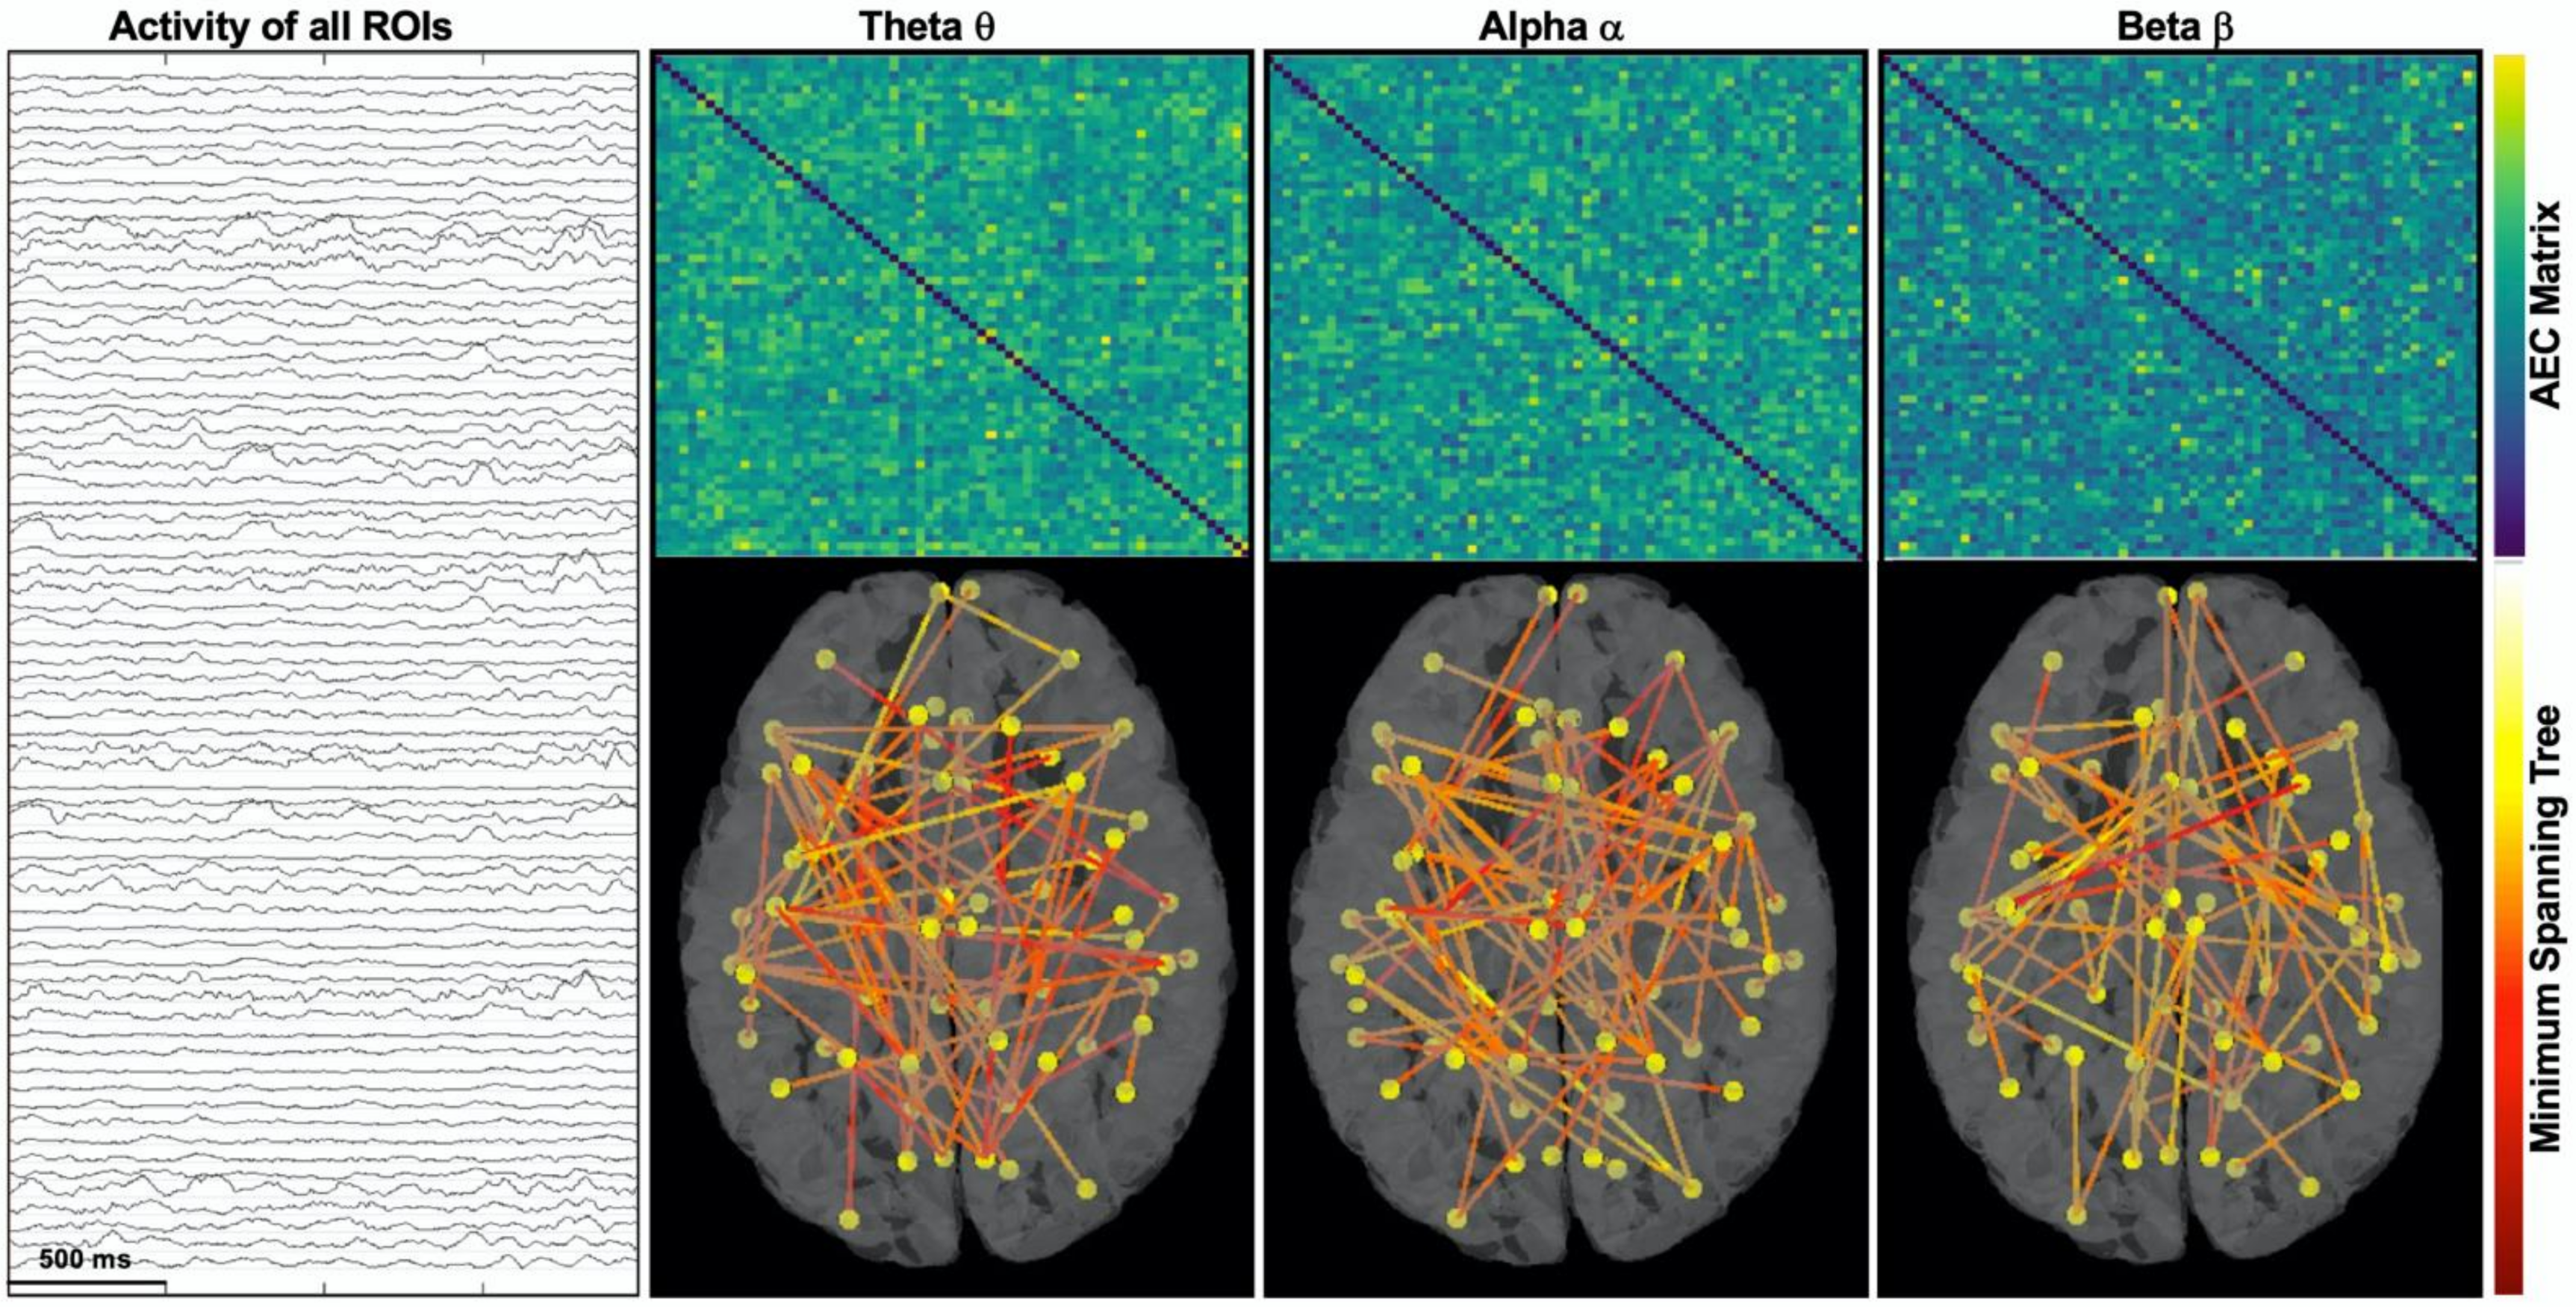
2.6. Functional Connectivity Analysis
- -
- Betweenness centrality measures how often each node appears on the shortest path between two nodes in the graph. In brain network analysis, the BC value of a brain region measures its impact on the flow of information across the brain network.
- -
- Closeness centrality reflects the closeness between a node and other nodes in the brain network. In the brain network analysis, the closeness centrality of a brain region measures its indirect impact on other brain regions.
- -
- Eigenvector centrality is a measure that considers both the quantity and quality of a node’s connections. In fact, it considers both the degree of the node and the degree of its neighbors.
2.7. Statistical Analysis
3. Results
3.1. Patient Cohort
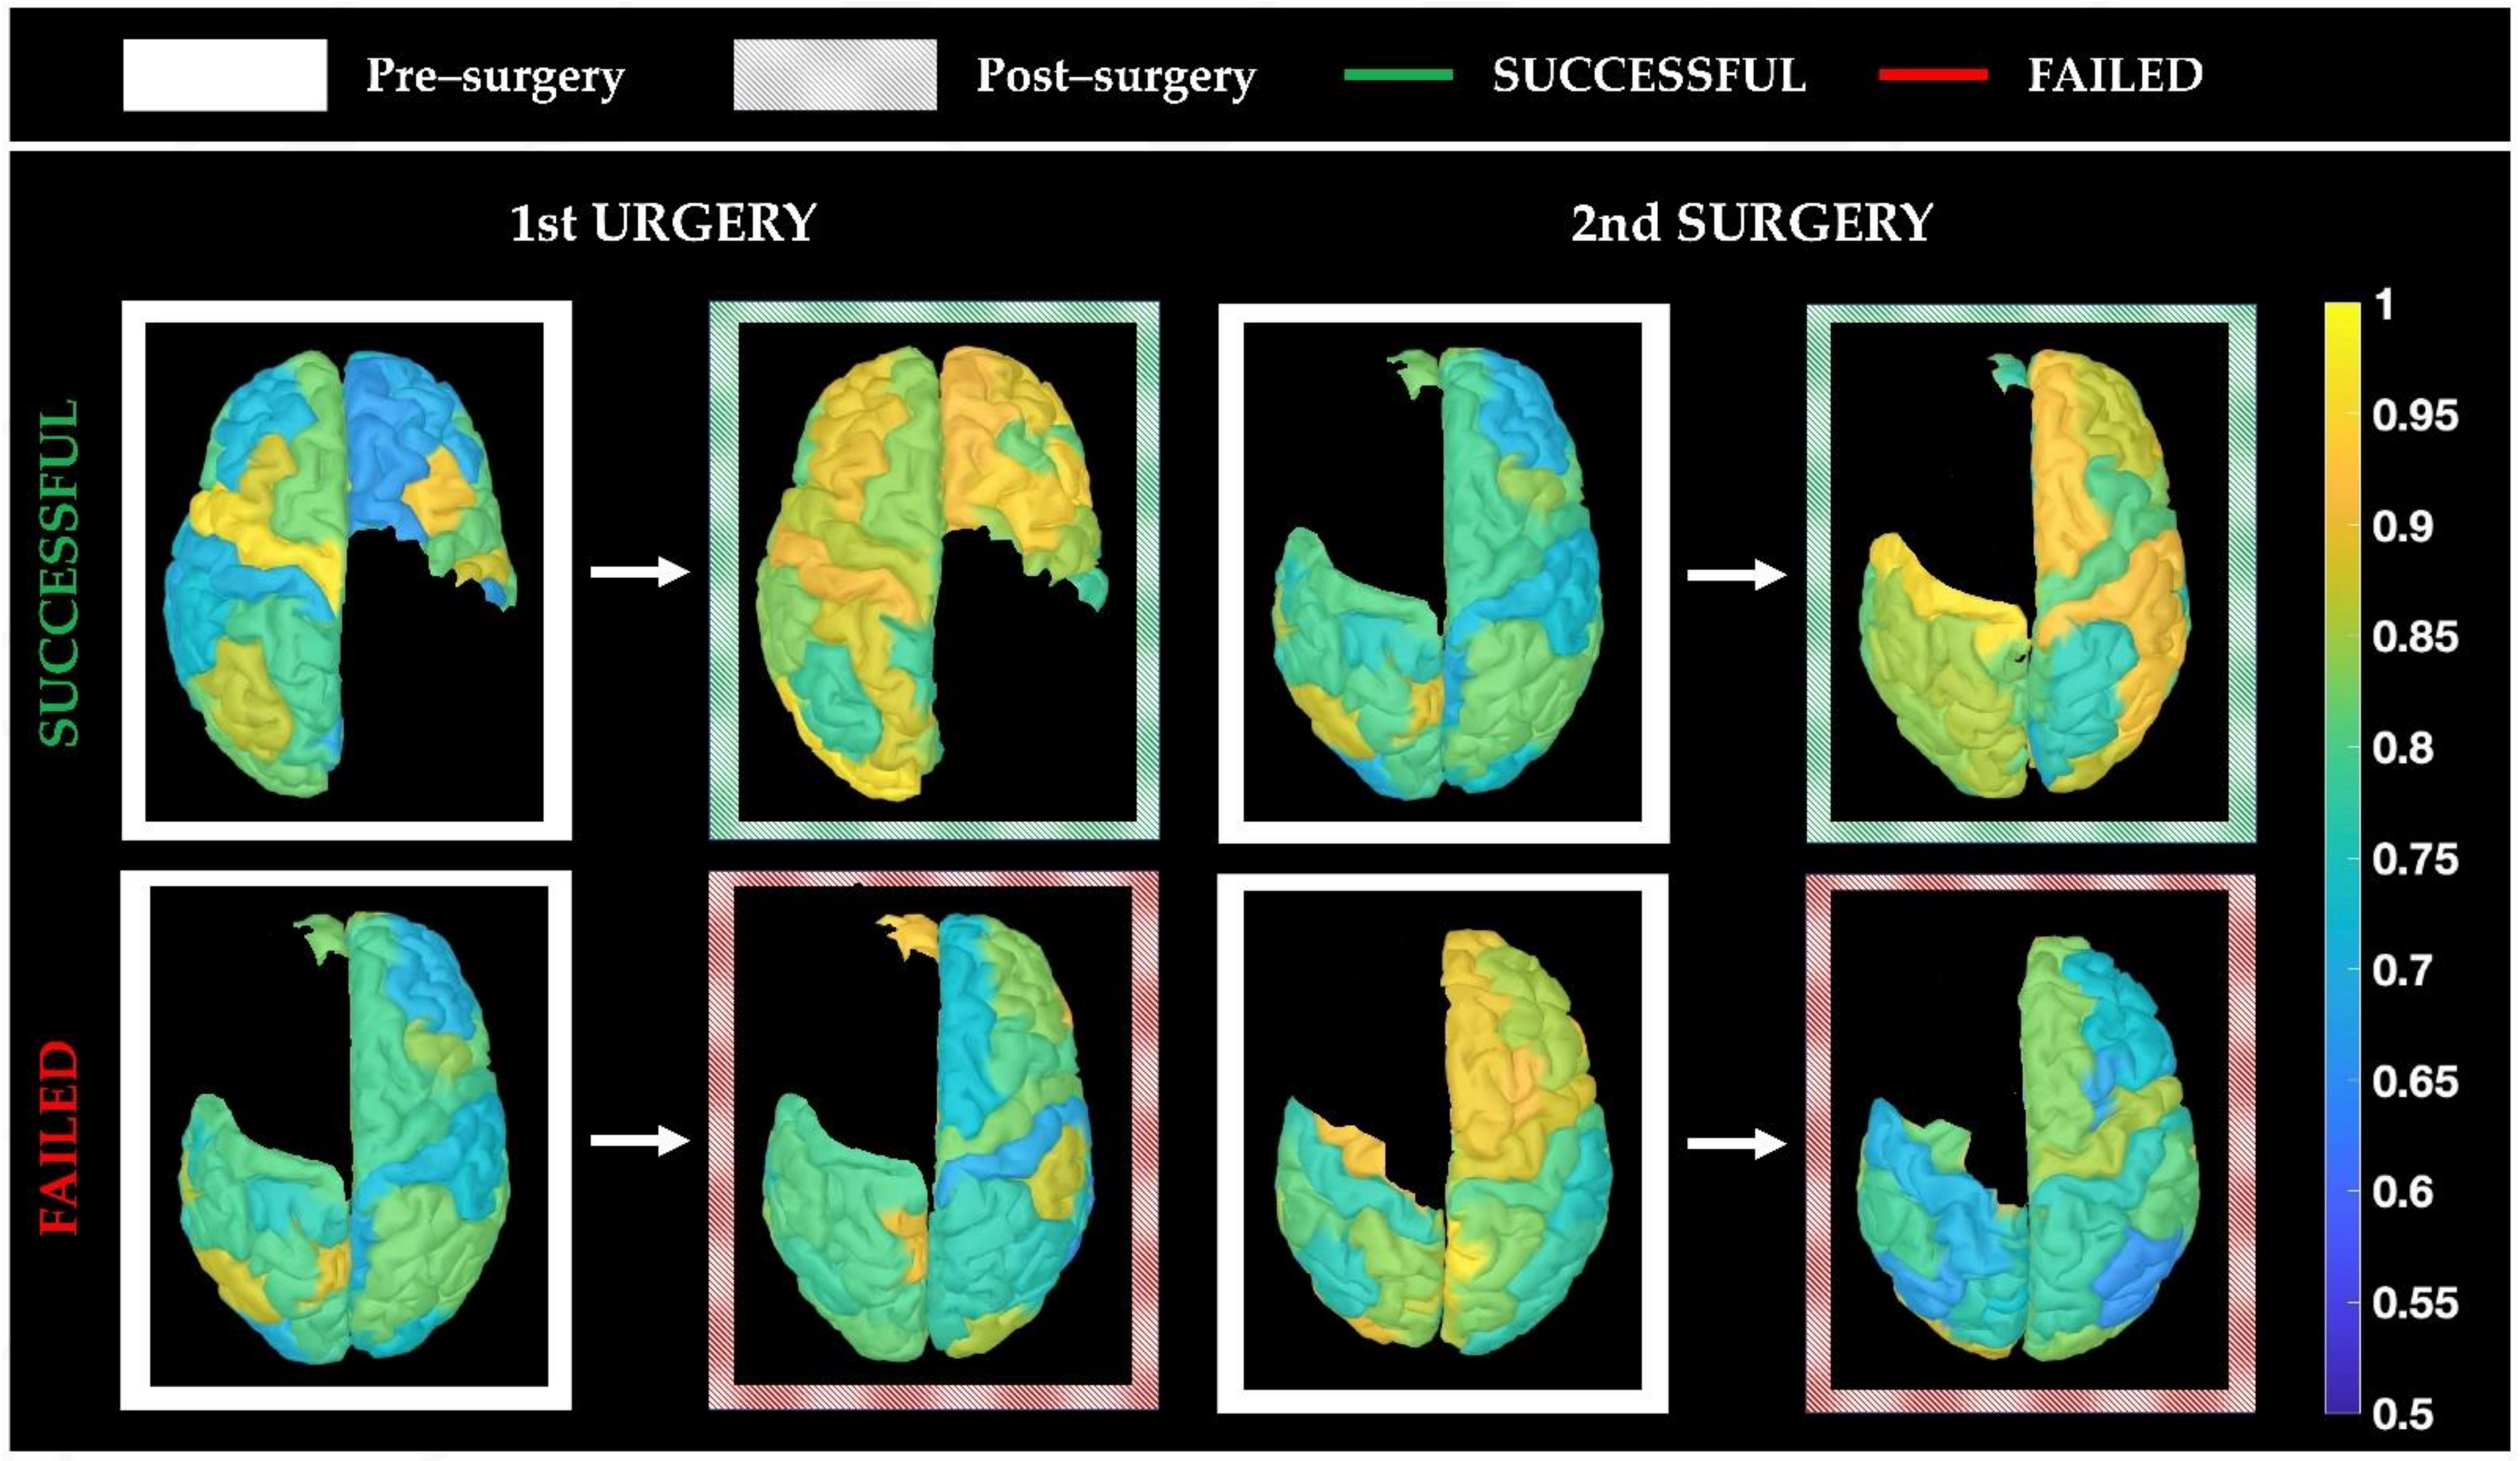
3.2. Functional Connectivity Changes: Pre-Surgical vs. Post-Surgical Centrality
3.3. Correlation with Other Factors (Age, Time Interval, AED, Power)
4. Discussion
4.1. Significance of the Study
4.2. Main Findings: Functional Connectivity Changes in the Two Cohorts of Patients
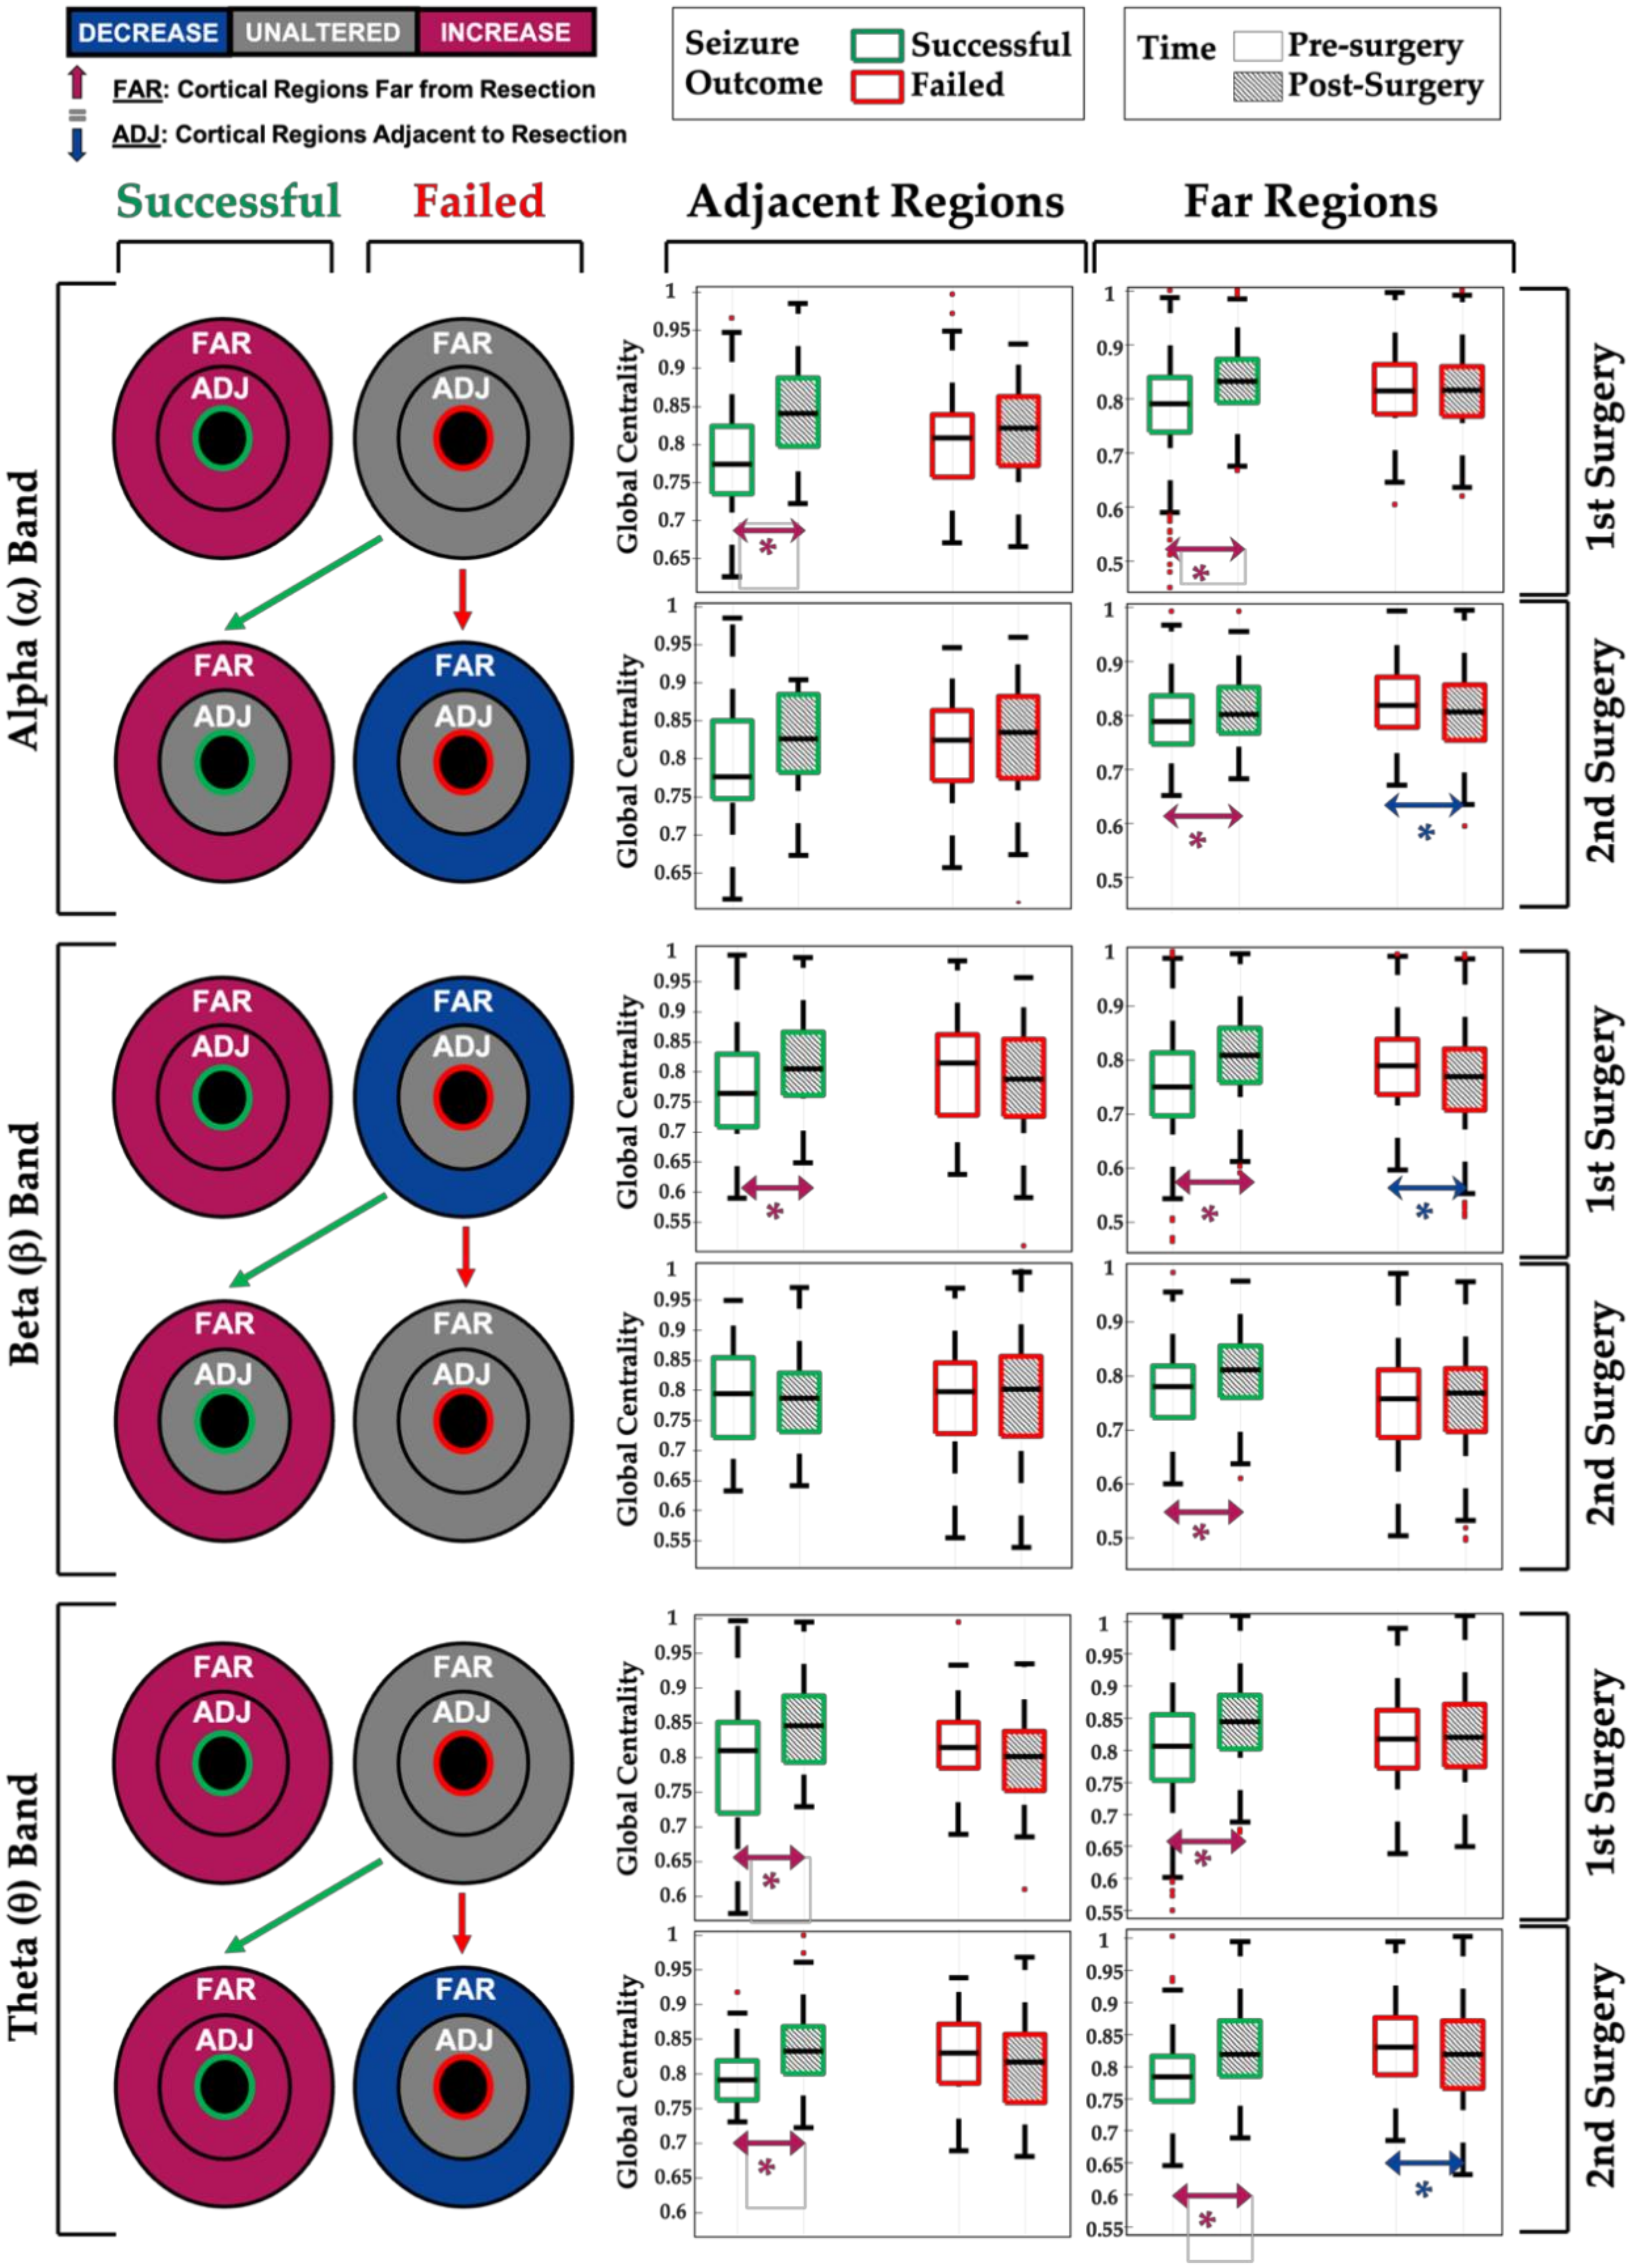
- (i)
- First successful surgeries (seizure-free group) are associated with an increase in the relative centrality of the remaining (untouched) brain regions within the alpha, beta, or theta network (see Figure 5, green boxplots for 1st surgery);
- (ii)
- Post-surgical seizure recurrence (surgery failure) on the other hand, after a first or second epilepsy surgery, is associated with a decrease or no change in the relative centrality of the remaining brain regions within the brain network (see Figure 5, red boxplots);
- (iii)
- When the repeated (2nd) surgery is successful (i.e., is followed by seizure freedom), we observed an increase in network centrality, especially for the cortical regions far from the surgical resection (see Figure 5, green boxplots for 2nd surgery), similar to what is seen in patients who became seizure-free after their first surgery;
- (iv)
- Network changes in the alpha, theta, and beta EEG bands seem to be associated with seizure outcome, as opposed to the changes observed in the delta and gamma bands, which did not correlate with the seizure outcome (see Table 2).
4.3. Methodological Choices: Rationale, Pros, and Cons
4.4. Limitations and Future Directions
5. Conclusions
Author Contributions
Funding
Institutional Review Board Statement
Informed Consent Statement
Data Availability Statement
Acknowledgments
Conflicts of Interest
References
- Sinha, N.; Dauwels, J.; Kaiser, M.; Cash, S.S.; Westover, M.B.; Wang, Y.; Taylor, P.N. Predicting neurosurgical outcomes in focal epilepsy patients using computational modelling. Brain 2017, 140, 319–332. [Google Scholar] [CrossRef]
- Van Diessen, E.; Diederen, S.J.H.; Braun, K.P.J.; Jansen, F.E.; Stam, C.J. Functional and structural brain networks in epilepsy: What have we learned? Epilepsia 2013, 54, 1855–1865. [Google Scholar] [CrossRef]
- Foit, N.A.; Bernasconi, A.; Bernasconi, N. Functional Networks in Epilepsy Presurgical Evaluation. Neurosurg. Clin. N. Am. 2020, 31, 395–405. [Google Scholar] [CrossRef]
- Stefan, H.; da Silva, F.H.L. Epileptic neuronal networks: Methods of identification and clinical relevance. Front. Neurol. 2013, 4, 8. [Google Scholar] [CrossRef]
- Haneef, Z.; Chiang, S. Clinical correlates of graph theory findings in temporal lobe epilepsy. Seizure 2014, 23, 809–818. [Google Scholar] [CrossRef]
- Spencer, S.S. Neural Networks in Human Epilepsy: Evidence of and Implications for Treatment. Clin. Res. 2002, 43, 219–227. [Google Scholar] [CrossRef]
- Wang, Y.; Wang, X.; Mo, J.J.; Sang, L.; Zhao, B.T.; Zhang, C.; Hu, W.H.; Zhang, J.G.; Shao, X.Q.; Zhang, K. Symptomatogenic zone and network of oroalimentary automatisms in mesial temporal lobe epilepsy. Epilepsia 2019, 60, 1150–1159. [Google Scholar] [CrossRef] [PubMed]
- Varela, F.; Lachaux, J.P.; Rodriguez, E.; Martinerie, J. The brainweb: Phase synchronization and large-scale integration. Nat. Rev. Neurosci. 2001, 2, 229–239. [Google Scholar] [CrossRef] [PubMed]
- Liao, W.; Zhang, Z.; Pan, Z.; Mantini, D.; Ding, J.; Duan, X.; Luo, C.; Lu, G.; Chen, H. Altered functional connectivity and small-world in mesial temporal lobe epilepsy. PLoS ONE 2010, 5, e8525. [Google Scholar] [CrossRef]
- Luo, C.; Qiu, C.; Guo, Z.; Fang, J.; Li, Q.; Lei, X.; Xia, Y.; Lai, Y.; Gong, Q.; Zhou, D.; et al. Disrupted functional brain connectivity in partial epilepsy: A resting-state fMRI study. PLoS ONE 2012, 7, e28196. [Google Scholar] [CrossRef] [PubMed][Green Version]
- Haneef, Z.; Lenartowicz, A.; Yeh, H.J.; Levin, H.S.; Engel, J.; Stern, J.M. Functional connectivity of hippocampal networks in temporal lobe epilepsy. Epilepsia 2014, 55, 137–145. [Google Scholar] [CrossRef]
- Haneef, Z.; Lenartowicz, A.; Yeh, H.J.; Engel, J.; Stern, J.M. Network analysis of the default mode network using functional connectivity MRI in temporal lobe epilepsy. J. Vis. Exp. 2014. [Google Scholar] [CrossRef]
- Holmes, M.; Folley, B.S.; Sonmezturk, H.H.; Gore, J.C.; Kang, H.; Abou-Khalil, B.; Morgan, V.L. Resting state functional connectivity of the hippocampus associated with neurocognitive function in left temporal lobe epilepsy. Hum. Brain Mapp. 2014, 35, 735–744. [Google Scholar] [CrossRef] [PubMed]
- Maneshi, M.; Vahdat, S.; Fahoum, F.; Grova, C.; Gotman, J. Specific resting-state brain networks in mesial temporal lobe epilepsy. Front. Neurol. 2014, 5, 127. [Google Scholar] [CrossRef] [PubMed]
- Lagarde, S.; Roehri, N.; Lambert, I.; Trebuchon, A.; McGonigal, A.; Carron, R.; Scavarda, D.; Milh, M.; Pizzo, F.; Colombet, B.; et al. Interictal stereotactic-EEG functional connectivity in refractory focal epilepsies. Brain 2018, 141, 2966–2980. [Google Scholar] [CrossRef] [PubMed]
- Marino, A.C.; Yang, G.J.; Tyrtova, E.; Wu, K.; Zaveri, H.P.; Farooque, P.; Spencer, D.D.; Bandt, S.K. Resting state connectivity in neocortical epilepsy: The epilepsy network as a patient-specific biomarker. Clin. Neurophysiol. 2019, 130, 280–288. [Google Scholar] [CrossRef] [PubMed]
- Quraan, M.A.; McCormick, C.; Cohn, M.; Valiante, T.A.; McAndrews, M.P. Altered Resting State Brain Dynamics in Temporal Lobe Epilepsy Can Be Observed in Spectral Power, Functional Connectivity and Graph Theory Metrics. PLoS ONE 2013, 8, e68609. [Google Scholar] [CrossRef]
- Bettus, G.; Wendling, F.; Guye, M.; Valton, L.; Régis, J.; Chauvel, P.; Bartolomei, F. Enhanced EEG functional connectivity in mesial temporal lobe epilepsy. Epilepsy Res. 2008, 81, 58–68. [Google Scholar] [CrossRef] [PubMed]
- Adebimpe, A.; Aarabi, A.; Bourel-Ponchel, E.; Mahmoudzadeh, M.; Wallois, F. EEG resting state functional connectivity analysis in children with benign epilepsy with centrotemporal spikes. Front. Neurosci. 2016, 10, 143. [Google Scholar] [CrossRef] [PubMed]
- Van Dellen, E.; Douw, L.; Hillebrand, A.; de Witt Hamer, P.C.; Baayen, J.C.; Heimans, J.J.; Reijneveld, J.C.; Stam, C.J. Epilepsy surgery outcome and functional network alterations in longitudinal MEG: A minimum spanning tree analysis. Neuroimage 2014, 86, 354–363. [Google Scholar] [CrossRef]
- Englot, D.J.; Hinkley, L.B.; Kort, N.S.; Imber, B.S.; Mizuiri, D.; Honma, S.M.; Findlay, A.M.; Garrett, C.; Cheung, P.L.; Mantle, M.; et al. Global and regional functional connectivity maps of neural oscillations in focal epilepsy. Brain 2015, 138, 2249–2262. [Google Scholar] [CrossRef]
- Aydin, Ü.; Pellegrino, G.; Ali, O.B.K.B.; Abdallah, C.; Abdallah, C.; Dubeau, F.; Lina, J.M.; Lina, J.M.; Kobayashi, E.; Grova, C.; et al. Magnetoencephalography resting state connectivity patterns as indicatives of surgical outcome in epilepsy patients. J. Neural Eng. 2020, 17, 035007. [Google Scholar] [CrossRef] [PubMed]
- De Palma, L.; De Benedictis, A.; Specchio, N.; Marras, C.E. Epileptogenic Network Formation. Neurosurg. Clin. N. Am. 2020, 31, 335–344. [Google Scholar] [CrossRef]
- Téllez-Zenteno, J.F.; Dhar, R.; Wiebe, S. Long-term seizure outcomes following epilepsy surgery: A systematic review and meta-analysis. Brain 2005, 128, 1188–1198. [Google Scholar] [CrossRef]
- Spencer, S.; Huh, L. Outcomes of epilepsy surgery in adults and children. Lancet Neurol. 2008, 7, 525–537. [Google Scholar] [CrossRef]
- Ramantani, G.; Strobl, K.; Stathi, A.; Brandt, A.; Schubert-Bast, S.; Wiegand, G.; Korinthenberg, R.; Stephani, U.; Van Velthoven, V.; Zentner, J.; et al. Reoperation for refractory epilepsy in childhood: A second chance for selected patients. Neurosurgery 2013, 73, 695–704. [Google Scholar] [CrossRef]
- Shaver, E.G.; Harvey, A.S.; Morrison, G.; Prats, A.; Jayakar, P.; Dean, P.; Duchowny, M. Results and complications after reoperation for failed epilepsy surgery in children. Pediatr. Neurosurg. 1997, 27, 194–202. [Google Scholar] [CrossRef]
- Muthaffar, O.; Puka, K.; Rubinger, L.; Go, C.; Snead, O.C.; Rutka, J.T.; Widjaja, E. Reoperation after failed resective epilepsy surgery in children. J. Neurosurg. Pediatr. 2017, 20, 134–140. [Google Scholar] [CrossRef] [PubMed]
- Grote, A.; Witt, J.A.; Surges, R.; Von Lehe, M.; Pieper, M.; Elger, C.E.; Helmstaedter, C.; Ormond, D.R.; Schramm, J.; Delev, D. A second chance-reoperation in patients with failed surgery for intractable epilepsy: Long-term outcome, neuropsychology and complications. J. Neurol. Neurosurg. Psychiatry 2016, 87, 379–385. [Google Scholar] [CrossRef] [PubMed]
- Schoffelen, J.M.; Gross, J. Source connectivity analysis with MEG and EEG. Hum. Brain Mapp. 2009, 30, 1857–1865. [Google Scholar] [CrossRef]
- Tamilia, E.; AlHilani, M.; Tanaka, N.; Tsuboyama, M.; Peters, J.M.; Grant, P.E.; Madsen, J.R.; Stufflebeam, S.M.; Pearl, P.L.; Papadelis, C. Assessing the localization accuracy and clinical utility of electric and magnetic source imaging in children with epilepsy. Clin. Neurophysiol. 2019, 130, 491–504. [Google Scholar] [CrossRef]
- Tamilia, E.; Dirodi, M.; Alhilani, M.; Grant, P.E.; Madsen, J.R.; Stufflebeam, S.M.; Pearl, P.L.; Papadelis, C. Scalp ripples as prognostic biomarkers of epileptogenicity in pediatric surgery. Ann. Clin. Transl. Neurol. 2020, 7, 329–342. [Google Scholar] [CrossRef] [PubMed]
- Ricci, L.; Tamilia, E.; Alhilani, M.; Alter, A.; Scott Perry, Μ.; Madsen, J.R.; Peters, J.M.; Pearl, P.L.; Papadelis, C. Source imaging of seizure onset predicts surgical outcome in pediatric epilepsy. Clin. Neurophysiol. 2021, 132, 1622–1635. [Google Scholar] [CrossRef]
- Zijlmans, M.; Zweiphenning, W.; van Klink, N. Changing concepts in presurgical assessment for epilepsy surgery. Nat. Rev. Neurol. 2019, 15, 594–606. [Google Scholar] [CrossRef]
- Alstott, J.; Breakspear, M.; Hagmann, P.; Cammoun, L.; Sporns, O. Modeling the impact of lesions in the human brain. PLoS Comput. Biol. 2009, 5, e1000408. [Google Scholar] [CrossRef]
- Kramer, M.A.; Cash, S.S. Epilepsy as a disorder of cortical network organization. Neuroscientist 2012, 18, 360–372. [Google Scholar] [CrossRef] [PubMed]
- Van Diessen, E.; Zweiphenning, W.J.E.M.; Jansen, F.E.; Stam, C.J.; Braun, K.P.J.; Otte, W.M. Brain network organization in focal epilepsy: A systematic review and meta-analysis. PLoS ONE 2014, 9, e114606. [Google Scholar] [CrossRef] [PubMed]
- Bullmore, E.; Sporns, O. Complex brain networks: Graph theoretical analysis of structural and functional systems. Nat. Rev. Neurosci. 2009, 10, 186–198. [Google Scholar] [CrossRef]
- Van Straaten, E.C.W.; Stam, C.J. Structure out of chaos: Functional brain network analysis with EEG, MEG, and functional MRI. Eur. Neuropsychopharmacol. 2013, 23, 7–18. [Google Scholar] [CrossRef]
- Lang, E.W.; Tomé, A.M.; Keck, I.R.; Górriz-Sáez, J.M.; Puntonet, C.G. Brain connectivity analysis: A short survey. Comput. Intell. Neurosci. 2012. [Google Scholar] [CrossRef] [PubMed]
- Dale, A.M.; Fischl, B.; Sereno, M.I. Cortical surface-based analysis: I. Segmentation and surface reconstruction. Neuroimage 1999, 9, 179–194. [Google Scholar] [CrossRef] [PubMed]
- Zöllei, L.; Iglesias, J.E.; Ou, Y.; Grant, P.E.; Fischl, B. Infant FreeSurfer: An automated segmentation and surface extraction pipeline for T1-weighted neuroimaging data of infants 0–2 years. Neuroimage 2020, 218, 116946. [Google Scholar] [CrossRef] [PubMed]
- Desikan, R.S.; Ségonne, F.; Fischl, B.; Quinn, B.T.; Dickerson, B.C.; Blacker, D.; Buckner, R.L.; Dale, A.M.; Maguire, R.P.; Hyman, B.T.; et al. An automated labeling system for subdividing the human cerebral cortex on MRI scans into gyral based regions of interest. Neuroimage 2006, 31, 968–980. [Google Scholar] [CrossRef]
- Tadel, F.; Baillet, S.; Mosher, J.; Pantazis, D.; Leahy, R. Brainstorm: A user-friendly application for MEG/EEG analysis. Comput. Intell. Neurosci. 2011. [Google Scholar] [CrossRef]
- Ntolkeras, G.; Tamilia, E.; AlHilani, M.; Bolton, J.; Ellen Grant, P.; Prabhu, S.P.; Madsen, J.R.; Stufflebeam, S.M.; Pearl, P.L.; Papadelis, C. Presurgical accuracy of dipole clustering in MRI-negative pediatric patients with epilepsy: Validation against intracranial EEG and resection. Clin. Neurophysiol. 2021. [Google Scholar] [CrossRef] [PubMed]
- Ricci, L.; Assenza, G.; Pulitano, P.; Simonelli, V.; Vollero, L.; Lanzone, J.; Mecarelli, O.; Di Lazzaro, V.; Tombini, M. Measuring the effects of first antiepileptic medication in Temporal Lobe Epilepsy: Predictive value of quantitative-EEG analysis. Clin. Neurophysiol. 2021, 132, 25–35. [Google Scholar] [CrossRef] [PubMed]
- Tamilia, E.; Matarrese, M.A.G.; Ntolkeras, G.; Grant, P.E.; Madsen, J.R.; Stufflebeam, S.M.; Pearl, P.L.; Papadelis, C. Noninvasive Mapping of Ripple Onset Predicts Outcome in Epilepsy Surgery. Ann. Neurol. 2021, 89, 911–925. [Google Scholar] [CrossRef]
- Hipp, J.F.; Hawellek, D.J.; Corbetta, M.; Siegel, M.; Engel, A.K. Large-scale cortical correlation structure of spontaneous oscillatory activity. Nat. Neurosci. 2012, 15, 884–890. [Google Scholar] [CrossRef]
- Brookes, M.J.; Woolrich, M.; Luckhoo, H.; Price, D.; Hale, J.R.; Stephenson, M.C.; Barnes, G.R.; Smith, S.M.; Morris, P.G. Investigating the electrophysiological basis of resting state networks using magnetoencephalography. Proc. Natl. Acad. Sci. USA 2011, 108, 16783–16788. [Google Scholar] [CrossRef]
- Colclough, G.L.; Woolrich, M.W.; Tewarie, P.K.; Brookes, M.J.; Quinn, A.J.; Smith, S.M. How reliable are MEG resting-state connectivity metrics? Neuroimage 2016, 138, 284–293. [Google Scholar] [CrossRef]
- Van Dellen, E.; Hillebrand, A.; Douw, L.; Heimans, J.J.; Reijneveld, J.C.; Stam, C.J. Local polymorphic delta activity in cortical lesions causes global decreases in functional connectivity. Neuroimage 2013, 83, 524–532. [Google Scholar] [CrossRef] [PubMed]
- Luo, C.; An, D.; Yao, D.; Gotman, J. Patient-specific connectivity pattern of epileptic network in frontal lobe epilepsy. NeuroImage Clin. 2014, 4, 668–675. [Google Scholar] [CrossRef] [PubMed][Green Version]
- Nissen, I.A.; van Klink, N.E.C.; Zijlmans, M.; Stam, C.J.; Hillebrand, A. Brain areas with epileptic high frequency oscillations are functionally isolated in MEG virtual electrode networks. Clin. Neurophysiol. 2016, 127, 2581–2591. [Google Scholar] [CrossRef]
- Voets, N.L.; Beckmann, C.F.; Cole, D.M.; Hong, S.; Bernasconi, A.; Bernasconi, N. Structural substrates for resting network disruption in temporal lobe epilepsy. Brain 2012, 135, 2350–2357. [Google Scholar] [CrossRef]
- Palva, S.; Palva, J.M. Discovering oscillatory interaction networks with M/EEG: Challenges and breakthroughs. Trends Cogn. Sci. 2012, 16, 219–230. [Google Scholar] [CrossRef] [PubMed]
- Hedrich, T.; Pellegrino, G.; Kobayashi, E.; Lina, J.M.; Grova, C. Comparison of the spatial resolution of source imaging techniques in high-density EEG and MEG. Neuroimage 2017, 157, 531–544. [Google Scholar] [CrossRef]
- Juárez-Martinez, E.L.; Nissen, I.A.; Idema, S.; Velis, D.N.; Hillebrand, A.; Stam, C.J.; van Straaten, E.C.W. Virtual localization of the seizure onset zone: Using non-invasive MEG virtual electrodes at stereo-EEG electrode locations in refractory epilepsy patients. NeuroImage Clin. 2018, 19, 758–766. [Google Scholar] [CrossRef]
- Pellegrino, G.; Mecarelli, O.; Pulitano, P.; Tombini, M.; Ricci, L.; Lanzone, J.; Brienza, M.; Davassi, C.; Di Lazzaro, V.; Assenza, G. Eslicarbazepine Acetate Modulates EEG Activity and Connectivity in Focal Epilepsy. Front. Neurol. 2018, 9, 1054. [Google Scholar] [CrossRef]


| Age (Y) | No. AED | Resection (Side Lobe) | ||||||||||
|---|---|---|---|---|---|---|---|---|---|---|---|---|
| Surgery | EEG | Surgery | ||||||||||
| Pt/Sex | Gr. | Epi. Ons | 1st | 2nd | Etiology | Pathology (Histology) | 1st | 2nd | 3rd | 1st | 2nd | Engel a |
| 1/Fe | RS | 3 | 5.3 | 6.7 | FCD | FCD 2A | 3 | 2 | 1 | L-T | L-T | I |
| 2/M | RS | 4 | 16.8 | 19.8 | Unknown | Gliosis | 2 | 3 | 0 | L-F | L-F | I |
| 3/Fe | RS | 0.7 | 1.7 | 2.5 | Polymicrogyria | FCD 2A, Gliosis, Fused Sulci, WM heteropia | 3 | 3 | 2 | L-F | L-F | III |
| 4/M | RS | 1.5 | 5.4 | 7.3 | FCD | FCD 2B, Gliosis | 4 | 4 | 4 | L-F | L-F | II |
| 5/M | RS | 10 | 15.5 | 17.4 | Low grade glioma + developmental venous anomaly | Low grade glioma, dysplastic features | 1 | 2 | 2 | R-T | R-C | II |
| 6/Fe | RS | 0.8 | 11.3 | 12.8 | Unknown | Oligodendroglial hyperplasia | 2 | 2 | 2 | R-T | R-T | IV |
| 7/M | RS | 10 | 11.3 | 12.0 | Sphenoidal encephalocele | Dysplastic features, Gliosis | 2 | 2 | 3 | L-T | L-T | II |
| 8/Fe | RS | 0 | 2.1 | 2.6 | TSC | Consistent w/TSC | 2 | 3 | 2 | R-F | R-PF | IV |
| 9/M | RS | 3 | 4.0 | 5.1 | FCD | FCD 2A, MST | 2 | 2 | 1 | R-T | R-T | I |
| 10/M | SF | 9 | 17.4 | n/a | Neoplasm | Ganglioma, FCD 1 | 3 | 3 | na | L-T | na | I |
| 11/Fe | SF | 16 | 18.2 | n/a | Unknown | Gliosis | 2 | 1 | na | L-T | na | I |
| 12/M | SF | 5 | 5.5 | n/a | Lesion suggestive of DNET | Angiocentric glioma | 4 | 0 | na | L-C | na | I |
| 13/M | SF | 1.5 | 12.5 | n/a | MTS | FCD 2A | 3 | 2 | na | L-T | na | I |
| 14/M | SF | 8 | 9.8 | n/a | Polymicrogyria | Mild dysplastic features | 2 | 3 | na | L-P | na | I |
| 15/M | SF | 6 | 14.8 | n/a | FCD | na b | 3 | 3 | na | R-F | na | I |
| 16/M | SF | 8 | 10.0 | n/a | Posterior cerebralartery infarct (PCA) | Consistent w/PCA encephalomalacia, FCD 2D | 2 | 2 | na | R-O | na | I |
| 17/Fe | SF | 17 | 21 | n/a | TBI | Consistent w/TBI | 2 | 3 | na | R-T | na | I |
| 18/Fe | SF | 12 | 18 | n/a | Unknown | MTS, gliosis, oligodendroglial hyperplasia | 1 | 0 | na | L-T | na | I |
| 19/M | SF | 13 | 14.2 | n/a | Low grade tumor | DNET | 5 | 2 | na | L-T | na | I |
| 20/Fe | SF | 0.6 | 16.1 | n/a | MTS + FCD | MST, FCD 2A | 2 | 1 | na | L-T | na | I |
| 21/M | SF | 5 | 10.8 | n/a | Unknown | na b | 1 | 1 | na | R-P | na | I |
| 1st Surgery | 2nd (Repeated) Surgery | ||||
|---|---|---|---|---|---|
| Frequency | Areas | Successful (SF Group) | Failed (RS Group) | Successful (RS Group) | Failed (RS Group) |
| Delta (δ) | FAR | p < 0.001 * (increase) | p < 0.001 * (increase) | p = 0.3 (no change) | p < 0.001 * (decrease) |
| ADJACENT | p < 0.001 * (increase) | p = 0.04 * (decrease) | p = 0.5 (no change) | p = 0.2 (no change) | |
| Theta (θ) | FAR | p < 0.001 * (increase) | p = 0.1 (no change) | p < 0.001 * (increase) | p = 0.01 * (decrease) |
| ADJACENT | p < 0.001 * (increase) | p = 0.06 (no change) | p = 0.02 * (increase) | p = 0.4 (no change) | |
| Alpha (α) | FAR | p < 0.001 * (increase) | p = 0.8 (no change) | p = 0.01 * (increase) | p = 0.004 * (decrease) |
| ADJACENT | p < 0.001 * (increase) | p = 0.4 (no change) | p = 0.2 (no change) | p = 0.4 (no change) | |
| Beta (β) | FAR | p < 0.001 * (increase) | p < 0.001 * (decrease) | p < 0.001 * (increase) | p = 0.3 (no change) |
| ADJACENT | p < 0.001 * (increase) | p = 0.2 (no change) | p = 0.8 (no change) | p = 0.4 (no change) | |
| Gamma (γ) | FAR | p = 0.001 * (increase) | p < 0.001 * (decrease) | p = 0.4 (no change) | p < 0.01 * (increase) |
| ADJ | p = 0.06 (no change) | p = 0.6 (no change) | p = 0.009 * (decrease) | p = 0.9 (no change) | |
Publisher’s Note: MDPI stays neutral with regard to jurisdictional claims in published maps and institutional affiliations. |
© 2021 by the authors. Licensee MDPI, Basel, Switzerland. This article is an open access article distributed under the terms and conditions of the Creative Commons Attribution (CC BY) license (https://creativecommons.org/licenses/by/4.0/).
Share and Cite
Iandolo, G.; Chourasia, N.; Ntolkeras, G.; Madsen, J.R.; Papadelis, C.; Grant, E.; Pearl, P.L.; Taffoni, F.; Tamilia, E. Changes in the Functional Brain Network of Children Undergoing Repeated Epilepsy Surgery: An EEG Source Connectivity Study. Diagnostics 2021, 11, 1234. https://doi.org/10.3390/diagnostics11071234
Iandolo G, Chourasia N, Ntolkeras G, Madsen JR, Papadelis C, Grant E, Pearl PL, Taffoni F, Tamilia E. Changes in the Functional Brain Network of Children Undergoing Repeated Epilepsy Surgery: An EEG Source Connectivity Study. Diagnostics. 2021; 11(7):1234. https://doi.org/10.3390/diagnostics11071234
Chicago/Turabian StyleIandolo, Giulia, Nitish Chourasia, Georgios Ntolkeras, Joseph R. Madsen, Christos Papadelis, Ellen Grant, Phillip L. Pearl, Fabrizio Taffoni, and Eleonora Tamilia. 2021. "Changes in the Functional Brain Network of Children Undergoing Repeated Epilepsy Surgery: An EEG Source Connectivity Study" Diagnostics 11, no. 7: 1234. https://doi.org/10.3390/diagnostics11071234
APA StyleIandolo, G., Chourasia, N., Ntolkeras, G., Madsen, J. R., Papadelis, C., Grant, E., Pearl, P. L., Taffoni, F., & Tamilia, E. (2021). Changes in the Functional Brain Network of Children Undergoing Repeated Epilepsy Surgery: An EEG Source Connectivity Study. Diagnostics, 11(7), 1234. https://doi.org/10.3390/diagnostics11071234