
Comprehensive Survey of Using Machine Learning in the COVID-19 Pandemic

 ,
,  ,
,  ,
,  ,
,  and
and
Abstract
:1. Introduction
- We discuss the detailed characteristics of COVID-19 symptoms, behaviors, and patterns.
- We investigate the role of automated analysis and diagnosis of COVID-19 based on the WHO statistics worldwide.
- We propose a taxonomy for using AI, big data, and statistics in COVID-19 diagnosis, prediction, and treatment. Based on this taxonomy, a comprehensive survey of current AI literature is provided.
- We collect the details about all available COVID-19 datasets (i.e., textual data, medical images, and speech data).
- We explore the limitations of the current literature of AI applications in the COVID-19 domain and draw the directions for future improvements that could handle these challenges.
2. The Study Taxonomy
2.1. COVID-19 Diagnosis
2.1.1. Diagnosis Using Medical Images
Diagnosis Using CT Chest Scans
Diagnosis Using X-ray
Diagnosis Using Ultrasound
2.1.2. Diagnosis Using Respiratory Data
2.2. Estimation of Disease Spread
2.3. Association of COVID-19 and Other Healthcare Factors
2.4. Patient Characteristics
2.4.1. Blood Type
2.4.2. Age
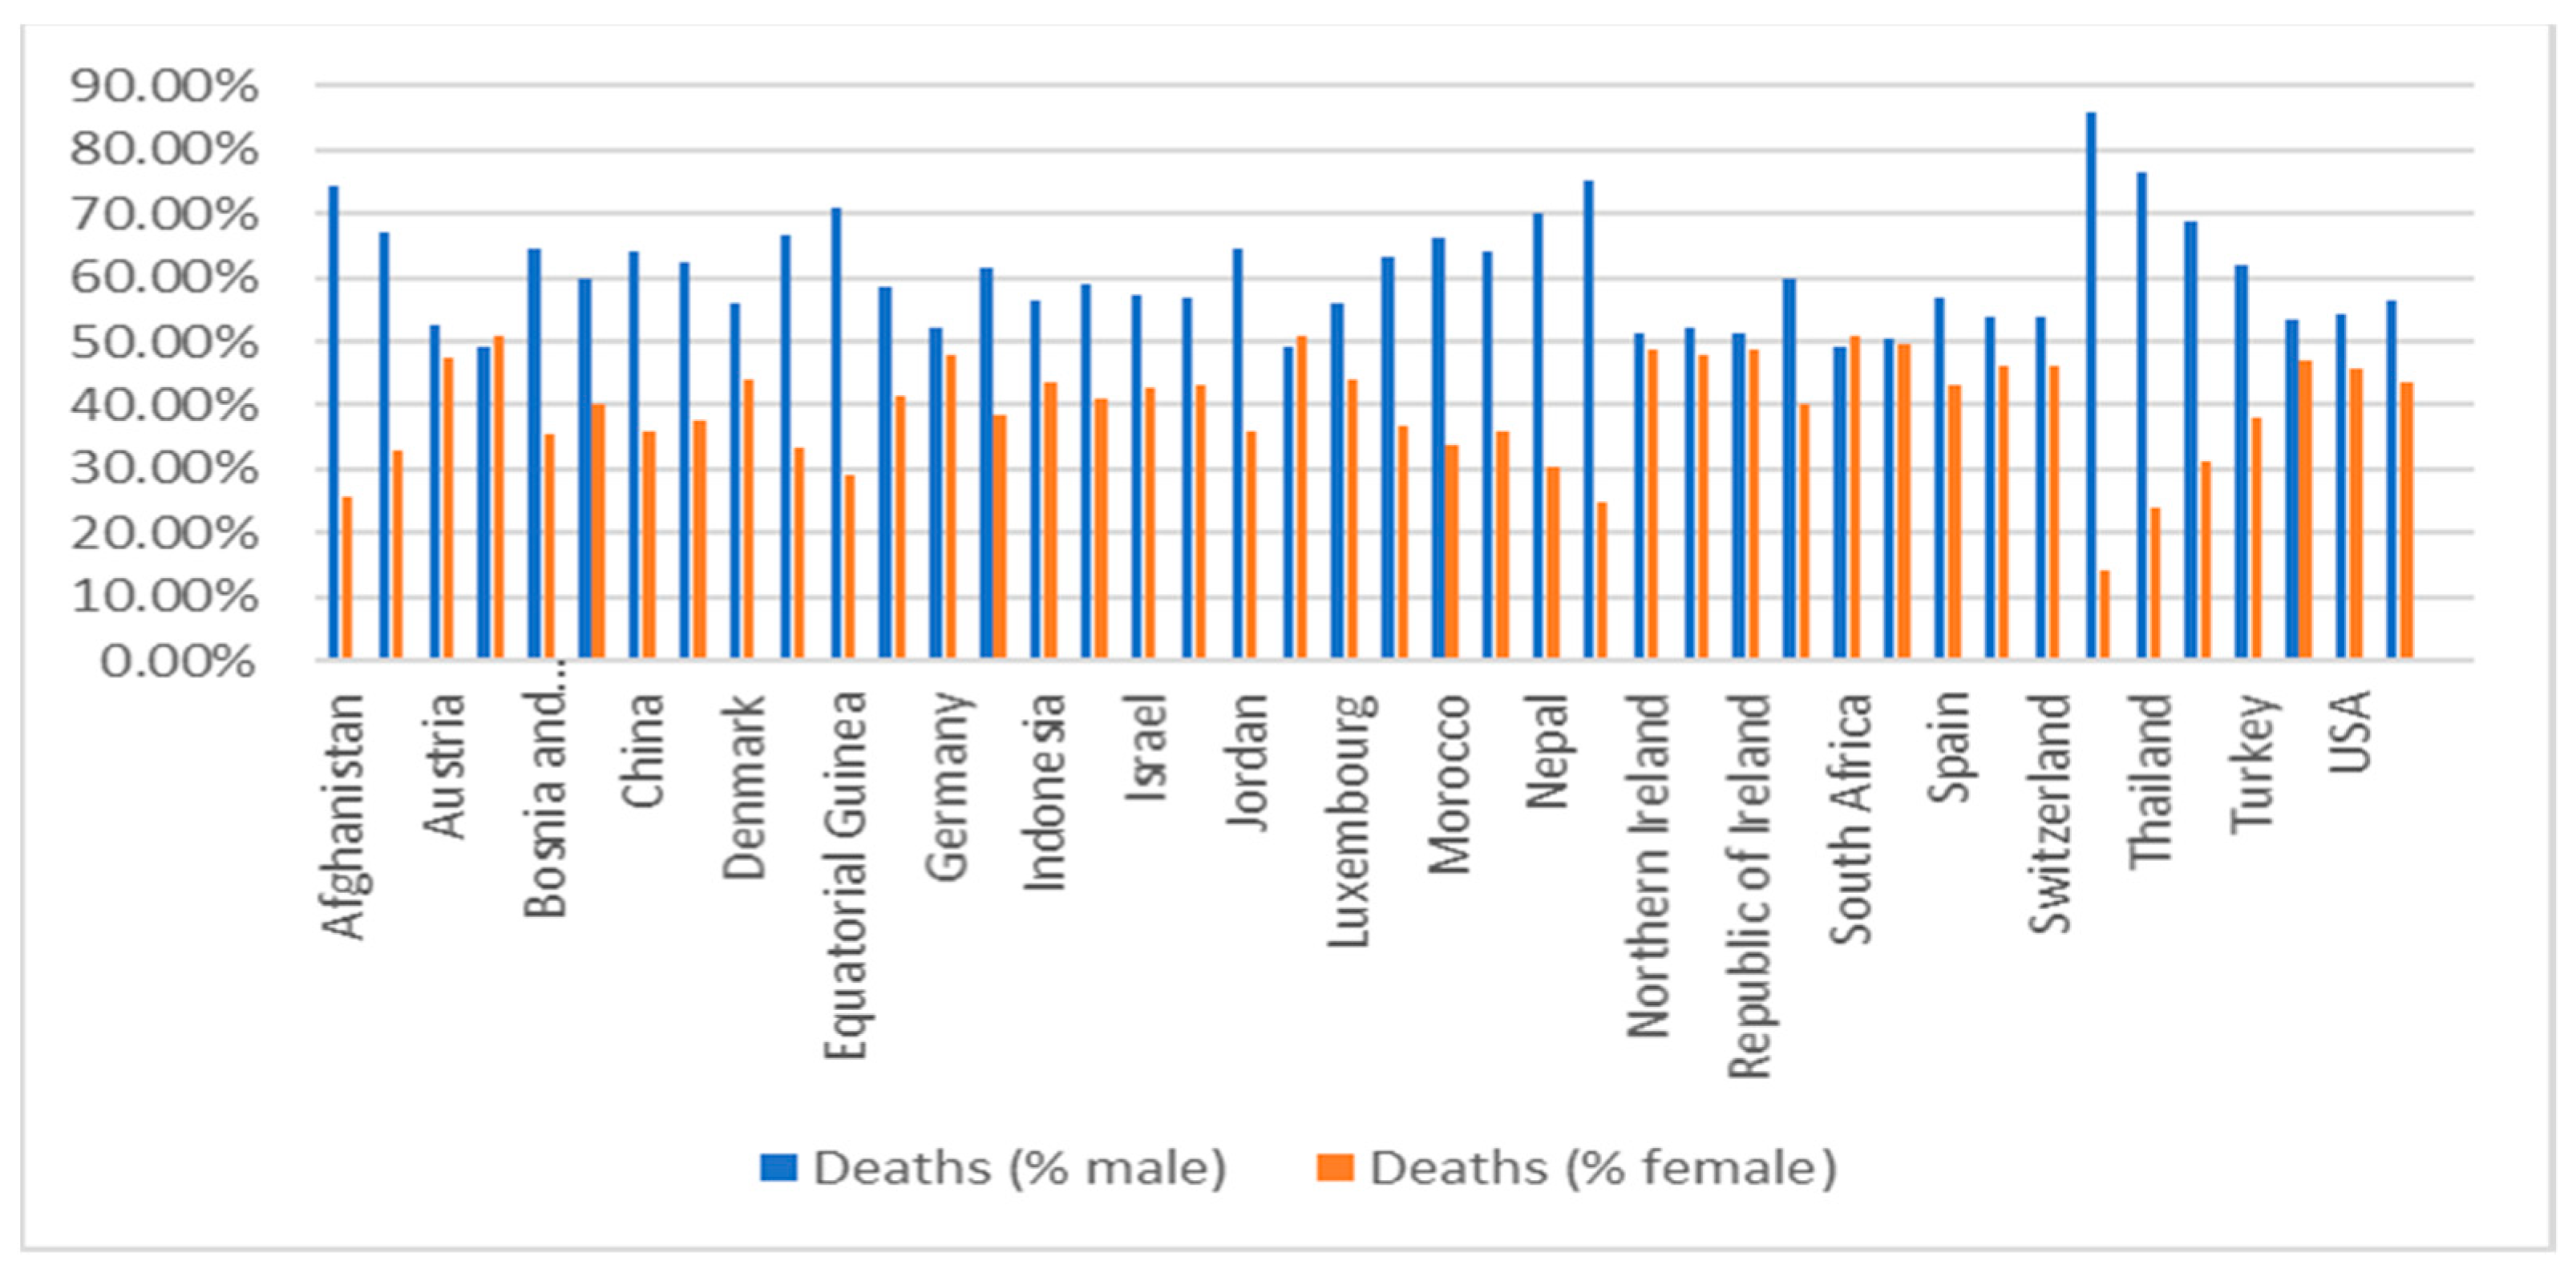
2.4.3. Gender
2.4.4. Obesity
2.4.5. Smoking
2.4.6. Medical Comorbidities
2.4.7. Environmental Factors
2.5. Using DL in Developing Vaccines
2.5.1. Drug Repurposing
Biomedical Knowledge Graph
Protein–Ligand Prediction
Molecular Docking (Docking Simulation)
Gene Expression Signature
2.5.2. Drug Discovery
2.5.3. Vaccine Discovery
2.6. Applications of AI to Support COVID-19 Patients
3. COVID-19 Datasets
3.1. Medical Images Datasets
3.1.1. CT Chest-Scan Dataset
3.1.2. X-ray Images Dataset
3.1.3. Ultrasound Dataset
3.2. Sound Dataset
3.3. Text Dataset
3.4. Genome Sequence Dataset
4. Discussion
5. Limitations and Future Directions
- Symptoms of COVID-19, pneumonia, and other respiratory diseases are very similar, therefore developing a suitable DL model that could detect COVID-19 with optimum accuracy remains a challenge [74].
- The scarcity of a high-quality dataset for COVID-19 is a major challenge. This returns to different reasons, including (1) closed source and non-published datasets; (2) the distributed nature of COVID-19 datasets; and (3) privacy issues that limit data sharing [32]. Therefore, the collaboration between all medical organizations across the globe is essential to expand the existing dataset and accelerate AI research for COVID-19.
- The variability in the testing process across different countries and hospitals is a critical concern that may lead to non-uniformity in the labeling process.
- COVID-19 virus is rapidly mutated over different geographic areas. Therefore, data collected from one region may not be suitable to draw interferences on another region [226].
- Medical staff are considered the first line of defense against this pandemic. Therefore, work on more contact-less screening and diagnosis tools is an urgent need to protect them from infections.
- The non-standardized process when aggregating medical image datasets result in increasing data variety; thus, this raises the need to ensure the robustness of DL-generated models.
- Most of the available COVID-19 datasets are limited in size. Therefore, transfer learning is a future research direction that could help detect abnormalities in small datasets and yield robust predictions and remarkable results [241].
- Based on the literature, it is noticed that there is a correlation between COVID-19 infection and other medical comorbidities. Therefore, to provide a precise and accurate prediction model, a patient’s history of other ailments (diabetes, liver, kidney, heart disease, etc.) must be taken into consideration in both the COVID-19 prediction and detection process [144,145,146].
- High computational resources are required to build complex DL models, processing, and interpreting big data, compared to working with IoT devices. Therefore, edge computing and fog computing could be effective in handling this challenge [199].
- Current NLP applications have limited the benefit from such a diagnosis system. Therefore, working in algorithms that measure semantic textual similarity (STS) [285] is essential to translate performance to a specific domain environment (i.e., COVID-19).
- More sophisticated techniques are needed to optimize the performance of processing X-ray and sound data.
- The explainability and interpretability of ML/DL techniques is a key challenge. ML model should not be a black box. Medical experts must know which features are chosen to distinguish COVID-19 from non-COVID-19 [232]. Moreover, ML/DL should investigate how to predict infections before the symptoms appear.
- Several ML and DL models have shown promising results in COVID-19 screening, diagnosis, and prediction. However, most of these models are not deployed in a real environment (i.e., emerging services, hospitals, etc.) to show their capabilities in tackling the COVID-19 pandemic. Therefore, lots of challenges need to be addressed to deploy such diagnosis models, including (1) addressing the consistency of the network security to provide more reliable communication and trusted data on the network; (2) adaption of cloud, fog, and edge computing; and (3) security and privacy issues regarding the patient’s data that also need to be handled.
6. Conclusions
Author Contributions
Funding
Conflicts of Interest
Appendix A

| Country | Cases Date | Cases | Cases (% Male) | Cases (% Female) | Deaths Date | Deaths in Males | Deaths (% Male) | Deaths (% Female) | Death Date | Males Confirmed Percentage | Females Confirmed Percentage | Ratio between Males and Females (Males) |
|---|---|---|---|---|---|---|---|---|---|---|---|---|
| Afghanistan | 12/15/2020 | 47,289 | 68.62% | 31.38% | 12/15/2020 | 1634 | 74.36% | 25.64% | 12/15/2020 | 3.74% | 2.82% | 1.33 |
| Albania | 01/02/2021 | 59,623 | 48% | 52% | 01/02/2021 | 1199 | 67% | 33% | 01/02/2021 | 2.81% | 1.28% | 2.2 |
| Austria | 01/06/2021 | 371,660 | 48.56% | 51.44% | 01/06/2021 | 6463 | 52.62% | 47.38% | 01/06/2021 | 1.88% | 1.6% | 1.18 |
| Belgium | 01/04/2021 | 649,570 | 44.58% | 55.42% | 01/04/2021 | 19724 | 49.05% | 50.95% | 01/04/2021 | 3.34% | 2.79% | 1.2 |
| Bosnia and Herzegovina | 01/03/2021 | 73,108 | 51.68% | 48.32% | 01/03/2021 | 2118 | 64.59% | 35.41% | 01/03/2021 | 3.62% | 2.12% | 1.71 |
| Chile | 12/31/2020 | 684,375 | 50.43% | 49.57% | 05/07/2020 | 294 | 60% | 40% | 05/07/2020 | 1.28% | 0.97% | 1.32 |
| China | 02/28/2020 | 55,924 | 51% | 49% | 02/28/2020 | 2114 | 64% | 36% | 02/28/2020 | 4.7% | 2.8% | 1.68 |
| Costa Rica | 01/03/2021 | 169,321 | 51.01% | 48.99% | 01/03/2021 | 2185 | 62.33% | 37.67% | 01/03/2021 | 1.58% | 0.99% | 1.59 |
| Denmark | 01/04/2021 | 170,787 | 48.92% | 51.08% | 01/04/2021 | 1226 | 55.79% | 44.21% | 01/04/2021 | 0.82% | 0.62% | 1.32 |
| Ecuador | 01/06/2021 | 217,377 | 52.65% | 47.35% | 12/13/2020 | 13874 | 66.51% | 33.49% | 12/13/2020 | 8.64% | 4.87% | 1.77 |
| Equatorial Guinea | 12/31/2020 | 4786 | 59.32% | 40.68% | 12/31/2020 | 86 | 70.93% | 29.07% | 12/31/2020 | 2.15% | 1.28% | 1.67 |
| France | 10/22/2020 | 1,047,083 | 47.46% | 52.54% | 12/24/2020 | 42853 | 58.66% | 41.34% | 10/20/2020 | 2.72% | 1.7% | 1.59 |
| Germany | 01/06/2021 | 1,793,732 | 47.38% | 52.62% | 01/06/2021 | 36470 | 52.22% | 47.78% | 01/06/2021 | 2.24% | 1.85% | 1.21 |
| Haiti | 12/31/2020 | 10127 | 57.2% | 42.8% | 12/31/2020 | 237 | 61.6% | 38.4% | 12/31/2020 | 2.52% | 2.1% | 1.2 |
| Indonesia | 01/05/2021 | 779,548 | 50% | 50% | 01/05/2021 | 23109 | 56.4% | 43.6% | 01/05/2021 | 3.34% | 2.59% | 1.29 |
| Iran | 03/17/2020 | 14,991 | 57% | 43% | 03/17/2020 | 853 | 59% | 41% | 03/17/2020 | 5.89% | 5.43% | 1.09 |
| Israel | 01/06/2021 | 461,644 | 50.97% | 49.03% | 01/06/2021 | 3527 | 57.36% | 42.64% | 01/06/2021 | 0.86% | 0.66% | 1.29 |
| Italy | 12/29/2020 | 2,049,915 | 48.48% | 51.52% | 12/29/2020 | 70799 | 56.9% | 43.1% | 12/29/2020 | 4.05% | 2.89% | 1.4 |
| Jordan | 01/04/2021 | 293,466 | 53% | 47% | 01/04/2021 | 3852 | 64.3% | 35.7% | 01/04/2021 | 1.59% | 1% | 1.6 |
| Latvia | 01/04/2021 | 43,118 | 42.86% | 57.14% | 01/04/2021 | 692 | 49% | 51% | 01/04/2021 | 1.83% | 1.43% | 1.28 |
| Luxembourg | 01/05/2021 | 47,149 | 50% | 50% | 01/05/2021 | 514 | 56% | 44% | 01/05/2021 | 1.22% | 0.96% | 1.27 |
| Mexico | 01/04/2021 | 1,454,974 | 50.4% | 49.6% | 01/04/2021 | 127533 | 63.41% | 36.59% | 01/04/2021 | 11.03% | 6.47% | 1.71 |
| Morocco | 07/18/2020 | 17,015 | 53% | 47% | 09/21/2020 | 1855 | 66.31% | 33.69% | 07/18/2020 | 2.98% | 1.65% | 1.8 |
| Myanmar | 09/10/2020 | 2265 | 53% | 47% | 09/28/2020 | 226 | 64.16% | 35.84% | 09/01/2020 | 1% | 0.26% | 3.84 |
| Nepal | 01/05/2021 | 262,784 | 65.11% | 34.89% | 12/23/2020 | 1795 | 69.86% | 30.14% | 12/23/2020 | 0.76% | 0.61% | 1.24 |
| Nigeria | 12/27/2020 | 73,043 | 61.85% | 38.15% | 11/15/2020 | 1218 | 75.29% | 24.71% | 11/15/2020 | 2.26% | 1.28% | 1.76 |
| Northern Ireland | 01/04/2021 | 81,222 | 46.08% | 53.92% | 01/06/2021 | 1383 | 51.19% | 48.81% | 01/06/2021 | 1.89% | 1.54% | 1.23 |
| Portugal | 01/03/2021 | 427,106 | 44.97% | 55.03% | 01/03/2021 | 7118 | 52.11% | 47.89% | 01/03/2021 | 1.93% | 1.45% | 1.33 |
| Republic of Ireland | 01/02/2021 | 101,791 | 47.67% | 52.33% | 01/02/2021 | 2263 | 51.22% | 48.78% | 01/02/2021 | 2.39% | 2.07% | 1.15 |
| Romania | 01/03/2021 | 643,559 | 45.98% | 54.02% | 01/03/2021 | 16057 | 59.7% | 40.3% | 01/03/2021 | 3.24% | 1.86% | 1.74 |
| South Africa | 01/05/2021 | 1,117,139 | 42.23% | 57.77% | 01/06/2021 | 27108 | 49.33% | 50.67% | 01/06/2021 | 2.83% | 2.13% | 1.33 |
| South Korea | 01/05/2021 | 64,979 | 48.91% | 51.09% | 01/05/2021 | 1007 | 50.35% | 49.65% | 01/05/2021 | 1.6% | 1.51% | 1.06 |
| Spain | 12/29/2020 | 1,888,148 | 46.98% | 53.02% | 05/21/2020 | 20518 | 57% | 43% | 05/21/2020 | 10.87% | 6.3% | 1.73 |
| Sweden | 01/06/2021 | 469,748 | 46.9% | 53.1% | 01/06/2021 | 8985 | 53.89% | 46.11% | 01/06/2021 | 2.2% | 1.66% | 1.32 |
| Switzerland | 01/06/2021 | 470,667 | 47.46% | 52.54% | 01/06/2021 | 7433 | 53.73% | 46.27% | 01/06/2021 | 1.79% | 1.39% | 1.29 |
| Taiwan | 01/05/2021 | 815 | 47.61% | 52.39% | 01/05/2021 | 7 | 85.71% | 14.29% | 01/05/2021 | 1.55% | 0.23% | 6.6 |
| Thailand | 11/01/2020 | 3784 | 56.37% | 43.63% | 11/01/2020 | 59 | 76.27% | 23.73% | 11/01/2020 | 2.11% | 0.85% | 2.49 |
| Tunisia | 10/20/2020 | 42,727 | 46% | 54% | 08/30/2020 | 77 | 68.75% | 31.25% | 08/30/2020 | 3.24% | 1.29% | 2.49 |
| Turkey | 10/25/2020 | 362,800 | 51% | 49% | 10/25/2020 | 9799 | 61.86% | 38.14% | 10/25/2020 | 3.28% | 2.1% | 1.56 |
| Ukraine | 01/05/2021 | 1,001,131 | 40.1% | 59.9% | 01/05/2021 | 17395 | 53.22% | 46.78% | 01/05/2021 | 2.31% | 1.36% | 1.7 |
| USA | 01/04/2021 | 15,091,901 | 47.71% | 52.29% | 12/26/2020 | 301671 | 54.21% | 45.79% | 10/27/2020 | 3.51% | 2.76% | 1.27 |
| Wales | 01/05/2021 | 161,233 | 45.23% | 54.77% | 01/05/2021 | 3738 | 56.5% | 43.5% | 01/05/2021 | 2.9% | 1.84% | 1.57 |
References
- Fang, S.; Li, K.; Shen, J.; Liu, S.; Liu, J.; Yang, L.; Hu, C.-D.; Wan, J. GESS: A database of global evaluation of SARS-CoV-2/hCoV-19 sequences. Nucleic Acids Res. 2021, 49, D706–D714. [Google Scholar] [CrossRef]
- Ludwig, S.; Zarbock, A. Coronaviruses and SARS-CoV-2: A Brief Overview. Anesth. Analg. 2020, 20, 6–9. [Google Scholar] [CrossRef]
- Bin, S.Y.; Heo, J.Y.; Song, M.-S.; Lee, J.; Kim, E.-H.; Park, S.-J.; Kwon, H.-I.; Kim, S.M.; Kim, Y.-I.; Si, Y.-J.; et al. Environmental Contamination and Viral Shedding in MERS Patients during MERS-CoV Outbreak in South Korea. Clin. Infect. Dis. 2015, 62, 755–760. [Google Scholar] [CrossRef] [PubMed] [Green Version]
- Wang, L.-F.; Shi, Z.; Zhang, S.; Field, H.; Daszak, P.; Eaton, B.T. Review of Bats and SARS. Emerg. Infect. Dis. 2006, 12, 1834–1840. [Google Scholar] [CrossRef]
- Chen, B.; Tian, E.-K.; He, B.; Tian, L.; Han, R.; Wang, S.; Xiang, Q.; Zhang, S.; El Arnaout, T.; Cheng, W. Overview of lethal human coronaviruses. Signal Transduct. Target. Ther. 2020, 5, 1–16. [Google Scholar] [CrossRef] [PubMed]
- Booth, A.L.; Abels, E.; McCaffrey, P. Development of a prognostic model for mortality in COVID-19 infection using machine learning. Mod. Pathol. 2021, 34, 522–531. [Google Scholar] [CrossRef] [PubMed]
- Sehla, E.; Eifan, S.; Hanif, A. COVID-19 and Kingdom of Saudi Arabia. J. Clin. Microbiol. Biochem. Technol. 2020, 6, 008–009. [Google Scholar]
- Alharbi, N.K.; Alghnam, S.; Algaissi, A.; Albalawi, H.; Alenazi, M.W.; Albargawi, A.M.; Alharbi, A.G.; Alhazmi, A.; Al Qarni, A.; Alfarhan, A.; et al. Nationwide Seroprevalence of SARS-CoV-2 in Saudi Arabia. J. Infect. Public Health 2021. [Google Scholar] [CrossRef]
- Orooji, Y.; Sohrabi, H.; Hemmat, N.; Oroojalian, F. An Overview on SARS-CoV-2 (COVID-19) and Other Human Coronaviruses and Their Detection Capability via Amplification Assay, Chemical Sensing, Biosensing, Immunosensing, and Clinical Assays. NanoMicro Lett. 2021, 13. [Google Scholar] [CrossRef]
- Shereen, M.A.; Khan, S.; Kazmi, A.; Bashir, N.; Siddique, R. COVID-19 infection: Emergence, transmission, and characteristics of human coronaviruses. J. Adv. Res. 2020, 24, 91–98. [Google Scholar] [CrossRef] [PubMed]
- World Health Organization (WHO). Modes of Transmission of Virus Causing COVID-19: Implications for IPC Precaution Recommendations; World Health Organization: Geneva, Switzerland, 2020; pp. 19–21. [Google Scholar]
- Tong, Z.-D.; Tang, A.; Li, K.-F.; Li, P.; Wang, H.-L.; Yi, J.-P.; Zhang, Y.-L.; Yan, J.-B. Potential presymptomatic transmission of SARS-CoV-2, Zhejiang Province, China, 2020. Emerg. Infect. Dis. 2020, 26, 1052–1054. [Google Scholar] [CrossRef] [Green Version]
- To, K.K.-W.; Tsang, O.T.-Y.; Leung, W.-S.; Tam, A.R.; Wu, T.-C.; Lung, D.C.; Yip, C.C.-Y.; Cai, J.-P.; Chan, J.M.-C.; Chik, T.S.-H.; et al. Temporal profiles of viral load in posterior oropharyngeal saliva samples and serum antibody responses during infection by SARS-CoV-2: An observational cohort study. Lancet Infect. Dis. 2020, 20, 565–574. [Google Scholar] [CrossRef] [Green Version]
- Chan, J.F.-W.; Yuan, S.; Kok, K.-H.; To, K.K.-W.; Chu, H.; Yang, J.; Xing, F.; Liu, J.; Yip, C.C.-Y.; Poon, R.W.-S.; et al. A familial cluster of pneumonia associated with the 2019 novel coronavirus indicating person-to-person transmission: A study of a family cluster. Lancet 2020, 395, 514–523. [Google Scholar] [CrossRef] [Green Version]
- Wu, X.; Wang, Z.; He, Z.; Li, Y.; Wu, Y.; Wang, H.; Liu, Y.; Hao, F.; Tian, H. A follow-up study shows that recovered patients with re-positive PCR test in Wuhan may not be infectious. BMC Med. 2021, 19, 1–7. [Google Scholar] [CrossRef]
- Armstrong, S. Covid-19: Tests on students are highly inaccurate, early findings show. BMJ 2020, 371, m4941. [Google Scholar] [CrossRef]
- Roy, S. Physicians’ Dilemma of False-Positive RT-PCR for COVID-19: A Case Report. SN Compr. Clin. Med. 2021, 3, 255–258. [Google Scholar] [CrossRef] [PubMed]
- Alserehi, H.A.; Alqunaibet, A.M.; Al-Tawfiq, J.A.; Alharbi, N.K.; Alshukairi, A.N.; Alanazi, K.H.; Bin Saleh, G.M.; Alshehri, A.M.; Almasoud, A.; Hashem, A.M.; et al. Seroprevalence of SARS-CoV-2 (COVID-19) among healthcare workers in Saudi Arabia: Comparing case and control hospitals. Diagn. Microbiol. Infect. Dis. 2021, 99, 115273. [Google Scholar] [CrossRef]
- Singh, V.K.; Abdel-Nasser, M.; Pandey, N.; Puig, D. LungINFseg: Segmenting COVID-19 Infected Regions in Lung CT Images Based on a Receptive-Field-Aware Deep Learning Framework. Diagnostics 2021, 11, 158. [Google Scholar] [CrossRef]
- Zietz, M.; Zucker, J.; Tatonetti, N.P. Associations between blood type and COVID-19 infection, intubation, and death. Nat. Commun. 2020, 11, 1–6. [Google Scholar] [CrossRef] [PubMed]
- Ahuja, S.; Panigrahi, B.K.; Dey, N.; Rajinikanth, V.; Gandhi, T.K. Deep transfer learning-based automated detection of COVID-19 from lung CT scan slices. Appl. Intell. 2021, 51, 571–585. [Google Scholar] [CrossRef]
- Jaiswal, A.; Gianchandani, N.; Singh, D.; Kumar, V.; Kaur, M. Classification of the COVID-19 infected patients using DenseNet201 based deep transfer learning. J. Biomol. Struct. Dyn. 2020, 1–8. [Google Scholar] [CrossRef]
- López, V.; Čukić, M. A dynamical model of SARS-CoV-2 based on people flow networks. Saf. Sci. 2021, 134, 105034. [Google Scholar] [CrossRef]
- Ozturk, T.; Talo, M.; Yildirim, E.A.; Baloglu, U.B.; Yildirim, O.; Acharya, U.R. Automated detection of COVID-19 cases using deep neural networks with X-ray images. Comput. Biol. Med. 2020, 121, 103792. [Google Scholar] [CrossRef]
- Zhao, J.; He, X.; Yang, X.; Zhang, Y.; Zhang, S.; Xie, P. COVID-CT-Dataset: A CT image dataset about COVID-19. arXiv 2020, arXiv:2003.13865v3. [Google Scholar]
- Ardakani, A.A.; Kanafi, A.R.; Acharya, U.R.; Khadem, N.; Mohammadi, A. Application of deep learning technique to manage COVID-19 in routine clinical practice using CT images: Results of 10 convolutional neural networks. Comput. Biol. Med. 2020, 121, 103795. [Google Scholar] [CrossRef] [PubMed]
- Sotgiu, G.; Barassi, A.; Miozzo, M.; Saderi, L.; Piana, A.; Orfeo, N.; Colosio, C.; Felisati, G.; Davì, M.; Gerli, A.G.; et al. SARS-CoV-2 specific serological pattern in healthcare workers of an Italian COVID-19 forefront hospital. BMC Pulm. Med. 2020, 20, 1–6. [Google Scholar] [CrossRef]
- Sedik, A.; Iliyasu, A.; El-Rahiem, B.A.; Samea, M.A.; Abdel-Raheem, A.; Hammad, M.; Peng, J.; El-Samie, F.A.; El-Latif, A. Deploying Machine and Deep Learning Models for Efficient Data-Augmented Detection of COVID-19 Infections. Viruses 2020, 12, 769. [Google Scholar] [CrossRef]
- Wang, B.; Jin, S.; Yan, Q.; Xu, H.; Luo, C.; Wei, L.; Zhao, W.; Hou, X.; Ma, W.; Xu, Z.; et al. AI-assisted CT imaging analysis for COVID-19 screening: Building and deploying a medical AI system. Appl. Soft Comput. 2021, 98, 106897. [Google Scholar] [CrossRef] [PubMed]
- Wang, S.; Kang, B.; Ma, J.; Zeng, X.; Xiao, M.; Guo, J.; Cai, M.; Yang, J.; Li, Y.; Meng, X.; et al. A deep learning algorithm using CT images to screen for Corona virus disease (COVID-19). Eur. Radiol. 2021, 1–9. [Google Scholar] [CrossRef]
- Jin, C.; Chen, W.; Cao, Y.; Xu, Z.; Tan, Z.; Zhang, X.; Deng, L.; Zheng, C.; Zhou, J.; Shi, H.; et al. Development and evaluation of an artificial intelligence system for COVID-19 diagnosis. Nat. Commun. 2020, 11, 1–14. [Google Scholar] [CrossRef]
- Malom, Z.; Rahman, M.M.S.; Nasrin, S.; Taha, T.M.; Asari, V.K. COVID_MTNet: COVID-19 detection with multi-task deep learning approaches. arXiv 2020, arXiv:2004.03747. [Google Scholar] [CrossRef] [Green Version]
- Sharma, S. Drawing insights from COVID-19-infected patients using CT scan images and machine learning techniques: A study on 200 patients. Environ. Sci. Pollut. Res. 2020, 27, 37155–37163. [Google Scholar] [CrossRef]
- Event, E.P.; Zhong, A.L.I.U. Sciences Lung Infection Quantification of COVID-19 in CT Images with Deep Learning Author. arXiv 2020, arXiv:2003.04655v3. [Google Scholar]
- Nguyen, T.T.; Nguyen, Q.V.H.; Nguyen, D.T.; Hsu, E.B.; Yang, S.; Eklund, P. Artificial Intelligence in the Battle against Coronavirus (COVID-19): A Survey and Future Research Directions. arXiv 2020, arXiv:2008.07343. [Google Scholar]
- Wang, S.; Zha, Y.; Li, W.; Wu, Q.; Li, X.; Niu, M.; Wang, M.; Qiu, X.; Li, H.; Yu, H.; et al. A fully automatic deep learning system for COVID-19 diagnostic and prognostic analysis. Eur. Respir. J. 2020, 56, 2000775. [Google Scholar] [CrossRef] [PubMed]
- Farid, A.A.; Selim, G.I.; Khater, H.A.A. A Novel Approach of CT Images Feature Analysis and Prediction to Screen for Corona Virus Disease (COVID-19). Int. J. Sci. Eng. Res. 2020, 11, 1141–1149. [Google Scholar] [CrossRef]
- Bernheim, A.; Mei, X.; Huang, M.; Yang, Y.; Fayad, Z.A.; Zhang, N.; Diao, K.; Lin, B.; Zhu, X.; Li, K.; et al. Chest CT Findings in Coronavirus Disease-19 (COVID-19): Relationship to Duration of Infection. Radiology 2020, 295, 200463. [Google Scholar] [CrossRef] [PubMed] [Green Version]
- Mei, X.; Lee, H.-C.; Diao, K.-Y.; Huang, M.; Lin, B.; Liu, C.; Xie, Z.; Ma, Y.; Robson, P.M.; Chung, M.; et al. Artificial intelligence–enabled rapid diagnosis of patients with COVID-19. Nat. Med. 2020, 26, 1224–1228. [Google Scholar] [CrossRef]
- Pu, J.; Leader, J.; Bandos, A.; Shi, J.; Du, P.; Yu, J.; Yang, B.; Ke, S.; Guo, Y.; Field, J.B.; et al. Any unique image biomarkers associated with COVID-19? Eur. Radiol. 2020, 30, 6221–6227. [Google Scholar] [CrossRef]
- Zhang, K.; Liu, X.; Shen, J.; Li, Z.; Sang, Y.; Wu, X.; Zha, Y.; Liang, W.; Wang, C.; Wang, K.; et al. Clinically Applicable AI System for Accurate Diagnosis, Quantitative Measurements, and Prognosis of COVID-19 Pneumonia Using Computed Tomography. Cell 2020, 181, 1423–1433.e11. [Google Scholar] [CrossRef]
- Liu, S.; Georgescu, B.; Xu, Z.; Yoo, Y.; Chabin, G.; Chaganti, S.; Grbic, S.; Piat, S.; Teixeira, B.; Balachandran, A.; et al. 3D Tomographic Pattern Synthesis for Enhancing the Quantification of COVID-19. arXiv 2020, arXiv:abs/2005.01903. [Google Scholar]
- Singh, D.; Kumar, V.; Kaur, M. Classification of COVID-19 patients from chest CT images using multi-objective differential evolution-based convolutional neural networks. Eur. J. Clin. Microbiol. Infect. Dis. 2020, 39, 1379–1389. [Google Scholar] [CrossRef]
- Xu, X.; Jiang, X.; Ma, C.; Du, P.; Li, X.; Lv, S.; Yu, L.; Ni, Q.; Chen, Y.; Su, J.; et al. A Deep Learning System to Screen Novel Coronavirus Disease 2019 Pneumonia. Engineering 2020, 6, 1122–1129. [Google Scholar] [CrossRef] [PubMed]
- Yang, X.; Chiu, M.Y.L. Treatment of Adolescent Mental Disorders: Cross-Cultural Issues. In The Encyclopedia of Child and Adolescent Development; Wiley: Hoboken, NJ, USA, 2020; pp. 1–11. [Google Scholar]
- Bai, H.X.; Wang, R.; Xiong, Z.; Hsieh, B.; Chang, K.; Halsey, K.; Tran, T.M.L.; Choi, J.W.; Wang, D.-C.; Shi, L.-B.; et al. Artificial Intelligence Augmentation of Radiologist Performance in Distinguishing COVID-19 from Pneumonia of Other Origin at Chest CT. Radiology 2020, 296, E156–E165. [Google Scholar] [CrossRef]
- Khalifa, N.E.M.; Taha, M.H.N. Detection of Coronavirus (COVID-19) Associated Pneumonia based on Generative Adversarial Networks and a Fine-Tuned Deep Transfer Learning Model using Chest X-ray Dataset. arXiv 2020, arXiv:2004.01184v1. [Google Scholar]
- Wong, H.Y.F.; Lam, H.Y.S.; Fong, A.H.-T.; Leung, S.T.; Chin, T.W.-Y.; Lo, C.S.Y.; Lui, M.M.-S.; Lee, J.C.Y.; Chiu, K.W.-H.; Chung, T.W.-H.; et al. Frequency and Distribution of Chest Radiographic Findings in Patients Positive for COVID-19. Radiology 2020, 296, E72–E78. [Google Scholar] [CrossRef] [Green Version]
- Dansana, D.; Kumar, R.; Bhattacharjee, A.; Hemanth, D.J.; Gupta, D.; Khanna, A.; Castillo, O. Early diagnosis of COVID-19-affected patients based on X-ray and computed tomography images using deep learning algorithm. Soft Comput. 2020. [Google Scholar] [CrossRef] [PubMed]
- Sethy, P.K.; Behera, S.K.; Ratha, P.K.; Biswas, P. Detection of coronavirus Disease (COVID-19) based on Deep Features and Support Vector Machine. Int. J. Math. Eng. Manag. Sci. 2020, 5, 643–651. [Google Scholar] [CrossRef]
- Shi, F.; Xia, L.; Shan, F.; Song, B.; Wu, D.; Wei, Y.; Yuan, H.; Jiang, H.; He, Y.; Gao, Y.; et al. Large-scale screening to distinguish between COVID-19 and community-acquired pneumonia using infection size-aware classification. Phys. Med. Biol. 2021, 66, 065031. [Google Scholar] [CrossRef] [PubMed]
- Purohit, K.; Kesarwani, A.; Kisku, D.R.; Dalui, M. COVID-19 Detection on Chest X-Ray and CT Scan Images Using Multi-image Augmented Deep Learning Model. bioRxiv 2020. [Google Scholar] [CrossRef]
- Apostolopoulos, I.D.; Mpesiana, T.A. Covid-19: Automatic detection from X-ray images utilizing transfer learning with convolutional neural networks. Phys. Eng. Sci. Med. 2020, 43, 635–640. [Google Scholar] [CrossRef] [Green Version]
- Deng, X.; Shao, H.; Shi, L.; Wang, X.; Xie, T. A classification–detection approach of COVID-19 based on chest X-ray and CT by using keras pretrained deep learning models. Comput. Model. Eng. Sci. 2020, 125, 579–596. [Google Scholar]
- Yasin, R.; Gouda, W. Chest X-ray findings monitoring COVID-19 disease course and severity. Egypt. J. Radiol. Nucl. Med. 2020, 51, 1–18. [Google Scholar] [CrossRef]
- Amyar, A.; Modzelewski, R.; Ruan, S. Multi-Task Deep Learning Based CT Imaging Analysis for Covid-19: Classification and Segmentation General Electric Healthcare; University of Rouen: Rouen, France, 2020; pp. 2–8. [Google Scholar]
- Benmalek, E.; Elmhamdi, J.; Jilbab, A. Comparing CT scan and chest X-ray imaging for COVID-19 diagnosis. Biomed. Eng. Adv. 2021, 1, 100003. [Google Scholar] [CrossRef]
- Hemdan, E.E. COVIDX-Net: A Framework of Deep Learning Classifiers to Diagnose COVID-19 in X-Ray Images. arXiv 2003, arXiv:2003.11055. [Google Scholar]
- Minaee, S.; Kafieh, R.; Sonka, M.; Yazdani, S.; Soufi, G.J. Deep-COVID: Predicting COVID-19 from chest X-ray images using deep transfer learning. Med. Image Anal. 2020, 65, 101794. [Google Scholar] [CrossRef] [PubMed]
- Zheng, C.; Deng, X.; Fu, Q.; Zhou, Q. Deep Learning-based Detection for COVID-19 from Chest CT using Weak Label. MedRxiv 2020. [Google Scholar] [CrossRef] [Green Version]
- Song, Y.; Zheng, S.; Li, L.; Zhang, X.; Zhang, X.; Huang, Z.; Chen, J.; Wang, R.; Zhao, H.; Zha, Y.; et al. Deep learning Enables Accurate Diagnosis of Novel Coronavirus (COVID-19) with CT images. IEEE/ACM Trans. Comput. Biol. Bioinform. 2021. [Google Scholar] [CrossRef] [PubMed]
- Zhang, J.; Xie, Y.; Pang, G.; Liao, Z.; Verjans, J.; Li, W.; Sun, Z.; He, J.; Li, Y.; Shen, C.; et al. Viral Pneumonia Screening on Chest X-Rays Using Confidence-Aware Anomaly Detection. IEEE Trans. Med. Imaging 2021, 40, 879–890. [Google Scholar] [CrossRef]
- Chowdhury, M.E.H.; Rahman, T.; Khandakar, A.; Mazhar, R.; Kadir, M.A.; Bin Mahbub, Z.; Islam, K.R.; Khan, M.S.; Iqbal, A.; Al Emadi, N.; et al. Can AI Help in Screening Viral and COVID-19 Pneumonia? IEEE Access 2020, 8, 132665–132676. [Google Scholar] [CrossRef]
- Mahmud, T.; Rahman, A.; Fattah, S.A. CovXNet: A multi-dilation convolutional neural network for automatic COVID-19 and other pneumonia detection from chest X-ray images with transferable multi-receptive feature optimization. Comput. Biol. Med. 2020, 122, 103869. [Google Scholar] [CrossRef]
- Rajaraman, S. Weakly Labeled Data Augmentation for Deep Learning: A Study on COVID-19 Detection in. Diagnostics 2020, 2019, 358. [Google Scholar] [CrossRef]
- Wilhjelm, B.J.E.; Illum, A.; Kristensson, M.; Andersen, O.T. Medical Diagnostic Ultrasound-Physical Principles and Imaging. 2016. Available online: http://bme.elektro.dtu.dk/jw/webbook/Ultrasound/main.pdf (accessed on 31 May 2021).
- Zhang, Y.K.; Li, J.; Yang, J.P.; Zhan, Y.; Chen, J. Lung ultrasonography for the diagnosis of 11 patients with acute respiratory distress syndrome due to bird flu H7N9 infection. Virol. J. 2015, 12, 1–5. [Google Scholar] [CrossRef] [PubMed] [Green Version]
- Convissar, D.L.; Gibson, L.E.; Berra, L.; Bittner, E.A.; Chang, M.G. Application of Lung Ultrasound During the COVID-19 Pandemic: A Narrative Review. Anesthesia Analg. 2020, 131, 345–350. [Google Scholar] [CrossRef] [PubMed]
- Roy, S.; Menapace, W.; Oei, S.; Luijten, B.; Fini, E.; Saltori, C.; Huijben, I.; Chennakeshava, N.; Mento, F.; Sentelli, A.; et al. Deep Learning for Classification and Localization of COVID-19 Markers in Point-of-Care Lung Ultrasound. IEEE Trans. Med. Imaging 2020, 39, 2676–2687. [Google Scholar] [CrossRef] [PubMed]
- McDermott, C.; Łącki, M.; Sainsbury, B.; Henry, J.; Filippov, M.; Rossa, C. Sonographic Diagnosis of COVID-19: A Review of Image Processing for Lung Ultrasound. Front. Big Data 2021, 4, 4. [Google Scholar] [CrossRef] [PubMed]
- Zhang, Y.; Xue, H.; Wang, M.; He, N.; Lv, Z.; Cui, L. Lung Ultrasound Findings in Patients with Coronavirus Disease (COVID-19). Am. J. Roentgenol. 2021, 216, 80–84. [Google Scholar] [CrossRef]
- Contreras-Ortiz, S.H.; Chiu, T.; Fox, M.D. Ultrasound image enhancement: A review. Biomed. Signal Process. Control. 2012, 7, 419–428. [Google Scholar] [CrossRef]
- Singh, P.; Mukundan, R.; De Ryke, R. Feature Enhancement in Medical Ultrasound Videos Using Contrast-Limited Adaptive Histogram Equalization. J. Digit. Imaging 2020, 33, 273–285. [Google Scholar] [CrossRef]
- Sorlini, C.; The Fenice Network (Italian Group for Clinical Research in Emergency Medicine); Femia, M.; Nattino, G.; Bellone, P.; Gesu, E.; Francione, P.; Paternò, M.; Grillo, P.; Ruffino, A.; et al. The role of lung ultrasound as a frontline diagnostic tool in the era of COVID-19 outbreak. Intern. Emerg. Med. 2021, 16, 749–756. [Google Scholar] [CrossRef] [PubMed]
- Drosten, C.; Günther, S.; Preiser, W.; Van Der Werf, S.; Brodt, H.R.; Becker, S.; Rabenau, H.; Panning, M.; Kolesnikova, L.; Fouchier, R.A.M.; et al. Identification of a Novel Coronavirus in Patients with Severe Acute Respiratory Syndrome. N. Engl. J. Med. 2003, 348, 1967–1976. [Google Scholar] [CrossRef] [PubMed]
- Brown, C.; Chauhan, J.; Grammenos, A.; Han, J.; Hasthanasombat, A.; Spathis, D.; Xia, T.; Cicuta, P.; Mascolo, C. Exploring Automatic Diagnosis of COVID-19 from Crowdsourced Respiratory Sound Data. In Proceedings of the 26th ACM SIGKDD International Conference on Knowledge Discovery & Data Mining, San Diego, CA, USA, 28 August 2020. [Google Scholar]
- Faezipour, M.; Abuzneid, A. Smartphone-Based Self-Testing of COVID-19 Using Breathing Sounds. Telemed. e-Health 2020, 26, 1202–1205. [Google Scholar] [CrossRef]
- Lella, K.K.; Pja, A. A literature review on COVID-19 disease diagnosis from respiratory sound data. AIMS Environ. Sci. 2021, 8, 140–153. [Google Scholar]
- World Health Organization. World Health Organization and Others Report of the WHO-China Joint Mission on Coronavirus Disease 2019 (COVID-19); World Health Organization: Geneva, Switzerland, 2020. [Google Scholar]
- Sharma, N.; Krishnan, P.; Kumar, R.; Ramoji, S.; Chetupalli, S.R.; Ghosh, P.K.; Ganapathy, S. Coswara—A Database of Breathing, Cough, and Voice Sounds for COVID-19 Diagnosis. arXiv 2020, arXiv:2005.10548v2. [Google Scholar]
- Lella, K.K.; Pja, A. Automatic COVID-19 disease diagnosis using 1D convolutional neural network and augmentation with human respiratory sound based on parameters: Cough, breath, and voice. AIMS Public Health 2021, 8, 240–264. [Google Scholar] [CrossRef] [PubMed]
- Imran, A.; Posokhova, I.; Qureshi, H.N.; Masood, U.; Riaz, M.S.; Ali, K.; John, C.N.; Hussain, I.; Nabeel, M. AI4COVID-19: AI enabled preliminary diagnosis for COVID-19 from cough samples via an app. Informatics Med. Unlocked 2020, 20, 100378. [Google Scholar] [CrossRef] [PubMed]
- Bagad, P.; Dalmia, A.; Doshi, J.; Nagrani, A.; Bhamare, P.; Mahale, A.; Rane, S.; Agarwal, N.; Panicker, R. Cough Against COVID: Evidence of COVID-19 Signature in Cough Sounds. arXiv 2020, arXiv:2009.08790. [Google Scholar]
- Han, J.; Qian, K.; Song, M.; Yang, Z.; Ren, Z.; Liu, S.; Liu, J.; Zheng, H.; Ji, W.; Koike, T.; et al. An Early Study on Intelligent Analysis of Speech Under COVID-19: Severity, Sleep Quality, Fatigue, and Anxiety. arXiv 2020, arXiv:2005.00096. [Google Scholar]
- Wang, N.; Fu, Y.; Zhang, H.; Shi, H. An evaluation of mathematical models for the outbreak of COVID-19. Precis. Clin. Med. 2020, 3, 85–93. [Google Scholar] [CrossRef]
- Chae, S.Y.; Lee, K.; Lee, H.M.; Jung, N.; Le, Q.A.; Mafwele, B.J.; Lee, T.H.; Kim, D.H.; Lee, J.W. Estimation of Infection Rate and Predictions of Disease Spreading Based on Initial Individuals Infected With COVID-19. Front. Phys. 2020, 8, 1–6. [Google Scholar] [CrossRef]
- World Health Organization. The First Few X Cases and Contacts (FFX) Investigation Protocol for Coronavirus Disease 2019 (COVID-19); World Health Organization: Geneva, Switzerland, 2020. [Google Scholar]
- Marmarelis, V.Z. Predictive Modeling of Covid-19 Data in the US: Adaptive Phase-Space Approach. IEEE Open J. Eng. Med. Biol. 2020, 1, 207–213. [Google Scholar] [CrossRef]
- Roda, W.C.; Varughese, M.B.; Han, D.; Li, M.Y. Why is it difficult to accurately predict the COVID-19 epidemic? Infect. Dis. Model. 2020, 5, 271–281. [Google Scholar] [CrossRef] [PubMed]
- Liu, M.; Thomadsen, R.; Yao, S. Forecasting the spread of COVID-19 under different reopening strategies. Sci. Rep. 2020, 10, 1–8. [Google Scholar] [CrossRef]
- Li, M.-T.; Sun, G.-Q.; Zhang, J.; Zhao, Y.; Pei, X.; Li, L.; Wang, Y.; Zhang, W.-Y.; Zhang, Z.-K.; Jin, Z. Analysis of COVID-19 transmission in Shanxi Province with discrete time imported cases. Math. Biosci. Eng. 2020, 17, 3710–3720. [Google Scholar] [CrossRef]
- Ives, A.R.; Bozzuto, C. Estimating and explaining the spread of COVID-19 at the county level in the USA. Commun. Biol. 2021, 4, 1–9. [Google Scholar] [CrossRef]
- Kuniya, T. Prediction of the Epidemic Peak of Coronavirus Disease in Japan, 2020. J. Clin. Med. 2020, 9, 789. [Google Scholar] [CrossRef] [Green Version]
- Chen, T.-M.; Rui, J.; Wang, Q.-P.; Zhao, Z.-Y.; Cui, J.-A.; Yin, L. A mathematical model for simulating the phase-based transmissibility of a novel coronavirus. Infect. Dis. Poverty 2020, 9, 1–8. [Google Scholar] [CrossRef] [Green Version]
- Ibrahim, M.; Al-Najafi, A. Modeling, Control, and Prediction of the Spread of COVID-19 Using Compartmental, Logistic, and Gauss Models: A Case Study in Iraq and Egypt. Processes 2020, 8, 1400. [Google Scholar] [CrossRef]
- Boldog, P.; Tekeli, T.; Vizi, Z.; Dénes, A.; Bartha, F.A.; Röst, G. Risk Assessment of Novel Coronavirus COVID-19 Outbreaks Outside China. J. Clin. Med. 2020, 9, 571. [Google Scholar] [CrossRef] [Green Version]
- Hilton, J.; Keeling, M.J. Estimation of country-level basic reproductive ratios for novel Coronavirus (SARS-CoV-2/COVID-19) using synthetic contact matrices. PLoS Comput. Biol. 2020, 16, e1008031. [Google Scholar] [CrossRef]
- Nishiura, H.; Chowell, G. The Effective Reproduction Number as a Prelude to Statistical Estimation of Time-Dependent Epidemic Trends. In Mathematical and Statistical Estimation Approaches in Epidemiology; Springer: Berlin/Heidelberg, Germany, 2009; pp. 103–121. [Google Scholar]
- Delamater, P.L.; Street, E.J.; Leslie, T.F.; Yang, Y.T.; Jacobsen, K. Complexity of the Basic Reproduction Number (R0). Emerg. Infect. Dis. 2019, 25, 1–4. [Google Scholar] [CrossRef] [PubMed] [Green Version]
- Musa, S.S.; Zhao, S.; Wang, M.H.; Habib, A.G.; Mustapha, U.T.; He, D. Estimation of exponential growth rate and basic reproduction number of the coronavirus disease 2019 (COVID-19) in Africa. Infect. Dis. Poverty 2020, 9, 1–6. [Google Scholar] [CrossRef] [PubMed]
- Zhao, S.; Han, L.; He, D.; Qin, J. Public awareness, news promptness and the measles outbreak in Hong Kong from March to April 2019. Infect. Dis. 2020, 52, 284–290. [Google Scholar] [CrossRef]
- Nasab, S.R.; Zahiri, A.-P.; Roohi, E. Prediction of peak and termination of novel coronavirus COVID-19 epidemic in Iran. Int. J. Mod. Phys. C 2020, 31, 1–13. [Google Scholar] [CrossRef]
- Lee, S.Y.; Lei, B.; Mallick, B. Estimation of COVID-19 spread curves integrating global data and borrowing information. PLoS ONE 2020, 15, e0236860. [Google Scholar] [CrossRef]
- Tosepu, R.; Gunawan, J.; Effendy, D.S.; Ahmad, L.O.A.I.; Lestari, H.; Bahar, H.; Asfian, P. Correlation between weather and Covid-19 pandemic in Jakarta, Indonesia. Sci. Total Environ. 2020, 725, 138436. [Google Scholar] [CrossRef]
- Almeshal, A.M.; Almazrouee, A.I.; Alenizi, M.R.; Alhajeri, S.N. Forecasting the Spread of COVID-19 in Kuwait Using Compartmental and Logistic Regression Models. Appl. Sci. 2020, 10, 3402. [Google Scholar] [CrossRef]
- Sarhan, A.R.; Flaih, M.H.; Hussein, T.A.; Hussein, K.R. Novel coronavirus (COVID-19) Outbreak in Iraq: The First Wave and Future Scenario. medRxiv 2020. [Google Scholar] [CrossRef]
- Tahir, F.R. Epidemiological Characteristics of COVID-19 Ongoing Epidemic in Iraq; Bull. World Health Organ; WHO: Geneva, Switzerland, 2020. [Google Scholar] [CrossRef]
- Saba, A.I.; Elsheikh, A.H. Forecasting the prevalence of COVID-19 outbreak in Egypt using nonlinear autoregressive artificial neural networks. Process. Saf. Environ. Prot. 2020, 141, 1–8. [Google Scholar] [CrossRef] [PubMed]
- Punn, N.S.; Sonbhadra, S.K.; Agarwal, S. COVID-19 Epidemic Analysis using Machine Learning and Deep Learning. Algorithms 2020, 324, 57–78. [Google Scholar] [CrossRef] [Green Version]
- Wang, Y.; Hu, M.; Zhou, Y.; Li, Q.; Yao, N.; Zhai, G.; Zhang, X.-P.; Yang, X. Unobtrusive and Automatic Classification of Multiple People’s Abnormal Respiratory Patterns in Real Time Using Deep Neural Network and Depth Camera. IEEE Internet Things J. 2020, 7, 8559–8571. [Google Scholar] [CrossRef]
- Ye, Y.; Hou, S.; Fan, Y.; Zhang, Y.; Qian, Y.; Sun, S.; Peng, Q.; Ju, M.; Song, W.; Loparo, K. α-Satellite: An AI-Driven System and Benchmark Datasets for Dynamic COVID-19 Risk Assessment in the United States. IEEE J. Biomed. Health Informatics 2020, 24, 2755–2764. [Google Scholar] [CrossRef]
- Rentsch, C.T.; Kidwai-Khan, F.; Tate, J.P.; Park, L.S.; Jr, J.T.K.; Skanderson, M.; Hauser, R.G.; Schultze, A.; Jarvis, C.I.; Holodniy, M.; et al. Patterns of COVID-19 testing and mortality by race and ethnicity among United States veterans: A nationwide cohort study. PLoS Med. 2020, 17, e1003379. [Google Scholar] [CrossRef] [PubMed]
- Chimmula, V.K.R.; Zhang, L. Time series forecasting of COVID-19 transmission in Canada using LSTM networks. Chaos Solitons Fractals 2020, 135, 109864. [Google Scholar] [CrossRef] [PubMed]
- Dutta, S.; Bandyopadhyay, K.S. Machine Learning Approach for Confirmation of COVID-19 Cases: Positive, Negative, Death and Release. medRxiv 2020. [Google Scholar] [CrossRef] [Green Version]
- Latz, C.A.; Decarlo, C.; Boitano, L.; Png, C.Y.M.; Patell, R.; Conrad, M.F.; Eagleton, M.; Dua, A. Blood type and outcomes in patients with COVID-19. Ann. Hematol. 2020, 99, 2113–2118. [Google Scholar] [CrossRef] [PubMed]
- Zhao, J.; Yang, Y.; Huang, H.; Li, D.; Gu, D.; Lu, X.; Zhang, Z.; Liu, L.; Liu, T.; Liu, Y.; et al. Relationship Between the ABO Blood Group and the Coronavirus Disease 2019 (COVID-19) Susceptibility. Clin. Infect. Dis. 2020, 1–18. [Google Scholar] [CrossRef]
- Brawley, R.L. Clinical infectious diseases. Am. J. Infect. Control. 1989, 17, 365–366. [Google Scholar] [CrossRef]
- Rubin, R. Investigating Whether Blood Type Is Linked to COVID-19 Risk. JAMA 2020, 324, 1273. [Google Scholar] [CrossRef]
- Algunmeeyn, A.; El-Dahiyat, F.; Altakhineh, M.M.; Azab, M.; Babar, Z.-U.-D. Understanding the factors influencing healthcare providers’ burnout during the outbreak of COVID-19 in Jordanian hospitals. J. Pharm. Policy Pract. 2020, 13, 1–8. [Google Scholar] [CrossRef]
- Abdelhafiz, A.S.; Ali, A.; Ziady, H.H.; Maaly, A.M.; Alorabi, M.; Sultan, E.A. Prevalence, Associated Factors, and Consequences of Burnout Among Egyptian Physicians During COVID-19 Pandemic. Front. Public Health 2020, 8, 590190. [Google Scholar] [CrossRef]
- Bekele, F.; Sheleme, T.; Fekadu, G.; Bekele, K. Patterns and associated factors of COVID-19 knowledge, attitude, and practice among general population and health care workers: A systematic review. SAGE Open Med. 2020, 8. [Google Scholar] [CrossRef]
- Lindesmith, L.C.; Moe, C.L.; Marionneau, S.; Ruvoen, N.; Jiang, X.; Lindblad, L.; Stewart, P.W.; LePendu, J.; Baric, R.S. Human susceptibility and resistance to Norwalk virus infection. Nat. Med. 2003, 9, 548–553. [Google Scholar] [CrossRef]
- Chandekar, S.A.; Amonkar, G.P.; Desai, H.M.; Valvi, N.; Puranik, G.V. Seroprevalence of transfusion transmitted in-fections in healthy blood donors: A 5-year tertiary care hospital experience. J. Lab. Physicians 2017, 9, 283–287. [Google Scholar]
- Anderson, J.L.; May, H.T.; Knight, S.; Bair, T.L.; Muhlestein, J.B.; Knowlton, K.U.; Horne, B.D. Association of Sociodemographic Factors and Blood Group Type With Risk of COVID-19 in a US Population. JAMA Netw. Open. 2021, 4, e217429. [Google Scholar] [CrossRef]
- Göker, H.; Aladağ-Karakulak, E.; Demiroğlu, H.; Ayaz, C.M.; Büyükaşik, Y.; İnkaya, A.C.; Aksu, S.; Sayinalp, N.; İbrahim; Haznedaroğlu, C.; et al. The effects of blood group types on the risk of COVID-19 infection and its clinical outcome. Turkish J. Med. Sci. 2020, 50, 679–683. [Google Scholar] [CrossRef] [PubMed]
- Zhang, Y.; Garner, R.; Salehi, S.; La Rocca, M.; Duncan, D. Association between ABO blood types and coronavirus disease 2019 (COVID-19), genetic associations, and underlying molecular mechanisms: A literature review of 23 studies. Ann. Hematol. 2021, 100, 1123–1132. [Google Scholar] [CrossRef] [PubMed]
- Williamson, E.J.; Walker, A.J.; Bhaskaran, K.; Bacon, S.; Bates, C.; Morton, C.E.; Curtis, H.J.; Mehrkar, A.; Evans, D.; Inglesby, P.; et al. Factors associated with COVID-19-related death using Open SAFELY. Nature 2020, 584, 430–436. [Google Scholar] [CrossRef] [PubMed]
- Hoffmann, C.; Wolf, E. Older age groups and country-specific case fatality rates of COVID-19 in Europe, USA and Canada. Infection 2021, 49, 111–116. [Google Scholar] [CrossRef] [PubMed]
- Sudharsanan, N.; Didzun, O.; Bärnighausen, T.; Geldsetzer, P. The Contribution of the Age Distribution of Cases to COVID-19 Case Fatality Across Countries: A Nine-Country Demographic Study. Ann. Intern. Med. 2020, 173, 714–720. [Google Scholar] [CrossRef]
- Omori, R.; Matsuyama, R.; Nakata, Y. The age distribution of mortality from novel coronavirus disease (COVID-19) suggests no large difference of susceptibility by age. Sci. Rep. 2020, 10, 16642. [Google Scholar] [CrossRef]
- Ahmad, S. Potential of age distribution profiles for the prediction of COVID-19 infection origin in a patient group. Inform. Med. Unlocked 2020, 20, 100364. [Google Scholar] [CrossRef] [PubMed]
- Tadiri, C.P.; Gisinger, T.; Kautzky-Willer, A.; Kublickiene, K.; Herrero, M.T.; Raparelli, V.; Pilote, L.; Norris, C.M. The influence of sex and gender domains on COVID-19 cases and mortality. Can. Med. Assoc. J. 2020, 192, E1041–E1045. [Google Scholar] [CrossRef] [PubMed]
- Stoian, A.P.; Pricop-Jeckstadt, M.; Pana, A.; Ileanu, B.-V.; Schitea, R.; Geanta, M.; Catrinoiu, D.; Suceveanu, A.I.; Serafinceanu, C.; Pituru, S.; et al. Death by SARS-CoV 2: A Romanian COVID-19 multi-centre comorbidity study. Sci. Rep. 2020, 10, 1–11. [Google Scholar] [CrossRef]
- WHO Gender and COVID-19; World Health Organization: Geneva, Switzerland, 2020.
- Lim, S.; Bae, J.H.; Kwon, H.-S.; Nauck, M.A. COVID-19 and diabetes mellitus: From pathophysiology to clinical management. Nat. Rev. Endocrinol. 2021, 17, 11–30. [Google Scholar] [CrossRef] [PubMed]
- Röst, G.; Bartha, F.A.; Bogya, N.; Boldog, P.; Dénes, A.; Ferenci, T.; Horváth, K.J.; Juhász, A.; Nagy, C.; Tekeli, T.; et al. Early Phase of the COVID-19 Outbreak in Hungary and Post-Lockdown Scenarios. Viruses 2020, 12, 708. [Google Scholar] [CrossRef]
- Docherty, A.B.; Harrison, E.M.; Green, C.A.; Hardwick, H.E.; Pius, R.; Norman, L.; Holden, K.A.; Read, J.M.; Dondelinger, F.; Carson, G.; et al. Features of 20 133 UK patients in hospital with covid-19 using the ISARIC WHO Clinical Characterisation Protocol: Prospective observational cohort study. BMJ 2020, 369, 1–12. [Google Scholar] [CrossRef]
- Tartof, S.Y.; Qian, L.; Hong, M.V.; Wei, M.R.; Nadjafi, R.F.; Fischer, H.; Li, M.Z.; Shaw, D.S.F.; Caparosa, M.S.L.; Nau, C.L.; et al. Obesity and Mortality Among Patients Diagnosed With COVID-19: Results from an Integrated Health Care Organization. Ann. Intern. Med. 2020, 173, 773–781. [Google Scholar] [CrossRef]
- Halpern, B.; Louzada, M.L.D.C.; Aschner, P.; Gerchman, F.; Brajkovich, I.; Faria-Neto, J.R.; Polanco, F.E.; Montero, J.; Juliá, S.M.M.; Lotufo, P.A.; et al. Obesity and COVID-19 in Latin America: A tragedy of two pandemics—Official document of the Latin American Federation of Obesity Societies. Obes. Rev. 2021, 22, 1–12. [Google Scholar] [CrossRef]
- Van Zyl-Smit, R.N.; Richards, G.; Leone, F.T. Tobacco smoking and COVID-19 infection. Lancet Respir. Med. 2020, 8, 664–665. [Google Scholar] [CrossRef]
- Malasinghe, L.P.; Ramzan, N.; Dahal, K. Remote patient monitoring: A comprehensive study. J. Ambient. Intell. Humaniz. Comput. 2019, 10, 57–76. [Google Scholar] [CrossRef] [Green Version]
- Aydin, N.; Yurdakul, G. Assessing countries’ performances against COVID-19 via WSIDEA and machine learning algorithms. Appl. Soft Comput. 2020, 97, 106792. [Google Scholar] [CrossRef] [PubMed]
- Gülsen, A.; Yigitbas, B.A.; Uslu, B.; Drömann, D.; Kilinc, O. The Effect of Smoking on COVID-19 Symptom Severity: Systematic Review and Meta-Analysis. Pulm. Med. 2020, 2020, 1–11. [Google Scholar] [CrossRef] [PubMed]
- Wang, P.; Sha, J.; Meng, M.; Wang, C.; Yao, Q.; Zhang, Z.; Sun, W.; Wang, X.; Qie, G.; Bai, X.; et al. Risk factors for severe COVID-19 in middle-aged patients without comorbidities: A multicentre retrospective study. J. Transl. Med. 2020, 18, 461. [Google Scholar] [CrossRef] [PubMed]
- Zhao, W.; Zhang, J.; Meadows, M.E.; Liu, Y.; Hua, T.; Fu, B. A systematic approach is needed to contain COVID-19 globally. Sci. Bull. 2020, 65, 876–878. [Google Scholar] [CrossRef] [Green Version]
- Murthy, S.; Gomersall, C.D.; Fowler, R.A. Care for Critically Ill Patients With COVID-19. JAMA 2020, 323, 1499. [Google Scholar] [CrossRef] [Green Version]
- Khan, I.U.; Aslam, N.; Aljabri, M.; Aljameel, S.S.; Kamaleldin, M.M.A.; Alshamrani, F.M.; Chrouf, S.M.B. Computational Intelligence-Based Model for Mortality Rate Prediction in COVID-19 Patients. Int. J. Environ. Res. Public Health 2021, 18, 6429. [Google Scholar] [CrossRef]
- Van Der Schaar, M.; Alaa, A.M.; Floto, A.; Gimson, A.; Scholtes, S.; Wood, A.; McKinney, E.; Jarrett, D.; Lio, P.; Ercole, A. How artificial intelligence and machine learning can help healthcare systems respond to COVID-19. Mach. Learn. 2021, 110, 1–14. [Google Scholar] [CrossRef]
- Liang, W.; Yao, J.; Chen, A.; Lv, Q.; Zanin, M.; Liu, J.; Wong, S.; Li, Y.; Lu, J.; Liang, H.; et al. Early triage of critically ill COVID-19 patients using deep learning. Nat. Commun. 2020, 1–7. [Google Scholar] [CrossRef]
- Zhu, J.S.; Ge, P.; Jiang, C.; Zhang, Y.; Li, X.; Zhao, Z.; Zhang, L.; Duong, T.Q. Deep-learning artificial intelligence analysis of clinical variables predicts mortality in COVID-19 patients. J. Am. Coll. Emerg. Physicians Open 2020, 1, 1364–1373. [Google Scholar] [CrossRef]
- Richardson, S.; Hirsch, J.S.; Narasimhan, M.; Crawford, J.M.; McGinn, T.; Davidson, K.W.; Barnaby, D.P.; Becker, L.B.; Chelico, J.D.; Cohen, S.L.; et al. Presenting characteristics, comorbidities, and outcomes among 5700 patients hospitalized with COVID-19 in the New York City Area. JAMA 2020, 323, 2052–2059. [Google Scholar] [CrossRef] [PubMed]
- Thapa, K.; Mph, B.; Badal, S.; Bajgain, B.B.; Santana, M.J. American Journal of Infection Control Prevalence of comorbidities among individuals with COVID-19: A rapid review of current literature. AJIC Am. J. Infect. Control 2021, 49, 238–246. [Google Scholar]
- Luo, L.; Fu, M.; Li, Y.; Hu, S.; Luo, J.; Chen, Z.; Yu, J.; Li, W.; Dong, R.; Yang, Y.; et al. The potential association between common comorbidities and severity and mortality of coronavirus disease 2019: A pooled analysis. Clin. Cardiol. 2020, 43, 1478–1493. [Google Scholar] [CrossRef]
- Cavallaro, M.; Moiz, H.; Keeling, M.J.; Mccarthy, N.D. Contrasting factors associated with COVID-19-related ICU and death outcomes: Interpretable multivariable analyses of the UK CHESS dataset. medRxiv 2020. [Google Scholar] [CrossRef]
- Aabed, K.; Lashin, M.M.A. An analytical study of the factors that influence COVID-19 spread. Saudi J. Biol. Sci. 2021, 28, 1177–1195. [Google Scholar] [CrossRef]
- Nakada, L.Y.K.; Urban, R.C. COVID-19 pandemic: Environmental and social factors influencing the spread of SARS-CoV-2 in São Paulo, Brazil. Environ. Sci. Pollut. Res. 2020, 1–7. [Google Scholar] [CrossRef]
- Azuma, K.; Yanagi, U.; Kagi, N.; Kim, H.; Ogata, M.; Hayashi, M. Environmental factors involved in SARS- CoV-2 transmission: Effect and role of indoor environmental quality in the strategy for COVID-19 infection control. Environ. Health Prev. Med. 2020, 2, 1–16. [Google Scholar] [CrossRef]
- Bellantuono, L.; Monaco, A.; Tangaro, S.; Amoroso, N.; Aquaro, V.; Bellotti, R. An equity-oriented rethink of global rankings with complex networks mapping development. Sci. Rep. 2020, 10, 1–15. [Google Scholar] [CrossRef] [PubMed]
- Ivanov, J.; Polshakov, D.; Kato-Weinstein, J.; Zhou, Q.; Li, Y.; Granet, R.; Garner, L.; Deng, Y.; Liu, C.; Albaiu, D.; et al. Quantitative Structure–Activity Relationship Machine Learning Models and their Applications for Identifying Viral 3CLpro- and RdRp-Targeting Compounds as Potential Therapeutics for COVID-19 and Related Viral Infections. ACS Omega 2020, 5, 27344–27358. [Google Scholar] [CrossRef]
- Zhou, Y.; Wang, F.; Tang, J.; Nussinov, R.; Cheng, F. Articial intelligence in COVID-19 drug repurposing. Lancet Digit Health 2020. [Google Scholar] [CrossRef]
- Jain, S.; Potschka, H.; Chandra, P.P.; Tripathi, M.; Vohora, D. Management of COVID-19 in patients with seizures: Mechanisms of action of potential COVID-19 drug treatments and consideration for potential drug-drug interactions with anti-seizure medications. Epilepsy Res. 2021, 174, 106675. [Google Scholar] [CrossRef] [PubMed]
- Mohanty, S.; Rashid, M.H.A.; Mridul, M.; Mohanty, C.; Swayamsiddha, S. Application of Artificial Intelligence in COVID-19 drug repurposing. Diabetes Metab. Syndr. Clin. Res. Rev. 2020, 14, 1027–1031. [Google Scholar] [CrossRef]
- Bung, N.; Krishnan, S.R.; Bulusu, G.; Roy, A. De novo design of new chemical entities for SARS-CoV-2 using artificial intelligence. Future Med. Chem. 2021, 13, 575–585. [Google Scholar] [CrossRef]
- Zhou, Y.; Hou, Y.; Shen, J.; Huang, Y.; Martin, W.; Cheng, F. Network-based drug repurposing for novel coronavirus 2019-nCoV/SARS-CoV-2. Cell Discov. 2020, 6, 14. [Google Scholar] [CrossRef] [PubMed] [Green Version]
- Avchaciov, K.; Burmistrova, O.; Fedichev, P. AI for the Repurposing of Approved or Investigational Drugs against COVID-19. 2020. Available online: https://www.researchgate.net/publication/339998830_AI_for_the_repurposing_of_approved_or_investigational_drugs_against_COVID-19?channel=doi&linkId=5e71c42d299bf1571845af01&showFulltext=true (accessed on 31 May 2021).
- Wu, Z.; Pan, S.; Chen, F.; Long, G.; Zhang, C.; Yu, P.S. A Comprehensive Survey on Graph Neural Networks. IEEE Trans. Neural Netw. Learn. Syst. 2021, 32, 4–24. [Google Scholar] [CrossRef] [Green Version]
- Zhao, S.; Qin, B.; Liu, T.; Wang, F. Biomedical Knowledge Graph Refinement with Embedding and Logic Rules. arXiv 2020, arXiv:2012.01031. [Google Scholar]
- Nicholson, D.N.; Greene, C.S. Constructing knowledge graphs and their biomedical applications. Comput. Struct. Biotechnol. J. 2020, 18, 1414–1428. [Google Scholar] [CrossRef]
- Richardson, P.; Griffin, I.; Tucker, C.; Smith, D.; Oechsle, O.; Phelan, A.; Rawling, M.; Savory, E.; Stebbing, J. Baricitinib as potential treatment for 2019-nCoV acute respiratory disease. Lancet 2020, 395, e30–e31. [Google Scholar] [CrossRef] [Green Version]
- Segler, M.H.S.; Preuss, M.; Waller, M.P. Planning chemical syntheses with deep neural networks and symbolic AI. Nat. Cell Biol. 2018, 555, 604–610. [Google Scholar] [CrossRef] [Green Version]
- Fauqueur, J.; Thillaisundaram, A.; Togia, T. Constructing large scale biomedical knowledge bases from scratch with rapid annotation of interpretable patterns. arXiv 2019, arXiv:1907.01417. [Google Scholar]
- Ge, Y.; Tian, T.; Huang, S.; Wan, F.; Li, J.; Li, S.; Yang, H.; Hong, L.; Wu, N.; Yuan, E.; et al. A data-driven drug repositioning framework discovered a potential therapeutic agent targeting COVID-19. bioRxiv 2020. [Google Scholar] [CrossRef] [Green Version]
- Loucera, C.; Esteban-Medina, M.; Rian, K.; Falco, M.M.; Dopazo, J.; Peña-Chilet, M. Drug repurposing for COVID-19 using machine learning and mechanistic models of signal transduction circuits related to SARS-CoV-2 infection. Signal Transduct. Target. Ther. 2020, 5, 19–21. [Google Scholar] [CrossRef]
- Hsieh, K.; Wang, Y.; Chen, L.; Zhao, Z.; Savitz, S.; Jiang, X.; Tang, J.; Kim, Y. Drug Repurposing for COVID-19 using Graph Neural Network with Genetic, Mechanistic, and Epidemiological Validation 2020. arXiv 2020, arXiv:2009.10931. [Google Scholar]
- Zeng, X.; Song, X.; Ma, T.; Pan, X.; Zhou, Y.; Hou, Y.; Zhang, Z.; Li, K.; Karypis, G.; Cheng, F. Repurpose Open Data to Discover Therapeutics for COVID-19 Using Deep Learning. J. Proteome Res. 2020, 19, 4624–4636. [Google Scholar] [CrossRef] [PubMed]
- Liu, X.; Yang, Z.; Sang, S.; Lin, H.; Wang, J.; Xu, B. Detection of protein complexes from multiple protein interaction networks using graph embedding. Artif. Intell. Med. 2019, 96, 107–115. [Google Scholar] [CrossRef] [PubMed]
- Zhang, H.; Saravanan, K.M.; Yang, Y.; Hossain, T.; Li, J.; Ren, X.; Pan, Y.; Wei, Y. Deep Learning Based Drug Screening for Novel Coronavirus 2019-nCov. Interdiscip. Sci. Comput. Life Sci. 2020, 12, 368–376. [Google Scholar] [CrossRef] [PubMed]
- Wang, R.; Fang, X.; Lu, Y.; Wang, S. The PDB bind database: Collection of binding affinities for protein-ligand complexes with known three-dimensional structures. J. Med. Chem. 2004, 47, 2977–2980. [Google Scholar] [CrossRef]
- Gao, K.; Nguyen, D.D.; Wang, R.; Wei, G. Machine intelligence design of 2019-nCoV drugs. bioRxiv 2020. [Google Scholar] [CrossRef] [Green Version]
- Forest, R. Artificial Intelligence for Drug Discovery, Biomarker Development, and Generation of Novel Chemistry. Mol. Pharm. 2018, 15, 4311–4313. [Google Scholar]
- Batra, R.; Chan, H.; Kamath, G.; Ramprasad, R.; Cherukara, M.J.; Sankaranarayanan, S.K. Screening of Therapeutic Agents for COVID-19 Using Machine Learning and Ensemble Docking Studies. J. Phys. Chem. Lett. 2020, 11, 7058–7065. [Google Scholar] [CrossRef]
- Mall, R.; Elbasir, A.; al Meer, H.; Chawla, S.; Ullah, E. Data-Driven Drug Repurposing for COVID-19. ChemRxiv 2020. [Google Scholar] [CrossRef]
- Jamshidi, M.B.; Lalbakhsh, A.; Talla, J.; Peroutka, Z.; Hadjilooei, F.; Lalbakhsh, P.; Jamshidi, M.; La Spada, L.; Mirmozafari, M.; Dehghani, M.; et al. Artificial Intelligence and COVID-19: Deep Learning Approaches for Diagnosis and Treatment. IEEE Access 2020, 8, 109581–109595. [Google Scholar] [CrossRef]
- Tang, B.; He, F.; Liu, D.; Fang, M.; Wu, Z.; Xu, D. AI-aided design of novel targeted covalent inhibitors against SARS-CoV-2. bioRxiv 2020. [Google Scholar] [CrossRef] [Green Version]
- Nguyen, D.D.; Gao, K.; Chen, J.; Wang, R.; Wei, G.-W. Potentially highly potent drugs for 2019-nCoV. bioRxiv 2020. [Google Scholar] [CrossRef] [Green Version]
- Magar, R.; Yadav, P.; Farimani, A.B. Potential neutralizing antibodies discovered for novel corona virus using machine learning. Sci. Rep. 2021, 11, 5061. [Google Scholar] [CrossRef]
- Krammer, F. SARS-CoV-2 vaccines in development. Nature 2020, 586. [Google Scholar] [CrossRef] [PubMed]
- Le, T.T.; Cramer, J.P.; Chen, R.; Mayhew, S. Evolution of the COVID-19 vaccine development landscape. Nat. Rev. Drug Discov. 2020, 19, 667–668. [Google Scholar] [CrossRef]
- Kumar, A.; Gupta, P.K.; Srivastava, A. A review of modern technologies for tackling COVID-19 pandemic. Diabetes Metab. Syndr. Clin. Res. Rev. 2020, 14, 569–573. [Google Scholar] [CrossRef]
- Fast, E.; Chen, B. Potential T-cell and B-cell Epitopes of 2019-nCoV. bioRxiv 2020. [Google Scholar] [CrossRef] [Green Version]
- O’Connor, P.J.; Sperl-Hillen, J.; Fazio, C.J.; Averbeck, B.M.; Rank, B.H.; Margolis, K. Outpatient diabetes clinical decision support: Current status and future directions. Diabet. Med. 2016, 33, 734–741. [Google Scholar] [CrossRef] [PubMed] [Green Version]
- Parthasarathy, R.; Jaisoorya, T.S.; Thennarasu, K.; Murthy, P. Mental health issues among health care workers during the COVID-19 pandemic—A study from India. Asian J. Psychiatry 2021, 58, 102626. [Google Scholar] [CrossRef]
- Ong, E.; Wong, M.U.; Huffman, A.; He, Y. COVID-19 Coronavirus Vaccine Design Using Reverse Vaccinology and Machine Learning. Front. Immunol. 2020, 11, 1581. [Google Scholar] [CrossRef]
- Bellantuono, L.; Marzano, L.; La Rocca, M.; Duncan, D.; Lombardi, A.; Maggipinto, T.; Monaco, A.; Tangaro, S.; Amoroso, N.; Bellotti, R. Predicting brain age with complex networks: From adolescence to adulthood. NeuroImage 2021, 225, 117458. [Google Scholar] [CrossRef] [PubMed]
- Bustin, A.; Fuin, N.; Botnar, R.M.; Prieto, C. From Compressed-Sensing to Artificial Intelligence-Based Cardiac MRI Reconstruction. Front. Cardiovasc. Med. 2020, 7, 1–19. [Google Scholar] [CrossRef] [Green Version]
- PGraffy, P.M.; Sandfort, V.; Summers, R.M.; Pickhardt, P.J. Automated Liver Fat Quantification at Nonenhanced Abdominal CT for Population-based Steatosis Assessment. Radiology 2019, 293, 334–342. [Google Scholar] [CrossRef] [PubMed]
- Gozes, O.; Frid, M.; Greenspan, H.; Patrick, D. Rapid AI Development Cycle for the Coronavirus (COVID-19) Pandemic: Initial Results for Automated Detection & Patient Monitoring using Deep Learning CT Image Analysis. arXiv 2020, arXiv:2003.05037. [Google Scholar]
- El-Rashidy, N.; El-Sappagh, S.; Islam, S.; El-Bakry, H.M.; Abdelrazek, S. Mobile Health in Remote Patient Monitoring for Chronic Diseases: Principles, Trends, and Challenges. Diagnostics 2021, 11, 607. [Google Scholar] [CrossRef] [PubMed]
- Rahman, A.; Hossain, M.S.; Alrajeh, N.A.; Alsolami, F. Adversarial Examples—Security Threats to COVID-19 Deep Learning Systems in Medical IoT Devices. IEEE Internet Things J. 2021, 8, 9603–9610. [Google Scholar] [CrossRef]
- El-Rashidy, N.; El-Sappagh, S.; Abuhmed, T.; Abdelrazek, S.; El-Bakry, H.M. Intensive Care Unit Mortality Prediction: An Improved Patient-Specific Stacking Ensemble Model. IEEE Access 2020, 8, 133541–133564. [Google Scholar] [CrossRef]
- El-Rashidy, N.; El-Sappagh, S.; Islam, S.M.R.; El-Bakry, H.M.; Abdelrazek, S. End-To-End Deep Learning Framework for Coronavirus (COVID-19) Detection and Monitoring. Electronics 2020, 9, 1439. [Google Scholar] [CrossRef]
- Yang, G.; Zhang, H.; Firmin, D.; Li, S. Recent advances in artificial intelligence for cardiac imaging. Comput. Med. Imaging Graph. 2021, 90, 101928. [Google Scholar] [CrossRef] [PubMed]
- Gagneux-Brunon, A.; Detoc, M.; Bruel, S.; Tardy, B.; Rozaire, O.; Frappe, P.; Botelho-Nevers, E. Intention to get vaccinations against COVID-19 in French healthcare workers during the first pandemic wave: A cross-sectional survey. J. Hosp. Infect. 2021, 108, 168–173. [Google Scholar] [CrossRef] [PubMed]
- Alhasan, M.; Hasaneen, M. Digital Imaging, Technologies and Artificial Intelligence Applications during COVID-19 pandemic. Comput. Med. Imaging Graph. 2021, 91, 101933. [Google Scholar] [CrossRef] [PubMed]
- Zeng, Z.; Chen, P.-J.; Lew, A.A. From high-touch to high-tech: COVID-19 drives robotics adoption. Tour. Geogr. 2020, 22, 724–734. [Google Scholar] [CrossRef]
- Estrada, M.A.R.; Ndoma, A. The uses of unmanned aerial vehicles–UAV’s- (or drones) in social logistic: Natural disasters response and humanitarian relief aid. Procedia Comput. Sci. 2019, 149, 375–383. [Google Scholar] [CrossRef]
- Tavakoli, M.; Carriere, J.; Torabi, A. Robotics, Smart Wearable Technologies, and Autonomous Intelligent Systems for Healthcare During the COVID-19 Pandemic: An Analysis of the State of the Art and Future Vision. Adv. Intell. Syst. 2020, 2, 2000071. [Google Scholar] [CrossRef]
- AAbd-Alrazaq, A.; Alhuwail, D.; Househ, M.; Hamdi, M.; Shah, Z. Top Concerns of Tweeters During the COVID-19 Pandemic: Infoveillance Study. J. Med. Internet Res. 2020, 22, e19016. [Google Scholar] [CrossRef] [Green Version]
- Torales, J.; O’Higgins, M.; Castaldelli-Maia, J.M.; Ventriglio, A. The outbreak of COVID-19 coronavirus and its impact on global mental health. Int. J. Soc. Psychiatry 2020, 66, 317–320. [Google Scholar] [CrossRef] [Green Version]
- Li, S.; Wang, Y.; Xue, J.; Zhao, N.; Zhu, T. The Impact of COVID-19 Epidemic Declaration on Psychological Consequences: A Study on Active Weibo Users. Int. J. Environ. Res. Public Health 2020, 17, 2032. [Google Scholar] [CrossRef] [Green Version]
- Jaiswal, A.K.; Tiwari, P.; Kumar, S.; Gupta, D.; Khanna, A.; Rodrigues, J.J. Identifying pneumonia in chest X-rays: A deep learning approach. Measurement 2019, 145, 511–518. [Google Scholar] [CrossRef]
- Civit-Masot, J.; Luna-Perejón, F.; Morales, M.D.; Civit, A. Deep Learning System for COVID-19 Diagnosis Aid Using X-ray Pulmonary Images. Appl. Sci. 2020, 10, 4640. [Google Scholar] [CrossRef]
- Apostolopoulos, I.D.; Aznaouridis, S.I.; Tzani, M.A. Extracting Possibly Representative COVID-19 Biomarkers from X-ray Images with Deep Learning Approach and Image Data Related to Pulmonary Diseases. J. Med. Biol. Eng. 2020, 40, 462–469. [Google Scholar] [CrossRef]
- Horry, M.J.; Chakraborty, S.; Paul, M.; Ulhaq, A.; Pradhan, B.; Saha, M.; Shukla, N. COVID-19 Detection Through Transfer Learning Using Multimodal Imaging Data. IEEE Access 2020, 8, 149808–149824. [Google Scholar] [CrossRef]
- Pereira, R.M.; Bertolini, D.; Teixeira, L.O.; Silla, C.N.; Costa, Y.M.G. Computer Methods and Programs in Biomedicine COVID-19 identification in chest X-ray images on flat and hierarchical classification scenarios. Comput. Methods Prog. Biomed. 2020, 194, 105532. [Google Scholar] [CrossRef] [PubMed]
- Yadav, S.; Kaur, J.; Pathak, Y.; Jadhav, S. Chest X-ray Scanning Based Detection of COVID-19 Using Deep Convolutional Neural Network. 2015. Available online: https://assets.researchsquare.com/files/rs-58833/v1_stamped.pdf (accessed on 31 May 2021).
- Jain, G.; Mittal, D.; Thakur, D.; Mittal, M.K. A deep learning approach to detect Covid-19 coronavirus with X-Ray images. Biocybern. Biomed. Eng. 2020, 40, 1391–1405. [Google Scholar] [CrossRef] [PubMed]
- Yu, C.; Zhou, M.; Liu, Y.; Guo, T.; Ou, C.; Yang, L.; Li, Y.; Li, D.; Hu, X.; Shuai, L.; et al. Characteristics of asymptomatic COVID-19 infection and progression: A multicenter, retrospective study. Virulence 2020, 11, 1006–1014. [Google Scholar] [CrossRef]
- Jiang, X.; Coffee, M.; Bari, A.; Wang, J.; Jiang, X.; Huang, J.; Shi, J.; Dai, J.; Cai, J.; Zhang, T.; et al. Towards an Artificial Intelligence Framework for Data-Driven Prediction of Coronavirus Clinical Severity. Comput. Mater. Contin. 2020, 62, 537–551. [Google Scholar] [CrossRef]
- Shelke, A.; Inamdar, M.; Shah, V.; Tiwari, A.; Hussain, A.; Chafekar, T.; Mehendale, N. Chest X-ray Classification Using Deep Learning for Automated COVID-19 Screening. SN Comput. Sci. 2021, 2, 300. [Google Scholar] [CrossRef]
- Soomro, T.A.; Zheng, L.; Afifi, A.J.; Ali, A.; Yin, M.; Gao, J. Artificial intelligence (AI) for medical imaging to combat coronavirus disease (COVID-19): A detailed review with direction for future research. Artif. Intell. Rev. 2021, 1–31. [Google Scholar] [CrossRef]
- Rahmatizadeh, S.; Valizadeh-Haghi, S.; Dabbagh, A. The role of artificial intelligence in management of critical COVID-19 patients. J. Cell. Mol. Anesth. 2020, 5, 16–22. [Google Scholar]
- Feng, C.; Wang, L.; Chen, X.; Zhai, Y.; Zhu, F.; Chen, H.; Wang, Y.; Su, X.; Huang, S.; Tian, L.; et al. A novel artificial intelligence-assisted triage tool to aid in the diagnosis of suspected COVID-19 pneumonia cases in fever clinics. Ann. Transl. Med. 2021, 9, 201. [Google Scholar] [CrossRef] [PubMed]
- Yan, L.; Zhang, H.-T.; Goncalves, J.; Xiao, Y.; Wang, M.; Guo, Y.; Sun, C.; Tang, X.; Jin, L.; Zhang, M.; et al. A machine learning-based model for survival prediction in patients with severe COVID-19 infection. MedRxiv 2020. [Google Scholar] [CrossRef] [Green Version]
- Senior, A.W.; Evans, R.; Jumper, J.; Kirkpatrick, J.; Sifre, L.; Green, T.; Qin, C.; Žídek, A.; Nelson, A.W.R.; Bridgland, A.; et al. Improved protein structure prediction using potentials from deep learning. Nature 2020, 577, 706–710. [Google Scholar] [CrossRef] [PubMed]
- Heo, L.; Feig, M. Modeling of Severe Acute Respiratory Syndrome Coronavirus 2 (SARS-CoV-2) Proteins by Machine Learning and Physics-Based Refinement. bioRxiv 2020. [Google Scholar] [CrossRef] [Green Version]
- Nguyen, T.T.; Abdelrazek, M.; Nguyen, D.T.; Aryal, S.; Nguyen, D.T.; Khatami, A. Origin of Novel Coronavirus (COVID-19): A Computational Biology Study using Artificial Intelligence. bioRxiv 2020. [Google Scholar] [CrossRef]
- Li, X.; Yu, J.; Zhang, Z.; Ren, J.; Peluffo, A.E.; Zhang, W.; Zhao, Y.; Wu, J.; Yan, K.; Cohen, D.; et al. Network bioinformatics analysis provides insight into drug repurposing for COVID-19. Med. Drug Discov. 2021, 10, 100090. [Google Scholar] [CrossRef] [PubMed]
- Zhavoronkov, A.; Aladinskiy, V.; Zhebrak, A.; Zagribelnyy, B.; Terentiev, V.; Bezrukov, D.S.; Polykovskiy, D.; Shayakhmetov, R.; Filimonov, A.; Orekhov, P.; et al. Potential 2019-nCoV 3C-like protease inhibitors designed using generative deep learning approaches. ChemRxiv 2020. [Google Scholar] [CrossRef]
- Nguyen, D.D.; Gao, K.; Wang, M.; Wei, G.-W. MathDL: Mathematical deep learning for D3R Grand Challenge 4. J. Comput. Mol. Des. 2019, 34, 131–147. [Google Scholar] [CrossRef] [PubMed] [Green Version]
- Robson, B. Computers and viral diseases. Preliminary bioinformatics studies on the design of a synthetic vaccine and a pre-ventative peptidomimetic antagonist against the SARS-CoV-2 (2019-nCoV, COVID-19) coronavirus. Comput. Biol. Med. 2020, 119, 103670. [Google Scholar] [CrossRef] [PubMed]
- HealthMap. Contagious Disease Surveillance. 2020. Available online: https://healthmap.org/en/ (accessed on 31 May 2021).
- James, A.; Dasarathy, B.V. A Review of Feature and Data Fusion with Medical Images. Matlab 2017, 491–507. [Google Scholar] [CrossRef]
- Hu, S.; Gao, Y.; Niu, Z.; Jiang, Y.; Li, L.; Xiao, X.; Wang, M.; Fang, E.F.; Menpes-Smith, W.; Xia, J.; et al. Weakly Supervised Deep Learning for COVID-19 Infection Detection and Classification from CT Images. IEEE Access 2020, 8, 118869–118883. [Google Scholar] [CrossRef]
- Li, X.; Zeng, W.; Li, X.; Chen, H.; Shi, L.; Li, X.; Xiang, H.; Cao, Y.; Chen, H.; Liu, C.; et al. CT imaging changes of corona virus disease 2019(COVID-19): A multi-center study in Southwest China. J. Transl. Med. 2020, 18, 1–8. [Google Scholar] [CrossRef] [PubMed] [Green Version]
- Cohen, J.P.; Morrison, P.; Dao, L. COVID-19 Image Data Collection. arXiv 2020, arXiv:2003.11597. [Google Scholar]
- Cohen, J.P.; Morrison, P.; Dao, L.; Roth, K.; Duong, T.Q.; Ghassemi, M. COVID-19 Image Data Collection: Prospective predictions are the future. arXiv 2020, arXiv:2006.11988v3. [Google Scholar]
- COVID-19 CT Lung and Infection Segmentation Dataset. Available online: https://zenodo.org/record/3757476#.X-9uTtj7Q2w (accessed on 16 February 2021).
- Yoo, S.H.; Geng, H.; Chiu, T.L.; Yu, S.K.; Cho, D.C.; Heo, J.; Choi, M.S.; Choi, I.H.; Van, C.C.; Nhung, N.V.; et al. Deep Learning-Based Decision-Tree Classifier for COVID-19 Diagnosis from Chest X-ray Imaging. Front. Med. 2020, 7, 427. [Google Scholar] [CrossRef]
- Wang, L.; Lin, Z.Q.; Wong, A. COVID-Net: A tailored deep convolutional neural network design for detection of COVID-19 cases from chest X-ray images. Sci. Rep. 2020, 10, 1–12. [Google Scholar] [CrossRef]
- Kermany, D.S.; Goldbaum, M.; Cai, W.; Valentim, C.C.; Liang, H.; Baxter, S.L.; McKeown, A.; Yang, G.; Wu, X.; Yan, F.; et al. Identifying Medical Diagnoses and Treatable Diseases by Image-Based Deep Learning. Cell 2018, 172, 1122–1131.e9. [Google Scholar] [CrossRef] [PubMed]
- Sharma, A.; Rani, S.; Gupta, D. Artificial Intelligence-Based Classification of Chest X-Ray Images into COVID-19 and Other Infectious Diseases. Int. J. Biomed. Imaging 2020, 2020, 1–10. [Google Scholar] [CrossRef] [PubMed]
- Shuja, J.; Alanazi, E.; Alasmary, W.; Alashaikh, A. COVID-19 open source data sets: A comprehensive survey. Appl. Intell. 2021, 51, 1296–1325. [Google Scholar] [CrossRef]
- Signoroni, A.; Savardi, M.; Benini, S.; Adami, N.; Leonardi, R.; Gibellini, P.; Vaccher, F.; Ravanelli, M.; Borghesi, A.; Maroldi, R.; et al. BS-Net: Learning COVID-19 pneumonia severity on a large chest X-ray dataset. Med. Image Anal. 2021, 71, 102046. [Google Scholar] [CrossRef] [PubMed]
- Wong, A.; Lin, Z.Q.; Wang, L.; Chung, A.G.; Shen, B.; Abbasi, A.; Hoshmand-Kochi, M.; Duong, T.Q. COVIDNet-S: Towards computer-aided severity assessment via training and validation of deep neural networks for geographic extent and opacity extent scoring of chest X-rays for SARS-CoV-2 lung disease severity. arXiv 2020, arXiv:2005.12855. [Google Scholar]
- Pia, L. SARS-CoV-2-reactive T cells in patients and healthy donors. Nat. Rev. Immunol. 2020, 20, 353. [Google Scholar] [CrossRef]
- Cohen-McFarlane, M.; Goubran, R.; Knoefel, F. Novel Coronavirus Cough Database: NoCoCoDa. IEEE Access 2020, 8, 154087–154094. [Google Scholar] [CrossRef]
- Pahar, M.; Klopper, M.; Warren, R.; Niesler, T. COVID-19 Cough Classification using Machine Learning and Global Smartphone Recordings. arXiv 2020, arXiv:2012.01926. [Google Scholar]
- Rahman, M.M.; Davis, D.N. Addressing the Class Imbalance Problem in Medical Datasets. Int. J. Mach. Learn. Comput. 2013, 3, 224–228. [Google Scholar] [CrossRef]
- Dash, T.; Mishra, S.; Panda, G.; Satapathy, S. Detection of COVID-19 from speech signal using bio-inspired based cepstral features. Pattern Recognit. 2021, 117, 107999. [Google Scholar] [CrossRef] [PubMed]
- Dong, E.; Du, H.; Gardner, L. An interactive web-based dashboard to track COVID-19 in real time. Lancet Infect. Dis. 2020, 20, 533–534. [Google Scholar] [CrossRef]
- Xu, B.; Kraemer, M.U.G.; Gutierrez, B.; Mekaru, S.; Sewalk, K.; Loskill, A.; Wang, L.; Cohn, E.; Hill, S.; Zarebski, A.; et al. Open access epidemiological data from the COVID-19 outbreak. Lancet Infect. Dis. 2020, 20, 534. [Google Scholar] [CrossRef] [Green Version]
- Xu, B.; Gutierrez, B.; Mekaru, S.; Sewalk, K.; Goodwin, L.; Loskill, A.; Cohn, E.L.; Hswen, Y.; Hill, S.C.; Cobo, M.M.; et al. Epidemiological data from the COVID-19 outbreak, real-time case information. Sci. Data 2020, 7, 1–6. [Google Scholar] [CrossRef]
- Kucharski, A.J.; Russell, T.W.; Diamond, C.; Liu, Y.; Edmunds, J.; Funk, S.; Eggo, R.M.; Sun, F.; Jit, M.; Munday, J.D.; et al. Early dynamics of transmission and control of COVID-19: A mathematical modelling study. Lancet Infect. Dis. 2020, 20, 553–558. [Google Scholar] [CrossRef] [Green Version]
- Wells, C.R.; Sah, P.; Moghadas, S.M.; Pandey, A.; Shoukat, A.; Wang, Y.; Wang, Z.; Meyers, L.A.; Singer, B.H.; Galvani, A.P. Impact of international travel and border control measures on the global spread of the novel 2019 coronavirus outbreak. Proc. Natl. Acad. Sci. USA 2020, 117, 7504–7509. [Google Scholar] [CrossRef] [Green Version]
- Tian, H.; Liu, Y.; Li, Y.; Wu, C.-H.; Chen, B.; Kraemer, M.U.G.; Li, B.; Cai, J.; Xu, B.; Yang, Q.; et al. An investigation of transmission control measures during the first 50 days of the COVID-19 epidemic in China. Science 2020, 368, 638–642. [Google Scholar] [CrossRef] [Green Version]
- Kraemer, M.U.G.; Yang, C.-H.; Gutierrez, B.; Wu, C.-H.; Klein, B.; Pigott, D.M.; Du Plessis, L.; Faria, N.R.; Li, R.; Hanage, W.P.; et al. The effect of human mobility and control measures on the COVID-19 epidemic in China. Science 2020, 368, 493–497. [Google Scholar] [CrossRef] [Green Version]
- Anzai, A.; Kobayashi, T.; Linton, N.M.; Kinoshita, R.; Hayashi, K.; Suzuki, A.; Yang, Y.; Jung, S.-M.; Miyama, T.; Akhmetzhanov, A.R.; et al. Assessing the Impact of Reduced Travel on Exportation Dynamics of Novel Coronavirus Infection (COVID-19). J. Clin. Med. 2020, 9, 601. [Google Scholar] [CrossRef] [Green Version]
- Petherick, A.; Kira, B.; Cameron-Blake, E.; Tatlow, H.; Hallas, L.; Hale, T.; Phillips, T.; Zhang, Y. Variation in Government Responses to COVID-19; BSG: Oxford, UK, 2020. [Google Scholar]
- Kleinberg, B.; van der Vegt, I.; Mozes, M. bMeasuring Emotions in the COVID-19 Real World Worry Dataset. arXiv 2020, arXiv:2004.04225. [Google Scholar]
- Banda, J.M.; Tekumalla, R.; Wang, G.; Yu, J.; Liu, T.; Ding, Y.; Chowell, G. A large-scale COVID-19 Twitter chatter dataset for open scientific research—An international collaboration. arXiv 2020, arXiv:2004.03688v1. [Google Scholar]
- Alqurashi, S.; Alhindi, A.; Alanazi, E. Large Arabic Twitter Dataset on COVID-19. arXiv 2020, arXiv:2004.04315. [Google Scholar]
- Barbosa, R.D.; Fernandes, M.A.C. Data stream dataset of SARS-CoV-2 genome. Data Br. 2020, 31, 105829. [Google Scholar] [CrossRef] [PubMed]
- Pickett, B.; Sadat, E.L.; Zhang, Y.; Noronha, J.M.; Squires, R.B.; Hunt, V.; Liu, M.; Kumar, S.; Zaremba, S.; Gu, Z.; et al. ViPR: An open bioinformatics database and analysis resource for virology research. Nucleic Acids Res. 2011, 40, D593–D598. [Google Scholar] [CrossRef]
- Wu, Y.-H.; Gao, S.-H.; Mei, J.; Xu, J.; Fan, D.-P.; Zhang, R.-G.; Cheng, M.-M. JCS: An Explainable COVID-19 Diagnosis System by Joint Classification and Segmentation. IEEE Trans. Image Process. 2021, 30, 3113–3126. [Google Scholar] [CrossRef]
- Ma, J.; Ge, C.; Wang, Y.; An, X.; Gao, J.; Yu, Z.; Zhang, M.; Liu, X.; Deng, X.; Cao, S.; et al. Covid-19 CT Lung and Infection Segmentation Dataset. 2020. Available online: https://zenodo.org/record/3757476#.YMqve6gzaUk (accessed on 31 May 2021).
- Kim, J. DS4C Patient Policy Province Dataset: A Comprehensive COVID-19 Dataset for Causal and Epidemiological Analysis. In Proceedings of the 4th Conference on Neural Information Processing Systems (NeurIPS 2020), Vancouver, BC, Canada, 4 June 2020. [Google Scholar]
- Wynants, L.; Van Calster, B.; Collins, G.S.; Riley, R.D.; Heinze, G.; Schuit, E.; Bonten, M.M.J.; Dahly, D.L.; Damen, J.; Debray, T.P.; et al. Prediction models for diagnosis and prognosis of covid-19: Systematic review and critical appraisal. BMJ 2020, 369, m1328. [Google Scholar] [CrossRef] [Green Version]
- Asraf, A.; Islam, Z.; Haque, R.; Islam, M. Deep Learning Applications to Combat Novel Coronavirus (COVID-19) Pandemic. SN Comput. Sci. 2020, 1, 1–7. [Google Scholar] [CrossRef]
- Bhattacharya, S.; Maddikunta, P.K.R.; Pham, Q.-V.; Gadekallu, T.R.; Chowdhary, C.L.; Alazab, M.; Piran, J. Deep learning and medical image processing for coronavirus (COVID-19) pandemic: A survey. Sustain. Cities Soc. 2021, 65, 102589. [Google Scholar] [CrossRef] [PubMed]
- Di Castelnuovo, A.; Bonaccio, M.; Costanzo, S.; Gialluisi, A.; Antinori, A.; Berselli, N.; Blandi, L.; Bruno, R.; Cauda, R.; Guaraldi, G.; et al. Common cardiovascular risk factors and in-hospital mortality in 3,894 patients with COVID-19: Survival analysis and machine learning-based findings from the multicentre Italian CORIST Study. Nutr. Metab. Cardiovasc. Dis. 2020, 30, 1899–1913. [Google Scholar] [CrossRef]
- Cabitza, F.; Campagner, A.; Ferrari, D.; Di Resta, C.; Ceriotti, D.; Sabetta, E.; Colombini, A.; De Vecchi, E.; Banfi, G.; Locatelli, M.; et al. Development, evaluation, and validation of machine learning models for COVID-19 detection based on routine blood tests. Clin. Chem. Lab. Med. 2021, 59, 421–431. [Google Scholar] [CrossRef]
- Xing, C.; Li, Q.; Du, H.; Kang, W.; Lian, J.; Yuan, L. Lung ultrasound findings in patients with COVID-19 pneumonia. Crit. Care 2020, 24, 1–3. [Google Scholar] [CrossRef]
- Liao, H.; Balocco, S.; Wang, G.; Zhang, F.; Liu, Y.; Ding, Z.; Duong, L.; Phellan, R.; Zahnd, G.; Breininger, K.; et al. Machine Learning and Medical Engineering for Cardiovascular Health and Intravascular Imaging and Computer Assisted Stenting. In Proceedings of the CVII-STENT 2019, Held Conjunction with MICCAI 11794, Shenzhen, China, 13 October 2019. [Google Scholar]
- Al-Antari, M.A.; Hua, C.-H.; Bang, J.; Lee, S. Fast deep learning computer-aided diagnosis of COVID-19 based on digital chest x-ray images. Appl. Intell. 2021, 51, 2890–2907. [Google Scholar] [CrossRef]
- Ismael, A.M.; Şengür, A. Deep learning approaches for COVID-19 detection based on chest X-ray images. Expert Syst. Appl. 2021, 164, 114054. [Google Scholar] [CrossRef] [PubMed]
- Das, N.N.; Kumar, N.; Kaur, M.; Kumar, V.; Singh, D. Automated Deep Transfer Learning-Based Approach for Detection of COVID-19 Infection in Chest X-rays. IRBM 2020. [Google Scholar] [CrossRef]
- Yeşilkanat, C.M. Spatio-temporal estimation of the daily cases of COVID-19 in worldwide using random forest machine learning algorithm. Chaos Solitons Fractals 2020, 140, 110210. [Google Scholar] [CrossRef] [PubMed]
- Trivedy, S.; Goyal, M.; Mohapatra, P.R.; Mukherjee, A. Design and Development of Smartphone-Enabled Spirometer With a Disease Classification System Using Convolutional Neural Network. IEEE Trans. Instrum. Meas. 2020, 69, 7125–7135. [Google Scholar] [CrossRef]
- Vaishya, R.; Javaid, M.; Khan, I.H.; Haleem, A. Artificial Intelligence (AI) applications for COVID-19 pandemic. Diabetes Metab. Syndr. Clin. Res. Rev. 2020, 14, 337–339. [Google Scholar] [CrossRef]
- Narin, A.; Kaya, C.; Pamuk, Z. Automatic detection of coronavirus disease (COVID-19) using X-ray images and deep convolutional neural networks. Pattern Anal. Appl. 2021, 1–14. [Google Scholar] [CrossRef]
- Vaid, S.; Cakan, C.; Bhandari, M. Using Machine Learning to Estimate Unobserved COVID-19 Infections in North America. J. Bone Jt. Surg. Am. Vol. 2020, 102, e70. [Google Scholar] [CrossRef] [PubMed]
- Fahmy, A.E.; El-desouky, M.M.; Mohamed, A.S.A. Epidemic Analysis of COVID-19 in Egypt, Qatar and Saudi Arabia using the Generalized SEIR Model. medRxiv 2020. [Google Scholar] [CrossRef]
- Khanday, A.M.U.D.; Rabani, S.T.; Khan, Q.R.; Rouf, N.; Din, M.M.U. Machine learning based approaches for detecting COVID-19 using clinical text data. Int. J. Inf. Technol. 2020, 12, 731–739. [Google Scholar] [CrossRef]
- Guo, X.; Mirzaalian, H.; Sabir, E. CORD19STS: COVID-19 Semantic Textual Similarity Dataset. arXiv 2020, arXiv:2007.02461. [Google Scholar]
- Panwar, H.; Gupta, P.; Siddiqui, M.K.; Morales-Menendez, R.; Bhardwaj, P.; Singh, V. A deep learning and grad-CAM based color visualization approach for fast detection of COVID-19 cases using chest X-ray and CT-Scan images. Chaos Solitons Fractals 2020, 140, 110190. [Google Scholar] [CrossRef] [PubMed]
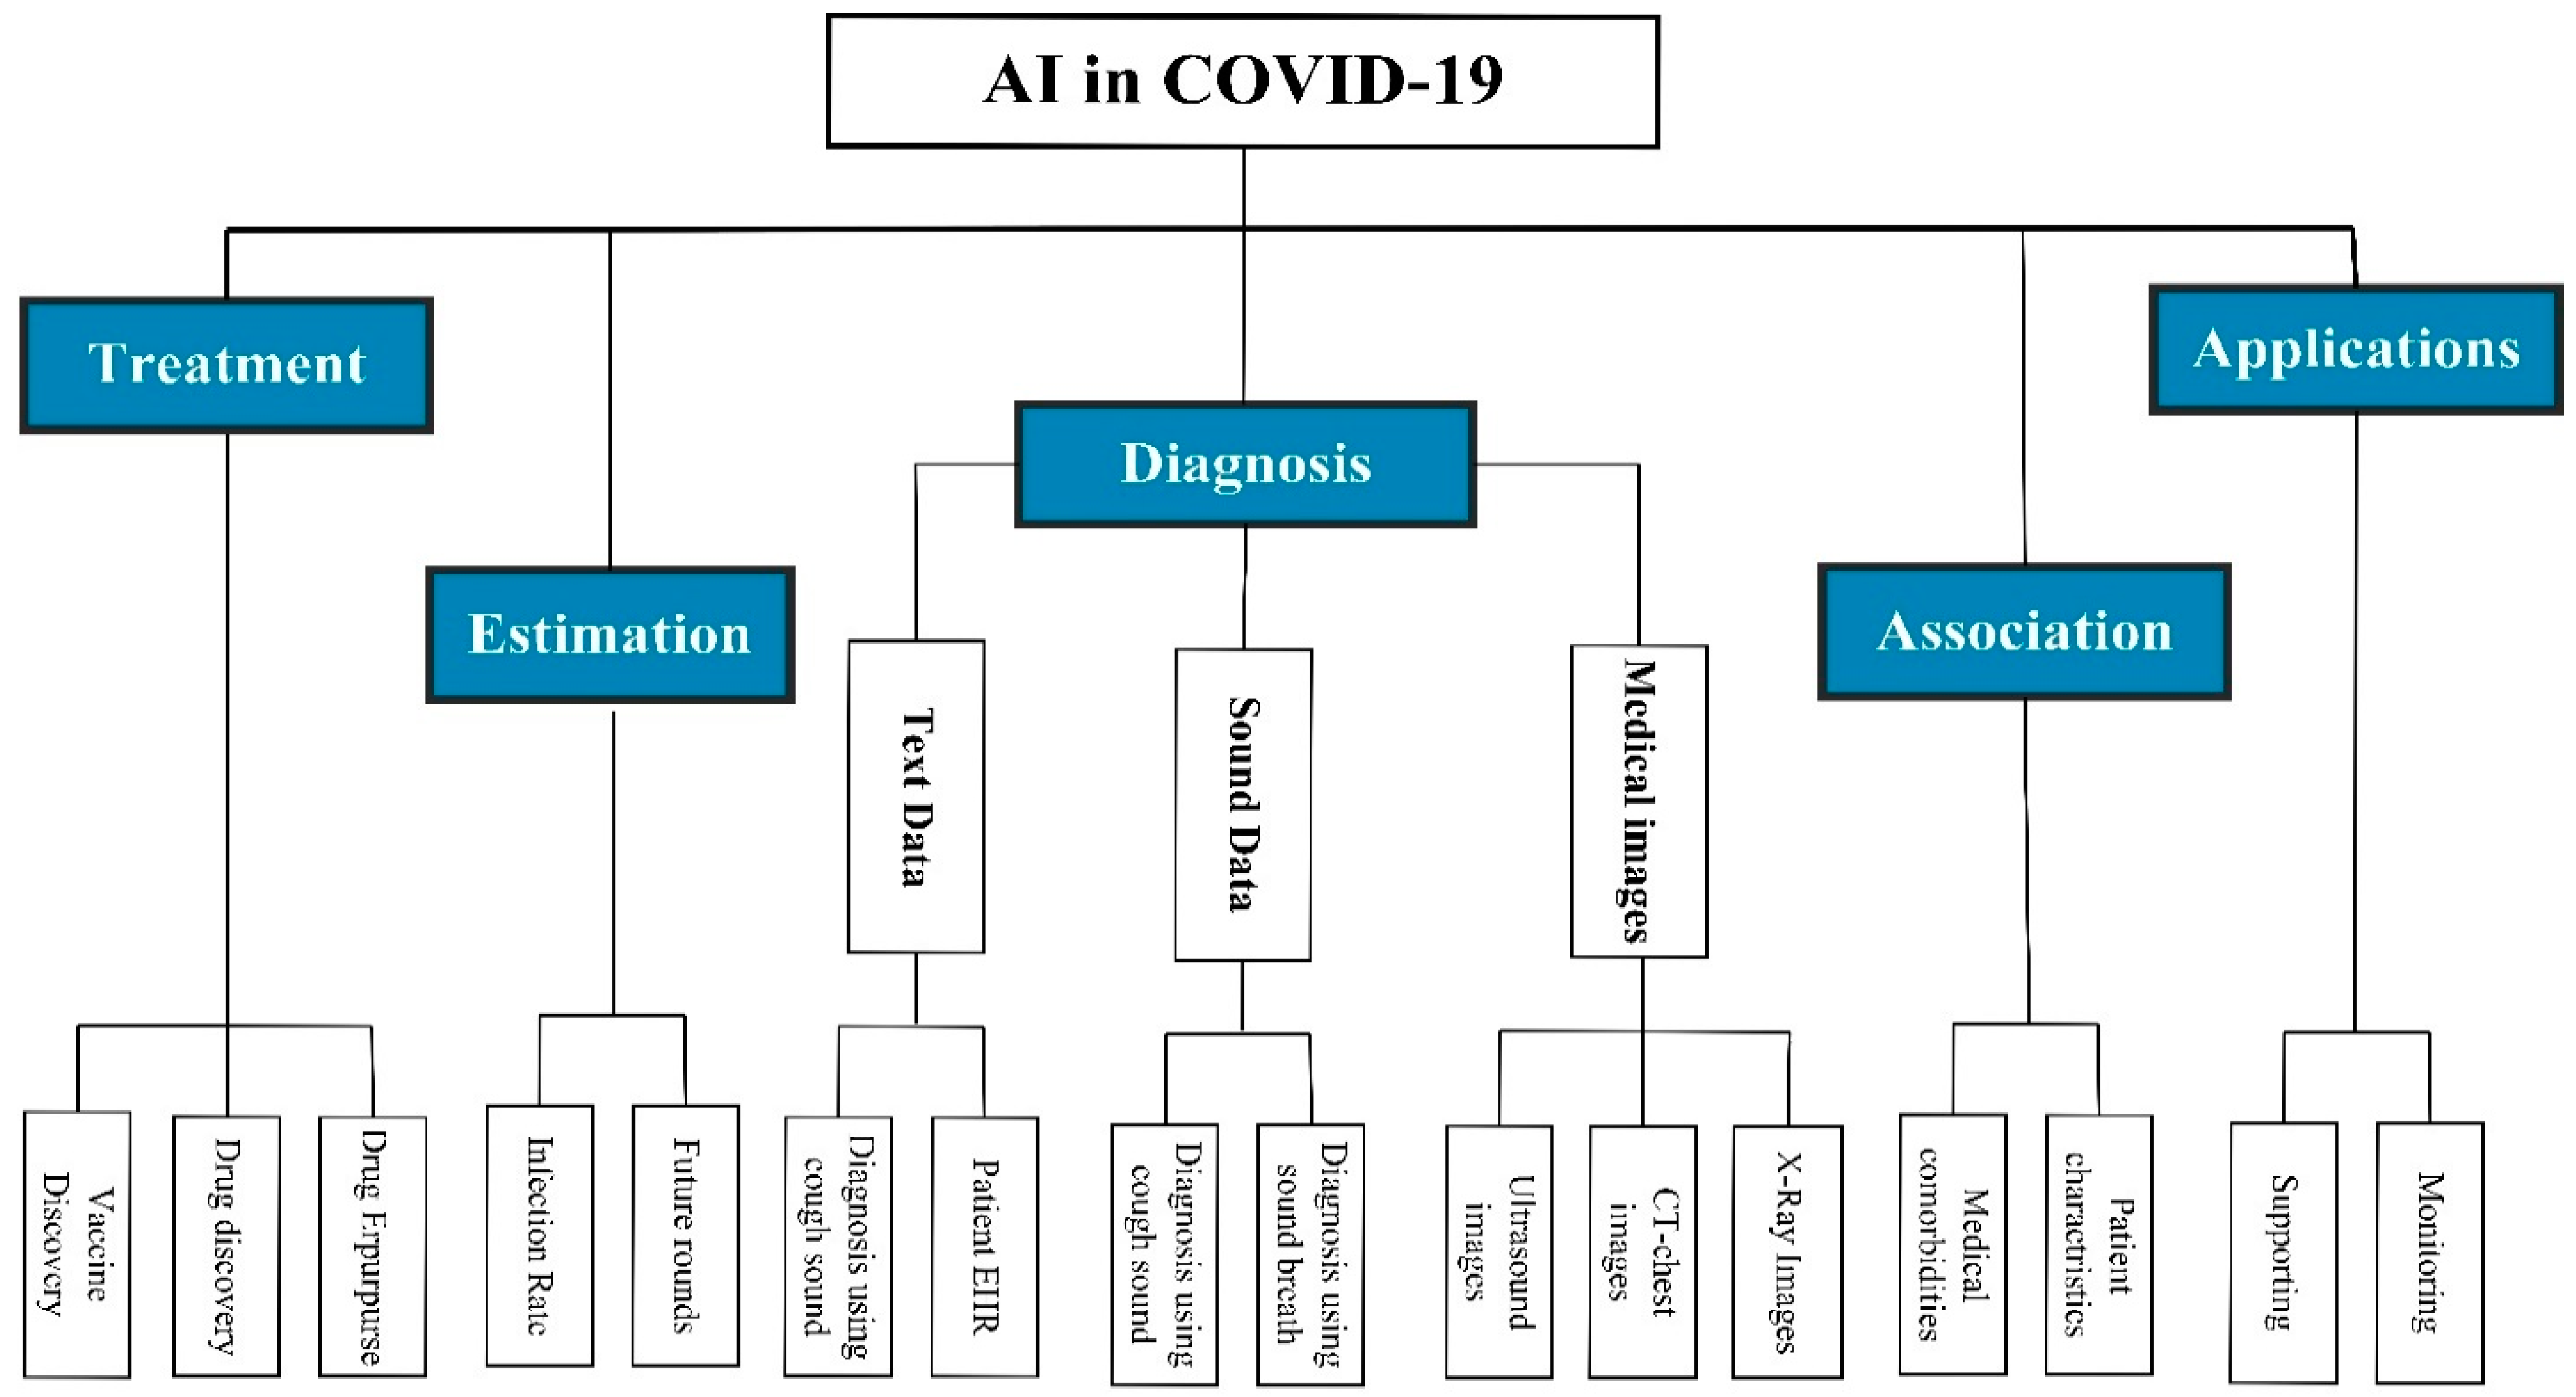

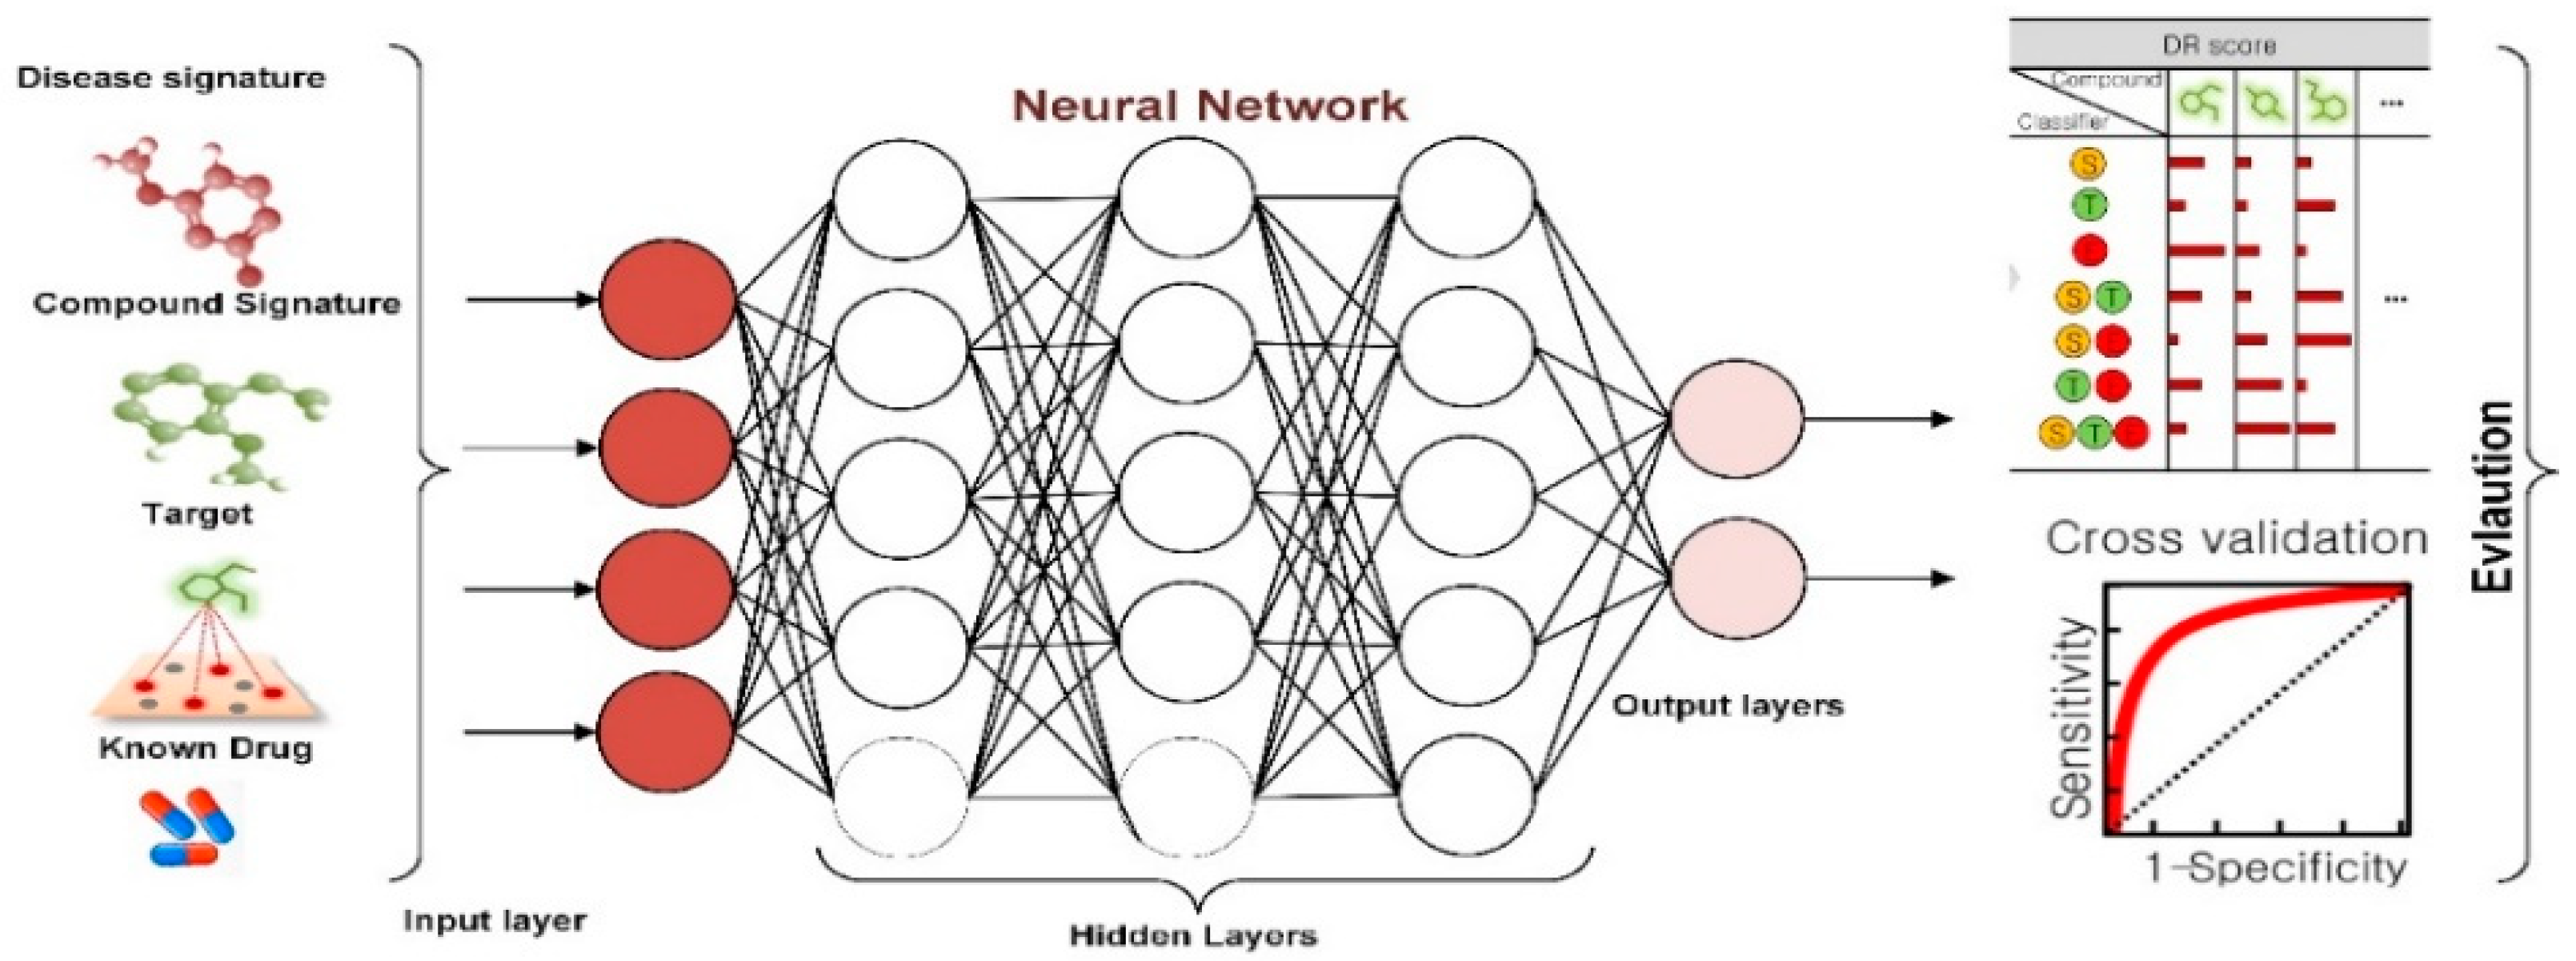
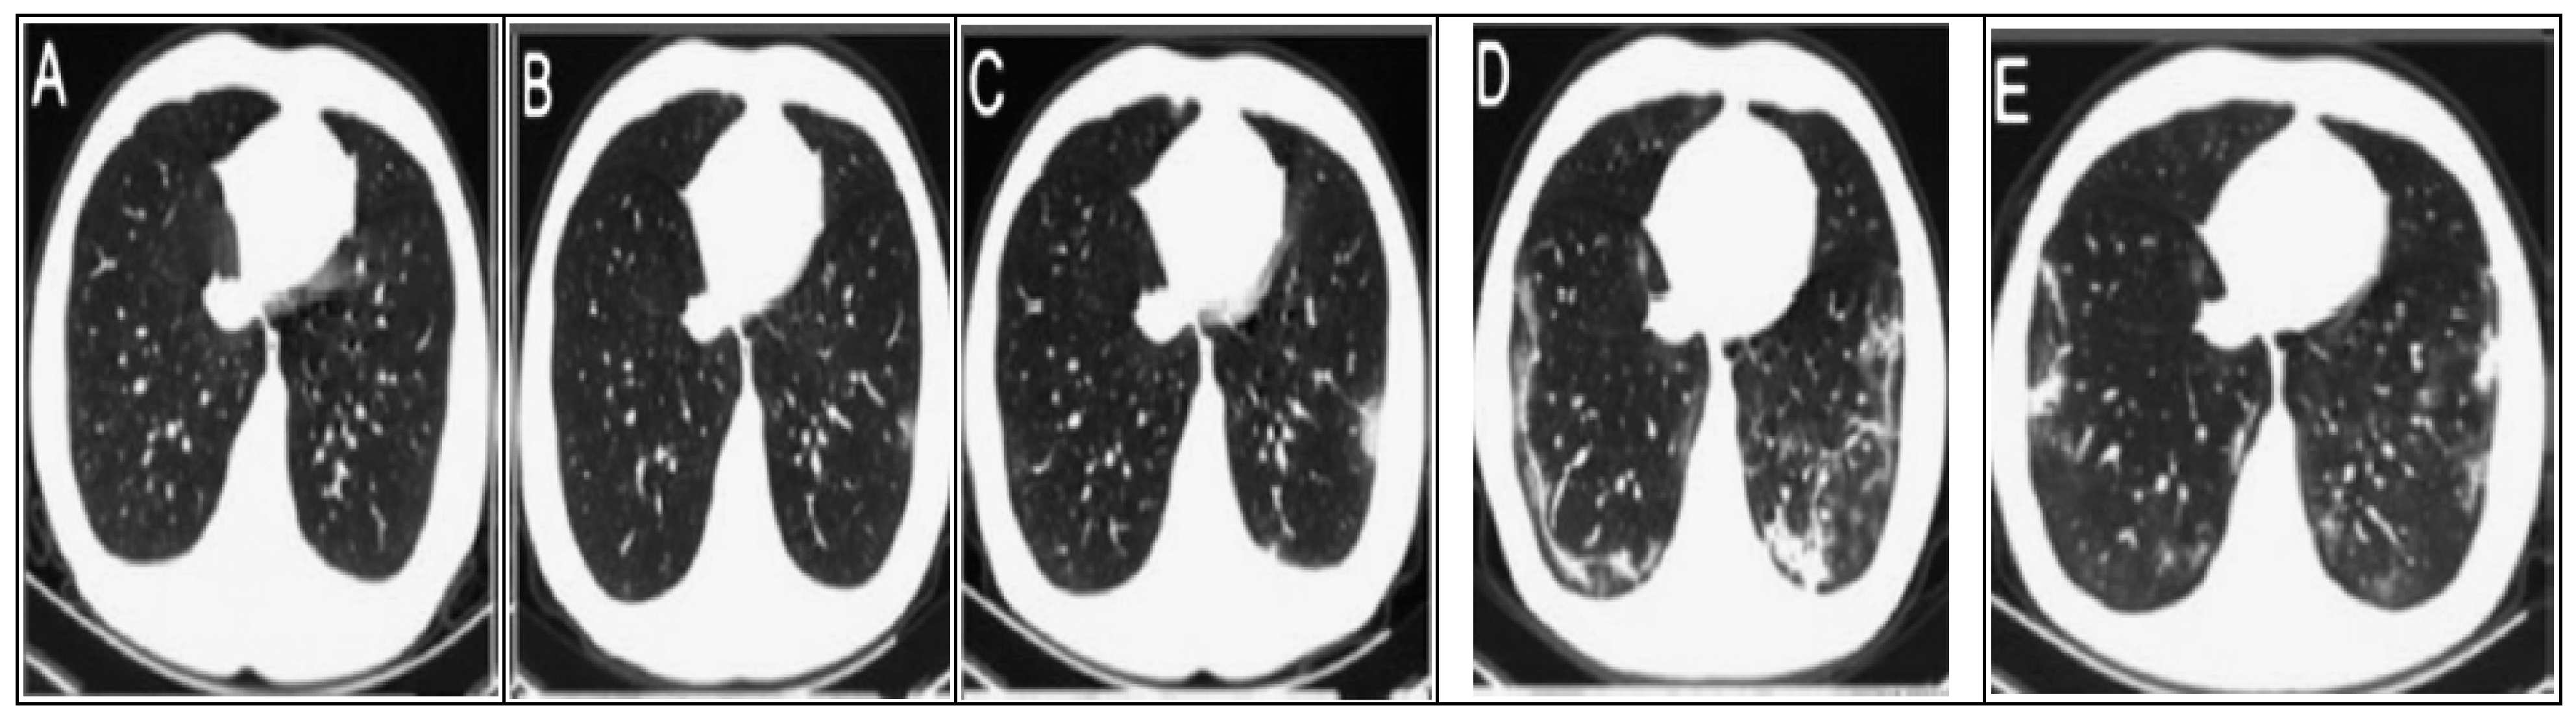
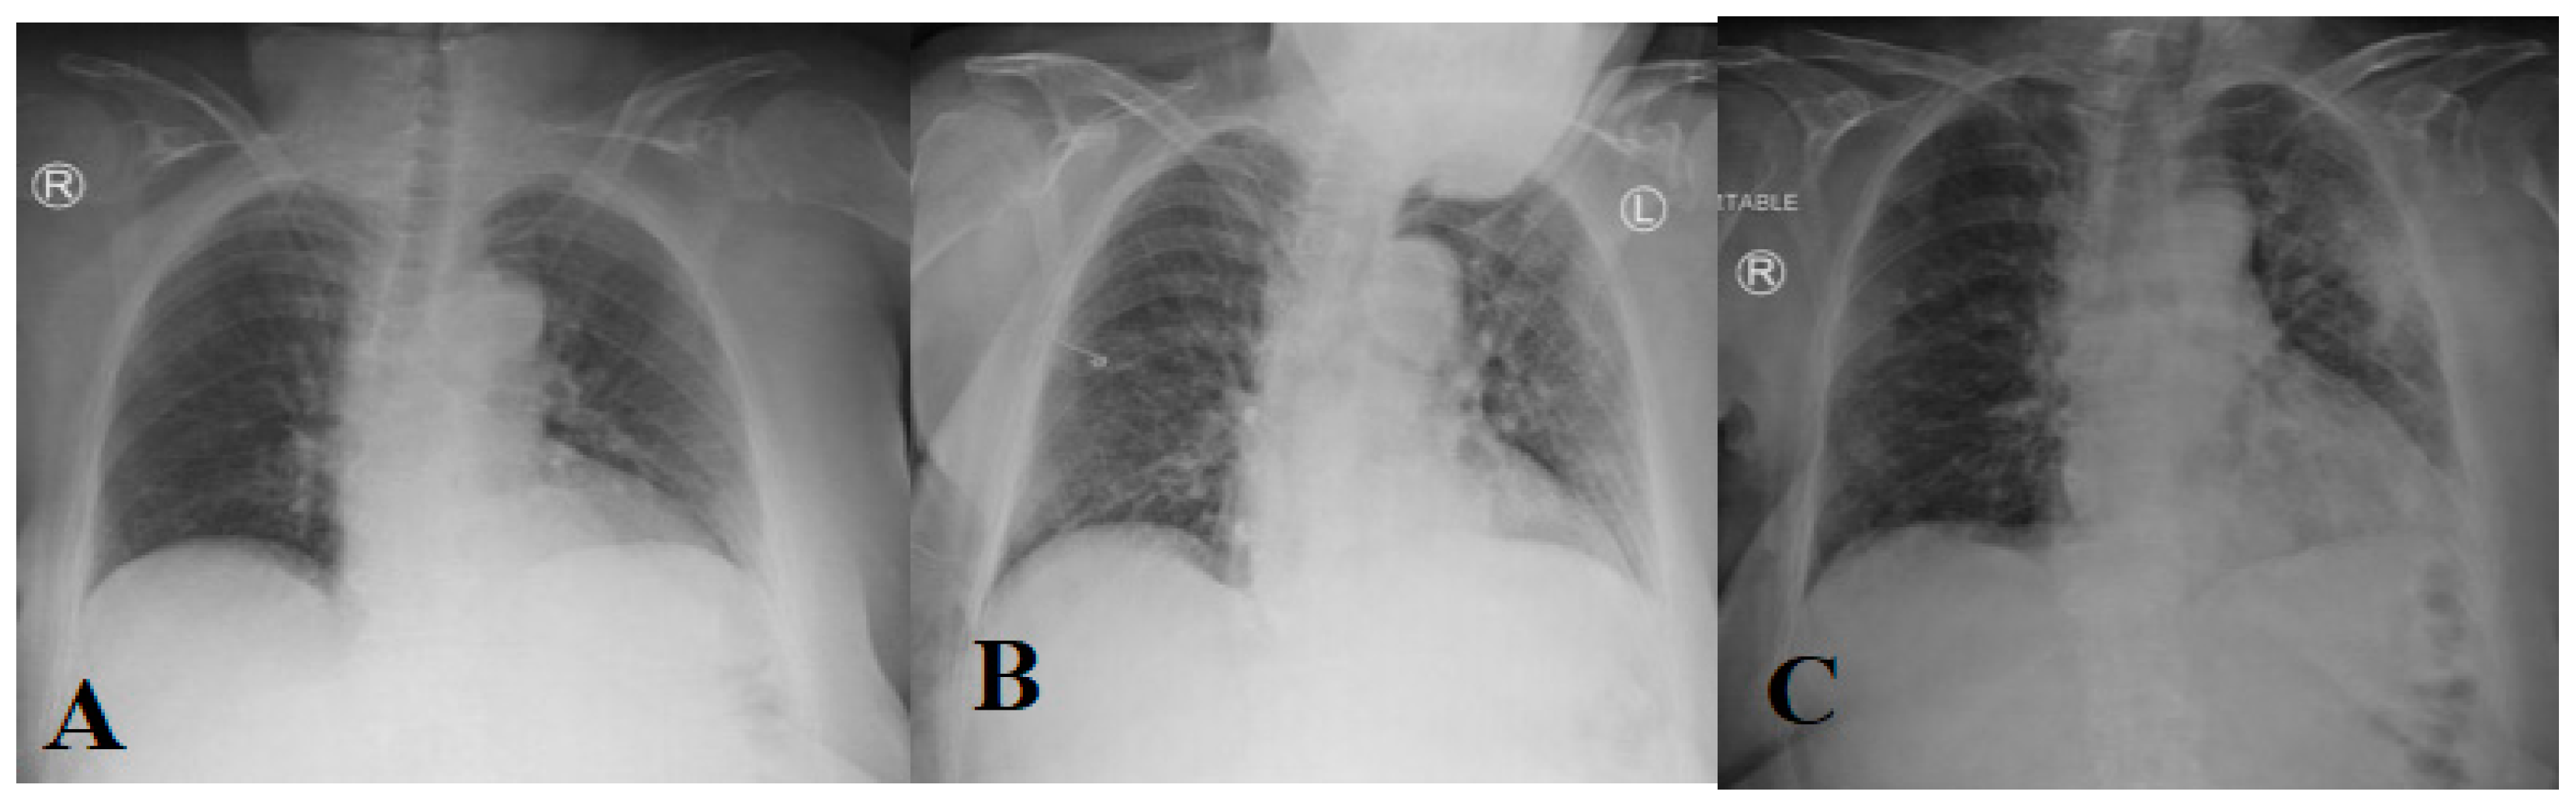
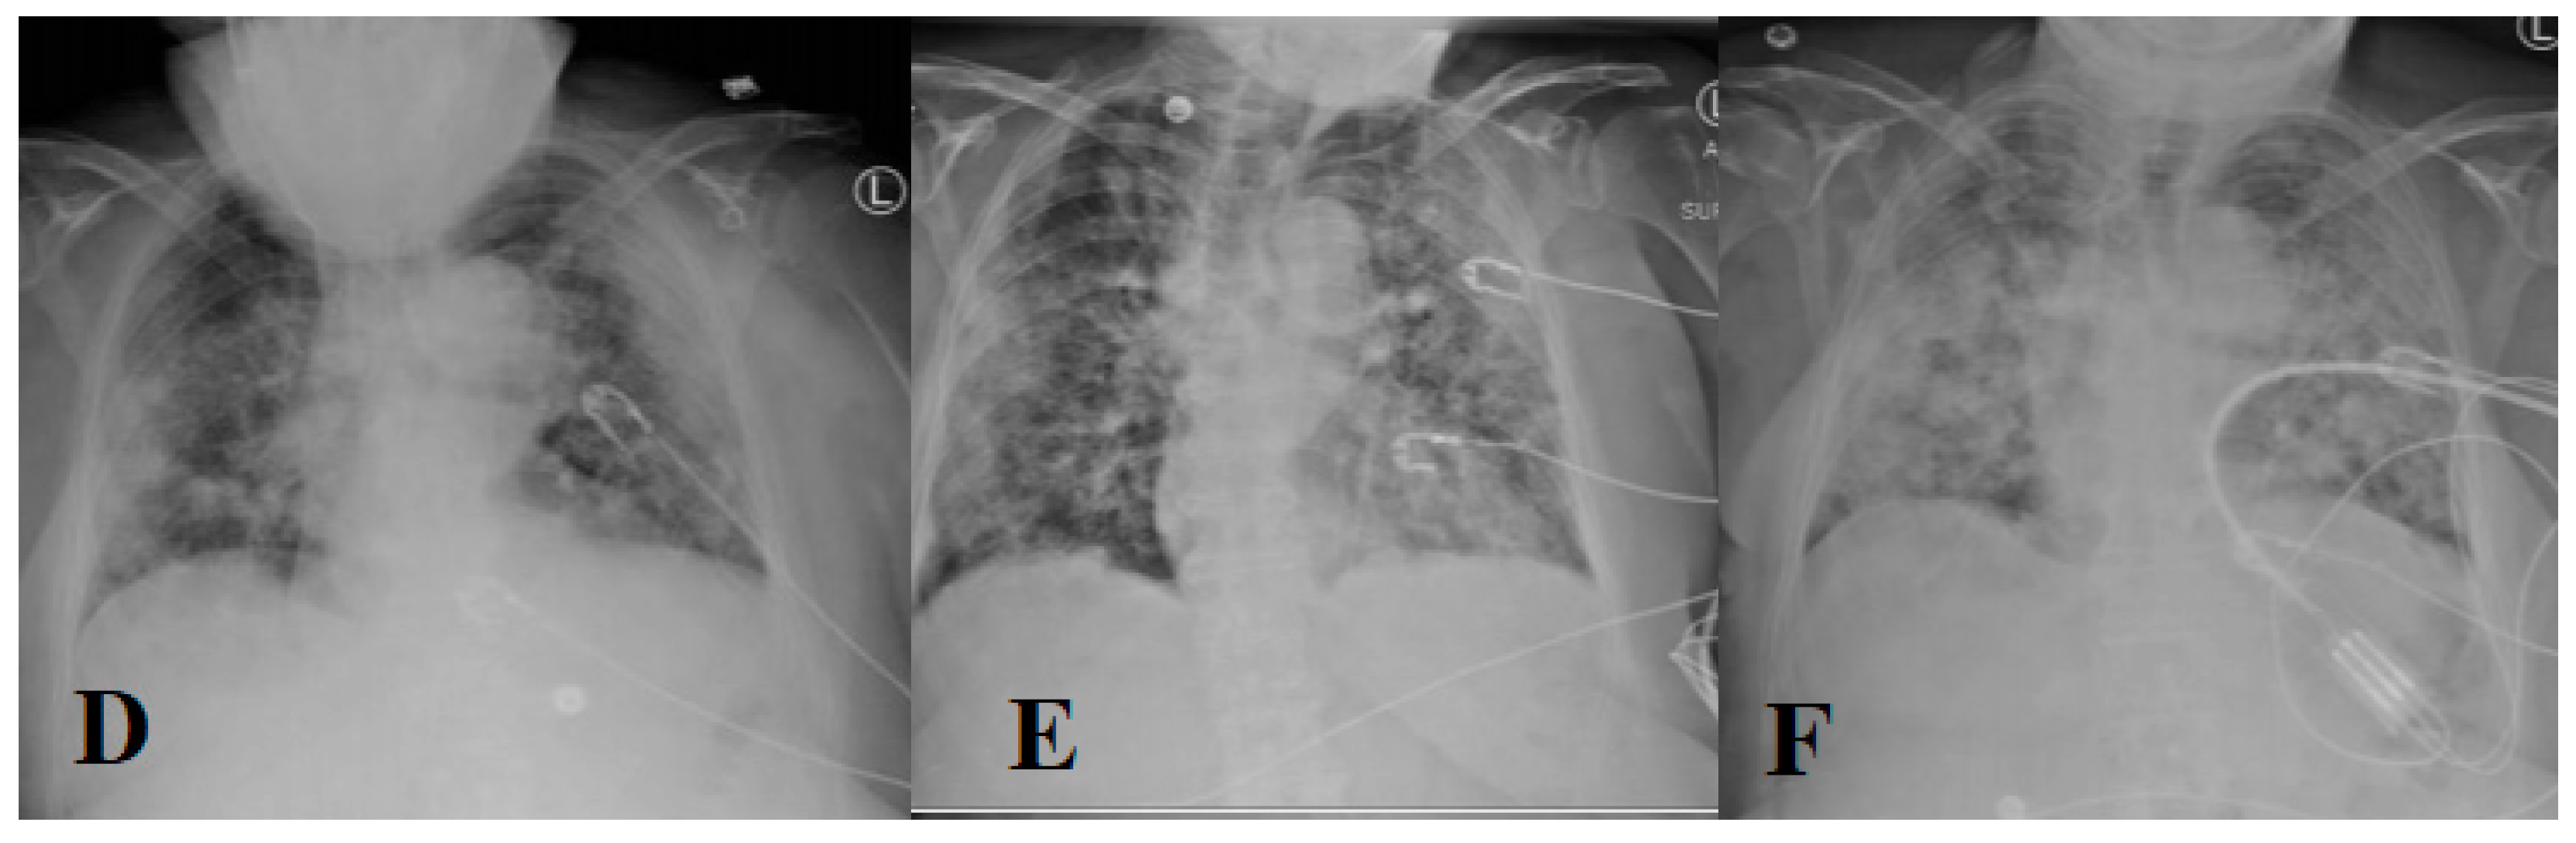
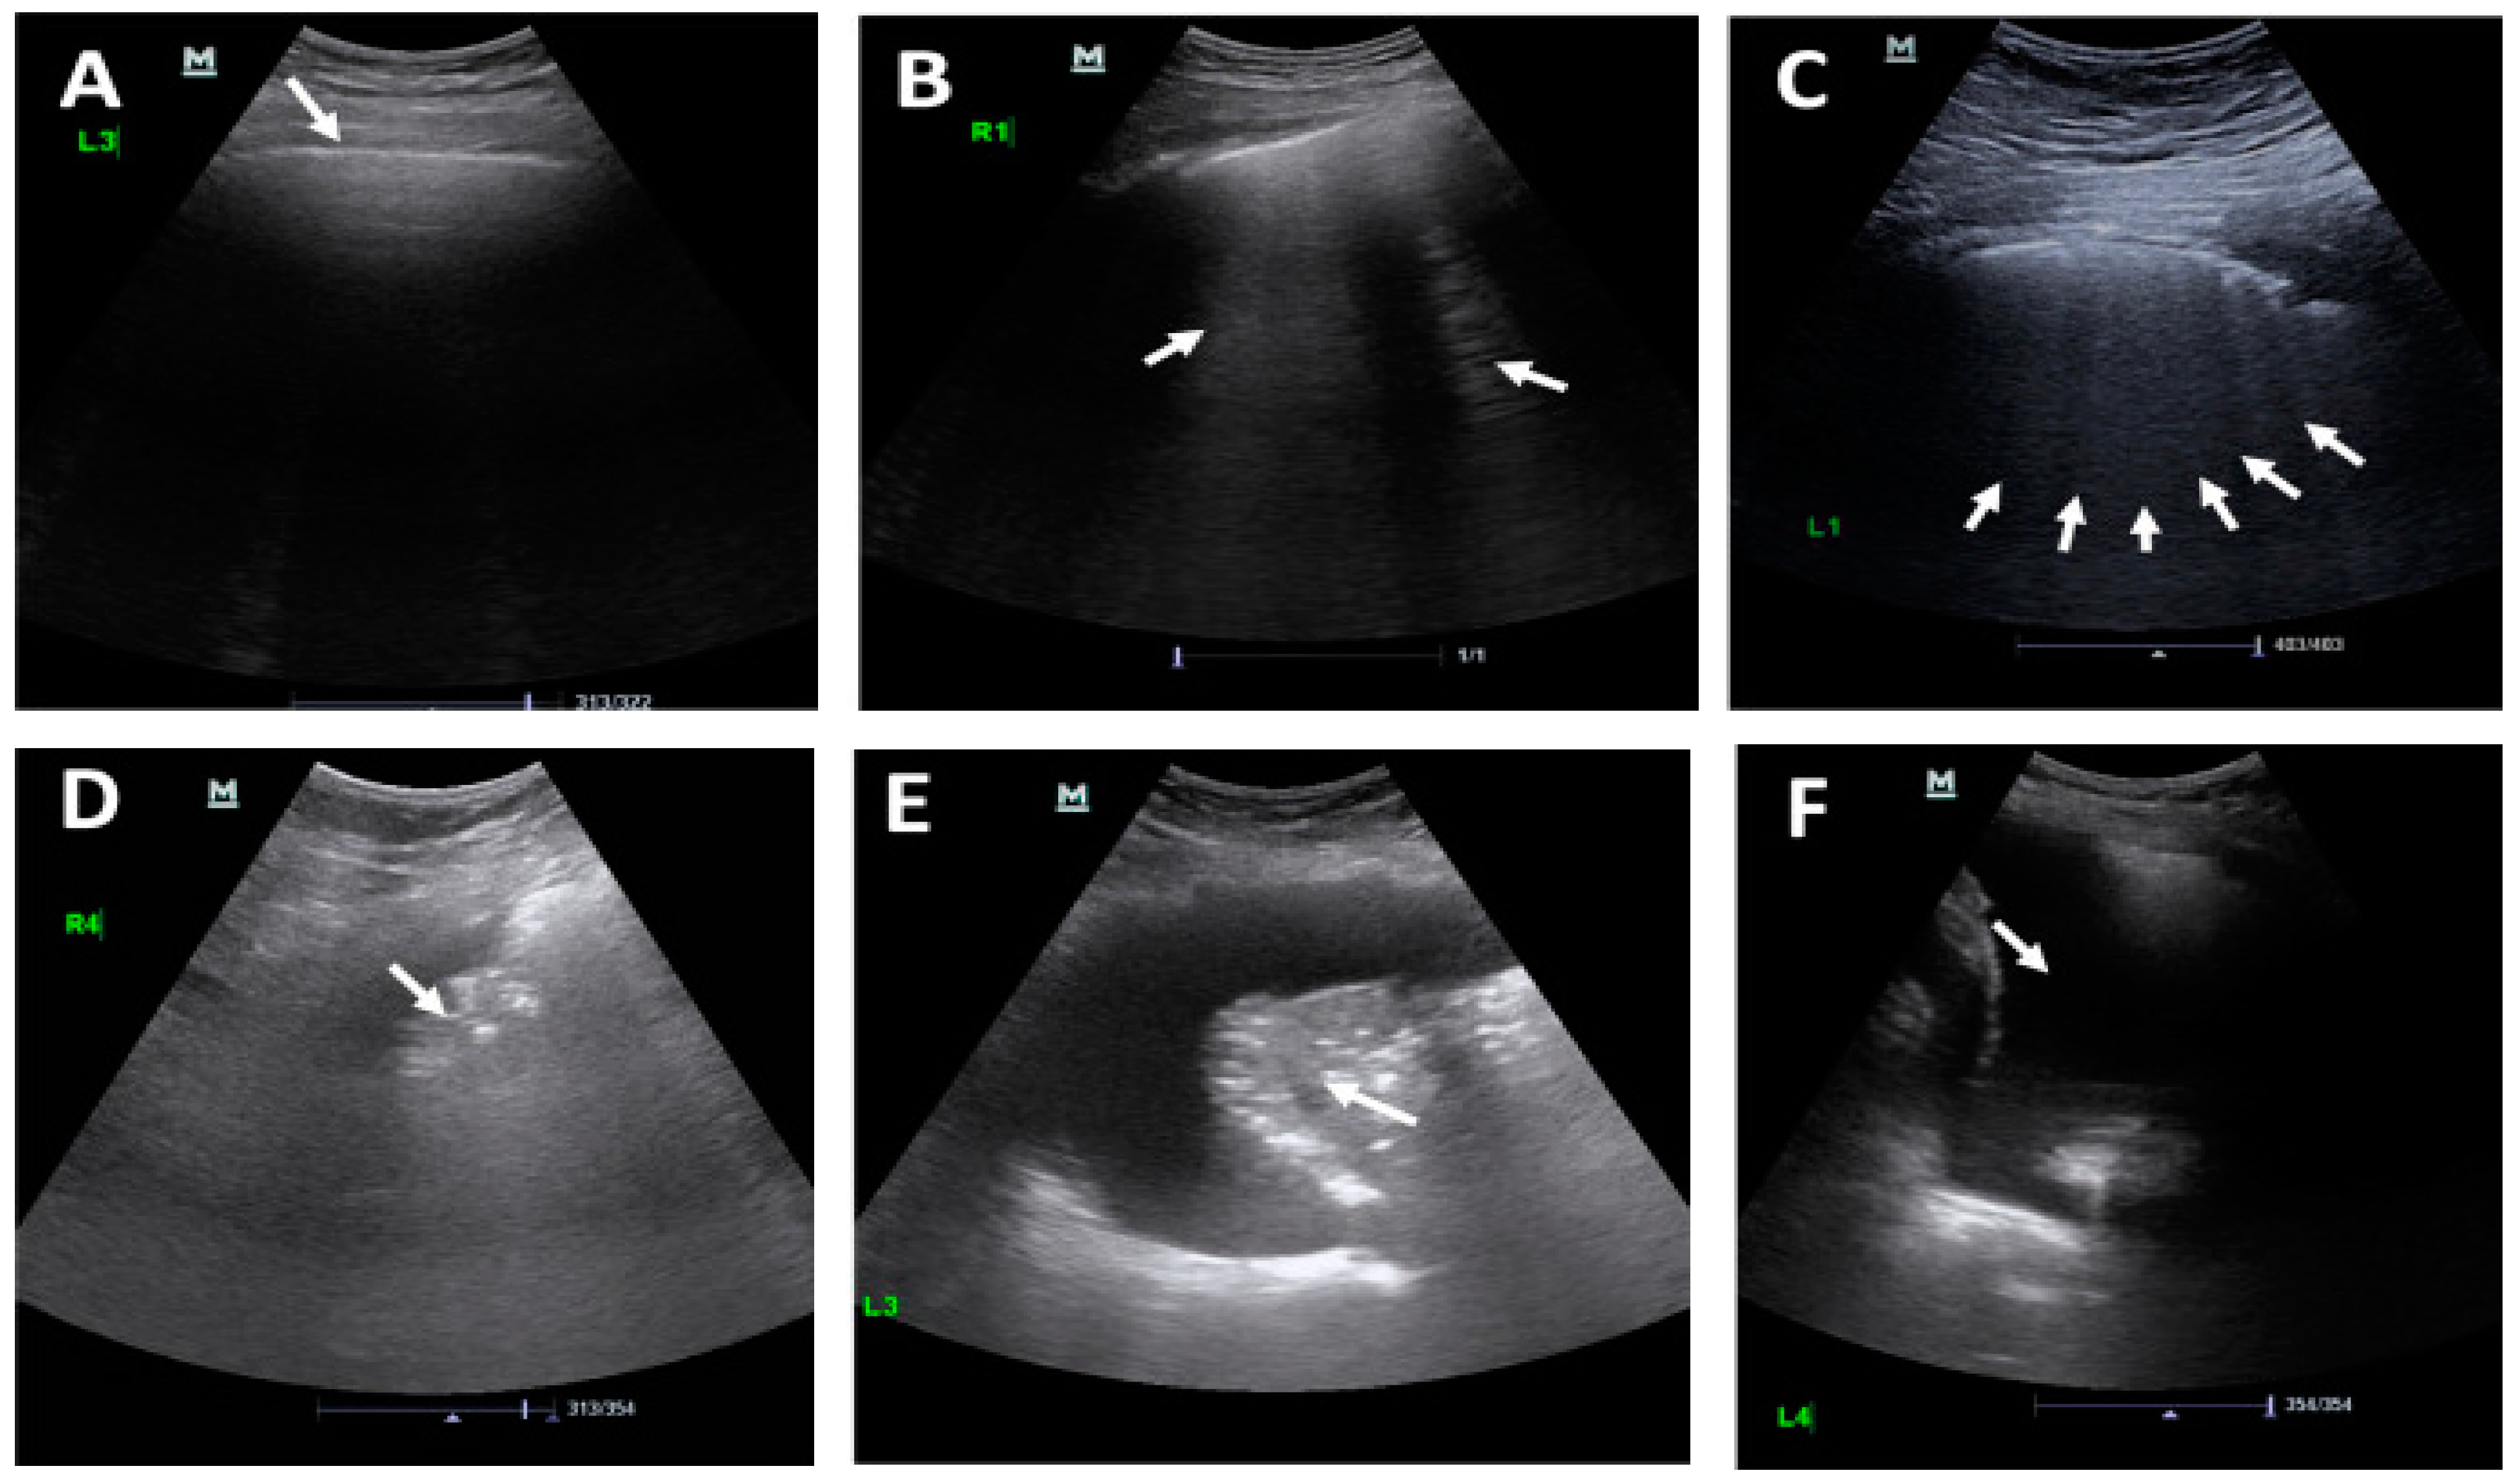

| Term | Abbreviation |
|---|---|
| AI | Artificial Intelligence |
| ARDS | Acute Respiratory Distress Syndrome |
| AKI | Acute Kidney Injury |
| AUC | Area Under the Roc Curve |
| BSTI | British Society of Thoracic Imaging |
| CAP | Community-Acquired Pneumonia |
| CFRs | Case-Fatality Rates |
| CNN | Convolutional Neural Network |
| COVID-19 | Coronavirus Disease 2019 |
| CR | Computed Radiology |
| CT | Computed Tomography |
| DL | Deep Learning |
| DX | Direct X-ray Detection |
| EBI | European Bioinformatics Institute |
| GISAID | Global Initiative on Sharing Avian Influenza Data |
| ICT | Information Communication Technology |
| KSA | Kingdom of Saudi Arabia |
| NCBI | National Center for Biotechnology Information |
| RNA | Ribonucleic Acid |
| RT–PCR | Reverse Transcriptase Polymerase Chain Reaction |
| SEIQR | Susceptible–Exposed–Infected–Confirmed–Removed |
| SEIR | Susceptible–Exposed–Infected–Recovered |
| SIR | Susceptible–Infected–Recovered |
| SIRM | Society of Medical and Interventional Radiology |
| OR | Odds Ratio |
| WHO | World Health Organization |
| 3CLpro | 3C-Like Protease |
| Ref. | Year | Model | Task | Dataset | Evaluation Metrics | ||
|---|---|---|---|---|---|---|---|
| ACC | P | SN | |||||
| [40] | March 2020 | 3D CNN model | Using CT chest images infiltrative biomarkers | 498 CT scans from 151 positive COVID_19 subjects and 497 CT scans from different subjects with various types of pneumonia | 70.02 | - | - |
| [22] | June 2020 | Desenet201 pre-trained model with CNN | Object detection, binary classification | 1260 COVID-19 images and 1232 CT from health patients | 96.21 | 96.20 | 96.20 |
| [28] | June 2020 | CNN Model | Binary classification | 413 of COVID-19 images and 439 of health images | 93.01 | 95.18 | 91.45 |
| [24] | May 2020 | 3D CNN model | Multiclass classification | 219 CT scans from COVID-19 patients, 220 from IAVP and 174 from healthy people | 83.90 | 81.30 | 86.70 |
| [29] | March 2020 | Segmentation models (V-Net, U-Net, FCN) and classification models (ResNet, inception) | Detection | 732 COVID chest CT scan (400 from normal cases and 332 from COVID_19 cases | 92.22 | - | 97.21 |
| [31] | May 2019 | CNN model | Multiclass classification | 10,000 CT images related to four classes, including COVID-19, non-viral pneumonia, influenzas, and non-pneumonia | - | 95.75 | 90.11 |
| [35] | March 2020 | ResNet-50 model | Multiclass classification | 60,457 CT chest scan images were collected from 100 COVID-19 cases, 102 non-COVID-19 viral pneumonia, and 200 normal lungs. | 98.81 | 98.20 | 94.52 |
| [36] | June 2020 | DenseNet121 model | COVID-19 prognostic tool | 4106 CT images (925 COVID-19, 342 pneumonia) | 78.33 | 76.61 | 80.39 |
| [37] | March 2020 | Hybrid classification technique (CNN and ML) | Predicting the recurrences in both SARS and COVID-19 cases | 51 SARS and COVID-19 CT chest scans from the Kaggle benchmark dataset. | 96.20 | 96.12 | 96.77 |
| [41] | March 2020 | Segmentation techniques (SegNet, DRUNET) and ResNet classification model | Multiclass classification | 3000 CT images of COVID_19 and pneumonia then testing on external data | - | 94.33 | 91.22 |
| [23] | June 2020 | 3D CNN model | Object detection and binary classification | 618 CT images (219 images from 110 COVID-19 patients with mean age 50, 224 from IVAP patients with mean age 61, and 175 CT images from healthy people. | 86.60 | 86.77 | 98.21 |
| [42] | May 2020 | U-net and ResNet32 models | Examine the effect of synthetic data on COVID-19 classification | 2143 chest CTs related to 327 COVID-19-positive subjects across seven countries | 90.06 | - | - |
| [39] | March 2020 | ML (RF and SVM) and CNN models | Utilizing CT images, patient symptoms for a binary classification task | 626, negative cases 279 patients | 83.77 | 81.8 | 84.2 |
| [43] | June 2020 | Multi-objective CNN model | Multiclass classification | 312 CT scan images in addition to patient symptoms aggregated from COVID-19 patients in 9 days | 93.40 | 91.00 | 89.00 |
| [27] | August 2020 | CNN based on ResNet 50 model | Binary classification | 622 CT chest images from 122 for COVID-19 positive cases and 500 for normal cases | 97.95 | 97.44 | 97.31 |
| [44] | May 2020 | DL model | Classification COVID-19 from pneumonia at early stages | 219 images from 110 patients with COVID-19 (with mean age 50 years), 224 images from 224 patients with IAVP (mean age 61 years), and 175 images from 175 healthy cases (mean age 39 years) | 86.72 | 86.5 | 86.5 |
| [45] | June 2020 | ImageNet and pre-trained model (ResNet50 and ResNet100) and CNN model | Binary classification | - | 89.22 | - | 89.61 |
| [46] | April 2020 | Fully connected DL model | Binary classification | CT images from 1186 patients (132,583 CT slices). Data was divided into training, validation, and test datasets with percentage 7:2:1 | 96.21 | 95.0 | 96.21 |
| [47] | May 2020 | Using Generative Adversarial Networks and ResNet pretrained model to classify COVID-19 images | Binary classification | 1- pneumonia dataset that includes (5863 X-ray images categorized: normal and pneumonia. 2- 624 images selected from normal and COVID-19 cases to demonstrate the effectiveness of the model | 98.77 | 9.875 | 99.21 |
| Ref. | Year | Method | Task | Dataset | Evaluation Measures | ||
|---|---|---|---|---|---|---|---|
| ACC (%) | P (%) | SN (%) | |||||
| [52] | July 2020 | Multi-image augmented Deep learning | Using both X-ray and CT images to provide binary classification model | 100 cases of COVID-19 and non-COVID-19 | 99.4 for X-ray, 95.3 for CT scans | 95.98 | 94.78 |
| [53] | April 2020 | VGG16, VGG19, ResNet, DenseNet, and InceptionV3 | Evaluate the performance of CNN architecture and transfer learning in the COVID-19 classification process | 1427 X-ray images include (224 COVID-19 + cases, 700 pf pneumonia, and 503 normal cases) | 96.78 | 98.65 | 96.46 |
| [54] | November 2020 | Using SVM (Support Vector Machine), CNN (Conventional Neural Networks), ResNet50, InceptionResNetV2, Xception, VGGNet16 | Examine the health status of the patient’s lung based on CT scan and X-ray | 5857 Chest X-rays and 767 Chest CTs for COVID-19 positive cases | (84 for X-ray, 75 for CT scan) | - | - |
| [55] | September 2020 | Machine learning techniques | Multiclass classification | 350 images from confirmed cases, 220 images from suspected cases, and 130 images from normal cases | 67.5 | - | - |
| [56] | May 2020 | Using encoder and decoder for segmentation, then use multilayer perceptron for image classification | Multitask model that includes three main steps: (1) image classification; (2) lesion segmentation; and (3) image reconstruction | 1044 divided as (449 patients with COVID-19, 100 normal cases, 98 patients with lung cancer, and 398 with different pathology kinds | 78 | - | - |
| [57] | April 2020 | COVID-net model: CNN model that trained first on ImageNet dataset then trained in COVIDx dataset | Analyzing patient data, predicting patient risk and hospitalization duration | 13,975 images with many X-ray positive cases from various countries) | 92.4 | 88.3 | - |
| [50] | May 2020 | Detecting features of X-ray image using CNN model then fed into SVM to make COVID-19 classification | Binary classification | Total of 50 images (25 for COVID-19 + 25 for pneumonia) | 95.33 | 95.33 | - |
| [58] | April 2020 | COVID-Xnet model that builds on CNN models such as VGG19 and google MobileNet | Binary classification | Total of 50 images (25 for COVID-19 + 25 for non-COVID-19) | 90 | ||
| [24] | May 2020 | Using a darknet model for classification, YOLO for real-time object detection | Developed binary classification model that differentiates COVID-19 cases from healthy cases | 1125 X-ray images (500 health cases, 125 COVID-19 positive cases, and 500 from pneumonia cases | 98.02 | 95.13 | 95.3 |
| [59] | October 2020 | Deep learning and transfer learning models (ResNet50, inception V3, etc.) | COVID-19 diagnosis using X-ray images | 100 X-ray images (50 COVID-19, 50 non-COVID-19) extracted form Dr. Chohen GitHub repository | 98 | ||
| [60] | March 2020 | Supervised pre-trained based 2D model called DeCOVNET | Diagnostic tool for COVID-19 detection using 3D images | 499 CT images aggregated from 13 December 2019, to 23 January 2020, used for the training process. 131 CT images aggregated from 24 January to 6 February, were used for the testing process | 90.01 | 90.65 | 91.21 |
| [61] | February 2020 | DL model based on relation extraction | Using 3D images to fast diagnose COVID-19 from pneumonia | CT scans images from 88 patients with positive COVID-19, 101 images from patients infected with bacteria pneumonia, and 86 images of healthy cases. | 94.21 | 96.32 | 94.0 |
| [62] | July 2020 | Anomaly detection algorithm with efficient Net | Multiclass classification based on anomaly detection technology | Model firstly trained on 5977 images of viral pneumonia (no COVID-19) cases and 37,393 healthy cases. Then testing on the X-COVID dataset that include106 COVID-19 cases | 72.77 | 71.30 | - |
| [63] | June 2020 | Using different pre-trained models (ResNet, AlexNet, SGDM- SqueezNet) | Using image augmentation in enhancing COVID-19 classification | 423 X-rays of COVID-19 cases, 1485 X-rays of viral pneumonia cases, and 1579 of normal cases | 98.2 | 96.7 | 98.2 |
| [64] | June 2020 | Feature optimization technique with Deep CNN model, known as COVXNet | COVID-19 detection | Viral, normal, and bacterial dataset available at (https://github.com/Perceptron21/CovXNet) (Last access date: 10 February 2021) | 98.1 | 98.5 | 98.9 |
| [65] | May 2020 | Data augmentation and DL classification models | COVID-19 detection | A set of 5232 anterior–posterior (AP) images of children with ages from 1 to 5. It includes 1583 normal cases, 2780 bacterial pneumonia, and 1493 CXRs with COVID-19 | 99.25 | - | - |
| Ref | Year | Method | Dataset | Task | Evaluation Measures | ||
|---|---|---|---|---|---|---|---|
| ACC | P | SN | |||||
| [74] | April 2020 | Machine learning | 150 exams. Lung ultrasound was performed adopting the 12-region model, 6 on each side | Evaluating diagnostic accuracy of COVID-19 using lung ultrasound | 82.1 | - | - |
| [69] | May 2020 | Deep learning | 58,924 US frames | evaluate the applicability of ultrasound for making lung examination in COVID-19 patients | 95 | 61 | 90 |
| [67] | August 2020 | Machine learning algorithms | 1650 frames from 16 patients | Use lung US for 16 patients with COVID-19 to make the diagnosis | Positive predictive 86 and negative predictive 96 | 89 | 94 |
| [70] | May 2020 | VGG-16 pre-trained model followed by other hidden layers | 2,392,963 frames form 64 videos | Provide automatic detection of COVID-19 based on US images | COVID-19: 97 | 96 | 79 |
| Pneumonia: 82 | 93 | 98 | |||||
| Healthy: 63 | 0.01 | 1.00 | |||||
| Country | Cases > 70 (%) | CFR | Death Age > 70 (%) |
|---|---|---|---|
| Canada | 34.65 | 8.24 | 85.88 |
| Italy | 39.48 | 14.04 | 85.88 |
| Denmark | 17.01 | 4.71 | 87.45 |
| Austria | 16.82 | 3.85 | 85.12 |
| Iceland | 4.01 | 0.55 | 70.01 |
| France | 11.81 | 18.01 | 88.91 |
| UK | 16.62 | 16.14 | 82.33 |
| USA | 32.66 | 5.89 | 70.90 |
| Spain | 37.32 | 11.72 | 86.40 |
| Sweden | 21.01 | 7.44 | 88.94 |
| Diseases | Correlation Percentage |
|---|---|
| Cardiovascular | 14.08% |
| Diabetes | 7.3% |
| Hypertension | 7.0% |
| Respiratory diseases | 12.4% |
| Liver disease | 7.07% |
| Kidney failure diseases | 11.32% |
| Ref. | Application | Type of Data | AI Technique | Challenge |
|---|---|---|---|---|
| [203,204,205] | Chatbots to support COVID-19 patients and their relatives | Guidelines and information from a medical expert | NLP (i.e., information extraction, text summarization, and classification), speech recognition, and automated question answerers tools. | - Require a large amount of data to handle questions related to an unsaved query. - The challenge related to using various language expression (i.e., language slang) |
| [35,209,210] | Mining text to understand the community’s response towards governmental and health strategies (i.e., social distance, lockdown) | Text gathering from news, social media posts, healthcare, and governmental reports | NLP (i.e., information extraction, text summarization and classification) | - Privacy issues in different countries - Insufficient data may lead to skewed results. - Imprecise results leading to anxiety among the population. |
| [32,95,207] | Monitoring patients with temperature to maintain safety precautions) i.e., mask-wearing, social distancing, etc.) | Images extracted from infrared cameras in streets and public enterprises. | CNN models and pre-trained models (i.e., DesNet, AlexNet, etc.) and other computer vision tools and libraries | - Capturing the in-body temperature through remote sensors may lead to imprecise results. - Issues related to the invasion of privacy |
| [87,96,100,101,102] | Predict the spread of infection (number of expected patients, spread rate, disease peak, etc.) | Demographic data, population density, and compartmental tests, | Statistics tets and DL techniques (i.e., RNN and LSTM) | - Models such as compartmental models may be complex. - Insufficient data |
| [28,36,43,63,211,212,213,214,215,216,217,218,219] | COVID-19 medical diagnosis using medical images | Medical images (i.e., X-ray, CT scan, and ultrasound) | ML and DL CNN models, and AI computer vision tools | - Insufficient medical images lead to an imbalanced dataset. |
| [220,221,222,223,224] | Diagnosis and triage patient according to health status. Prescribe treatment, medical plan and make risk evaluation | Patient medical history (Electronic health record (EHR)), Patient symptoms, laboratory test result. | ML techniques (i.e., SVM, KNN, MLP, etc.), Fuzzy logic systems, and DL techniques (i.e., LSTM, RNN) | - Unavailability of patient’s data (therapeutic outcomes and physiological data). - Privacy issues - Incomplete data may lead to biased or accurate result in the prediction |
| [225,226,227] | Analyses of viral RNA and track genetic changes. Predict the viral structure of the second and third waves. | Protein sequence and viral RNA | DL and Deep reinforcement learning tools | - Analyzing a large dataset for RNA or protein sequence may take a long time, result in unexplainable models |
| [161,163,184,185,228,229,230,231] | Analyze chemical compounds and interaction for vaccine development | Viral structure, protein sequence, drug–drug interaction, drug–protein interaction, and protein–protein interaction. | DL models, computer vision tools, reinforcement learning, and optimization techniques | - Results need large bed experiments to be verified, which may take a long time. - Possibility of long-term risk. |
| [206,207,208] | Develop robots to support both patient and medical staff, cleaning, vital signs monitoring, deliver food and treatment | Training autonomous agent using environment simulation | DL models, computer vision tools, reinforcement learning, and optimization techniques | - Training autonomous agents and implementing them in machines may take great effort and time. - Maintaining a high level of safety must be guaranteed |
| [232] | Develop a reponse tracker (OXGRT) to capture the government policies and the degree of response | Aggregating huge dataset that is continuously updated | Use AI techniques to explore the empirical effect of government policies on the spread of COVID-19 cases | - |
| Ref. | Type | Size | URL | Open-Source | Metadata |
|---|---|---|---|---|---|
| medseg.ai | CT scan | 100 CT scans from 40 COVID-19 patients | http://medicalsegmentation.com/covid19/ (access date 20 February 2021) | Yes | Yes |
| [265] | CT scan | 68,623 CT scan images for COVID-19 and non-COVID-19 images | - | No | No |
| [266] | CT scan | 370 CT scan images for COVID-19 and non-COVID-19 images | - | Yes | No |
| [240] | X-ray | 13,800 X-ray images for COVID-19 and phenomena | - | No | No |
| [236] | X-ray | 100 X-ray images for COVID-19 and healthy class images | - | No | Yes |
| [241] | X-ray | 230 X-ray images for COVID-19 and non-COVID-19 images | - | NO | No |
| [53] | X-ray | 127 X-ray images for COVID-19 and non-COVID-19 images | - | No | No |
| [241] | X-ray | 17,000 X-ray images for three class (COVID-19, healthy and phenomena | - | No | No |
| [242] | X-ray | 2500 X-ray images for COVID-19 and non-COVID-19 images | - | Yes | NO |
| [243] | X-ray | 4707 X-ray images for COVID-19 and non-COVID-19 images | - | Yes | Yes |
| Kaggle | X-ray | 359 X-ray images for COVID-19 and non-COVID-19 patients | https://www.kaggle.com/bachrr/covid-chest-xray (access date 20 February 2021) | Yes | Yes |
| GitHub | X-ray | 239 images for COVID-19-positive cases, in addition to some vital sings | https://github.com/agchung/Actualmed-COVID-chestxraydataset/tree/master/images, (access date 20 February 2021) | Yes | Yes |
| [25] | CT scan | 34 CT scan images for COVID-19 and non-COVID-19 patients | https://github.com/UCSD-AI4H/COVID-CT, (access date 20 February 2021) | Yes | Yes |
| [70] | Ultrasound images | (654 COVID-19-positive subjects, 277 bacterial pneumonia, and 172 healthy subjects | https://github.com/jannisborn/covid19 pocus ultrasound/tree/master/data, (access date 20 February 2021) | Yes | Yes |
| [235] | CT scan and X-ray images | 265 COVID-19 (165 X-ray, 100 CT scans) | https://github.com/ieee8023/covid-chestxray-dataset, (access date 20 February 2021) | Yes | Yes |
| EOR | CT scan and X-ray images | Various CT scan and X-ray images for COVID-19 patients | https://www.eurorad.org/advanced-search?search=COVID, (access date 20 February 2021) | No | Yes |
| BSTI | CT scan and X-ray images | Various CT scan and X-ray images for COVID-19 patients | https://bit.ly/BSTICovid19 Teaching Library (access date 20 February 2021) | No | Yes |
| [82] | Cough-sound | 328 sound from 150 patient | - | No | No |
| [80] | Cough-sound | Cough and speech from 1079 normal and 92 COVID-19 | https://coswara.iisc.ac.in (access date 20 February 2021) | Yes | Yes |
| [247] | Cough sound | Cough sound: 13 normal and 8 COVID-positive cases | https://coughtest.online (access date 20 February 2021) | Yes | Yes |
| GitHub | Cough sound | 121 segmented coughs collected from 16 patient | https://github.com/virufy/covid (access date 20 February 2021) | Yes | Yes |
| [81] | Cough Sound | 144 segmented coughs, aggregated from 28 patient | - | No | NO |
| [249] | Breathing sound | 260 sound record aggregated from 52 COVID (32 male, 20 females) positive cases | - | No | Yes |
| [76] | Breathing sound | 7000 unique samples, including 200 samples from COVID-19-confirmed cases | - | NO | Yes |
| [266] | Text data | Symptoms and health reports for 62 patients in South Korea | https://www.kaggle.com/kimjihoo/coronavirusdataset (access date 20 February 2021) | Yes | Yes |
| datahub | Text data | Time series symptoms from COVID-19 patients | https://datahub.io/core/covid-19 (access date 20 February 2021) | Yes | Yes |
| [69] | COVID-19 (Japan) | 29 columns | https://www.kaggle.com/lisphilar/covid19-dataset-in-japan (access date 20 February 2021) | Yes | Yes |
| Word clouds | Covid-19 Text Dataset | Text data extracted from 13,202 scientific papers | https://github.com/Sarmentor/POS-Tagging-Wordcloud-with-R (access date 20 February 2021) | Yes | Yes |
| Kaggle | COVID-19 Predictors | 28 demographic features about 96 countries (infection rate, number of ICU beds, death rate, etc) | https://www.kaggle.com/nightranger77/covid19-demographic-predictors (access date 20 February 2021) | Yes | Yes |
| Kaggle | COVID-19 country info | Include information about different countries, such as death rate, infection rate, and number of rapid tests | https://www.kaggle.com/koryto/countryinfo (access date 20 February 2021) | Yes | No |
| Kaggle | Coronavirus (COVID-19) Tweets | 500,000 Tweets of users write the following hashtags: #coronavirus, #covid_19 #coronavirusoutbreak, #coronavirusPandemic, #covid19 | https://www.kaggle.com/smid80/coronavirus-covid19-tweets (access date 20 February 2021) | Yes | Yes |
| [75] | COVID-19 Multilanguage Tweets Dataset | 1200 M tweets collected using keywords related to COVID-19 | https://sites.lafayette.edu/lopezbec/projects/covid-19-multilanguage-tweets-dataset/ (access date 20 February 2021) | Yes | Yes |
| [76] | COVID-19 Twitter Dataset | 237 million tweets extracted from Twitter posts that mentioned “COVID” as a word or hashtag (e.g., COVID-19, COVID19) | https://dataverse.scholarsportal.info/dataset.xhtml?persistentId=doi:10.5683/SP2/PXF2CU (access date 20 February 2021) | yes | Yes |
| CDCP | Text data | Patient symptoms and report health status in | https://www.cdc.gov/coronavirus/2019-ncov/index.html https://www.coronavirus.gov/ (access date 20 February 2021) | Yes | Yes |
| NCBI | Genome data | Viral protein sequence | https://www.ncbi.nlm.nih.gov/genbank/sars-cov-2-seqs/ (access date 20 February 2021) | Yes | Yes |
| GISAID | Genome data | Viral protein sequence | https://www.gisaid.org/ (access date 20 February 2021) | Yes | Yes |
| GC | Genome data | Viral protein sequence | https://db.cngb.org/datamart/disease/DATAdis19/ (access date 20 February 2021) | Yes | Yes |
| EBI | Genome data | Viral structure, RNA, and protein sequence | https://www.covid19dataportal.org/ (access date 20 February 2021) | Yes | Yes |
| (NCBI). | Genome data | Viral protein sequence | https://registry.opendata.aws/ncbi-covid-19/ (access date 20 February 2021) | Yes | Yes |
| Zeng’s | Case reports | Reports on 20 projects, 16 report | http://open-source-covid-19.weileizeng.com/ (access date 20 February 2021) | Yes | Yes |
Publisher’s Note: MDPI stays neutral with regard to jurisdictional claims in published maps and institutional affiliations. |
© 2021 by the authors. Licensee MDPI, Basel, Switzerland. This article is an open access article distributed under the terms and conditions of the Creative Commons Attribution (CC BY) license (https://creativecommons.org/licenses/by/4.0/).
Share and Cite
El-Rashidy, N.; Abdelrazik, S.; Abuhmed, T.; Amer, E.; Ali, F.; Hu, J.-W.; El-Sappagh, S. Comprehensive Survey of Using Machine Learning in the COVID-19 Pandemic. Diagnostics 2021, 11, 1155. https://doi.org/10.3390/diagnostics11071155
El-Rashidy N, Abdelrazik S, Abuhmed T, Amer E, Ali F, Hu J-W, El-Sappagh S. Comprehensive Survey of Using Machine Learning in the COVID-19 Pandemic. Diagnostics. 2021; 11(7):1155. https://doi.org/10.3390/diagnostics11071155
Chicago/Turabian StyleEl-Rashidy, Nora, Samir Abdelrazik, Tamer Abuhmed, Eslam Amer, Farman Ali, Jong-Wan Hu, and Shaker El-Sappagh. 2021. "Comprehensive Survey of Using Machine Learning in the COVID-19 Pandemic" Diagnostics 11, no. 7: 1155. https://doi.org/10.3390/diagnostics11071155
APA StyleEl-Rashidy, N., Abdelrazik, S., Abuhmed, T., Amer, E., Ali, F., Hu, J.-W., & El-Sappagh, S. (2021). Comprehensive Survey of Using Machine Learning in the COVID-19 Pandemic. Diagnostics, 11(7), 1155. https://doi.org/10.3390/diagnostics11071155